. . Highway - ERIC - Education Resources … the riovernor's Highway Safety Drogra-. 0 ti.1 ABSTRACT...
103
. DOCUMENT RESUME . E4 ED 126 231 CB 005 991 . , . AUTHOR McMichael, Judith TITLE School Bus Accidents and Diiver Age. . INSTITUTION North Carolina Univ., Chapel Hill. Highway Safety Rdsearch Centel. . . ., )'. SPONS.AGENCY GOyernor's Highway Safety Program Office, Raleigh, N.C. , r . PUB DATE' Dec 74" . . NOTE 103p.; Appendices A, B, C, E will not reproduce well inmicrofiche due- to small 'type EDRS PRICE MT-$0.83 HC -$6.G1 Plus Postage. aFSCR2ftCRS *Age Differences; *Age Groups; Bus Trahsportation; *Coiparative Analysis; Motor Vehicles; Participant Characteristics; Performance Factors; Questionnaires; *School Buses; *Traffic Accidents; Youth IDENTIFIEES *Driver Performance; North Carolina ABSTRACT' The study examines the rates and types of school bus accidents according to the age of the school bus driver. Accident rates in NOrth Carolina for the school year 1971-72 were analyzed using three sources of data: accident reports, driver and mileage data, and questionnaires administered to a. sample of school bus drivers. Data were obtained on 10,508 drivers and an annual mileage of 74,110,890 miles. Results were analyzed statistically in the areas of: accident per driver age group, accident rates per million vehicle "miles, accident severity, report categories, injury accidenisi 'injuries by passenger miles, acciident type, violations, location of accidtnt, time of accident, weaaerand road conditions, driver experience, the other driver, and driver characteristics. Findings did not show a simple a4errelated curve. Student drivers (age 16 through 20 years) had a highei accident rate than adult drivers (age 21 and over) with 1617tiar olds having the highest rate and 20-year olds the second highest. The final-67 pages of the document contain 44 tables, graphs, a two-page.bibliogragy, and eight appendixes (simple traffic accident and school bus_accident reports, a sample school bus driver questionnaire, and supplemental statistical information on bus drivers). (Author/BP) . :*********************************************************************# Document's acquired by ERIC include many informal unpublished * materials not available froi other sources. ERIC makes every effort * * to, obtain the bett copy availb.ble,. Nevertheless, items 'of marginal * * reproducibility are often encountered and this affects the quality * ,* ofrthe microfiche and hardcopy reproductions ERIC makes available * * via the ERIC Document Reproduction Service (EDRS). EDRS is not ' * responsible fcr the quality of the original document. Reproductions * * supplied by EDRS are the best that' can be made' from 'the original. ********************************4!*************************************
Transcript of . . Highway - ERIC - Education Resources … the riovernor's Highway Safety Drogra-. 0 ti.1 ABSTRACT...
.
DOCUMENT RESUME
. E4 ED 126 231 CB 005 991. ,
. AUTHOR McMichael, JudithTITLE School Bus Accidents and Diiver Age. .
INSTITUTION North Carolina Univ., Chapel Hill. Highway SafetyRdsearch Centel. . . .,
)'.
SPONS.AGENCY GOyernor's Highway Safety Program Office, Raleigh,N.C. , r .
PUB DATE' Dec 74" . .
NOTE 103p.; Appendices A, B, C, E will not reproduce wellinmicrofiche due- to small 'type
EDRS PRICE MT-$0.83 HC -$6.G1 Plus Postage.aFSCR2ftCRS *Age Differences; *Age Groups; Bus Trahsportation;
*Coiparative Analysis; Motor Vehicles; ParticipantCharacteristics; Performance Factors; Questionnaires;*School Buses; *Traffic Accidents; Youth
IDENTIFIEES *Driver Performance; North Carolina
ABSTRACT'The study examines the rates and types of school bus
accidents according to the age of the school bus driver. Accidentrates in NOrth Carolina for the school year 1971-72 were analyzedusing three sources of data: accident reports, driver and mileagedata, and questionnaires administered to a. sample of school busdrivers. Data were obtained on 10,508 drivers and an annual mileageof 74,110,890 miles. Results were analyzed statistically in the areasof: accident per driver age group, accident rates per million vehicle"miles, accident severity, report categories, injury accidenisi'injuries by passenger miles, acciident type, violations, location ofaccidtnt, time of accident, weaaerand road conditions, driverexperience, the other driver, and driver characteristics. Findingsdid not show a simple a4errelated curve. Student drivers (age 16through 20 years) had a highei accident rate than adult drivers (age21 and over) with 1617tiar olds having the highest rate and 20-yearolds the second highest. The final-67 pages of the document contain44 tables, graphs, a two-page.bibliogragy, and eight appendixes(simple traffic accident and school bus_accident reports, a sampleschool bus driver questionnaire, and supplemental statisticalinformation on bus drivers). (Author/BP)
. :*********************************************************************#Document's acquired by ERIC include many informal unpublished
* materials not available froi other sources. ERIC makes every effort ** to, obtain the bett copy availb.ble,. Nevertheless, items 'of marginal ** reproducibility are often encountered and this affects the quality *
,* ofrthe microfiche and hardcopy reproductions ERIC makes available ** via the ERIC Document Reproduction Service (EDRS). EDRS is not
'
* responsible fcr the quality of the original document. Reproductions ** supplied by EDRS are the best that' can be made' from 'the original.********************************4!*************************************
) Ccto
0'01240
4
Y
...
The UNC Highway Safety. Research Center wascrested' by an act of the 1965 North CarolinaGeneral Assembly A three-point mandate Issued
by the Governor authorized HSRC to 1) *valuate the stateshighway safety programs. 2) conduct research. and 3) Instructand train other working professionals in highway safety,
2
School Bus Accidents
and Driver Age "-
Judith McMichael
4
4
14
University of North( CarolinaHighway Safety Research Center
Chapel Hill, North Carolina
Dec ember 1974
.
US DEPARTMENTOmE4t1mEOUCApON F. WELFRE .NATIONAL INSTI,./Tt OF
E DUCA T ION
'., 5 DOCUMENT is.5, HEN RERRoDuCED EXACTLY S RECE,VED r *Om'.E PERSON ORORGAN.ZAT,ONORIOIN4T-NG ' PO,NTS0c .,,Ew OR OPINIONSSTE0 00 NOT NecessRLy REPRE-SENT occ,c.m. NATrONAL NST.TuTE orE0t,CAT,9N DOS, T,ON OR POVEY
..,

ti
F.
This project was supportedDJ the riovernor's HighwaySafety Drogra-.
0
ti
.1
ABSTRACT
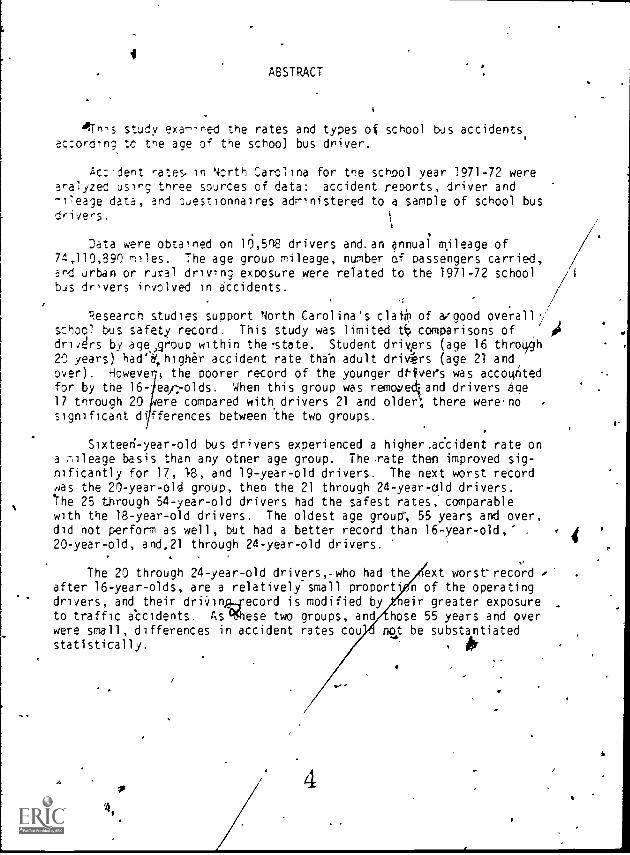
47n,s study examined the rates and types ol school bus accidentsaccording tc tne ace of the school bus driver.
4co.dent rates in North Carolina for the school year 1971-72 wereanalyzed using three sources of data: accident reports, driver and-ileage data, and oJestionnaires administered to a sample of school busdrivers.
Data were obtained on l0,5ne drivers and.an annual mileage of74,110,890 miles. The age group mileage, number of passengers carried,and urban or rural driving exposure were related to the 1971-72 school //I
bus drivers involved in accidents.
//Research studies support North Carolina's Oa* of aigood overall'
school bus safety record. This study was limited comparisons ofdrid.cirs by age.group within the -state. Student drivers (age 16 thro9gh20 years) had'e,higher accident rate tha'n adult drivers (age 21 andover). However4 the poorer record of the younger dtivers was accountedfor by the 16-'ear;olds. When this group was removediand drivers age17 through 20 ere compared with drivers 21 and older", there werenosignificant differences between the two groups.
Sixteeri-year-old bus drivers experienced a higher.aecident rate ona mileage basis than any other age group. The .rate then improved sig-nificantly for 17, 18, and 19-year-old drivers. The next worst recordwas the 20-year-old group, then the 21 through 24-year-old drivers.the 25 through 54-year-old drivers had the safest rates, comparablewith the 18-year-old drivers. The oldest age group, 55 years and over,did not perform as well, but had a better record than 16-year-old,' ,
20-year-old, and,21 through 24-year-old drivers.
The 20 through 24-year-old drivers,-who had the ext worst-recordafter 16-year-olds, are a relatively small proporti n of the operatingdrivers, and their driVin.grrecord is modified by neir greater exposure -
to traffic accidents. AsocChese two groups, and hose 55 years and overwere small, differences in accident rates cou i not be substantiatedstatistically.
4
4
4-
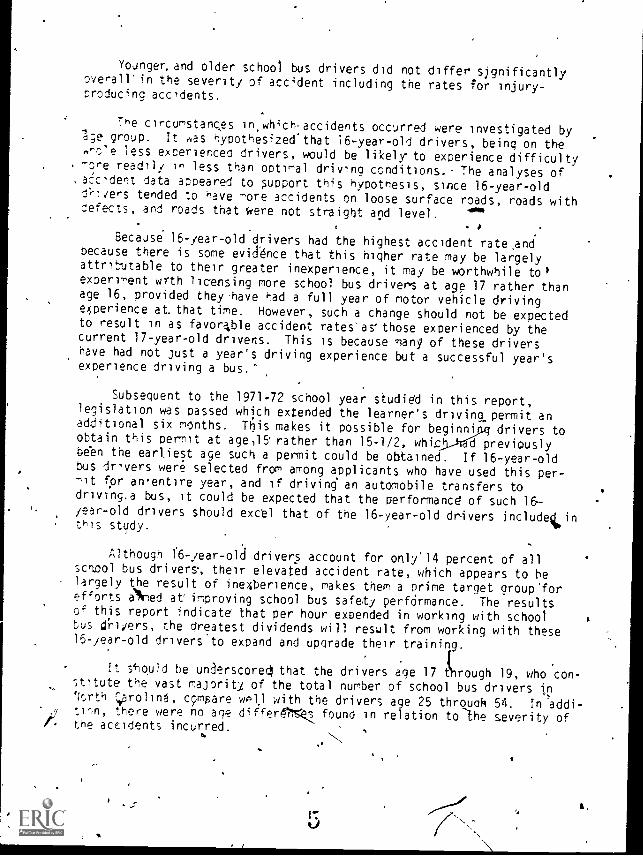
Younger. and older school bus drivers did not differ significantlyoverall' in the severity of accident including the rates for injury-producing accidents.
The circumstances inwhichaccidents occurred were investigated byage group. It was hyoothesized'that 16-year-old drivers, being on thewhole less experienced drivers, would be likely to experience difficulty-ore readily in less than optimal drivind conditions. The analyses ofaccident data appeared to support this hyootnesis, since 16-year-oldeaters tended to have -ore accidents on loose surface roads, roads withdefects, and roads that were not straight and level.
.
BecaJse 16-year-old drivers had the highest accident rate,andbecause there is some evidence that this higher rate may be largelyattributable to their greater inexperience, it may be worthwhile toexperiment wrth licensing more school bus drivers at age 17 rather thanage 16, provided they have had a full year of motor vehicle drivingexperience at. that time. However, such a change should not be expectedto result in as favor4ble accident
rates'as.those experienced by thecurrent 17- year -old drivers. This is because 7iany of these drivershave had not just a year's driving experience but a successful year'sexperience driving a bus."
Subsequent to the 1971-72 school year studied in this report,legislation was Passed which extended the learner's driving. permit anadditional-six months. This makes it possible for beginniaq drivers toobtain this permit at age,15' rather than 15-1/2, whi.0-hla previouslybeen the earliest age such a permit could be obtained. If 16-year-oldbus drivers were selected from among applicants who have used this per-mit for an entire year, and if driving an automobile transfers todriving.a bus, it could be expected that the performance of such l6.-year -old drivers should excel that of the 16-year-old drivers includeinthis study.
Although 16-year-old drivers account for only'14 percent of allschool bus drivers., their elevated accident rate, which appears to helargely the result of inexperience, makes them a prime target group'forefforts Ned at improving school bus safety perfdrmance. The resultsof this report indicate that per hour expended in working with schoolbus B'ri'ers, the greatest dividends will result from working with these16-year-old drivers to expand and upgrade their training.
It should he unaerscorel that the drivers age 17 krough 19, who con-stitute the vast majority of the total number of school bus drivers initcrth carolin6, compare wP11 with the drivers age 25 throudh 54. In addi-",ti n, there were no age differs found in relation to-the severity ofthe accidents incurred. ,"
a.
TABLE OF CONTENTS
LIST OF TABLES
LIST OF FIGURES
ACKNOWLEDGMENTS
Page
iv
vii
viii
INTRODUCTION 1
METHOD 4
Crasth Records 4
Mileage Information 5
School Bus Quetionnai,re 6
Student/Adult Driver Designation
Older Drivers 7
Statisticalethod ... ... . ./.
RESULTS 8
Accidents per DriverAge'Grour - 8
Accident Rates per MilPion VehicleMiles
Accident SeveritySevertty ,
Report categories
. 9
10
Injury accidents .
a
10
Injuries bi passenger miles 1,1
Accident Type 12
Violations 12
0
TABLE ,OF CONTENTS (continued)
Page
Location of the Accident 13
Time of the Accident 13
Weather and Road Conditions 14
Driver Experience 15
The other driver 15
Driver Characteristics 16
DISCUSSION AND SUMMARY 17
CONCLUSIONS AND RECOMM T'IONS 19
REFERENCES 66
APPENDIX ATraffic Accident Report 69
APPENDIX BSchool Bus Accident Report 73
APPENDIX CAnnual Pupil Transportation Report 77(APTR)
APPENDIX D
Questionnaire to school bus drivers . .
APPENDIX E.Map of counties in questionnairesample 85
APPENDIX F-
Number of accidents and total num-ber ofdrivers in each age group . .
ii
87

TABLE OF CONTENTS (continued)
APPENDIX G -
Statistical explanation of Chi-square used (written bp Dr. YosefHochberg)
APPENDIX HNutter of fatalities and injuries ,
in each accident bus driver agegroup
4.
8.
1T1
Page
89
93
'l*
S.
LIST Of TABLES
Tabl Page
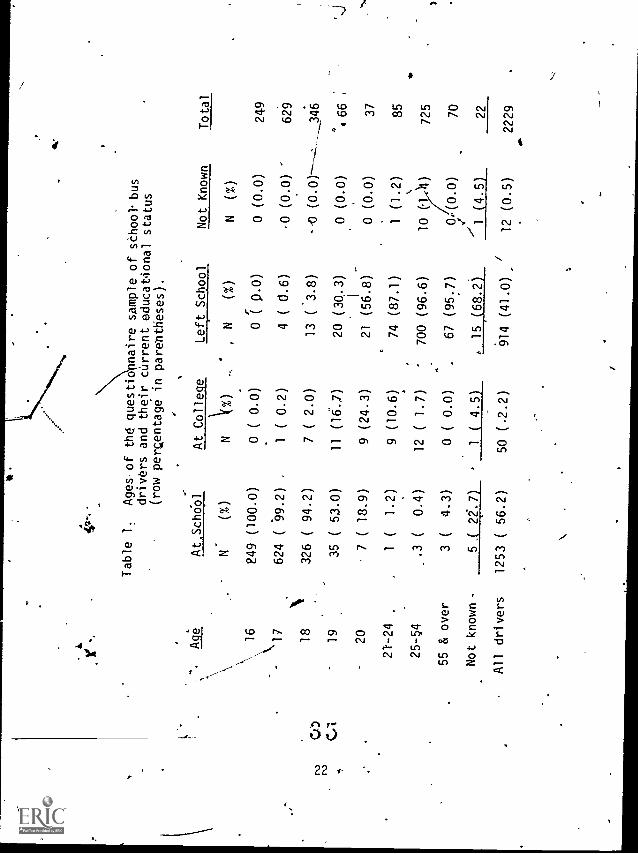
1: Ages of the questionnaire sample of school bus driversand their current educational_s_tatus 22
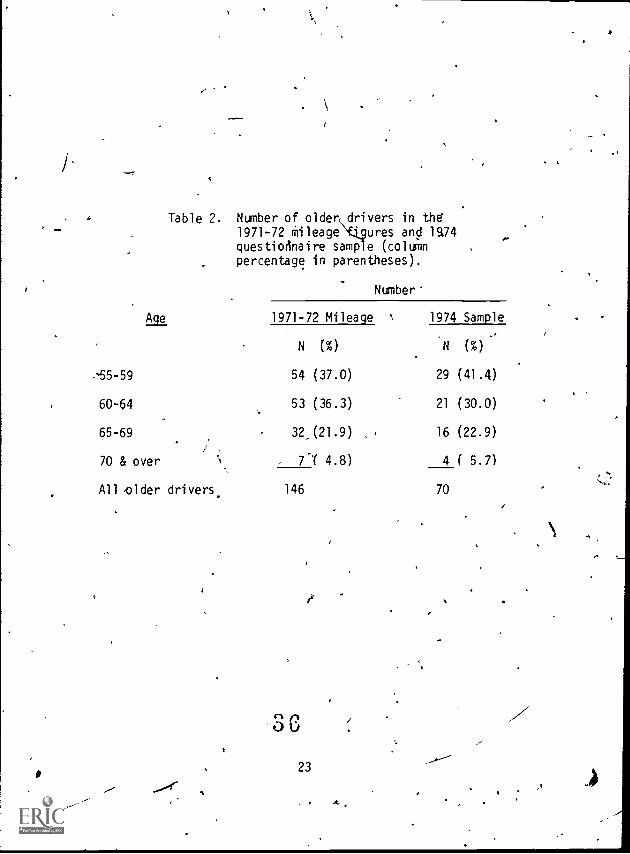
2. 'Number of older drivers in the 1971-72 mileage figuresand the 1974 questionnaire sample 23
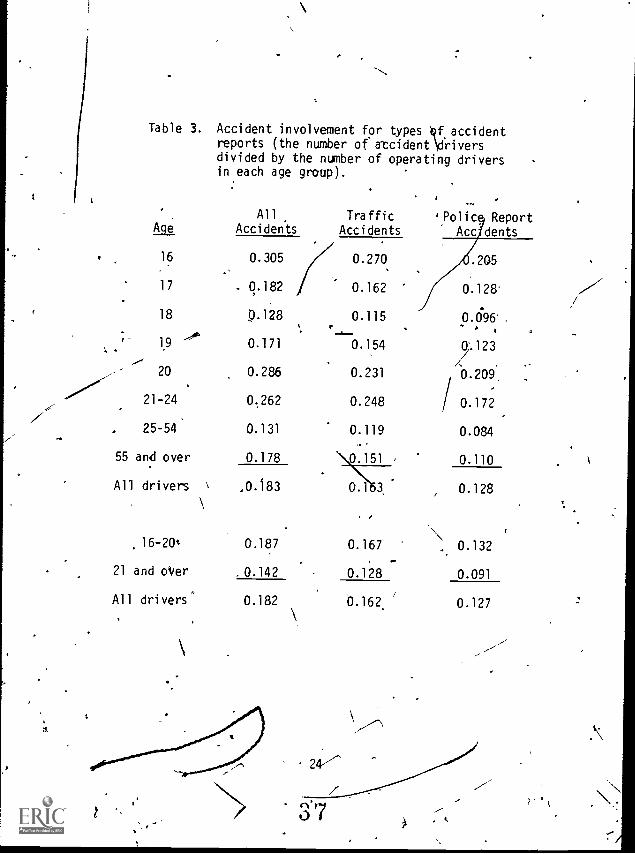
3. Accident involvement for types of accident reports bydriver age groups 24
4. Yearly mileage by operating driver age groups 25
5. Days driven annually by operating driver age groups 26
6., Daily mileage by operating driver age groups 27
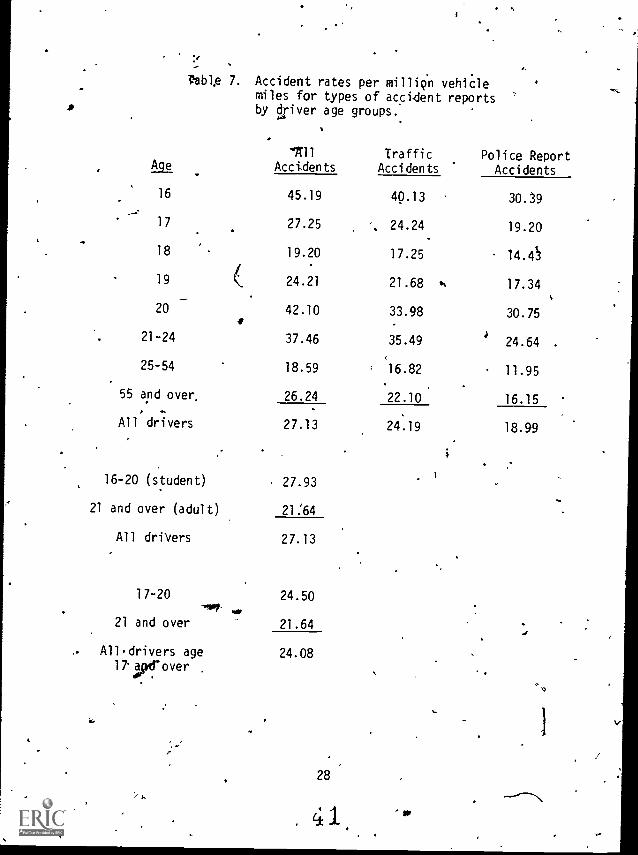
7. A(ccident rates per million 'vehicle mileiS for typesof accident reports by driver age groups 28
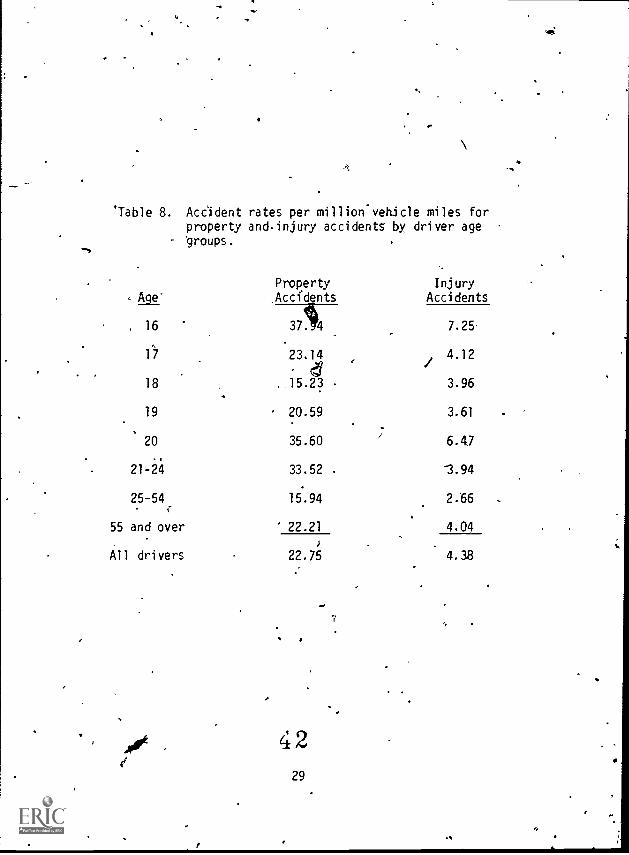
8. Acc?dent ates per million vehicle miles fOr propertyand injury accidents by driver age,groups . 29
9, Average daily mileage for male and female drivers in thequestionnaire sample of age groups 30
10. Traffic and non-traffic accidents by accident driverage, groups
11. Type of report made on the accident by accident driverage groups
31
32
12.' Injury and property accidents by accident driver agegroups . % , . . 33
...
13. Cost per accident by accident driver age groups , 34
14. Cost of accident damage for drivers 21 years and overby -sex , 35
e)
iv
0,41
LIST OF TABLES (continued),
Table Page
15. Driver injury by accident drivers 16-20 and 21 and over . 36.
16. Pedestrians struck by type of vehicle by accident schoolbus drivers 16-20 and 21 and over 36
17. Injury or fatal accidents and the numbers killed orinjured by,driver age groups 37 .
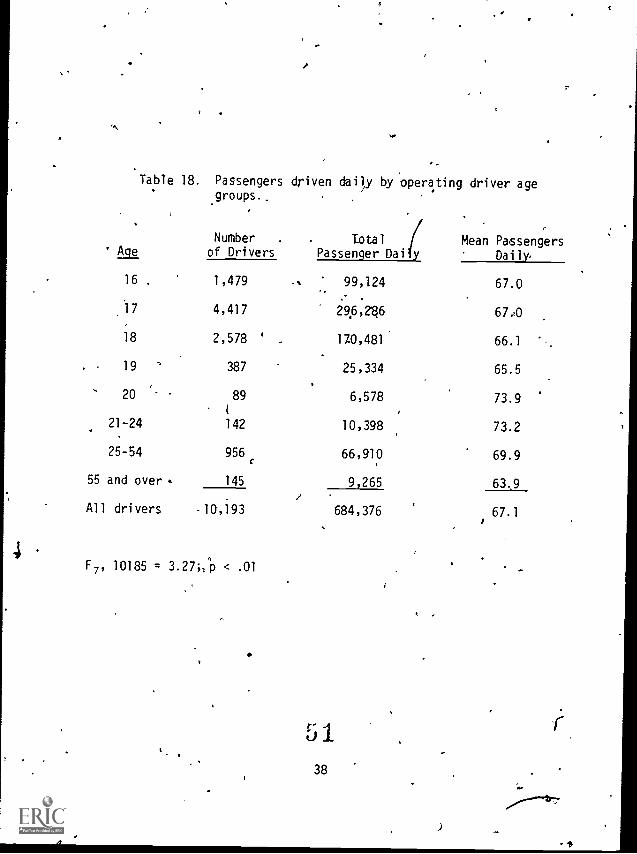
18. Passengers driven daily by operating driver age groups . 38
)9. Elementary school passengers driven daily by operating.driver age groups 39
20. Direction of-the .collision by accident driver age groups 40
21. Accident type by accident drivers 16-20 and 21 and over . 41:
22. Type of crash by driver age 42
23. Single or multi- vehicle collision by accident driverage groups 43
24. Vehicle condition reported for all school busesin accidents 44
25. Vehicle condition by accident drivers 16-20 and 21 andover 44
26. Drivers charged with violations by accident driver agegroups 45
27. Number of violations by accident drivers 16-20 and 2and over 46
28. Urban or rural exjiosure by operating driver age groups . 47
29. Highway class by 4cident driver age groups 48..
10V
LIST OF TABLES (co'ntinued)
Table
30.
31.
32.
33.
Locality by accident driver age groups
Intersection or driveway by accident driver age groups .
Percent of crashes experienced by season of"the gear foraccident driver age groups
Day of week by accident drivers
Page
49
50.
51
52
34. Percent of crashes experienced by time of day for accident
35.
'driver age groups
Road surface by young accident drivers k
53
54
36. Road defects by young accident drivers 54
37. Road conditions by accident drivers 16-20 and 21 and over . 55
38. Weather by accident drivers 16-20 a'nd 21 and over 55
39. Road character by young accident driversr
56
40. Driving experience for accident (A) and questionnaire (Q4groups by driver age 57
41. Other driver age in accidents with school bM.drjeVers. . 58.
42. Occupations of the schoo.1 bus drivers over 20 in the- questionnaire sample 59
43. Occupations of the younger drivers not attending schoolin the questionnaire sample 60
44. Oades of student school bus driver's in the questionnairesample 61
vi

LIST OF FIGURES
Figures Page
1. An "accident" model (from J.A. Waller, 1967). 62
632. Accident involvement rates by driver age groups . .
3. Accident rates per million vehicle miles for types ofaccident reports by driver age groups , 64
Accident rates per iillion vehicle miles for injuryand property damage only accidents by driver age
oups 65, 4
vii
12
a

3
II
ACKNOWLEDGMENTS
I wish to express appreciation to- a number of people whose-assis-tance greatly contributed to this report. '
Mr. D. J."Dark and Mr.'L. W. Alexander in the School TransportationDivision'of t19e north Carolina State.Board of Education; and Mr. JoeRegister and his staff in the North Carolina Department of Motor'Vehicles, supplied the bulk of the source material. County school offi-cials'Were most helpful in distributing and returning the school bus;driver questionnaires.
Dr."Pdtricia F. Waller provided invaluable guidance and assistancg. throughout the preparation of,the report.
Stattstical consultation was provided by Dr. Yosef HOchberg.
Mr: R. D. Johnson and Ms. Debbie Shaver were of great assistapcein the data preparation and handling of the computer programming. T"4.
Dr. Patricia Barry and Dr. Andrew Sella reviewed and'helpfufilyedited the final report.-
Ms.,EllenlOverman deciphe4,esi and typed the report. -
Mr. Worth McDonald and Mr. 0. D. Griffin of the Department of Motor*,ehieles, Traffic Safety Education Division, prOvided material and Valu-able suggestions.
r viii
1 3
10,

I. INTRODUCTION
Throughout the school'huses are safer on a passenger rnlebasis than private passenger vehicles, and safer than most forms ofpublic and commercial transportation (Hull, 1968). However, the fata-lity rate per million passenger miles, Over a five.year period from1965-69, gradually increased for commercial and school buses, while thefatality rate for both automobiles And airplanes tended to. decline(Siegel and Nahum, 1971). The decreasing-rate-of automobile fatalitiesmay be,attributed in part to improved_safety devices withiii the cal-, butensuring a safer environment within bilses has laved.pehind. The safety .
record of school transportation is a matter for continuing evaluation,as this, is the major method of traveling-to and from school for large .
numbe s of children. .-..
Most studies of school bus safety records have focused on the busdr4ver, because of the prSctice of hiring teenage and elderly drivers
. despite the poor driving record of these age groups in the general pop-ulation. The practice has been partly dictated by the low wages paid todrivers (in North Caroliriai$2.07 per hour state wages in 1971-72,although some local school boards add subsidies). Furthermore, the lim-ited number of hours and the fact-that they are split in two parts limitthe attractiveness of the job.
North Carolina has a high proportion of young schbol bus drivers-(87 pet-Cent tinder'21 years of age in'1971-72). Like the rest of thecountry, in North Carolina the driving group Onder 20 years has a poorer4veralI driving record than -other ,age groups in the driving populationWaller, 1970). But public schooFefficials believe that a high propor-tion of student driwers is desirable. They report that it enables them"to be more selective in employing bus operators, require more.intensiveoperator training, maintain an adeqoatenymber of qualified operators,
/ exercise close &upervision over the pupil transportation system andmaintain a good safety record at a reasonable cost" (North CarolinaState Department of Public Instruction). Research studies support NorthCarolina's claim of a good school.bus safety record relative to that ofother states, despite the considerablediffitulties of making interstate
secomparisons bad on differing accident reporting criteria 1969;
Hull, 1969; National ComMission on Safety EJucation, 1967). This safetyrecord it attributed to good driver selection, training and supervision.
Comparing the safety records of younger and older school bus dri-. vers has been more problematical. Higher accident rates of the young
ti
4
and elderly drivers in the ggneral &lying population have been advanced, as an argument for employing school bus drivers between 25 and 60 yearsof age (Charles & Shelness, 1972). There is evidence from some states
- that elderly drivers, and to:a lesser extent drivers under 21 years,have higher school bus accident rates, however driver exposure Was notobtained (Hull, 1968).
'Another study (Promisel, 19.69) supports the poorer record of dri-vers over 63 years, but otherwise.lkelates'the age of school bus driversto accidents in a complex fashion, with age by, itself being incompleteas a predictor of accident rates. For tale drivers, the,lp through 18year group had a better record than the 18 L through 21 year-range. The21- year -.olds and those 63 years and over had the worst records. Per-fprmance below 21 was generally as good as that above it. ,Female dri-vers-showed a general improvement from 16 through 25, with the 16-yearpoint no worse than the 35-year point. After 25, female records wereworse. However, there was no statistically significant difference be-tween overa)1 accident rates for male and female drivers.
A study ,that examined school bus driving performance in relationto age in North Carolina (Campbell,.1964) found that while students hada somewhat higher accident rate, there was not a ttatistically signift-cant difference. Where accidents did occur, students were more likely.to be following(too closely than adult bus drivers. There were indi-Cations (although not statistically significant) that student accidents, .
moreso than adult, were associated with situations in which the drivingtask becomes more demanding, such as: (1) on curved road, (2) in winter,(3) on the homeward-bound leg of the trip'(driver fatigba, boisterousstudents, darkness in winter days).
.
Campbell "s study, however, compared dhvers age 20 and younger withdriversage 21 and older. There was no attempt made to further analyzethe younger drivers by single year interOls. Because the learningcurve i&_changOng most rapidly duFcing these beginning years of driving,this investig6fion focuses more closelyOn the year .to year changes inthe drivers below age 21.
Another reason for taking a second look at North Cirolina schoolbus drivers by age is 'that the Division of Motor Vehic4s' driver improve--
.4ment representative's, who certify the 'school bus drivers, are dividedin their opinion as to whether students or adults make better drivers.Some.prefer students, feeling that one_has the pick of a wide range ofcapability, including the future Professionals of our society.' Othersfeel that the greeter maturity of thE adult driver more than outweighsthe range of selection afforded by using student drivers. There appears
lv2
to be general agreement .that tne students on the whole are no longer soselect a group as was the case several years ago. The reasons given forthis are, first, that mail), of tne best students are now involved inextra-curricular activities and thus not a able for driving a crus. A:sesond)!Jason given is tna: with tne i crease in 'nigh
SVn015 t'e SCn001 orincioal, who makes the initial selection of scnooltra,h.'ees, does not know tne students as well as was once the case.
tre orirrtoal was likely to nave known the student and hissite tne st,,dent.was a small child. Now the selections ve made
Dr tre basis of -.Jcn more limited information. Therefore it was deemedadvisaole tcrtake another look end a more Intensive look at school busdrivers in North Carolina.
Thi's investigation made use'of a model (Waller, 1967) which.iilus-S,rates th..,1 imbalance between human capabilities and the demands of a
system and describes three general types of situations in Which humanoerformance fails to meet the demands'of the task. The first situationiinvolves cataclysric huma failure, such as a sudden stroke, while per-formi-ng a task thaf is no particularly demanding. The second situation,/in which failure:occurs be ause of the overwhelming demands of the task, /
Tay de exemplified by. an a erage driver whp suddenly has a blowout on abusy nighway. There is ev dente, however, that a third situation maybe rfuch'r more cormon. This is a simulta'neous decrease in perfo'rmance and
.increase in task demand (see Figure 1, o. 62. ,It should' be noted thatall figures and tables appear at the end of the text). An example mightbe the school bus driver's'atteition being diverted from the-road to thepassenger (decrement in driver )erformance), thereby causing the vehicleto run off the shoulder of a narrow gravel road (increase task
demands), and to scrape a post (the "accident"). According to thismodel, it might be anticipated that younger drivers with less experienceand thus a lower overall level of driver, performance may be less able tocope with more complex driving situations, such as 06or.weather condi-tions (increased task complexi,ty), and thus would experience a disro-bortionate number'of their Crashes under such demanding circumstances.
. This hypothesis will.be examined:in the analysis. .
1 0'
3
is;
Ir. METHOD
Three sources of data were used: crash records, mile e records,and questionnaire data from school bus drivers.
C.csh Records
North Carolina requires reports on all school bus c
or not they occur on a public highway, ancreven if the' da
Crash reporting cantbe assumed to be fairly thorough andbecause: (1) the school bbs driver must report eath acciprincipals'are responsible for supervising school transp(3) drivers are instructed to have each accident investiofficer; and (4) the State Board of Education and the DiVehicles exchange crash information to.detect any discre
shes, whetherge is slight.
&liableent; (2) schooltation;
ted by a policeision of Motorancies.
The report forms were obtained from two sources: ( )-the TrafficAccident Report (see Appendik A), which is'used for the ore seriousaccidents where personal injury and/or S1001 worth of p eperty damage
...-
has occurred. The State Highway Patrol or local police investigate andfile the report with the Accident Recbrds Section of th North CarolinaDivision of Motor Vehicles; (2) the School Bus 4ccident,Repart (seeAppendix 8) which is completed by school officials for very accident.Copies are forwarded to the State Bpard of Education ark the Divisionof Motor Vehicles. The Division of Motor Vehicles disc rds the
..
School Bus Accident'Report where it duplicates Traffic ccident-Reports,and, using a standard format, transfers the.informatio onto punch cardsand computer tape.
'
'.1* . .
The computer punch cards and tape were obtained.fOr all school bus,
crashes from July 1, 1971 through June 30, 1972. In order to study allschool bus drivers; a new record was made for the second driver inCrashes which involved two' school buses,'which changed the format-fromao 'accident oriented to a driver oriented record.
Because crashes were to be related to mileage to, obtain accidentrates, 25 crashes were omitted which involved'private or commercialbuses. Mileage could not be obtained in these cases because the State,Board of Education keeps data only on state funded and operated school'transportation.
iln Jut, 1972, the pkopeiLty damage cz..cetion was mixed to $200.
17
This data source yielded 1971 records on school bus drivers
involved in accidents in 1971-72. Of these drivers, age was available
for 1888 (96 percent).
Mileage Information
Mileage was needed to calculate exposure, i.e., miles driven for
eacn driver age group. As the state pays over 90 percent of the total
annual cost of school transportation (Markham, 1966), the State Boardof Education keeps information on the operation of school buses. The
Annual Pupil Transportation Report (APTR, see Appendix C), compiledfrom the school principals' monthly reports, gave passenger and mileageinformation by driver age. but not by name.
The report is ori.ented more to the number of buses than to the num-
ber of drivers. Consequently, care was taken not:to double-count the Narre driver. But when a new driver took over on a bus,.age information
was often not available. Total yearly mileage was based on, thetotal
daily route mileage multiplied by the number of operating days, plusextra' mileage, rather than on odometer readings.
For this study, a record was -set .up for each driver. The informa-
tion taken from theAPT Report included driver-age; county, mame of theschool, bus number, number of operating days, total mileage,for theschool year, and number ofelementary and high school pupils transported
daily.
addition, the schools were coded according to the grades taught.
t4in the Education Directory (North Carolina State Department of Public
Ins uctiorl) and ,a map, the schools were ,coded according to their urban
or ral locality.. The, cities were coded according to their population'rank in the 38 cities in Nor8 Carolina With populations over 10,000based on the 1970 census. (North Carolifia State Board of Health, 1972).
Data4 on exposure in some urban areas must be cautiously interpreted.Many city school units do not receivejptate transportation money becauseof two statutory limitations: neither" state eor local tloards of educa-
tion are required to providetfunds fbr'transportfing children who(1) live within 1-1/2 miles of the school or (2) live within the,sarre
municipality as the school (Markham, 1966),
Thereforerthe schools, mainly urban, who fund their own transpor-tation do not report mileage and driver data to the State Board of
Education. These include Fayetteville,. Salisbury,\Ashevillp, Statesville,
Raleigh, and Rocky Mount. Charlotte and Durham operate both a local and
state funded system.
5
The total mileage obtained for this study from the APTR forms was74,110,890. This differs by only three percent from the 76,602,955miles separately reported by the State Board of Education. The discrep-ancy is due to some errors in calculation on the APTR forms, and mileagenot reported A someCounty forms.
The number of drivers obtained was 10,508, as substitute driversand drivers on special mileage were included. These drivers, althoughnot included In the 10,430 drivers funded by the State Board of Educa-tion,, could have appeared in the accident reports. Ages were unknownfor 105 drivers, arid another 87 were described only as adult drivers,exact'age unknown. Therefore, detailed age group analyses were basedon 10,316 drivers, and analyses of the two age grqupS"16 through 20 "and "21 and over," were based on 10,403 drivers.
S4hool Bus Questionnaire
Existing reports supplied little information on the characteristicsof school ))us Irivers in North Carolina beyond their ages. A question-naire (seettApPendix D) was drawn up and pilot tested to.o0,tain moreinformation bh school bus drivers. More descriptive information wasdesired to provide characteristics to link with age group safety recordsfor a later study,tHoweVer, infOrmation from this questionnaire sample
I
was used in Os s dy, including passenger mileage, mileage by riversex, driving experience., and educational and occupatipnal status
.
A survey of all 10,43k school bus drivers in 100 counties was notfeasible. Among the 10,430 bus drivers, only 1,399 (13 percent) were
4 'adult drivers, and these ware spread over.90tounties. In order toobtain a sample size large.anough for statistical analysis, question-naire responses from a larqe proportion of the adult bus drivers wererequired. ,.
To reduce problems inthe seleCtion and distribution of question:.naires, Aole counties were sampled. This procedure also provided datafor ae'comparisons within counties. In order to obtain counties with.8 relatively large proportion of adult drivers, and to minimize the num-ber of counties surveyed, only counties with more than 10 adult driverswho comprised at least 20 percentJof the school buis drivers in thatcounty were selected. In order to increase the coastal and urban repre-sentatjor14 ad exception was made for New Hanover county with 24 adultsmaking up 19 percent of the total drivers. Although the urvey was forthe 1973-74 school year,,6eleCtion was based on tl'e avaija e 1971-72figures. This method yielded 28 counties, distributed throug ut themountain, piedmont, and cplstal regions (see Appendix E).-
r
6
t%
4
.4,
The questionnaires were returned by all but one of the 28 sample
counties. Jackson County received the forMs too late for the,last dri-
vers' meeting of the schoo) semester. An 80 percent return rate yielded
2229 questionnaires from 27 counties representing 21 percent of thetotal school bus drivers in the state and 63 percent of the adult dri-
vers. The name of the school was not completed on 30 questionnaires,and the driver's age was not provided on 22 forms. Ninety.percent of
the drivers had regular 'outes, 202 (9.1 percent) were substitute dri-vers, and 22 (?.0 percent) did not answer this questioh.
Student/Adult 'Driver Designation;
The State Board of nucation uses age 21 as a convenient dividingline to designate drivers as student or adult. In the questionnairesampl:a of school bus drivers in 27 counties in the 1973-74 school year,after age 18 the proportion of drivers who were school "students dropped
considerably. As can be seen in Table 1, only 53 percent of the'19-year-olds and 18.9 percent of the 20-year-olds were still attending high
school. The small number of drivers.over 20 years,who answered thatthey were attending school may 'have been taking claSses, or they may beschool employees who confused the intent of the question. These pro-
portions may got be exactly representative, of total drivers, but theydo demonstrate that it cannot be assumed that the 19 and 20-year-olddrivers, particularly, were all high school students and therefore sub-ject to the same superviision as the 16, 17, and 18-year-old drivers,
who are nearly all schoql students.
Older. Drivers
There were 146 drivers 55 years and over in'1971-72. The question-naire sample v(hich covered 63 percent of adult .drivers included 70 dri-
vers who were at least 55 years old (see Table 2). Thmileage datashowed no statistical difference among the, older drivers on their yearlymileage or the number of passengers they drove each day. Because the
numbers in the age 'group. were small, and the accident tape obtainedfrom the Department of Motor Vehicles coded these drivers only as an agegroup 55 and over, mileage could not be related to accidents for a moredetailed age analysis.
S4
Statistical Method.
The major statistical test used was the Chi-square, and resultswere accepted as significant at the 0.05 level. Analyses of variancehave been applied to differences among group means. (A statisticalexplanation of the Chi-square used in testing accident rates is includedin Appendix G.)
III. RESULTS
Accident per Driver Aqe Group.
The number of accidents for each age group was matched with thetotal number of drivers in each age group (see Appendix F).
An accident involvement rate (i.e., the number of accidentsdjwided by the number of drivers in each age grdup) was calculated for
1
three types of accidents. "All Accidents" are all the school bus acci-dents. "Traffic Accidents" are the accidents occurring on a publicroad. This category does not include those accidents which occurred onprivate grounds or in driveways (approximately 11 percent of_ all drivers'accidents in 1971-72). "Police Report Accidents" are the more seriousschool bus. accidents which are reported to and investigated by law enforce-ment'officers. These constituted 70 percent of total driver accidents.As can be seen in Table 3 and Figure 2, the age groups 16 years, 20 years,and 21 through 24 years, consistently had the highest rates for the threetypes of accident reports.
Data are presented on these three accident types in order to demon-strate the difficulties of interstate comparisons. _Different stateshave different criteria for reporting accidents. Any one of thesetypes of accident reports could be used as the standard. In addition,some states have a property damage criterion whereby school bus acci-dents are not reported when damages are below $100.
Accident Rates per Million Vehicle MilesA-
The number of accidents incurred by each driver age group is not avalid method of comparison because this figure does not take mileageexposure into account. The higher involvement rate of 16-year-old,
4
8
21
20-year-old, and 21 through 24-year-old drivers could be attributable totheir driving more miles and therefore being exposed to more accidentrisks.
Age group mileage was obtained from the APTR forms. Nineteen-year-old drivers had the highest mean yearly mileage (7152) and 18-year-oldsthe lowest (6732). An analysis of valiance showed statistically signi-ficant differences between the age grdups (see Table 4}. Nineteenyear;old drivers drove the most number of days, followed. by 18-year-olds. Twenty-year=olds drove the fewest days (see Table 5). Twenty-
year-olds and 21 through 24-year-olds drove the most daily mileage,while la-year-olds drove the least (see Table 6).
The accident rate used in this study is the number of accidents permillion vehicle miles. Tables 7 and 8 display accident rates for eachage group. When young drivers (age 16 through 20) were compared witholder drivers (age 21 and over); the accident rate of the younger dri-vers was found to be significantly higher. However, when the 16-year-old drivers were eliminated from the comparison, the remaining youngdrivers compared favorably with the older drivers, showing no signifi=cant differences between the two groups.
LdOcing'more closely at each age group by type of 'accident, thesame pattern emerges for all five categories of accident. Sixteen-year-old drivers have the highest accident rates, followed ,by twenty-year-olds and drivers 21 through 24-years old. The differenggs,between anage group and the average rate for all other age groups For "All Acci-dents" was statistically significant. The 16-year-olds had the worstrate, and the 18 and 25 through 54-year-old groups had the best rates.The 20, 21 through 24, and 55 years and over groups were too small toallow statistically significant rate differences (see Appendix G foran explanation of the statistical method).'
Prpmisel (1969) reported that male bus drivers had poorer recordsfrom age 18 through 28. Young female drivers did well but tended to doworse with increasing age. Our data peak for the 16-year-old and 20through 24-Year-old age groupings, but could not be analyzed for se0if-.ferences. There ere no consistent differences reported in,the mileageestimates of male and female driver questionnaire respondents, so theremay beno sex differences in miles driven (see Table 9).
Accident Severity
The data so far presented show that 16-year-olds had, the worst r
record, and that 18 and,25 through 54-year-olds had the best However,
9
22
1
the number of crashes does not take into account the severity-of theaccident. Therefore, crash severity and the number of injuries incurredwere analyzed by accident driver age groups.
Report categories.
Non-traffic accident's (i.e., crashes occurring off public roads,in driveways,.and on school grounds) were approximately 11 percent ofof all crashes, and the differences between age groups were not sig-nificant (see Table 10).
There was no significant difference between the driver age groupson the basis of whether the report was from the police or the school(see Table 11).
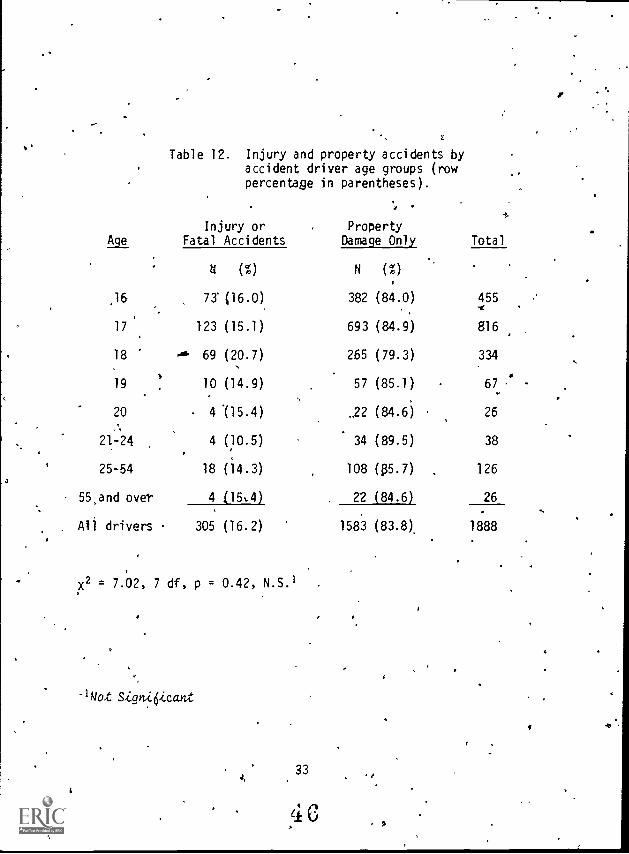
Only 16.2 percent of the.crashes of school bus driverswere injury producing', with no significant differences among agegroups (see Table 12).
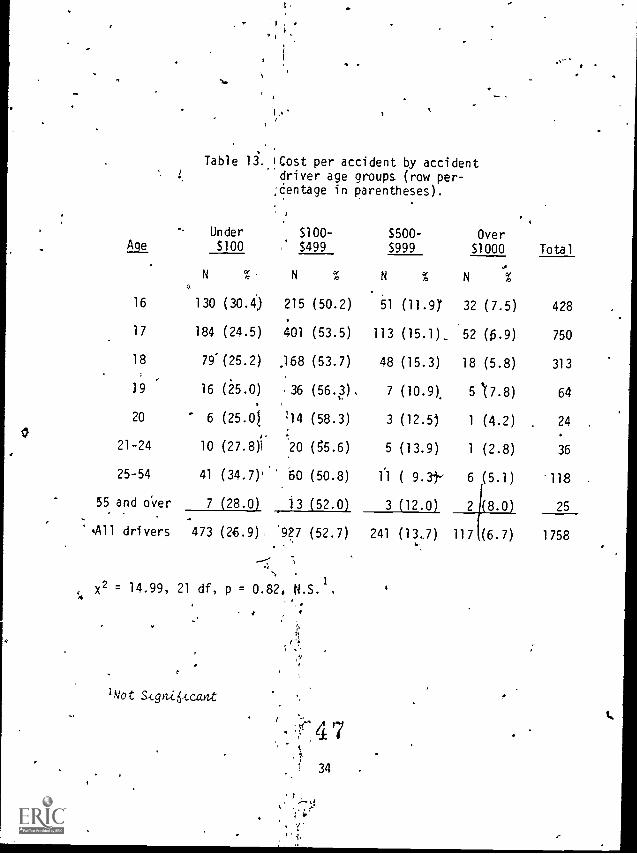
The amount of- damage done in each crash did not differ signifi-cantly-for the driver age groups (see Table 13).
Crash severity was examined according to the sex of the driver
//P
because some bus supervis9rs maintained that w men drivers had less .
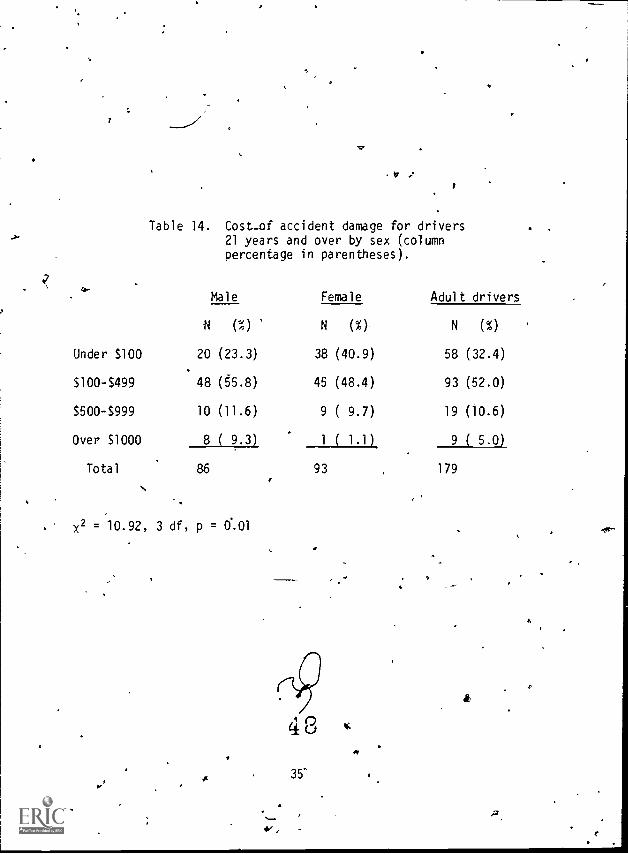
severe accident5. The proportion of injury of property accidents 4snot associated with driver sex. Looking at he amount of damage, hesex of the drivers age 16 through 20 years made no difference. Hove-ever, the female drivers over 20 did do less damage than the maledrivers over 20. Of the women, 89.3 percent had damages below $500,
' compared to 79.1 percent of men (see Table 14).'
Injury accidents.
The following findings are concerned with possible differences in
the number of injuries, another measure of the severity of the accident.
Table 12 showslhat only 16.2 percent of the crashes were injuryproducing and that there were no significant differences among the driverage groups. Drivers were injured in only 1.3 percent of the cases and`there was no significant difference between drivers age 16 through 20and those age 21 and over (see Table 15). T.he 24 drivers injured Oretoo few to do a full age group analysis. Driver injury was not a reli-able index of driver 'differences, because drivers were injured in-such asmall proportion of the cases.
NO,23.10
41
The age of the school bus driver did not 'appear to be a factorin the 19 cases where pedestrians were hit by a motor vehicle. The
small number did not allow a full age group analysis (see Table,16).In school transportation accidents, pedestrians, usually pupils enter-ing or leaving a school bus, are more likely to be struck by theschool bus (74 percent of cases) than by another motor vehicle.
The number and type of injuries are set out in Appendix H.Injuries are coded A, B, and C in decreasing order of severity. The
code is more exactly defined on the Traffic Accident Report/(see -
Appendix A). There were no large discrepancies among driver agegroups for the percentage oipdrivers in fatal or injury acciden4 orthe percentage of deaths or injuries sustained (see Table 17).
Injuries by passenger miles.
The number of injuries sustained is likely to be related to thenumber of passenger miles of buses. The number of people that couldbe injured in a collision depends on the number of passengers carried.Furthermore, a greater number of passengers getting on and off thebus increases the risk of pedestrian accidents. Therefore, a measureof exposure of passengers at risk was obtained by looking at thenumber of passengers carried.
The bus routes are planned to keep deadhead (empty bus, miles) toa minimum. The estimates from the bus driver questionnaire suggestedthat only 14.4 percent of daily mileage was driven with no passengerson board. Therefore,'vehicle miles can be used as a rough measure
to examine passenger injuries by passenger miles.. Drivers age 55
and over drove the lowest average number of passengers daily (63.9),while 20-year-old and 21 through 24-year-old drivers carried .thelargest numbers daily (73.9 and 73.2). While there is little differ-ence in the injury rate by driver age grow), 20 through 24-year-olddrivers were safely carrying more passengers daily (see Table 18).This would improve their safety record on an accident per passengermile basis.
Whether younger or older pupil passengers make the driver's taskmore difficult, and thus by their beheVior on the bus affect the riskof collision and injury (in the event of a collision), is a matter ofopinion. The 21 and 25 through 54-year-old drivers carry the largestaverage daily numberof elementary pupils per driver.(see Table 19).
11
*
Accident Type
To maintain and improve a safety program for school bus transporta-tion, the circumstances in which accidents occur must be studied. Thefollowing results concern the characteristics of accidents and the cir-cumstances in which they occur, by driver age.
There were no statistically significant differences among age groupsin the angle of collision (see Table 20).
Drivers 16 through 20 and 21 and over did not differ significantlyoverall in the type of accident, although the younger drivers were some-what more likely to-be involved in collisions involving another schoolbus. Most of the accident type categories were small- (see Table'21).
Data (HSRC, 1974) indicate that drivers under 20 years, especiallymales, are overrepresented in single automobile collisions, suggestingan inexperience factor. In this study, a comparison of single andmulti-vehicle collisions shows 19.1 percent of the accidents of 16-year-old drivers were single vehicle accidents compared to only 12.6 percentof 17 through 20-year-old driver accidents (see Table 22). Sixteen-
-, year-old,drivers had a higher proportion of single vehicle collisionsthan the other age groups. The proportion for the 17 through 20-year-old group was similar to that of the older age groups (see Table 23).
Of buses in crashes, defects were repoc(ted for only 2.5 percent,with defective brakes accounting for most (see Table 24). For 13.9percent of the'vehtcles, defects were either not known or not stated.There were no appreciable differences among the driver age groups onthe basis of vehicle condition (see Table 25).
Violatiops
Of the 1882 drivers for whom the age apd type of violations were..reported, the highest proportion with charges were'16,year-old drivers(61.5 percent) followed,by 17-year-olds (61.2 percent). Those withthe least proportion of drivers charged were the 25 through 54-year-olddrivers with 48.4 percent (ee Table 26).
School bus drivers had 1.128 violations charged against them, with11 drivers having twotolationsPeach. The most frequent charge made.against both the 16 t rough 20-year-old and-al and over drivers was"unsafe movement;" the next was "improper backing." The two groupsdid not differ greatly in the type of violations charged agairkst them,
12
2
dcs.
except that six percent of the violations for the 16 through 20 -year-old group were for "following'too closely'"(see Table 27).'4he numberof violations was too small to analyze violation type by age group.
Location of the AccidentA
The locality where people were doing most of their driving is asso-ciated with thgir exposure to risk of crash and affects the.number andtype.of crashes experienced. type of driving (urban vs. rural) for eachdriver was obtained by determining the locality of the supervising schoolas explained in the Methods section earlier.- The'20-year -old and'21through 24-year-old drives were employed significantly more than theothers" in cities. This maly;provide some explanation_ of tfieil. higher
accident rate for mileage driven, since they were exposed to more risksfrom traffic (see Table 28). The urban or rural areas in,which driversare employed 'also sugges6%that type of exposure accounts for the 20-year -old and 21 through 24- year-old drivers having more accidents thanthe other age groups on city streets (see Table 29).
The kind of locality (i.e., open country, residential, schoolgrounds, or business) in which accidents occur showed no statisticallysignificant differences Ar the age groups. However the small differ
ences do follow the pattern of the previous table, The 20-year-olds and21 through 24-year-olds had.-moreaccidents Ulan other age groups inresidential or industrial and business localities. Drivers 55 years andover had most accidents -(53.8 percent) in peen couotry(see Table 30).
The proportion of accidents occurring at intersections and drive-,ways showed no statistically significant differences among the agegroups.. The slightly higher proportion of 20-year-old and21 through 24-year -old drivers in accidents at intersections Gould be explained by thelarger amount of city driving they do, and thus, the larger number Ofintersections they pot negotiate. Older drivers, 55 years and over,had a greater proportion of crashes not at intersections, reflectingtheir greater amount Of rural driving (see Table 31).
ITime of the Accident
Twenty- -seven percent of accidents occurred in winter, thirty-twopercent ,in spring, six percent in summer (reflecting the months that theschools are closed), and thirty-five percent in fall. Campbell (1,964)
found a tendency (not Statistically significant) for drivers youngerthan 21 to have more Winter time accidents ttlan-driyers older than 21.
13
26
'Although there are statistically significant difference's among the agegroups there are no clear trends readily observable (see Table 32).
While a somewhat larger proportion of drivers" accidents occur onFriday, the differences were not significant for driver age (see Table33).
Drivers under 21 had a 'Similar proportion o accidents on both theschOol-bound and home-bound trip, but drivers 21 and over had more_acci-dents on the morning .trip and fewer on the home-bound trip (see'Table 34).
Weather and Road Conditions
To explore the hypo4hesis that younger drivers (age 16) with lessdriving' experience had a larger proportion of accidents when the drivingtask became more difficult (as disc6ssed earlier'ib the Waller model),accidents in difficult driving conditions were examined.
There was no significant difference overall between driver agegroups and the type.of road surface. However, 16-year-old drivers hada higher proportion of accidents on loose surface roads than the other
' age groups. Considering only the younger dri.vers, 16-year-old drivershad a signiftcantly larger proportion of accidents (17.6-p t) onloose surface roads than the 17 through 20-year-bld drivers 12.3 per-cent; see Table 35).
Another variable, road defects, was examined'ds an index of the4d4fficulty of the driving task. No statistically significant differencewas found, although when roads had defects (e-.s.,icuts or defectiveshoulders), 16- year -old drivers had a slightly:hilritr-proportion of acci-dents than the drivers 17 through 20 years -(see Table 36).
There was.no significant difference between driers 16 through 20years and 21 and over on the basis of road conditions, although theyounger group did have slightly more crashes.when roads were not drythan the drfvers.over 20,years. A breakdown by age groups-did not showa significant difference for 16-year.-old drivers (see Table 37).
Meaiher affects visibility and road surface% and. can make the- driv-ing task more difficult. 'The difference was not,51Trrilically ignifi-cdht; but again younger drivers did have slightly more accidents whenweather conditions were not clear with rain, snow, clouds br fog eeTable 38).
\11.
2'7' 14
Whether the read Was straight and level, or straight and hilly,curved and level, or curved and hilly, showed no significant differences.Sixteen-year-old drivers did hasie a slightly higfier proportion of acci-
dents under the more difficult task of driving on roads that_are.notstraight and level (see Table 39).
Driver Experience
Information about the amount of driving experience in years is'requested on both the Traffic Accident Repott arid:School Bus AccidentReport, but neither report form stipulates whether general driving oronly bus driving experience is to be indicated. Also, driving experience'
is coded in years, and it is 'possiBle that less' than one year's experi-
ence is CPassified as one year..
The questionnaire to school bus drivers asked for both bus drivingand general driving experiencein years and months. The two types ofdriving experiente differed, and older age.li'oups, had a higher proportionof general driving experience,and a lower proportion of bus drivingexperience. )
When the questionnaire sample is compared with the acci-dent sample,the proportion of general-driving experience is about the same (see Table
.40). Ninety-nine percent of 16-year-olds in accidents had less than twoyears of driving experience, which corresponds with the questionnairegroup not involved in accidents. This proportion is to be expected asprovisional licenses: are available beginning at age 16. The 17-year-old
drivers in accidents with less tban two years experience are not over-represented when they are compared to the experience one would expect,based on the questionnaire group. For 18-year-olds in accidents, 26.4
percent had less than two years driving experience, which was a lowerproportion than the bus driving experience of the 18-year-old question-naire group, but higher than the general driving experience of that samegroup. The 19-year-old group, although they have a good overall safetyrecord, showed a much higher proportion of inexperienced drivers (30percent compared to 6.3 percent in the questionnaire sample with lessthan two years general driving, experience). The other age groups did
not differ.
The*Ither driver.
Of the crash - involved drivers, 15.4 percent were involved in an
accident on the school grounds (see Table 30).' More may have beeninvolved in accidents in the close vicinity, although this is'not
2815
entered on the report forms. One would expect that if a substantialnumber of accidents occur in or4lea/r the school grounds, there is an .
IncreasedIncreased possibility that the other driver involved would also beyouthful, as there would be a higher representation.of yOung peopledriving to and from school at the same"time as the school buses.
Table 41 shows the age of the 1603 other drivers involved in anaccident with a school bus. For the 1241 whose age is known, 14.7percent were 17 years and below, and 7.6 percent were l8 through 19years. These are higher proportions than those generally representedin North Carolina crashes, where 8.5 percent of the drivers involvedare 16 and 17 years and 11.4 percent are 18 and 19-year-olds'(Waller,1970).
Driver Characteristics
A further study is planned to link the driver characteristicsobtained from the driver questionnaire sample to individual driver records.However, some characteristics shown by the questionnaire sample provided,an interpretation of age group accident rates.
....
TUle reason put forWard for hiring student drivers is that they are
jmor'e reoiadily available or supervision than adult drivers. However,about 40 percent of th drivdrs surveyed over age 20 were schoolemployees; the next largest group was housewives (31 percent). The agegroup with the best safety record among the older drivers was the 25through 54-year-old group, who had, by far, the largest proportion ofpeople who stated their occupation as home duties (nearly 35 percent).All the other occupational groups were much smaller, except that 25percent of the 55 years and older group were retired or unemployed (seeTable 42).
Eighty-six drivers under age 21 in the questionnaire sample werenot attending school. All 16-year-old drivers were students. Althoughthe numbers were too small to calculate occupational proportions foreach age, the largest occupational group was the one of individualsattending college (about 34 percent); 22 percent were school employees(see Table 43).
Looking at the qades of the student drivers in the questionnairesample, the largest proportion had a C average.; the next largest groupwas.the.B average students. Twenty-year-ol drivers had.the largestproportion of C grades, nearly 86 percept (see Table 44).
16
29

IV. DISCUSSION AND SUMMARY
School bus accident rates were calculated both in, terms of accidentsper driver age group and accidents per million vehicle miles by driverage group. The accident ratesvdid not show a simple age related curveclearly differentiating been student and adult drivers. Rather, bothprocedures for determihirfg accident rate showed 16-year7old drivers tohave the highest accident rates, followed by the 20-year-old and the 21through 24-year-old groups. The drivers age 17 through 19 had rates thatcompared favorably with drivers age 25 through 54. These sane relation-ships were found for all five categories of accidents, namely, all acci-
'dents, traffic accidents, police report accidents, property damage onlyaccidents, and injury accidents (see Figures 3 and 4).
Comparing driver mileage information with accident information,there were no significant differences found among ageigroOs for accidentseverity. 4f2nce the drivers were involved in an accident, the amount ofdamage did not differ by age group. However, it was the impression ofsome school bus driver supervisors that female drivers did less damagein accidents than male drivers. Tnis impression proved partially .correctin that 89..3 perdent of.-the female divers age 21 and over in accidentsreported damage below $500 compared ::fith 79.1 percent of accident-
: Involved male drivers age 2 and over (see Table 14).
The rates on injury-producing accidents and the number of peopleinjured showed no significant differences by, age group. Drivers age 20and age -21 through 24 carried the largest number of passengers daily,thus increasing *their potential .for having more passengers injuredshould an accident occur. Since these drivers did not experience greaternumbers of passengers injured, their safety record looks somewhat better,.then, when one considers the number of passengers safely carried:
No information was available on the type,of injury sustained bypassengers, beyond the degre of severity. Information was not avail-able on injury caused to pasengers by their impacting interior parts ofthe bus, but this is an important aspect of injury prevention (Snyder,1972). Vehicle defects were reported by only 2.5 percent of accidentdrivers, most of these being defective brakes (see Table 24).
Twenty-year-old and 21 throligh 24-year-old drivers were employedsignificantly more than the other age groups in cities (see Table 28).This may provide,some explanation for their higher accident rate permiles driven, because they are exposed to more risks'from traffic. Thisis bOrne out by the fact that these age grqups had a greater proportibn
17
of their accidents on city streets (see Table 29). ATthough.the differ-ences were not statistically significant, this pattern held for the acci-dents in residential or industrial and business areas (see Table 30) andfor accidents in intersections (see Table 31).
The'largest proportion of accidents occurred in fail, then spring,then winter, but there were no clear directions of difference among theage groups (seeTable 32). A 'slightly higher proportion of accidentsoccurred on Fridays, but there were no age group diffe4Oces (see Table33).. Drivers 16 through 20 years'had a similar proporerOn of accidentson thv school-bound and home-bound trips, but the drivers over 20 hadmore accidents in the morning and fewer on the home-bound trip (seeTable 34).
A
Accidents in more difficult driving conditions were examined toexplore the hypothesis that inexperienced drivers are likely to havemore accidents when the driving task becomes moredemanding. Sixteen-.year-old operating drivers had, of course, the largest proportion withless than two years driving experience, 99 percent (see Table 40).Focusing on the group with t1e least driving experience, 16-year-oldswere more likely to be at fault in accidents, and were more likely tohave accidents under adverse conditions.
SICxteen-year-old drivers had the highest proportion of violations,6i.5 percent, followed by 17-year-old drivers with 61.2 percent. The25'through 54-year-old drivers, who also have a good safety record, hadthe smallest proportion of accident-driver charges (48.4 percent; seeTable 26). The numbers for each violation type were too small to warrantan age group analysis."
Younger drivers in the general driving population have been shownto have the largest proportion of single vehicle accidents. Such acci-dents tend to be more seVere than multi-vehicle accidents. Although theamount of damage did not differ sign,ificantly for the age groups, 16-year -old accident drivers had a higher rate of single-vehicle accidents(19.1 percent compared- to. 12.6 percent of 17 through 20-year-old drivers;see Table 22). Sixteen-yeah-old drivers had a higher proportion ofaccidents occurring on loose surface roads than the other younger drivers(see Table 35), and a slightly but not significantly, higher proportionon roads with defects (see Table 36): They had a slightly but not signi-'ficantly higher proportion of accidents on roads that were not straightand level (see Table 39). Drivers 16 through 20 years had slightly butnot significantly more crashes than drivers over 26 on roads that werenot dry (see Table 37) and in bad weather (see Table 38).
3118
44
Questionnaire data on the characteristics of the drivers employedprovide 'some probable hypotheses concerning safety records. The 25through 54-year-old group which had a good safety record includes alarge proportion of housewives and school emplbyees, However, tlfe 21
through 24-year-old group with a poorer safety record also includes alarge proportion of school employees (see Table 42). The largest propor-tion of 20-year-old drivers, who as a group also have a pborer record,were,no longer school students (see Table 1). Those still in school werenot high acader4c achievers (see Table 44), and those who had left schoolhad a variety of occupations, the largest group in the questionnairesample being college students (see Table 43).
V. CONCLUSIONS AND RECOMMENDATIONS
The results indicate tht 16-year-old bus drivers experienced'ahigher accident rate than other age groups. Ages 17 through 19 yearscompared reasonably favorably with older drivers. aged 25 through 54yeari. Bus drivers aged 20 through 24 years and 55 years and overhadhigher accident rates on a mileage basis than.the 17 through 19-year-olddrivers, but these older groups were small and the flifferenCes could notbe substantiated statistically..
There were not large differences between the age'groups, on theseverity of accidents. Diffegences in the location of the accidents wereexplained by the higher proportion of 20-year-old,and 21 through 24-year-old drivers who are employed in urban areas, and this also pro.vides someexplanation for their` elevated accident rate as they are expo'sed to moretraffic risk.'
There was evidence that the most inexperienced group, the 16-year-old drivers,,had a higher proportion of'accidents in circumstances wherethe driving task was more demanding such as on loose surface roads, andslightly but not signifiOptly more accidents on roads with defects andon roads that were not straight and level. Drivers under 21 years hadslightly more crashes in bad weather and onyroads that were not dry.
Sixteen-year-old dri'vers also had the'highest proportion of viola-4tions', and the highest proportionsiof single-vehicle collisions.
In view of these results, it may be worthwhile to experiment with'liCensigg more school bus drivers at age. 17 years rather t5gn age. 16:provided they have had a full year of driving experience at that time.Such a procehrq could not be expected to result in a reduction in acci-
,
c.)g)
19. tir
dent rates wrong first year drivers comparable to the current 17year-old drivers, since many of the drivers in the latter category havehad not just a year's drivingexperience,,but a year's experience drivinga school bus.
Firthermore, there was a selection factor operating, since a bus dri-ver can lose his certification if he is convicted of any of the following,whethet they occur while he is driving a bus or otherwise:
1.' Any conviction that would bring suspension or revocation ofdriving privileges.
2. Passing a stopped school bus.3. Two moving violationfr.4p a 12 month period.4. Hit and run involving property damage,5. Speeding in excess of 15 mph above the posted speed limit.6. Any moving violation in connection with an accident.
In addition, a driver can lose his certification while driving'a schoolbus, if he is convicted of failure to stop at a railroad crossing, speed-ing, or failure to stop at a stop sign.
Thus the 17-year-old drivers who drove a bus when they were 16survived the first year without any of the abode infractions.
Subsequent to the 1971-72,school year'studied in this report, legis-lation was passed extending the limited driver's permit to_15-year-olds.Previously, the earliest suc4h a permit could be obtained was age 15-1/2.The age for licensing remains 16. The extension of this, permit for an'additional. six months provides beginning drivers with the opportunity foradditional practice before becoming elig)ble for licensing'. If youngpeople are actually taking advantage of this option by securing the per-mit earlier and gaining driving practice during this period, one shouldekpect tb have more experientd 16-year-old applicants for school buscertification. Such applica s should do better ifNthe experience in anautomobile transfers to the operation of a bus. It may be that 16-year-old school bus drivers could be selected from those applicants who haveused this new permit option and have had driving experience since theage of 15.
While an earlier study of North Carolina school bus drivers showedno significant differences between the drivers under age 21 and thoseage 21 and older, this study was undertaken because there was some feel-ing that circumstances had changed in the interim and that schools wereno longer likely to be able to get such good student drivers. Thisanalysis showed'tKat there Was a significant difference between driversage 16 through 20 and those age 21 and older, with the younger drivers
=,.1 20
c1 /
0
haying a higher accident rate. However, it was further found that it wasthe 16-year-old drivers accounting for this high rate. There were no sig-nificant differences between the accident rates of drivers age 17 through2G and those age 21 and older. Because further analyses indicated tshitthe poor performance of the 16-year-old drivers is probably attributableto their inexperience, it is recommended that increased attention begiven to the selection and training of Crese beginning driyers. It
should be underscored that the drivers age 17 through 19, who constitutethe vast majority of the total number of school bus driyers in North .Carolina, compare well with the drivers age 2 through 54. In addition,
there were no age differences found in rel ion to the'severity of acci-dents kcurred.
4 a
21
\16
17
18
19
20
21-24
25-54
55 & over
Not known -
All drivers
Table 1.
Ages,of
drivers
(row
At,Schobl
pervntage
the questio
and their current
in pare-ntheses).
At College
naire
sample of sChool bus
educat4onal status
Left School
Not Known
Total
.
N( %)
N\(%)
,N
(%)
N(%)
249 (100.0)
0(
0.0)
0( 0.0)
0 (0.0)
249
624 ( 99.2)
.1
( 0.2)
4(
(1.6)
.0 (0.0)
629
326 (
94.2)
7(2.0)
13(3.8)
--0 (0.0)-----:-_____346
35 ( 53.0)
11
(16..7)
20
(30.3)
0 (0.0)
.,
466
,1
...i
7(
18.9)
9(24.3)
21
(56.8)
0 (0.0)
37
,1
(1.2)
9(10.6)
74
(87.1)
1(1.2)
85
.3
(0.4)
12
(1.7)
700
(96.6)
10 (
II)
725
3(
4.3)
0( 0.0)
.67
(95.7)
0,(0.0)
70
5,( 22.7)
'1
( 4.5)
#15
(68.2)
/1
1(4.5)
22
1253 (
56.2)
50
(.2.2)
914
(41.0)
12 (0.5)
2229
gib
0
Table 2. Number of older drivers in the
1971-72 Mileage`fygures and 19.74
guestiorinaire sample (columnpercentage in parentheses).
Age
Number'
1971-72 Mileage 1974 Sample
N (%) *N CO
-.55-59 54 (37.0) 29 (41.4)
60-64 53 (36.3) 21 (30.0)
65-69 32,(21.9) 16 (22.9)
70 & over 7-T 4.8) 4 ( 5.7)
All -older drivers 146 70
el 41?0 U
23
7
....
....///--
Table 3. Accident involvement for types V accidentreports (the number of atcident\driversdivided by the number of operating driversin each age group).
AgeAll
AccidentsTraffic
Accidents
'
,Polic ReportAcc dents
16
17
18
0.305
0.182
p.128
0.270
0.162
0.115.
205
0.128.
9.096
19.....#0
0.171 0.154 .123
..e,
20 0.286 0.231 0.209.
21-24 0.262 0.248 / 0.172
25 -54 0.131 0.119 0.084
55 and over 0.178 0.151 , 0.110
All drivers \
\
, O. 83 0.1 3,- 0.128
16-20% 0.187 0.167 0.132
21 and over .0.142 0.128 0.091
All drivers 0.182 0.162. 0.127

Table'4. Yearly mileage by operating driverage groups.
Acme`
Number-of Drivers.
16 1,482
17 4,436
18 2,584\
19 387
20 90
21-24 145
25-54 955
55 and over"- 146
A11 drivers . 10;225
F7; 10217 = 2.58, .05 > P > .01
. \
Total Mileage Mean Mileage
10,068,03/ 6794
29,950,399 6752. . .
\17,394,984 6732
2,767,856 7152
617,924 6866
1,014,464 0 6996
\6776,64 e---- 7096
990,682 6785
69,580,960
25 \\ \-1-\
N,,3
6805

,
Table 5. .Days driven annually bfoperating0 driver age groups.
Age -1..
Numberof Drivers /Total Days' Mean Days
tir
16 1,483 257,869 \ 173.9
17 4,437\ 1 772,649 174.1
18 2,580 452,201 175.3
19 388 6,505. 176.6
20 90 15,331 170.3
21 -24 145 ?4,324 168.0
25-54 1-955 165,301 173.1
55 and over 146 25,246 173.0
Al drivers 10,224 1,781,46- .174.2
i F7, 10216 = 3.43, P < .01
'NI..
' \ ,
I
1
I.
/.
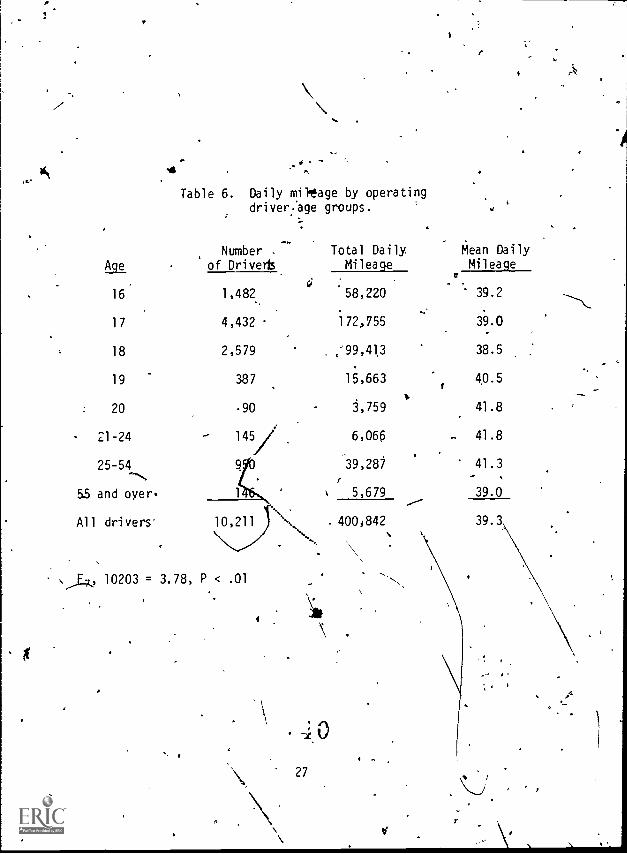
Table 6. Daily mirage by operatingdriver:age groups.
Number
Age of Drivert
16
17
18
19
20
21-24 145
1,482,
4,432
2,579
387
.90
25-54
55 and over
All drivers-
10203 = 3.78, P < .01
27
Total DailyMileage
58,220
172,755
:99,413
15,663
3,759
6,065
39,287
5,679
4004842
Mean DailyMileage
39.2
39.0
38.5
40.5
41.8
41.8
41.3.
39.0
39.3
.
Vablg 7. Accident rates per vehicle
Age
(,..
i
miles for types of accident reportsby driver age groups.
'All Traffic Police ReportAccidents Accidents Accidents
16
17
18
19
20
45.19
27.25
19.20
24.21
42.10
40.13
24.24
17.25
21.68
33.98
%
30.9
19.20
14.10
17.34
30.75
21-24 37.46 35.494
24.64
25-54 18.59 16.82 11.95
55 and over 26.24 22.10 16.15, -
All drivers 27.13 24.19 18.99
16-20 (student) 27.93
21 and over (adult) 21.'64
All drivers 27.13
17-20 24.50
21 and over 21.64
All.drivers age 24.0817 apTover
28
. 41, vs
'Table 8. Accident rates per million-vehicle miles forproperty and.injury accidents by, driver age'groups.
Property Injury
Age- .AcciInts Accidents
16 3714 7.25'
17 23.14 4.12
18 15.23 3.96
19 20.59 3.61
20 35.60 6.47
21-24 33.52 . 3.94
25-54 15.94 2.66
55 and over, 22.21 4.04
All drivers 22.75 4.38
4 2
29
.
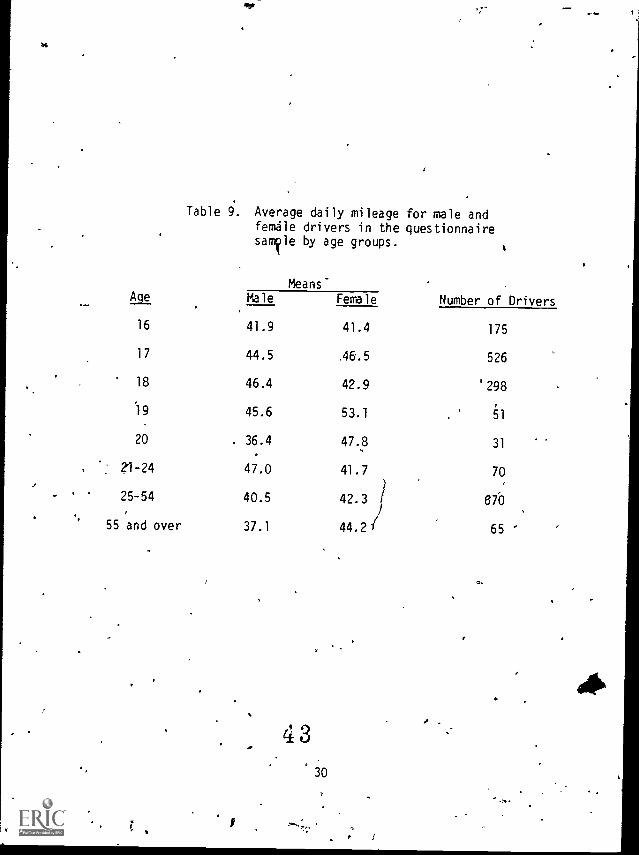
Table 9. Average daily mileage for male andfemdle drivers in the questionnairesalle by age groups.
Means-
ATt Male Female Number of Drivers
16 41.9 41.4 175
17 44.5 A6.5 526
18 46.4 42.9 '298
19 45.6 53.1 51
20 36.4 47.8 31
21-24 47.0 41.7 70
25-54 40.5 42.3 670
55 and over 37.1 44.2 65
4330
I
o.
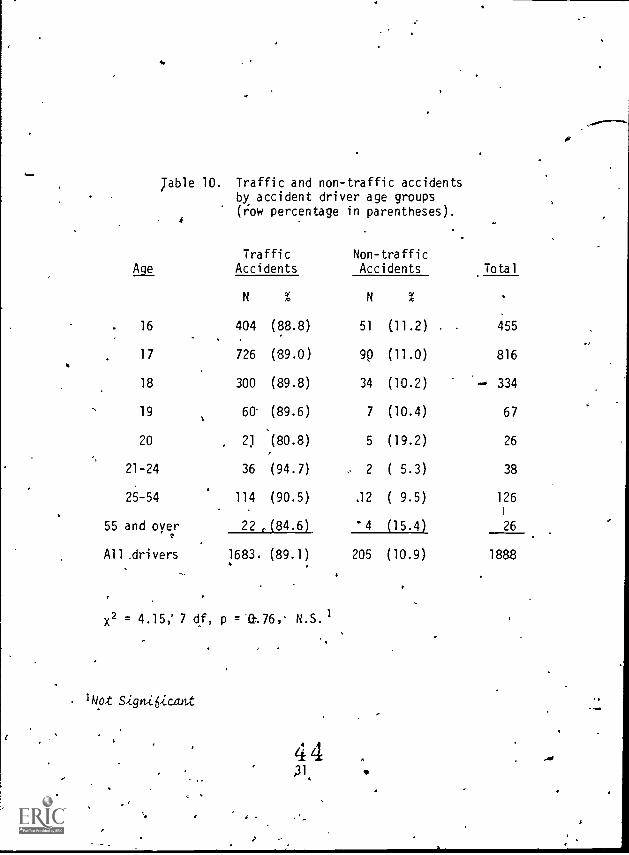
Table 10. Traffic and non-traffic accidentsby accident driver age groups(row percentage in parentheses).
AgeTraffic
AccidentsNon-trafficAccidents Total
N % NV4
16 404 (88.8) 51 (11.2) 455
17 726 (139.0) 90 (11.0) 816
18 300 (89.8) 34 (10.2) 334
19 60' (89.6) 7 (10.4) 67
20 2) (80.8) 5 (19.2) 26
21-24 36 (94.7) , 2 ( 5.3) 38
25-54 114 (90.5) 12 ( 9.5) 126
I
55 and over 22 (04.6) '4 (15.4) 26
All drivers 1683. (89.1) 205 (10.9) 1888
X2 = 4.15,' 7 df, p = 4.76,* N.S. 1
1Not Signi6iccutt
44

ri
Tablt, 11. Type of repoht made on the accident byaccident driver age groups (row per-centage in parentheses)'..
Police Report .Schoo4 Report Total
N (%) N (%).
16 306 (67.3) 149 (32.7) 455
17 575 (70.5) 241. -
(29.5) 816
18 '251 (75.1) 83 (24.9) 334
19, 48 (71.6) 19 (28.4) 67
20 19 (73.1) 7 (26.9) 26
21 -24 25 (65.8) 13 (34.2) 38'
25-54 81 (64.3) 45 (35.7) 126
55 and over 16 (61.5) 10 (38.5) ii 26
All drivers 1321 (70.0) 567 (30.Q) 1888
X2 = 9.30, 7 df, p = 0.23, N.S.19
1Not iignikcant
.
z
Table 12. Injury and property accidents byaccident driver age groups (rowpercentage in parentheses).
Age
Injury orFatal Accidents
%,
PropertyDamage Only Total
U (%) N (%)
,16 73'(16.0) 382 (84.0) 455-g
17 123 (15.1) 693 (84.9) 816
18 .m8. 69 (20.7) 265 (79.3) 334
19v
10 (14.9) 57 (85.1) 67
20 4 '(15.4) _22 (84.6) 26
21 -24 4 (10.5) 34 (89.5) 38
25-54 18 (14.3) 108 (05.7) 126
55,and over 4 05,4) 22 (84.6) 26
Ali drivers 305 (16.2) 1583 (83.8). 1888
X2 = 7.02, 7 df, p = 0.42, N.S.1
-1Not Signi6icant
33
C
4
.
Table 13. (Cost per accident by accidentdriver age groups (row per-.
;Centage in parentheses).
LgUndersloo
5100-5499
5500-
5999Over51000 Total
N %- N % N % N %
16 130 (30.4) 215 (50.2) 51 (11.9)' 32 (7.5) 428
17 184 (24.5) 401 (53.5) 113 (15.1).. 52 (f.9) 750
18 79' (25.2) .168 (53.7) 48 (15.3) 18 (5.8) 313
39 16 (25.0) .36 (56.), 7 (10.9). 5 17.8) 64
20 6 (25.01 X14 (58.3) 3 (12.5) 1 (4.2) 24
21-24 10 (27.8)i .20 (55.6) 5 (13.9) 1 (2.8) 36
25-54 41 (34.7)' 60 (50.8) 1) ( 9.3t' 6 (5.1) 118
55 and over 7 (28.0) 13 (52.0) 3 (12.0) 2 8.0) 25
N411 drivers 473 (26.9), 927 (52.7) 241 (13..7) 117k(6.7) 1758
2 = 14.99, 21 df, p = 0.82, N.S.1
Not S.qnii.ccant
.99
,tr
o-
Table 14.
N
Costof accident damage for drivers21 years and over by sex (columnpercentage in parentheses).
Male Female Adult drivers
(%) N (%)- N (%)
Under $100 20 (23.3) 38 (40.9) 58 (32.4).
5100-S499 48 (55.8) 45 (48.4) 93 (52.0)
$500-5999 10 (11.6) 9 ( 9.7) 19 (10.6)
Over $1000 8 ( 9.3) 1 ( 1.1) 9 ( 5.0)
Total 86 93 1799
x2 = 10.92, 3 df, p = 6.01
,
35-
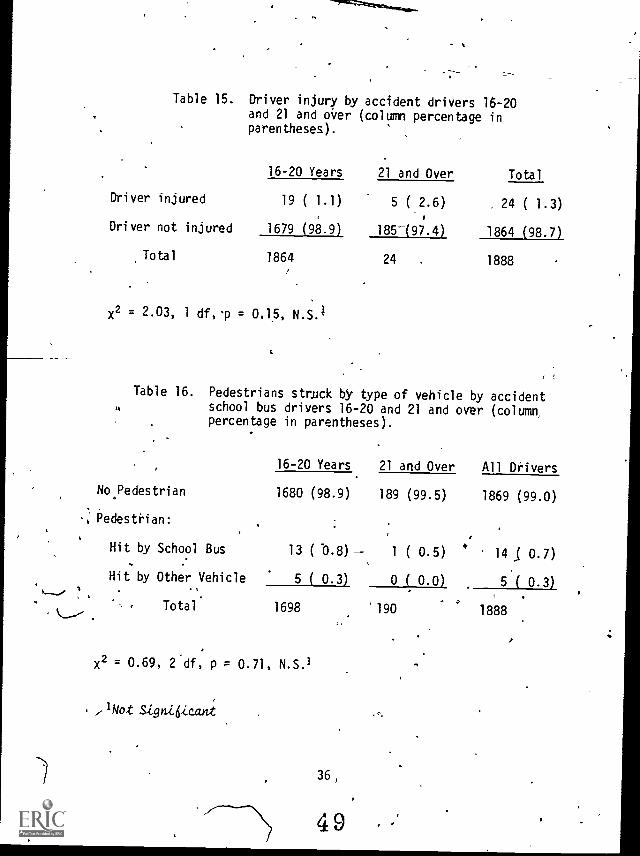
Table 15. Driver injury by accident drivers 16-20and 21 and over (column percentage inparentheses).
16-20 Years 21 and Over Total
Driver injured 19 ( 1.1) 5 (2.6) 24 ( 1.3)
Driver not injured 1679 (98.9) 185197.4) 1864 (98.7)
Total 1864 24 1888
X2 = 2.03, 1 df,) = 0.15, N.S.1
Table 16. Pedestrians struck by type of vehicle by accident4 school bus drivers 16-20 and 21 and over (column,
percentage in parentheses).
16-20 Years 21 and Over All Drivers
No Pedestrian
s, Pedestrian:
1680 (98.9) 189 (99.5) 1869 (99.0)
i
Hit by School Bus 13 ( 0.8) 1 ( 0.5) 4 14 S 0.7)
Hit by Other Vehicle 5 ( 0.3) 0 ( 0.0) 5 ( 0.3),
Total 1698 '190 1888
X2 = 0.69, 2 df, p = 0.71, N.S.1
,1Not Signi6icant
36,
4 9
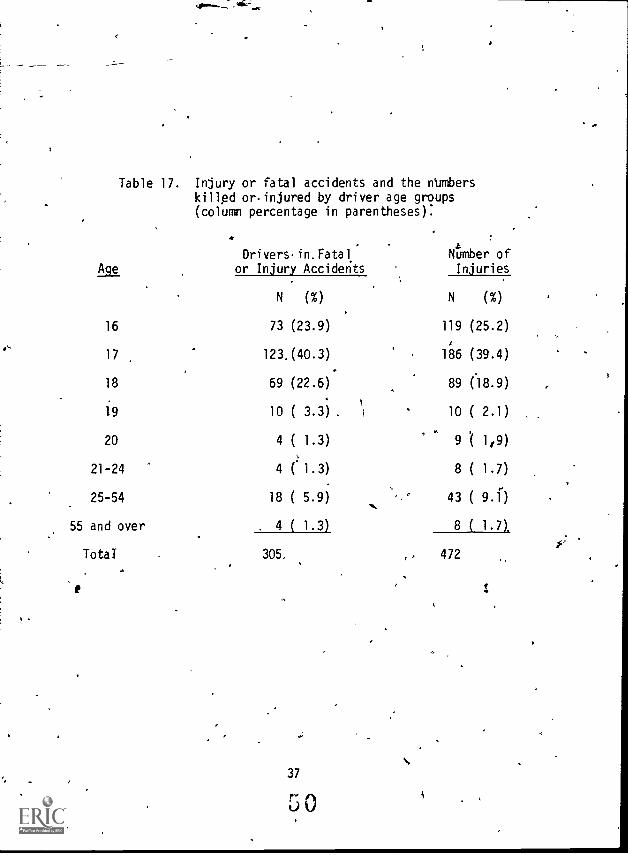
Table 17. Injury or fatal accidents and the numberskillpd orinjured by driver age groups(column percentage in parentheses):
Age
Driversin.Fatal:or Injury Accidents
Amber ofInjuries,
N (%) N (%)
16 73 (23.9) 119 (25.2)
17 123,(40.3) 186 (39.4)
18 69 (22.6). 89 (18.9)
19 10 ( 3.3) .10 ( 2.1)
,20 4 ( 1.3) 9 ( 1,9)
21-24 4 ( 1.3) 8 ( 1.7)
25-54 18 ( 5.9) 43 ( 9.f)
55 and over . 4 ( 1.3) 8 1 1.7),
Tote 305, ,. 472
37
50
4.
Table 18. Passengers driven daily by operating driver agegroups..
LE
16 .
l7
18
19 '
20 ('
21-24
25-54
55 and over
All drivers
Number .
of Driverstotal
Passenger DailyMean Passengers
Daily.
1,479 -. 99,124 67.0.,
4,417 296,286 674
2,578 ' - 170,481 66.1
387 25,334 65.5
89 6,578 73.91
142 10,398 73.2
956 66,910 69.9
145 9,265 63.9
-1(1,193 684,376 67.1
F7, 10185 = 3.27;,P < .01
38

(
Table 19, Elementary school passengers drivenc:daily by operating driver sage groups.
k4.,
Number Total Mean
4 Age of Drivers Passengers Passengers,
16 1361 63,680 ' .50.5
17 3987 . 203031 51.0
18 2363 116,619 49.3
19 348 17,820 51.2
. 20 84 5,045 60.1
2J-24 138 8,805 63.8 '
-25-54 934 / , 59,033 63.2
, 55 and over 142 7,961 56.1
All drivers IN 9357. 487.,294 52.1
F7, 9349 = 30.05; P < .01
I.
O
r 3g,1
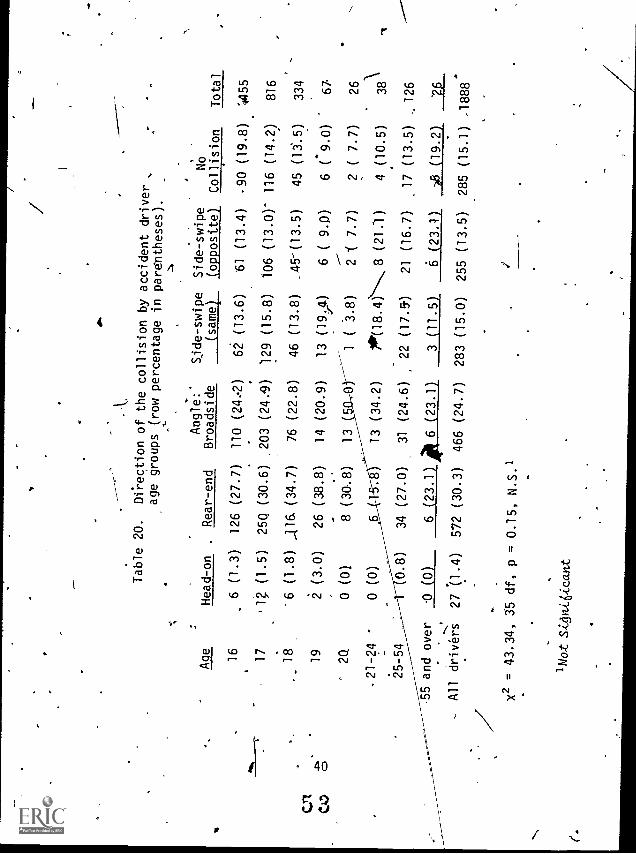
Table 20.
Direction of the collision
by accident driver
,
age groups (row percentage in parentheses).
..
Angle:
Side-swipe
Side-swipe
No
Age
Head-on
.Rear-end
Broadside
(same)
(opposite)
Collision
Total
16
6 (1.3)
126 (27.7)
110 (24..2)
62 (13.6)
61 (13.4)
.90 (19.8)
4455
17
.1? (1.5)
250 (30.6) .203 (24.-9)
129 (15.8)
106 (13.0)- 116 (14.2)
816
18
'6 (1.8) _116.(34.7)
76 (22.8)
46 (13.8)
_45r(13.5)
45 (13.5)
334
19
2 (3.0)
26 (38.8)
14 (20.9)
13 (19))
6 ( 9.0)
6 (-9.0)
67
2Q
0 (0)
8 (30.8)
13
01
1( 3.8)
2 1 7.7)
2(
7.7)
26
.21-24
0 (0)
613 (34.2)
PIIP(18.4
8 (21:1)
4 (10.5)
38
25-54
0.8)
34 (27.0)
31 (24.6)
22 (17.5.1
21 (16.7)
17 (13.5)
126
-55 and over
.0 (0)
(23.1)41 6 (23.1)
3 (11.5)
6 (23.1)
aEs (19.2)
Z5
-All drive;''s
27 (1.4)
572 (30.3)
466 (24.7)
283 (15.0)
255 (13.5)
285 (15.1) -1888
7t,
X2 = 43.34, 3-5 df, p = 0.15, N.S.1
1Not Signi6icant
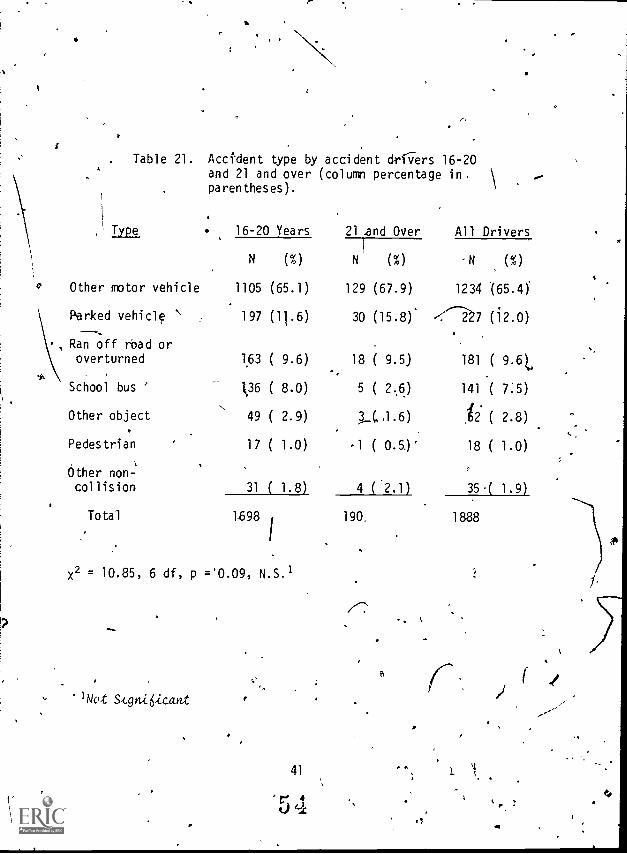
1
1
1
r.
. Table 21. Accident type by accident drivers 16-20and 21 and over (column percentage in, \
parentheses).
1 Type 16-20 Years 21 and Over All Drivers
N (%) N1
(%) -N (%)
0 Other motor vehicle 1105 (65.1) 129 (67.9) 1234 (65.4)
Parked vehicl ' 197 (11.6) 30 (15.8) -.."---227 (12.0)
--,, Ran off road or
.
overturned 163 ( 9.6) 18 ( 9.5) 181 ( 9.6L
School bus ' 06 ( 8.0) 5 ( 2,6) 141 ( 7:5)
Other objectN
49 ( 2.9) 3 (,1.6) 12 ( 2.8),
.
Pedestrian 17 ( 1.0) -1 ( 0.5.)' 18 ( 1.0)
,
Other non-collision 31 ( 1.8) 4 ('2.1) 35.( 1.9)
Total 1,698 190, 1888
X2 = 10.85, 6 df, p ='0.09, N.S.1
,,
1Not ,S,cgni6icant ,
1
r 4J) 41I 1
.1
t
44

.1 ---
CkTable 22., Type of crash by driver age (column
percentage in parentheses).
. Type 16 Years 17-20 Years
' N (%) N (%)
Single-vehicle
, crash 437 (19.1)
Multi-vehiclecrash 368 (80.9)
156 (12.6)
1087 (894.4)
Total 455 1243 . 1698
...
All YoungerDrivers
N (%)
243 (14.3)
1456 (85.7)
X2 = 11.19, 1 df, p = < .001
..,
A
(
i
4,
i
42
,r
.. %
4,
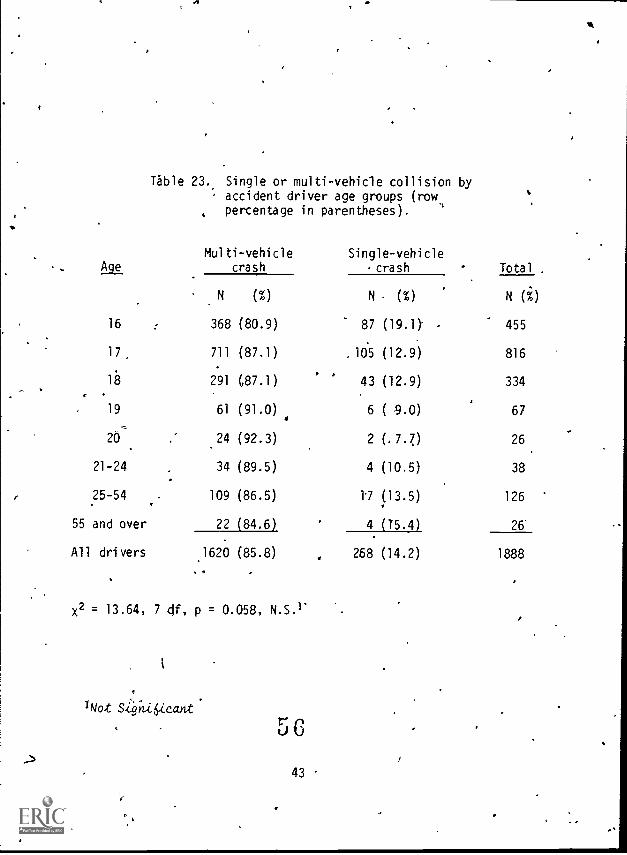
,
Table 23. Single or multi-vehicle collision byaccident driver age groups (row,percentage in parentheses).
Multi-vehicleAge crash
Single-vehiclecrash Total .
N (%) N (%) N (i)
16 368 (80.9) 87 (19.1Y 455
17, 711 (87.1) .165 (12.9) 816
18 291 87.1)ft
,
43 (12.9) 334
19 61 (91.0) 6 ( 9.0) 67
20 24 (92.3) 2 (.7.7) 26.
21-24 34 (89.5) 4 (10.5) 38
25-54 109 (86.5) 17 (13.5) 126
55 and over 22 (84.6) 4 (15.4) 26.
All drivers 1620 (85.8) 268 (14.2) 1888
% .
x2 = 13.64, 7 4f, p = 0.058, N.S.I.
i
,
Not S4n,i. 'e nt.
5C
43
A
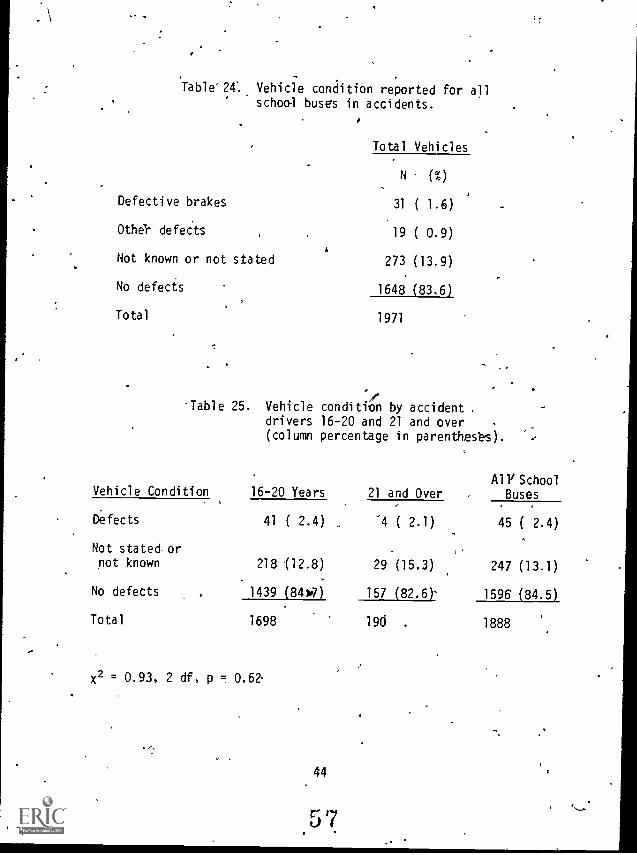
Table'24.. Vehicle conditionschool buses
reported for allin accidents.
Total Vehicles
N (%)
Defective brakes 31 ( 1.6)
Other defects 19 ( 0.9)
Not known or not stated 273 (13.9)
No defects 1648 (83.6)
Total 1971
Table 25. Vehicle condition by accidentdrivers 16-20 and 21 and over(column percentage in parentheses).
All' SchoolVehicle Condition 16-20 Years 21 and Over , Buses
Defects 41 ( 2.4) _ -4 ( 2.1) 45 ( 2.4)
Not stated. or
not known 218 (12.8) 29 (15.3) 247 (13.1)
No defects 1439 (84,) 157 (82.6) 1596 (84.5)
Total 1698 190 . 1888
X2 = 0.93, 2 df, p = 0.62.
44
57
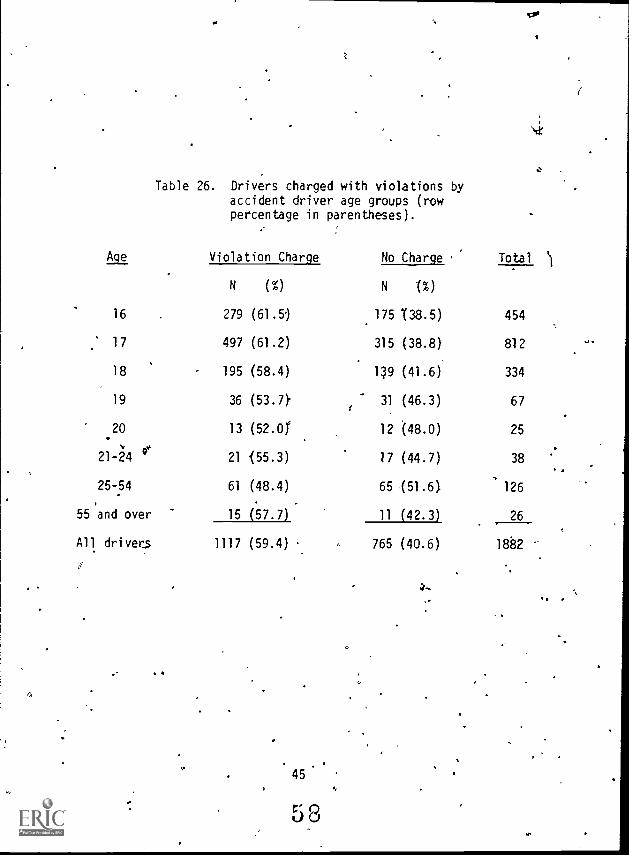
co
I
,.,.
Table 26. Drivers charged with violations byaccident driver age groups (rowpercentage in parentheses).
Age Violation Charge No Charge , Total
N (%) N (%)
16 279 (61.5') 175 138.5) 454
17 497 (61.2) 315 (38.8) 812
18 195 (58.4) 19 (41.6) 334
19 36 (53.7k 31 (46.3) 67
20 13 (52.01 12 (48.0) 25
21-24 V 21 {55.3) 17 (44.7) 38
25-54 61 (48.4) 65 (51.6) 126
55 and over 15 (57.7) 11 (42.3) 26
All drivers 1117 (59.4) 765 (40.6) 1882
45.
..
,
>. .
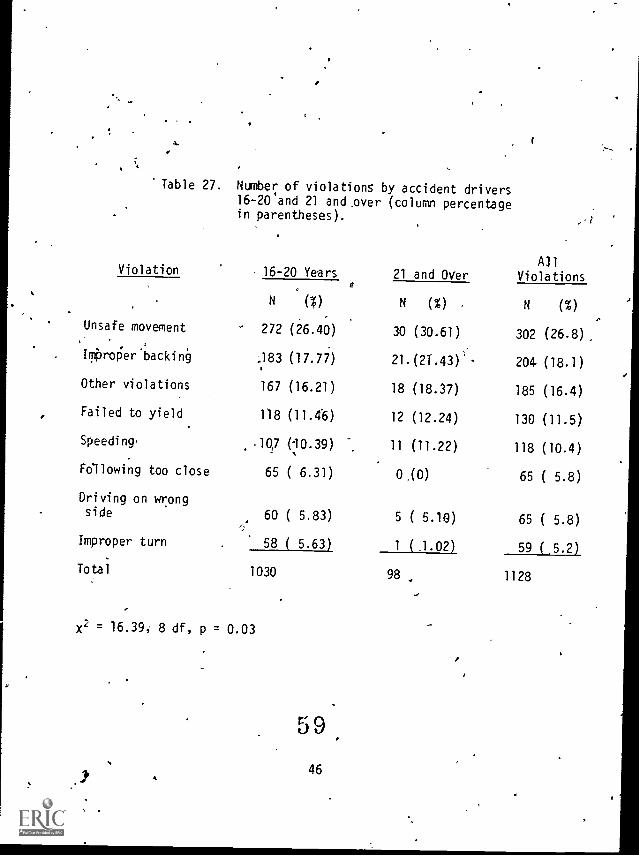
Table 27. Number of violations by accident drivers16-20 and 21 and.over (column percentage
Violation
in parentheses).
, 16-20 Years 21 and Over
..,1
All
Violations
N (%) N (%) N (%)
Unsafe movement 272 (26.40) 30 (30.61) 302 (26.8)
Improper backing J83 (17.77) 21.(2T.43)'- 204 (18.1)
Other violations 167 (16.21) 18 (18.37) 185 (16.4)
Failed to yield 118 (11.46) 12 (12.24) 130 (11.5)
Speeding, .1017 (10.39) 11 (11.22) 118 (10.4)
Following too close 65 ( 6.31) 0 ,(0) 65 ( 5.8)
Driving on wrongside 60 ( 5.83) 5 ( 5.10) 65 ( 5.8)
Improper turn 58 ( 5.63) 1 ( 1.02) 59 ( 5.2)
Total 1030 98, 1128
X2 = 16.39; 8 df, p = 0.03
59
46
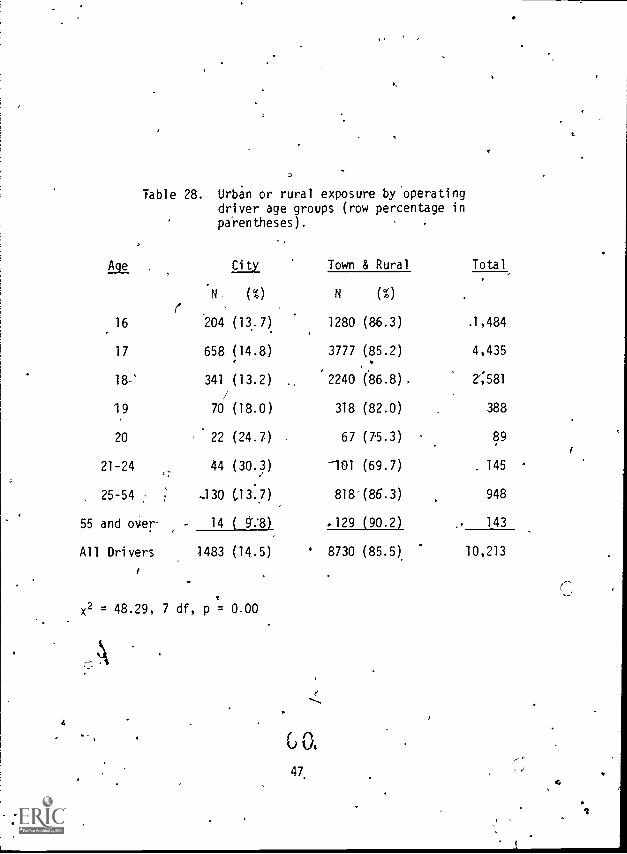
4
Table 28. Urban or rural exposure by operatingdriver age groups (row percentage inparentheses).
Aat
N ,
(
City Town & Rural Total
(%) N (%)
16 204 (13..7) 1280 (86.3) .1,484
17 658 (14.8) 3777 (85.2) 4,435
18 -' 341 (13.2) 2240 (86.8) > 2",581
/
19 70 (18.0) 318 (82.0) 388
20 22 (24.7) . 67 (75.3) 9I
21-24 44 (30.3) -101 (69.7) . 145
25-54 : -130 (.13.7) 818 (86.3) 948
55 and over - 14 ( q:8) .129 (90.2) 143
All Drivers 1483 (14.5) ' 8730 (85.5). 10,213
x2 = 48.29, 7 df, p = 0.00
i
G
I
.
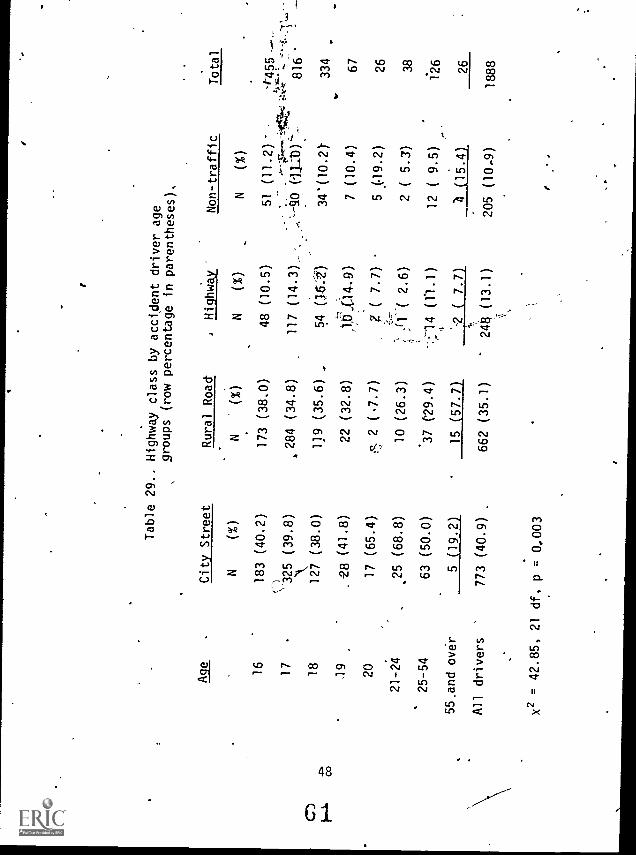
Age
.
Table 29.. Highway class
by accident driver age
groups (row percentage in parentheses),
City Street
Rural Road
,Highway
Non-traffic
Total
N(%)
N(X)
N(%)
N(X)
16
183 (40.2)
173 (38,0)
48 (10.5)
51
(11.2) -
-
.4-455 --.-
17
325
N(
(39.8)
.284 (34.8)
117 (14.3)
,..'-ki (il1-10)--
816 '
'
(7)
18
127 (38.0)
119 (35.6)
,54
(16-
:t)34'(10.2)'
334
1.1.
CO-A
9.28 (41.8)
22 (32.8)
71,6"(14.9)
7 (10.4)
67
20
17 (65.4)
p. 2 (7.7)
g (
7.7)
5 9.2)
26
21-24
.25 (68.8)
10 (26.3)
J1'( 2.6)
;-
2(
5.3)
38
.
.25-54
63 (50.0)
37 (29.4)
.:;:14 (11.1)
12 ( 9.5)
126
55.and over
5 (19.2)
15 (57.7)
'2 ( 7.7)
21
(15.4)
26
$,,
All drivers
773 (40.9)
.662 (35.1)
24ii (13.1)
205 (10-9)
1888
X2 = 42.85, 21 df,
p = 0,003
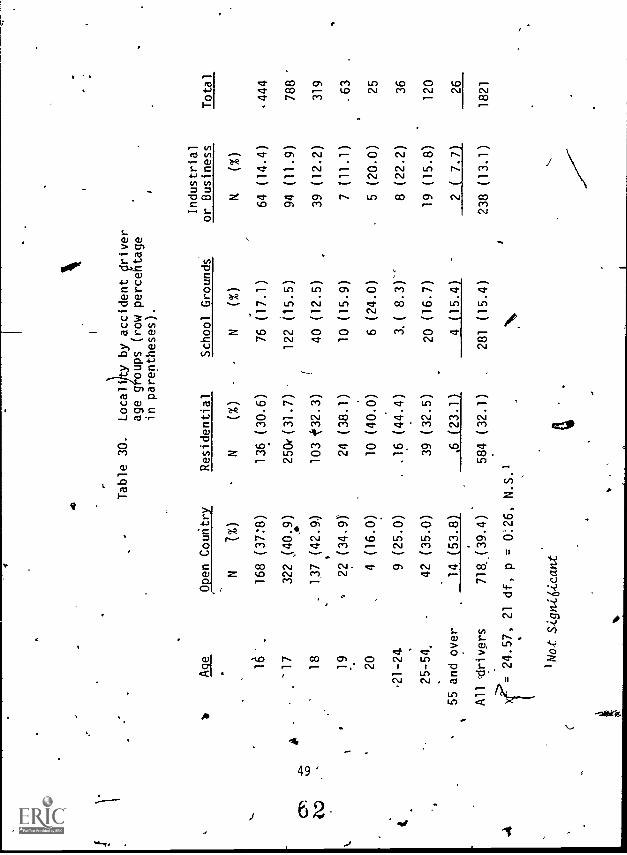
Aqe
Open Country
Table
30.
Locality by accident driver
age g oups (row percehtage
in parentheses).
Residential
School Grounds
Industrial
or Business
Total
NN
(%)
N(%)
R(%)
168 (37:8)
136 (30.6)
76 (17.1)
64 (14.4)
144
*-
17
322 ,(40:9)
250((31.7)
122 (15.5)
94 (11.9)
788 -
C't)
Z\.,
-18
137 (42.9
103 t32.3)
40 (12.5)
39 (12.2)
319
1.9
22 (34.9)
24 (38.1)
10 (15.9)
7 (11.1)
.63
20
4 (16.0)
10 (40.0)
6 (24.0)
5 (20.0)
25
.21-24
9 (25.0)
..16 (44.4)
3.( 8.3)-
8 (22.2)
36
25-54.
42 (35.0)
39 (32.5)
20 (16.7)
19 (15.8)
120
55 and over
14 (53.8)
,6 (23.1)
4 (15.4)
2(
7.7)
26
All drivers
718 (39.4)
584 (32.1)
281 (15.4)
238 (13.1)
1821
=24.57,
1 Not
21 df, p = 0:26,
N.S
.1
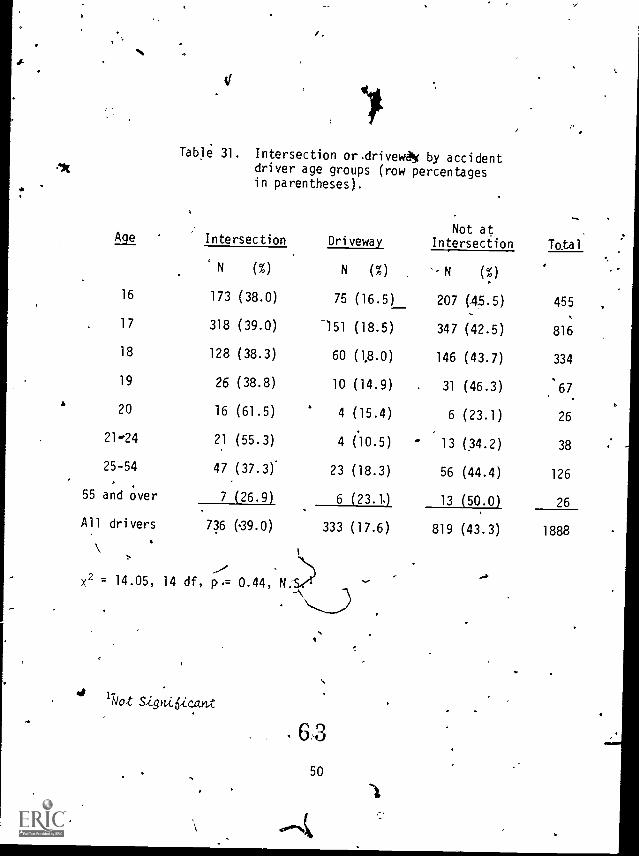
:vc
.
if
Table 31. Intersection ordrivew* by accidentdriver age groups (row percentagesin parentheses).
Acme Intersection DrivewayNot at
Intersection Total
N (%) N (%) '-N (%)
16 173 (38.0) 75 (16.5) 207 (45.5) 455.
17 318 (39.0) -151 (18.5) 347 (42.5) 816
18 128 (38.3) 60 (1,8.0) 146 (43.7) 334
19 26 (38.8) 10 (14.9) 31 (46.3) :67.
20 16 (61.5) 4 (15.4) 6 (23.1) 26
21-.24 21 (55.3) 4 (10.5) ' 13 (34.2) 38
25-54 47(37.3). 23 (18.3) 56 (44.4) 126. .
55 and over 7 (26.9) 6 (23.1.) 13 (50.0) 26
All drivers 736 (39.0) 333 (17.6) 819 (43.3) 1888
X2 = 14.05, 14 df, p.= 0.44, N.
';Jo -t Signi6icant
ti:e..)Q
50
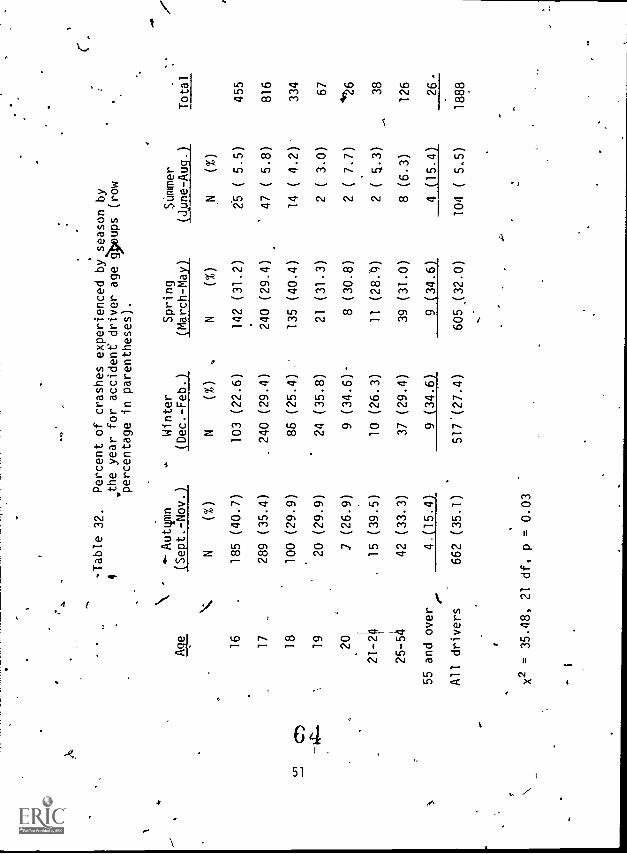
C)
-Table 32.
Percent of crashes experienced by season by
4the year for accident driver age g)oups (row
percentage in parentheses).
Age
4---Aut4mn
(Sept.-Nov.)
,Winter
(Dec.-Feb.)
Spring
(March-May)
Summer
(June -Aug.)
Total
N(%)
N(%)
N(%)
N(%)
16
185 (40.7)
103 (22.6)
142 (31.2)
25
(5.5)
455
17
_289 (35.4)
.240 (29.4)
240 (29.4)
'
47
(5.8)
816
18
100 (29.9)
85 (25.4)
135 (40.4)
14
( 4.2)
334
19
20 (29.9)
24 (35.8)
21 (31.3)
2(
3.0)
67
20
7 (26.9)
9 (34.6)
8 (30.8)
2 (7.7)
4'26
21-1
.15 (39.5)
10 (26.3)
11 (28A)
2 ( 5.3)
38
25-5
42 (33.3)
37 (29.4)
39 (31.0)
8 (6.3)
126
55 and over
4.(15.4)
9 (34.6)
9 (34.6)
4 (15.4)
26.
All drivers
662 (35.1)
517(27.4)
605,,(32.0)
104
(5.5)
1888
X2 = 35.48, 21 df, p = 0.03
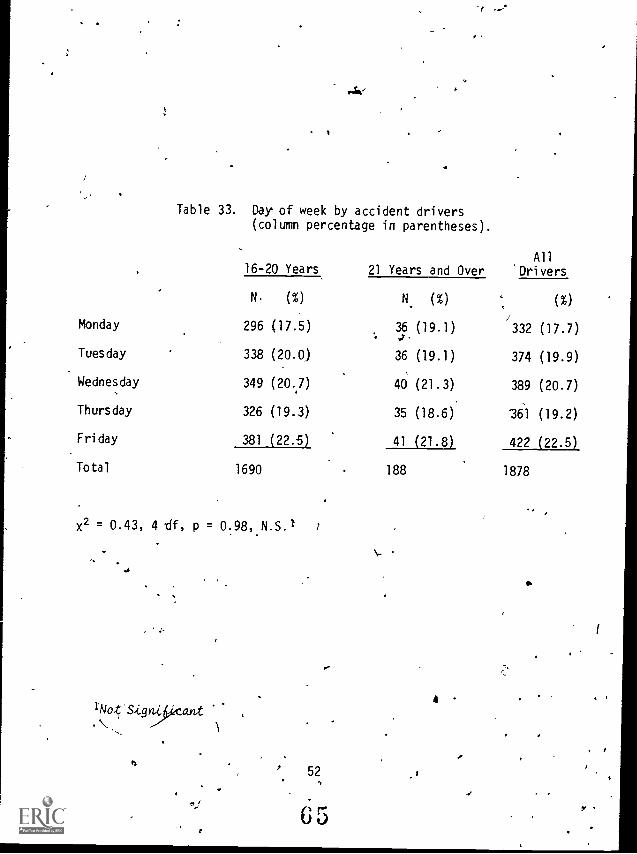
-e
Table 33. Day of week by accident drivers(column percentage in parentheses).
16-20 Years 21 Years and OverAll
'Drivers
N. (%) N (%)
/
(%)
Monday 296 (17.5):
36s.,
(19.1) 332 (17.7)
Tuesday 338 (20.0) 36 (19.1) 374 (19.9)
Wednesday 349 (20.,7) 40 (21.3) 389 (20.7)
Thursday 326 (19.3) 35 (18.6) 161 (19.2)
Friday 381 (22.5) 41 (21.8) 422 (22.5)
Total 1690 188 1878
X2 = 0.43, 4 df, p = 0.98,N.5.1 7
J
1No.(Sign9ktult ,
' 52
65
4
'
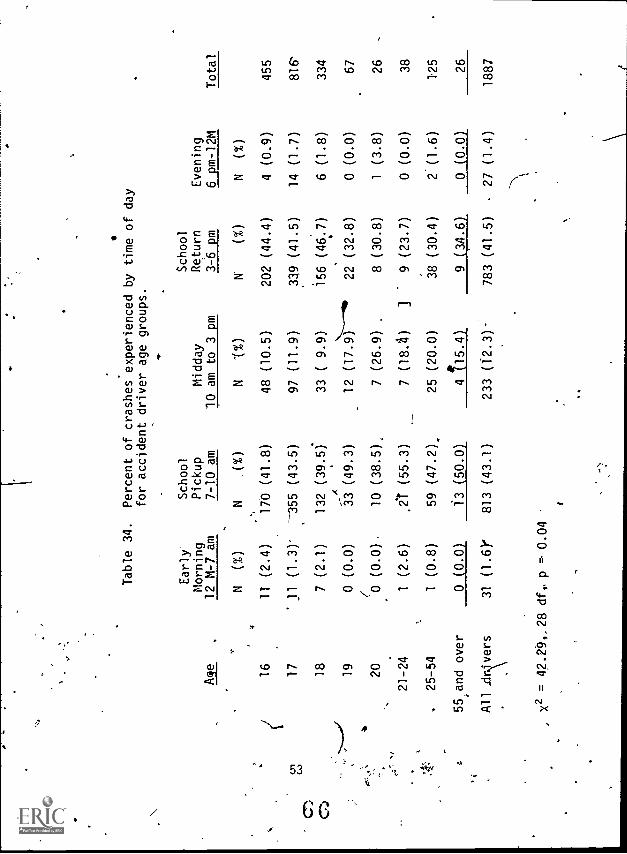
Ln
Table 34.
Percent of crashes experienced by time of day
for accident driver age groups.
Early
Morning
12 M-7 am
N(%)
16
11
(2.4)
17
11
(1.3)'
18
7(2.1)
19
0(0.0)
20
(1
(0.0).
21-24
1(2.6)
25-54
1(0.8)
55 and over
0(0.0)
All
ATers
31
(1.6)
School
Pickup
7-10 am
Midday
10 am to 3 pm
N(%)
N1%)
170
(41.8)
48
(10.5)
-155
(43.5)
97
(11.9)
132
(39.5)
33
(9.9)
33
(49.3)
12
(17.9)
10
(38.5)
7(26.9)
.
,2t (55.3)
7(18.4)
59
(47.2)
25
(20.0)
13
(50.0)
41)5.4)
813
(43.1)
233
(1'2.3)-
x2 = 42.84,28 df4, p =. 0.04
School
Return
3-6 pm
N'
202
.339
156
22 8 9
38 9
783
Evening
6 pm-12M
Total
( %)
N(%)
(44.4)
4 (0.9)
455
(41.5)
14 (1.7)
816'
(46.7)
6 (1.8)
334
(32.8)
0 (0.0)
67
(30.8)
1(3.8)
26
(23.7)
0 (0.0)
38
(30.4)
2(1.6)
125
(34.6)
0 (0.0)
26
(41.5)
27 (1.4)
1887
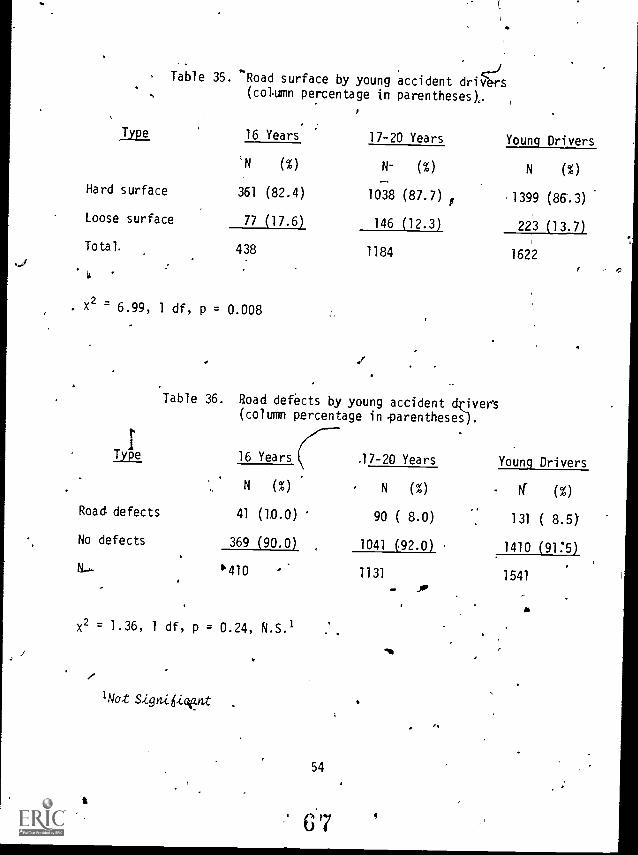
. Table 35. 'Road surface by young accident dris(coumn percentage in parentheses),
Type, 16 Years 17-20 Years Young Drivers
'N (%) N- (%) N (%)
Hard surface 361 (82.4) 1038 (87.7) r 1399 (86.3)
Loose surface 77 (17.6) 146 (12.3) 223 (13.7)
Total. 438 1184 1622
ii
. x2 = 6.99, 1 df, p = 0.008
Table 36. Road defects by young accident drivers(column percentage in.parentheses
t
Type 16 Years .17-20 Years Young Drivers
N (%) N (%) If (%)
Road. defects 41 (10.0) 90 ( 8.0) 131 ( 8.5)
No defects 369 (90.0) 1041 (92.0) 1410 (91:5)
N..... '410 1131 1541
x2 = 1.36, 1 df, p = 0.24, N.S.I
1Not Signi6iant.
54
67
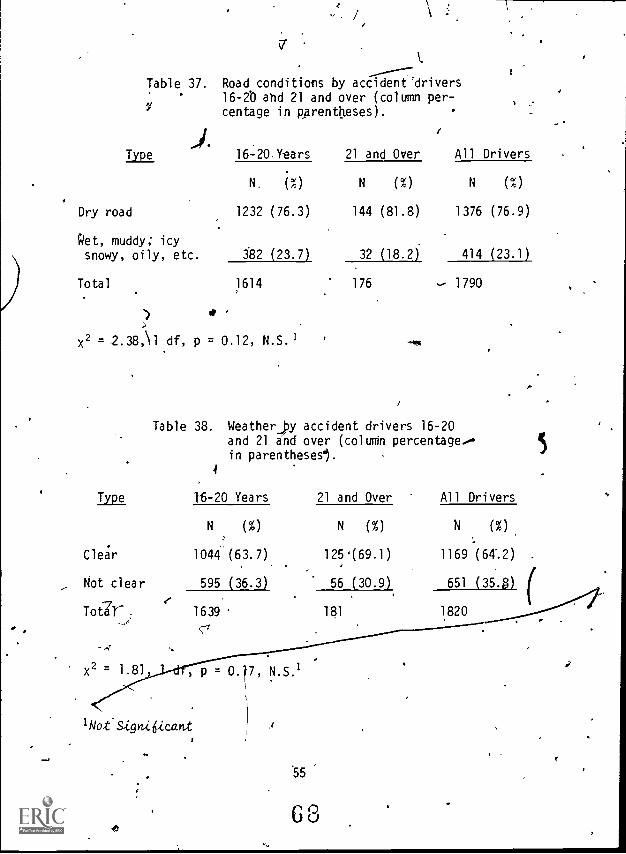
Table 37. Road conditions by accident drivers16-2D and 21 and over (column per-
!: centage in parentheses).
Type 16- 20,Y-ears 21 and Over All Drivers
N (%) N (%) N (%)
Dry road 1232 (76.3) 144 (81.8) 1376 (76.9)
Wet, muddy; icysnowy, oily, etc. 382 (23.7)
Total
32 (18.2) 414 (23.1)
1614 176 1790
x2 = 2.38,\1 df, p = 0.12, N.S.
Table 38. Weather_py accident drivers 16-20and 21 and over (column percentage.-in parentheses").
4
Type 16-20 Years 21 and Over All Drivers
N (%) N (%) N (%)
Cle.;r 1044 (63.7) 125*(69.1) 1169 (64".2) .
, Not clear
e
595 (36.3).
56 (30.9) 651 (35.8) (
Total 1639 181 1820
c/
-.4
x2 = 1.81, , p = 0.
1Not'Signiiii.cant
Ati
7, N.S.1
55
UV

i
w
Table 39. Road character by young accident
Type
drivers (column percentage inparentheses).
! 16 Years 17-20 Years Young Drivers
Straight and level
Not straight andlevel
Total,
N
234
195
(1)
(54.5)
(45.5)
'N.
691
473
(%)
(59.4)
(40.6)
N
925
668
(%)
(58.T)
(41.9)
429 1164 1593
-------________
t.
..
x? = 2.79, 1 df, p = 0.59, N.S.I,
I
,
I No t S4gru 6tcart
k.
69.56
,
or
r
,
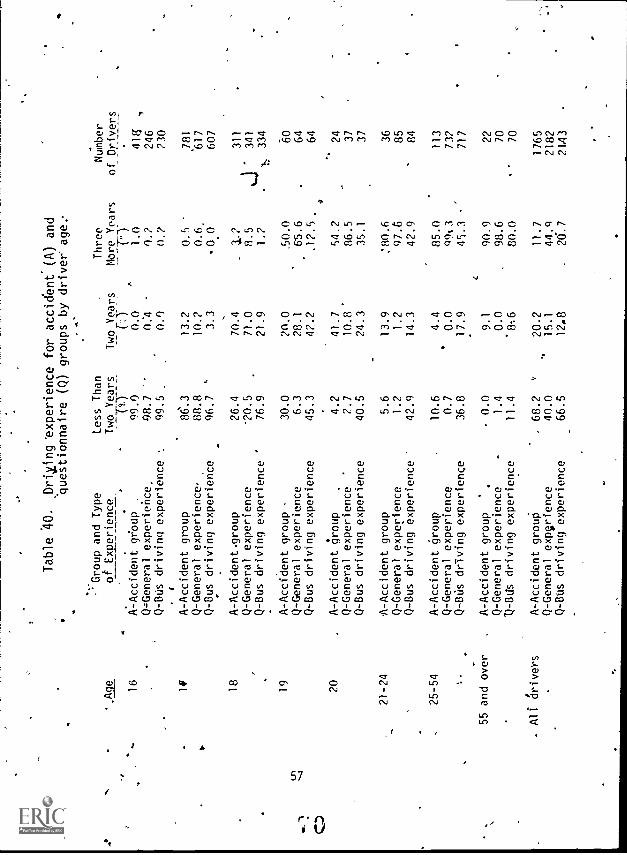
,
Table 40.
Dri,ing 'experience for accident (A) and
'questionnaire (Q) groups by driver age.
'.119P
... 'Group and Type
of Experience_
..
..
,
Less Than
Two Years
.
Two Years
Cl-
Three
More Years
---(
7.-)
-
.
Number
of Drivers
.16
A-Accident group
.99.0
0.0
1.0
41ff
,
Q.General experiehce,
08.7
0:4
0.?
246
Q -Bus driving experience
t
99.5
,0.9
0.2
730
If
A-Accident group
8.3
13.2
0.5
t.
Q-General experience,
88.8
10.?
0.6,
.181
617
Q-Bus driving experience
96.7
"3.3
00'
607
18
A-Accident .group
26.4
70.4
3.?
311
Q-General experience
-20.5
71.0
8.5
341
Q-Bus driving experience
76.9
21.9
1.?
..sb
334
19
A-Accident group
30.0
20.0
.50.0
60Q
-Gen
eral
exp
erie
nce
6.3
28.1
65.6
64
Q-Bus driving experience
45.3
42.2
.12.5
64
4
20
A-Accident group
.4.2
41.7
54.2
24
Q-General experience.
2.7
10.8
86.5
37
Q-Bus driving experience
40.5
24.3
35.1
37
21-24
A-Accident group
5.6
13.9
:80.6
36
Q-General experience
1.2
1.2
97.6
85
Q-Bus driving experience
42.9
14.3
42.9
84
25-54
A-Accident group
10.6
4.4
85.0
113
Q-General experience
0.7
'0.0
99t3
73?
t.
iQ-Bds drlvng experience
36.8
17.9
c
49.i
4'.3
.-
717
55 and over
A-Accident group
.0.0
9.1
90.9
22
Q-General experience
.1.4
0.0
98.6
70
ti -BUs driving experience
11.4
.816
80.0
70
.All drivers
A-Accident group
,68.2
20.2
11.7
1765
Q-General experience
40.0
15.1
44.9
2182
Q -B'us driving experience
66.5
12,8
20.7
21A1
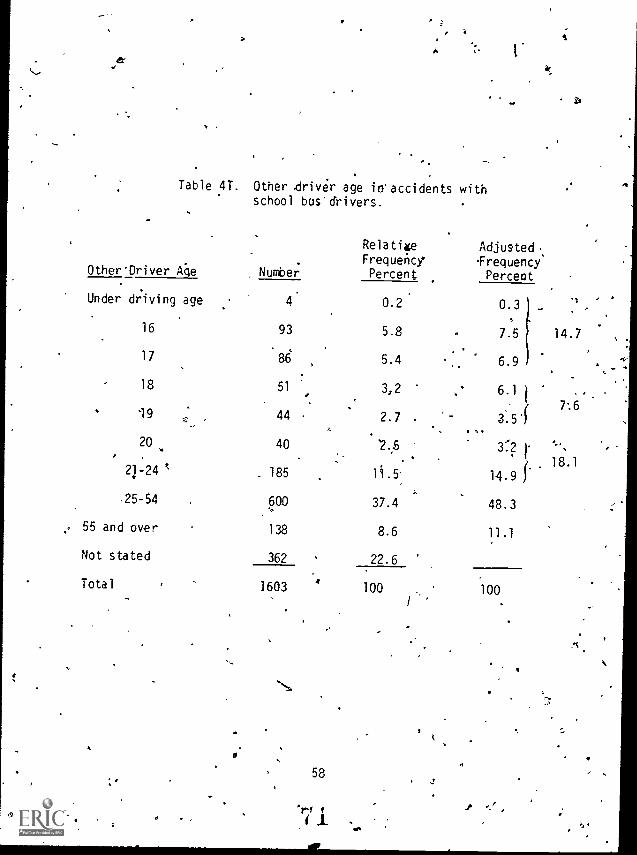
Table 4T. Other -driver age io accidents withschool bus' drivers.
Other'Oriver Age Number
RelativeFrequencyPercent
Under driving age 4 0.2
16 93 5.8
17 86 5.4
18 51 , 3,2
19 44 2.7
20 40 2.5
21-24 _ 185 19.5:
.25-54 600 37.4
55 and over 138 8.6
Not stated 362 22.6
Total 16034
100
0
o a
58
.1
11,
Adjusted,-Frequency
Percept
0.3 .
7.5 14.7
-
6.9
6.17,.
3.5*6
,3':2 1.
,,..I.
18.114.9
48.3
11.1
100
.p
k,
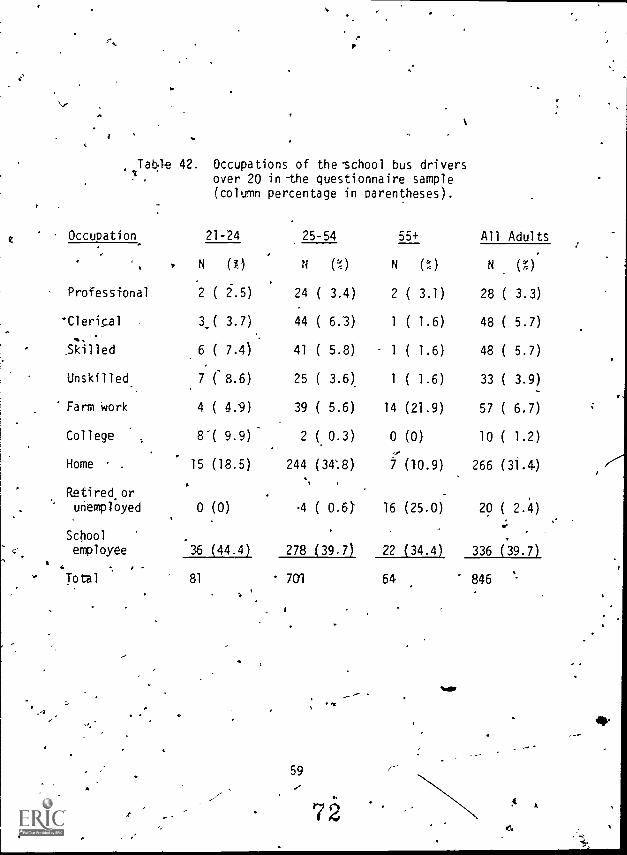
Table 42. Occupations of the -school bus driversover 20 in -the questionnaire sample
(column percentage in parentheses).
Occupation 21-24 25-54 55+ All Adults
N (%) N (%) N (t) N (%).
Professional '2 ( 2.5) 24 ( 3.4) 2 ( 3.1) 28 ( 3.3)
-Clerioal 3_( 3.7) 44 ( 6.3) 1 ( 1.6) 48 ( 5.7)
Skilled 6 ( 7.4) 41 ( 5.8) 1 ( 1.6) 48 ( 5.7)
Unskilled 7 ( 8.6) 25 ( 3.6) 1 ( 1.6) 33 ( 3.9)
Farm work 4 ( 4.9) 39 ( 5.6) 14 (21.9) 57 ( 6.7)
College 8"( 9.9) 2 ( 0.3) 0 (0) 10 ( 1.2)
Home . 15 (18.5) 244 (34%8) 7 (10.9) 266 (31.4)
Refired orunemployed 0 (0) .4 ( 0.6j 16 (25.0) 20 ( 2.4)
School
employee 36 (44.4) 278 (39.7) 22 (34.4) 336 (39.7)
Total 81 nin 64 846
59 7--
Vey

Table 43. Occupations of the younger driversnot attending school in the ques-tionnaire sample (column peftentagein parentheses).
.Age 16 Years eAll Young
,Occupation 17 18 19 20 Drivers
Clerical ,1 0 . 2 2 5( 5.8)
Skilled 1 0 2 3 B ('7.0)
Unskilled 1 4 : 3 3 11 (12.81
. Farm 0 2 1 0 3( 31:5)
Home or unemployed 0 Nr2 5 2 9 (16.4)
College 6 6 11 10 27'(31.4)
School employee 1 '4 5 9 19 (22.1)
stated 1 2 2 1 6( 7.0),Not
Total 5 20 31 30 86 (100)
I
7 3
60
A
ft
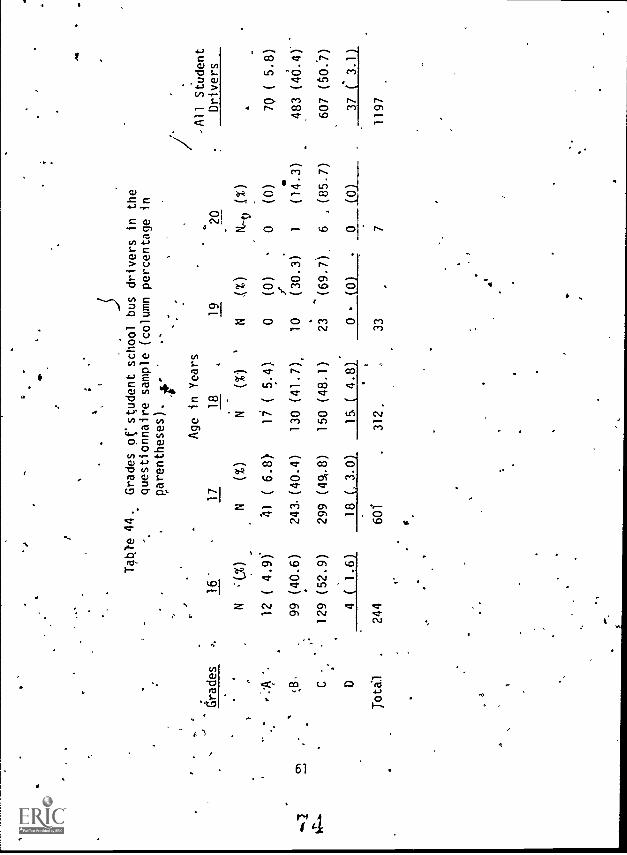
I«
Table 44.
Grades ofstudent school bus drivers in the
questionnaire sample (column percentage in
parentheses).
,.,
Grades
.,.
16'
17
Age in Years
18
,19
-
//
.
20
All Student
Drivers
),
N:(%)
N(%)
N(t)
N,(%)
N,-t)
.(%)
.
.12
(4.9)*
41
( 6.8)
li (
5.4)
0(0)
0(0)
70
(5.8)
/.
.
01(13
99
(40.6)
243.(40.4)
130 (41.7)
10
(30.3)
1(14.3)
483
(40.4)
-C
129
(52.9)
299 (49..8)
150 (48.1)
23
(69.7),
6,(85.7)
607
(507)
D4
(1.6)
18 (, 3.0)
15.( 4.8)
0(0)
-0
(0j
37
( 3.1)
Total
244
601'
.312.
,33
71197
a'
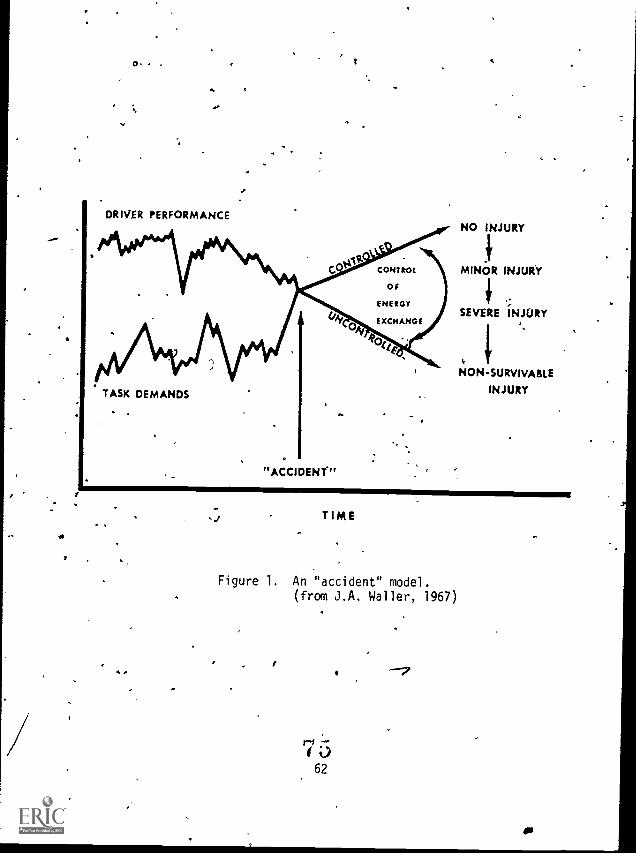
T
..
AA
-.
DRIVER PERFORMANCE
CONTROL
0 t
ENERGY
EXCHANGE
TASK DEMANDS
"ACCIDENT"
NO INJURY
1!
MINO. R INJURY
iSEVERE INJURY
NON-SURVIVABLE
INJURY
TIME
Figure 1. An "accident" model.(from J.A. Wailer, 1967)
I4., 4 ---7
7 362
411
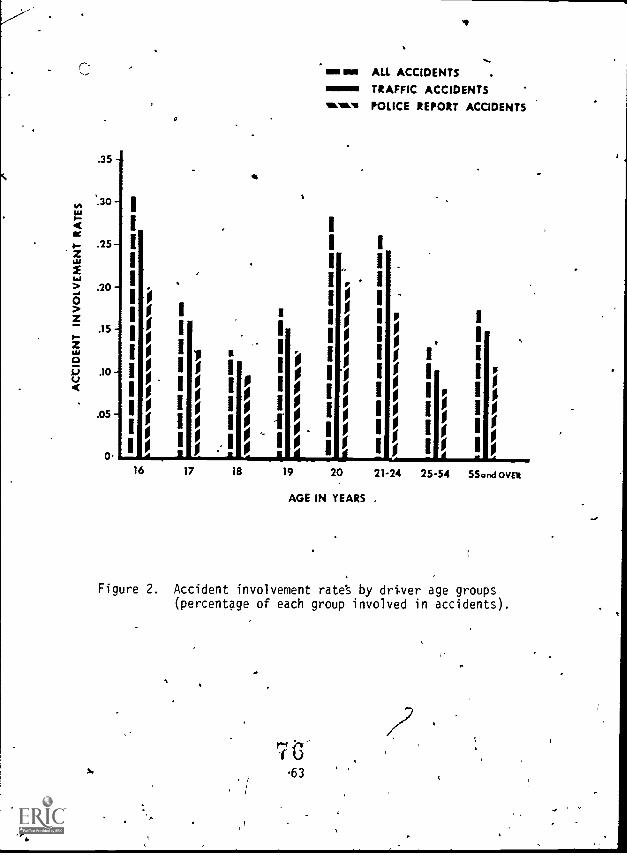
C.
.35
:30-
.25-
.20 -
.15 -
.10 -
.05 -
o-
o
v
...
ma me ALL ACCIDENTS .
TRAFFIC ACCIDENTSvivelvw POLICE REPORT ACCIDENTS
i
1
0
0I
I 00
% 00
0 ' o 0 0;
10° °
1
1 0 0o i 1I o 1 .00
00
0 1 0 il 0. , 0 - 0
0
o 0 ° 0
,
16 17 18 19 20 21-24 25-54 55ond ova
AGE IN YEARS .
r
Figure 2. Accident involvement rate's by driver age groups(percentage of each group involved in accidents).
TO'63

in-d SO -E,
z0
40 -
30-se
L
20
10-0Z.3
0
I
0
0
0
0
mon ALL ACCIDENTSTRAFFIC ACCIDENTS
will". POLICE REPORT ACCIDENT
16 17 1$ 19 20
AGE IN YEARS
I21-24
1
I1 .
25-54 55..d ovE
Figure 3. Accident rates per million,veh)e milesfor. types of accident report, b driverage groups.
64
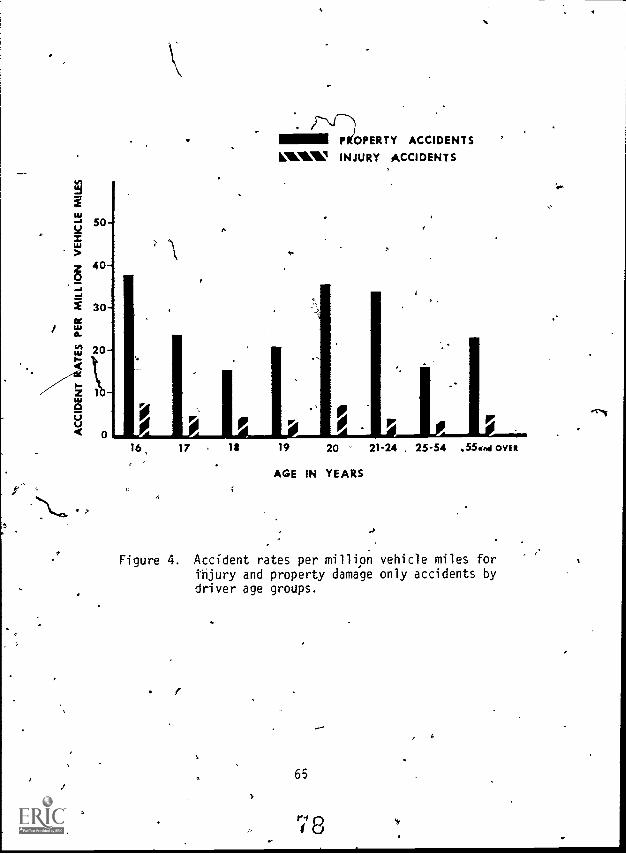
1JACCIDENTS
1 I INJURY ACCIDENTS
16
D
17 1$ 19 20 21-24 . 25-54 .55.1.4 OVER
AGE IN YEARS
Figure 4. Accident rates per million vehicle miles forinjury and property damage only accidents bydriver age groups.
65
78

a
REFERENCES
Campbell, B.J., Kihlberg,J.K., & Lieberman, S. School bus accidents in'North Carol'a. (Report No. VJ-1823-R6) Buffalo, N6i York: CornellAeronautical Laboratory, Inc., 1964.
Charles, S., & Shelness, A. How safe is pupil transportation? Pediatrics,1972, 45 (.1), 365-187.
Farmer, L. The teen-age school 'bus operator. Chitago: National SafetyCoulicil (School Transportation Section), 1967.
Hull, R.W., & KnebelG.W. Statistical summary, of school bus accidentdata. (Report No. AR-655) San Antonio, Texas: Southwest ResearchInstitute, 1968.
Markham, A.W. Pupil transportation in North Carolina. Chapel Hill: TheUniversity of North Carolina Institute of Government, 1966.
McKnight, A.J., MtClelland, C.M., & Berry, M.E. The selection andtraining of school bds drivers. (HumRRO Technical Report .71-3)Alexandria, Virginia: Human Resources Research Organization, 1971.
National Commission on Safety Education. study of school bus safety.. Washington, D.C.: National Education Association, 1967.
National Highway Traffic Safety Administration. School bus safety prob-lems. Washington, D.C.: U.S. Department of Transportation, 1972.[reprint]
National safety CouPncil. Accident facts, 1972 edition. Chicago: Author,1973.
North Carolina State Department of Public Instruction. North Carolinaeducation directory, 1972-1973. (State Department of Public In-struction Publication No.. 451) Raleigh: Author, n.d.
/'North Carolina $tate Department of Public Instruttion. Student school
bus operators. Raleigh: Author, n.d. [processed]
North Carolina State Board of Health. North Carolina vital statistics,1971. Vol. 1. Population, births, deaths, marriages, divorces.
66

Raleigh: Author, 1972.1
Promisel, D.M., Blomberg, R.D., Nacht, M.L., & Silver, S. School bussafety---Operator age in relation to school bus accidents. Darien,
Connecticut: Dunlop and Associates, 1969..
Siegel, A.W., Nahum, A., S Runge, D.E. Bus 'collision causation and in-jury patterns. New Yoik: Society of Automotive Engineers, 1971.
Snyder, R.G. Anatomical considerations for school bus occupant collisionprotection: The value of a restraint system. Paper presented at theSeat Belt and Emergency Exit Symposium, New Jersey, 1972.
Stewart, P.T. How safe is this package? Traffic'Safety, 1972, 72 (5),
8-10, 35-36.
Waller, J.A. "Accident" control - -- Bringing an end to the traditional
morality play. Harvard Public Health Alumni Bulletin, 1967, 10-.14, 21.
Waller, J.A., & Klein, D. Society, energy and injury: Inevitable triad?Paper presented at the National Institute of Child Wealth and Human
. Development Conference on Research Directions Toward the Reductionof Injury in the Young and the Old, Silver Spring, Maryland, May 1971.
Waller, P.F. The youthful driver: Some characteristics and comparisons.Reprinted by Behavioral Publications, Inc., from Behavioral Researchand Highway Safety, 1970, 1 (3), 1437154.
Waller, P. F., & Stewart, J.R. Accident type and severity. Unpublished
manuscript of the University of North Carolina Highway Safety Re-search Center, Chapel Hill, North Carolina, 1974. ,
Ward, G.F. Trained teenage schoolbus drivers safer than adults. Safety
Standards, 1970, 19 (3), 14-16, 28.
.
rCr
§7
C.
I
a
,..
a r
F
1 A
I
APPENDIX A
Traffic Accident 'Report
81, r
71
:e
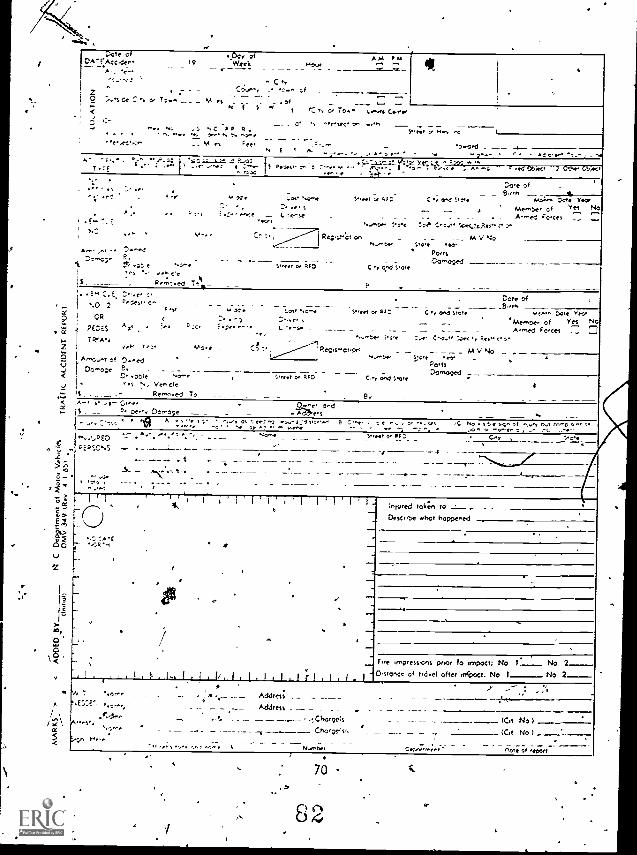
,
0
O
.
-61CpE
O
0
rat
8
e O r AO P SeC'esTrAeOden I We-ek. 1.170 .--, -_. 41_ ..: -
- C .c.;..,-... ,-- 0
0 ,...,-...< : -, V TZ.., -_ _ _ Mn . _ .o4 --N -f $ ef
1 'T.. to C To., i.....44 Gee-C
-S C- _ _ c .1 e,esee, cre. ..nI.... ,..: ..,5 NC PP P.4 . . , rw.v 4 .)r- - to r,...'.eret..,: - - M es 'ee'
'V E
V .4
..,,,eoecls.,...-
_-...-, ....o..,- '5.
' 1;:rl'.c; '.'".', 4. .AT, 'A.
T :E*- . f, 1. II .., 1r0 is.-, NC <2, 'i .7 4H+ ....s. Vt . -f
wee...:'
.,..- . ."V el , :,. . 0C Los. `,... SWle, s2.- , 2. 5. R.:, f C <-:e -..._ 4, 'Leese.
1 F. -. e's ....Ve4
R;D C -, Onl 5.1...*
tVe S:i Ct. St44a4k1.- _____ M V NO5,0. .fev
. pores
04 Scoe
.
De.e of
seo;,e's :441 Thew
05,ew OR Y"
4 t)4 yr M Cc' ' R,V0, 0"
_-:.-_ -__--. f....e.f.I
...- ...... - . '7.>.."..1.
: :7,...,4; - ^- - -- - -- --i. Z t. .:':, e $...e. ee WO C t,.e1 ., ,... c',1
0.4,-,..a.s. T.II ._ 9 _
E. CE 2,e, :.,,,, _ - -M Y.' LW :.,e 5'1,1 V
CR r r.. -o :::te sRED'S A s '''' c' '''''''''. t.- ^v
.,-t.eTRRAN
Wels, t ,,, R1:.e _ L ...---.1 Re vs,42,-0,,fc.e.tArrs,et oe 0-eel
P 'et
PS
-5. s
00 Sot
.
C ty ON/ Ss°,__ ___, ..
..7..., C-o.,' :,,ec 'e ktV
__ MVN40?We we,. -
PO'f5Domooed
Dote of
,,s ,ote Tel,Meeebe, et Yes NoArmed Faces --o ,
_ .. -De-o;e - - -
C. woe:e "1--. , , c.., PRO CT,". %. Vce Cie
L__ _ .. Re,,ed To _ _ _ By
I
- - _ -- ---,... ,' -, ,...,., V
- .. :s0"4$ . __ P Pe.,.. De.mc;e __ _ _ -sA .-' t -;" 's s ... ...:-, 1.1 Pore-, 8 .C, - t e Ts. n . Vs iC No s tr-44 $4. Of .,,, NO eceso o ., ofM.4, ...' Vs: K ° .6 ,,rw o _- 0,... .---..--''' Y '....a:"rr,, ,....,-":.: Se44444 4, Ng "..1 C...,';EP R./2`..5 - w---.-.---.....-._ __.-- _.- -1.-
--1......,-- (-55- .-- ...s:-..s. %- --0.
sI I II Illiri:nowwed
Descote
token to,
who? happened
7:Awc* Art .
.
I1I
I. r
..- '
,.._ .
.
.-- .
/ a -,..
;l -
..
T.,e .frpreSSalS peg), to impact;0,1f OfSee of twelve! offer erfpcnt.
No )--.-- No 2.-.....-No I No 2
tl'i T . 4,...,0
0..(7,-..;', ...,..,. Address - ...
.r,'," 1 ........ . _ __________ ..Cho,gets..Chaqt's,, .
, .-- :',
1't-
(Cat No).4
_ - _..,
.., ,,., .,,, ...,, ..,---, i ----N,rbro - _____,.._ ___ --,r...Otto;44 roe* of 40411
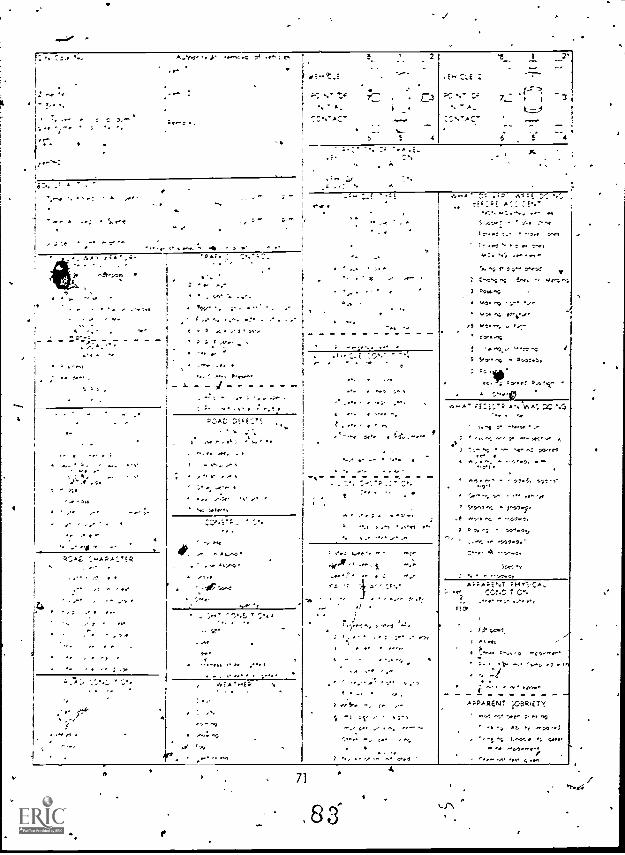
5`
2 ^
4
a,
4
,,e
;
:-: .
r
-
:
2
-E. V.-F.
5
1_ 1 7'
, r e,1, A
.4.6
::::>ST
9A
_ '.:. .
71
A -'
f % ..1.,, -
t , ; ,.', ;'; r
.83
7 -
S ,A10,7 P.AfliSe'.. \., 47
7. '.; -: . ,7.
' 71,i. -.v..: s,
""; 1Y"..y^ 4",
.74 : ,Ou";
EyT ;44C'
",,!! '3 .,Or. ' 1
AiP ARENT ..,,OBR
se ee
e,U.", f
r
16
CM,
t
4
3
APPENDIX B
School Bus Accident Report
.
84-

4
zs- SCHOOL BUS ACCIDENT REPORT .
PLEASE ANSWER EVERY qvzsrsom FULLY(Exiy -*/ .. c.cndost Intwk motet. en cere.7 w etost4, p.4..to demeft wiat k ,tpc..taTsr ?glass, to 64 «no to State Bowl .) Edue-Vws, O. copy f 14 ra4004d 17 C140,4 5.9eTotomoCti
SO4001. COUNTYLocation 4 Oe occ,,ed or J
Tune. Day Dale 19 T A M P MWs Dn,or ame of c.:e-
A..pdress
Ale ys Sex Pace
Telephone No
ExperrareSf.dPent
rs AcItSchool bus: B,s ..0 4 terse c Make Modelri.hci. 5 " No pap fs on Ors a' "fe of °coder Est4mote7d speed .t fme of atden M P H
De -age f o bus
Was 0.4s o ye, .4eoo Es. ,rated Cost for Peocors Sc re-1,0,w, de,...o. %/ere
.
idertfy as ene, 0-4s C, ye' .,arspored ptL;p i walk."9 to.,p' °e oedes.,,an transpo-ted school employeeOther vehicle Noe of d xer Age Address(Vehicle 2) Type veh.cie Year Model license Not Damage 0 ver :le S Owner of veti,cle
Address a
Nees of rrufed and event of iniuries
-- AccidentInvolved-
Descnpbon(Give full
descriptionof conditions
loading toaccident,
what each*driver did,
detailsdetermining
responsibilityetc)
Statementof Driverof School
Bus:(Vehicle 1)
Speed at tine of acpcfent.
Tel No
PAP H
V. 7 72, 344.0. C71: r000d t.. off 0 0144. mlo,ion ,f141 fo, t.tx4, ie. en)
^,f1 C A ,ES '7,A NG 'LK a:^ C..f
5peafr" of Sd,00l Invwero;
it +eh,c'e : 1 .s a pub 4c school bus, 14st same 4nfoema. on as for ITo'*e toed by Fn vest gator'OW IP, D..... of School 14
74
s3
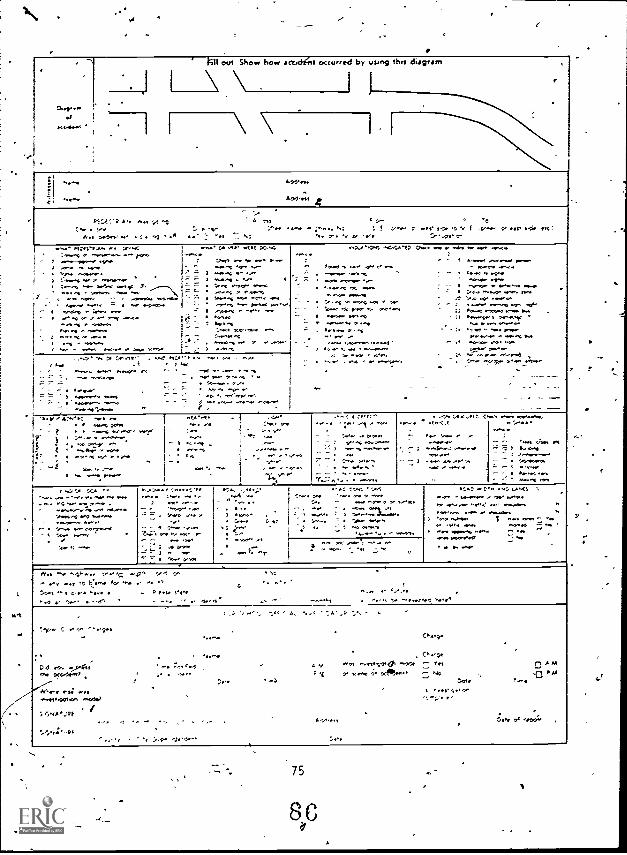
5-
I
:....."
....4.4
' iPll out Sho w how a evol(nt occsoeof bY oun th,i\ \ idiagram
..-
I
.I \ \ .
.
,h 163. ,
A.51.ss z
.1:A Y:, AS . 7,,,, ; A :As , . '.0...., ,,, 7., , , ....e. . ;. ..: 5 ! 7 1.. T. ., f _* , tS Irt, )
As yr..., . , ...; .- -. S y Ax e S.' ,I.o.. r1:15.,A.
..:,...., v ...Fr.,Ir X...,... ry.
7-,
g.c.....ry..
7 ,,"....
orr. r .I .111! DC.,,,.....7 7.,1, ,Yr oar. T.YrY...., ..,
' '.. ; .10 ', .0..., -, , 4, ,...' r-r- ... r .., 41yr venc-:. , ........., x S.- 7. 4 tn.., , -7., .....' - .... ....e ...,.-,S 1._
-- I ,- kg,...a0i ...-ar.. ..,
..1 ., . yyy, .., ye y v ...Y.PY
w..,..
^
'1.. ..
-:-
...1,04 .C .-.ID
'bans ... .7 , ....
0.. we .4. .. ,., y c.o., ...,,y.y. gyyy,
.....,... ..,..<.* / * ..,. .* *,...0.. .0.'1./ ...,,, , ...,....,, ,,,,, .:,,, ......... ....... .....
." 4W ,'% ...".G -a-- *:7 ..,.....e ex.., .a ,,r, 1.4.111_V
,... ...., ......e.: ...., .1 .. ..... ono.
GM." 2 . Y.7,. -,t,, ... ,..., ,, ........
- _ -
. . ---
-.PG.",4,. Y....
. sr. }7."*.: ,.....0 ......r., 4.,- ...,, ..., ,...»....r.< , -"..... ,
- ..., :, r... ,. K ,
- r...... A .7,4,4, ...,y Y.Y.,
.... ,.... ........, 'a.
,.. "; ... 4 .... ..,,..........Jr*. 111., r,,,
fr -.v.*. 141....... >
., . ..........
4.,..
,Ir..., Ose.10
-,... ....,-- ....via.=- 4 N..
.. ,, .....,.."ri,:.
Y Y." P. SS.. _Y.. 7 , ...reyt 4; .., t.:. -. v. , ..7 4 7 r.c
,,--- , ..,. rc ,..._ --, . yl,..,
-r- "' 5 .. .., ' 0 ... ...... ....... -.,..: ' 1.... . e .,../0, A. C
r ..., ,- , -,.., ,..,,,, 'nee1 e "". .'":--r '''''* 5 .....- - -
7 - ...,, ........ >.. . .. .... ............
.1A I...:.. 1 ::, , yt .., -,
, =',.. .....
,.... 1 ..., ...a .... ,o ..,......;
.--i o
i 1.,........1.
I ,..., ,
.---,- - ,= : ..;.--, ..a. a....-,z 3 , .
. .,,,.., ,- . .... /A.., .
7.,,-....,., . . .........
. ;AL..It :.,..
..- P., %,... . r' 7 7 ., ,,....
..S1e ,13 ... A..., ,,. y ,....
..... ea....,......e.
=7. '..--:. 7 a...*1 .0 mo,.. mw000
'.. ... ...,..._-' L. ....... en.- - ...., ....
. .--, .,,, _. z
' KY,. .. ...Y, .0,
7,014,57 "9 7...4...
- Ser.. .a... ty,,,.....5 .....,
5.
:v.' *I
...., ,...1.",.7 I, ..,..
^ - , Co... - .o IYI'!....;- v. , ... r.
.... ,..r.
,.... ,,,,,,.
S, ..,;.....4 ..
4' . cy. .
7 XI . .. 'CIF* C. ra
1 ; ;,...,,.....,, ......, ?:
:7 7
;
': :S.. Sr 'we .... t, ...,- v., -- yy, ... y y
yy, ..,,' 1 t... J.......,
,....y.
:,..;, .1:.. ..e.., ,..45 .-
..., .......4Y
. -a...4.., .. .... ff. 47,. 7.
3 ,,,, ....% corre....9..,, ....
Mc 0,.....,fo4:44 4
1 v.... wrwww z
z .... .
Yuen. ..'..,.. r '44.. .( . ,',. 5 ....row
'A...., -I, ., ,,,,,,,,,S, ,... ,,.
Nn +41... - r:. ....p ,...1 te l,.... , ..y t, 1:: 0,. A.
-....s c ... . ,. . 5 ,-,...., . 'or', `I ,eorel Ser
'
!,,.. c: tr vs-. ...... C:2
.., C,...c
C<1 >,.. .72...fss ,.. :,:r. r.1 A , 1, I ,, .., eft*. J 0 4177 ,,..4 ^ Yr 0 AMth ctC.,,, . . ; , ; % 0 see,. .' Alit - ,f3 ,C Al
-...,;.,.....T.,..
A., .,..; ...r... -.'' 1
..2er on ,...50 .,..1, %MI .1.7! Dee .2 190^',.,94 :
K
i
APPENDIX C
Annual Pupil Transpprtation Report (APTR) '
e
. .,
enr
,.,.
/87
.
e'
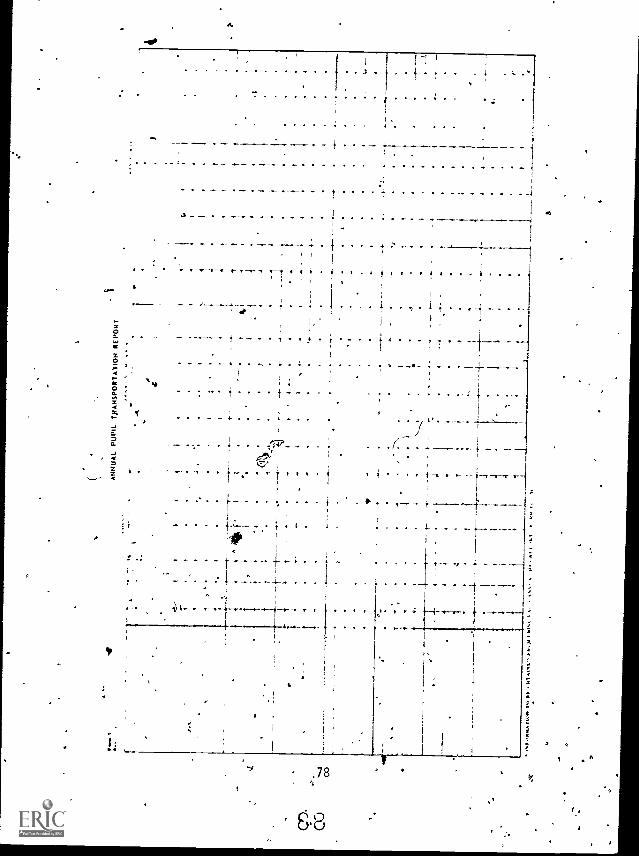
t t 4.4
:A
NN
UA
L P
UP
IL T
RA
NS
PO
RT
AT
ION
RE
PO
RT
'1
4
H.
4
I4
.
I1
`-k
I
4-
. 44
1-.
i.__
_....
.._
-.
i
.4I
'
4I
I
4
Nro
auw
TW
O*
1%)
NI A
LNV
"N
s 4.
1ar
m.
titN
a.t w
1te
s1
-
4
t.
APPENDIX Di
Questionnaire to Schooi Bus-Drivers.
s9
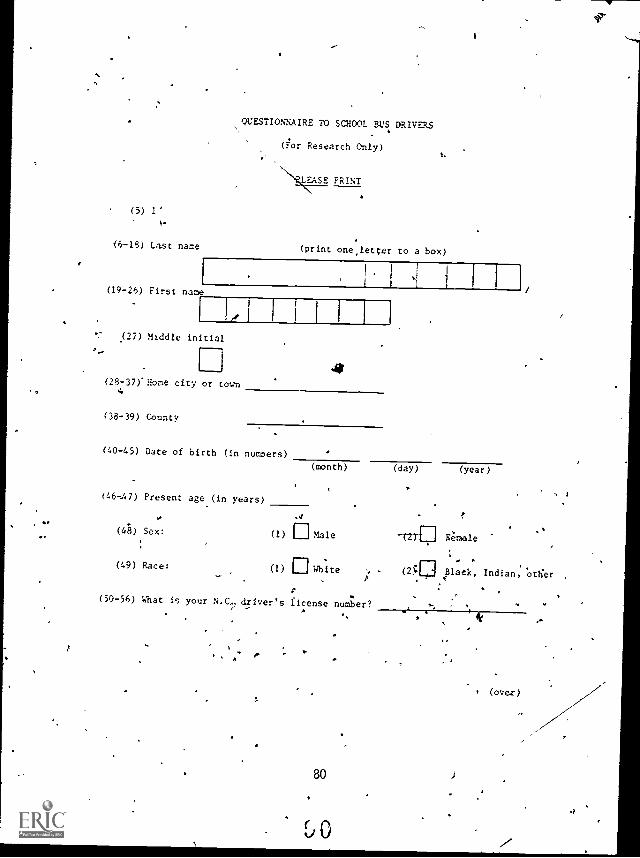
(5) 1'
(6 -18) Last name
(19-26) First na
QUESTIONNAIRE TO SCHOOL BUS DRIVERS
(ror Research Only)
NctsE PRINT
(print one,letcer to a box)
fi(27) Middle initial
(28-37)' Hone city or town
(38-39) County
(40-48) Date of birth (in numoers)
(month) (day) (year)
;(46,47) Present age (in years)
.4
(4A) Sex: (1) Male -r2)"(:] Eemale
(49) Race: (1) White (2.47,] Black, Indian, Otfier
(50-56) What is your N.C, driver's license number?A
80
' (over)
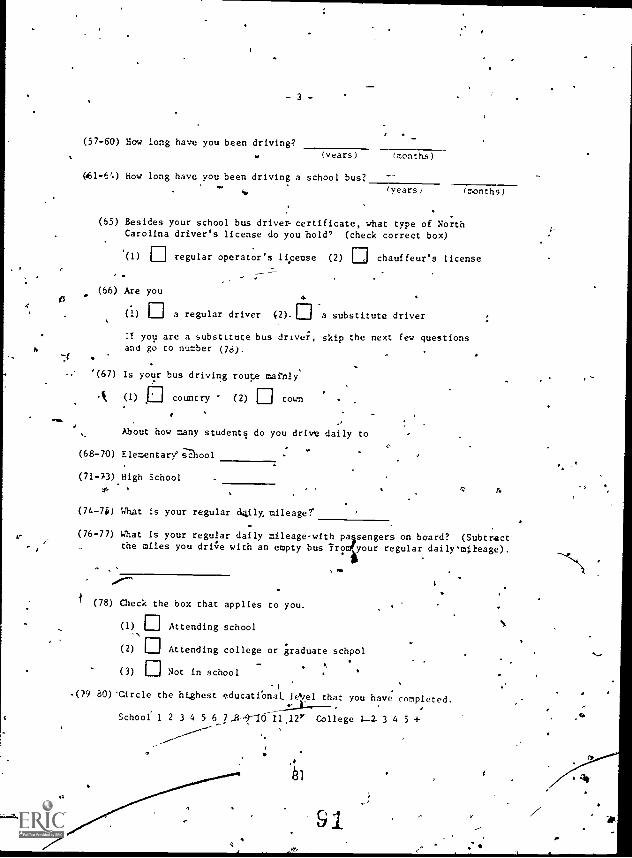
- 3 -
(57-60) How long have you been driving?
(Years) (months)
(61-6:) How long have you been driving a school bus?
(years) (months)i.
(65) Besides your school bus driver- certificate, what type of NorthCarolina driver's license do you hold', (check correct box)
.(1) regular operator's license (2) 1-1 chauffeur's license
. .
(66) Are you.
(1) a regular driver a substitute driver
If you are a substitute bus driver, skip the next few questionsand go to number (78).
'(67) Is your bus driving route mainly
k (1) country ' (2) town
About how many students do you drive daily to
(68-70) Elementary' ;1'11001
(71 -73) High School
x, r.
(74-71)) What is your regular a401, mileage?
(76-77) What is your regular daily mileage -with palsengers on board? (Subtractthe miles you drOe with an empty bus Tromiriyour regular dailymileage).
S
(78) Check the box that applies to you.
(1) Attending school
(2) Attending college or graduate schpol
(3) Not in school
-(79 80)-Circle the highest educatiOnaL 10,,e1 that you have completed.
Schoof 1 2 34 5 67,8-1-101-21,12" College 1.-2 3 4 5 +.41
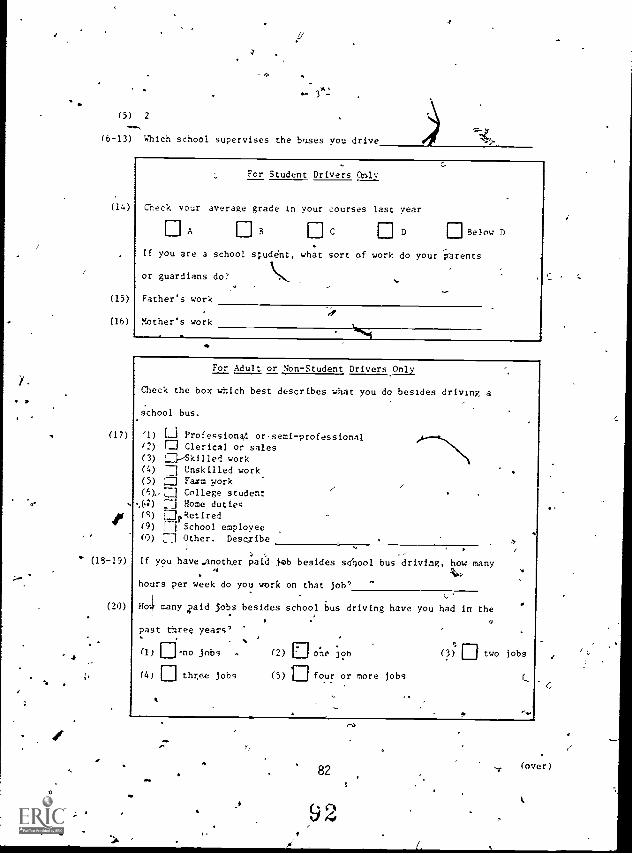
V
4
3 -
(5) 2
-.(6-13) Which school supervises the buses you drive
(14)
(15)
(16)
(17)
(13-19)
(20)
For Student Drivers Only
Check your average grade in your courses last year
A3
If you are a school nudent,
or guardians do?
Father's work
Mother's work
0 C 11:1 D Below D
what sort of work do your parents
For Adult or Non-Student Drivers Only
Check the box which best describes that you do besides driving a
school bus.
'1) L.-1 Professiona4 or,semi-professional(2) P Clerical or sales(3) 1 ,skilled work
(4) El Unskilled work(5) -n Faxm work(s)..:1 College student
..(4) :1 Home duties(4) O(,Retired(9) 11 School employee(0) 71 Other. Describe
If you have.another paid Job besides sdiwol bus driving, how many;hours per week do you work on that Job/
Ho4 many .paid Sobs besides school bus driving have you
past three years'
(1) 0-no jobs
(4) 0 three jobs
(2) 0 one Job
(5) Cl four or more jobs
had in the
9
r-1(?) L.' two jobs
1.
Al%
82
9
r-4
-r
I
(over)
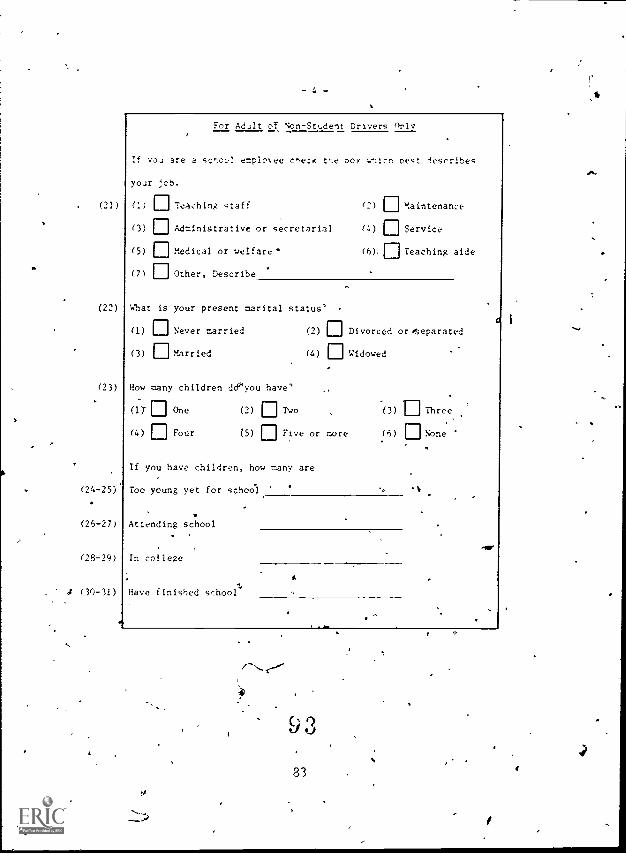
. (21)
(22)
(23)
(24-25).
(25-27)
(28-29)
a (30-31)
For AdJlt of. Son-St..dent Drivers cb-lv
If vos are a cc ^cc1 emploNee c,ecK te DOY wnicn oest describes
your ;cb.
(1) T eaching staff (2) ..aintenanco
(3) Administrative or secretarial f4) Service
(5) Medical or welfare (5), Teaching aide
(7) Other, Describe
What is your present marital status'
(1) N ever married
(3) Married
(2) Divorced or fseparated
(4) Widowed
How many children deyou have'
(l)' O ne (2) Two
(4) Four (5) Five or more
If you have children, how many are
Too young yet for sch001 '
Attending school
In college
Have finished school
(3) '0 Three
(5) None
!
0
83
APPENDIX E
Map of Counties in Questionnaire Sample ,
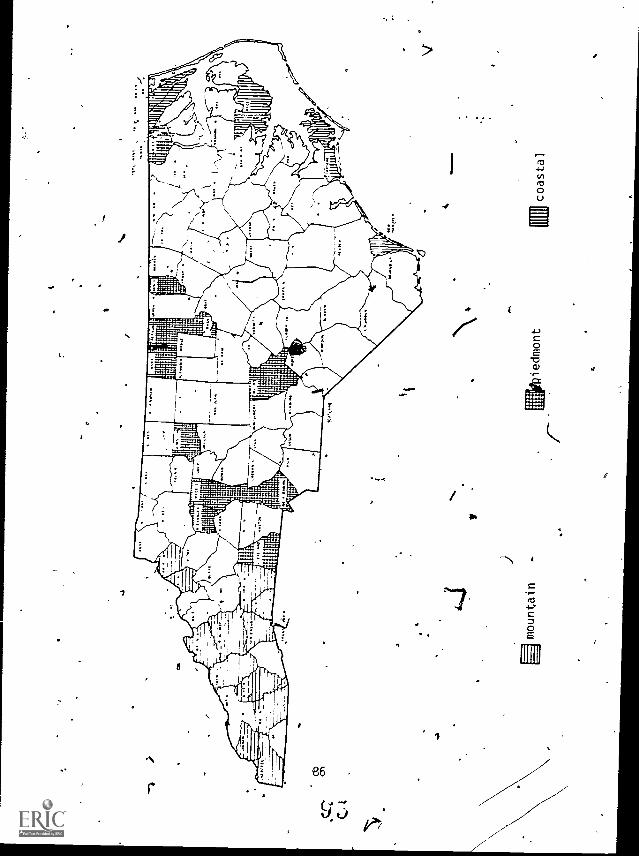
A
4uotupal.u!.e4unotti
..t_
.
APPENDIX F
Number of Accidenits and Jotal Numb,er ofDriversit Each Age Group
9.0
c .
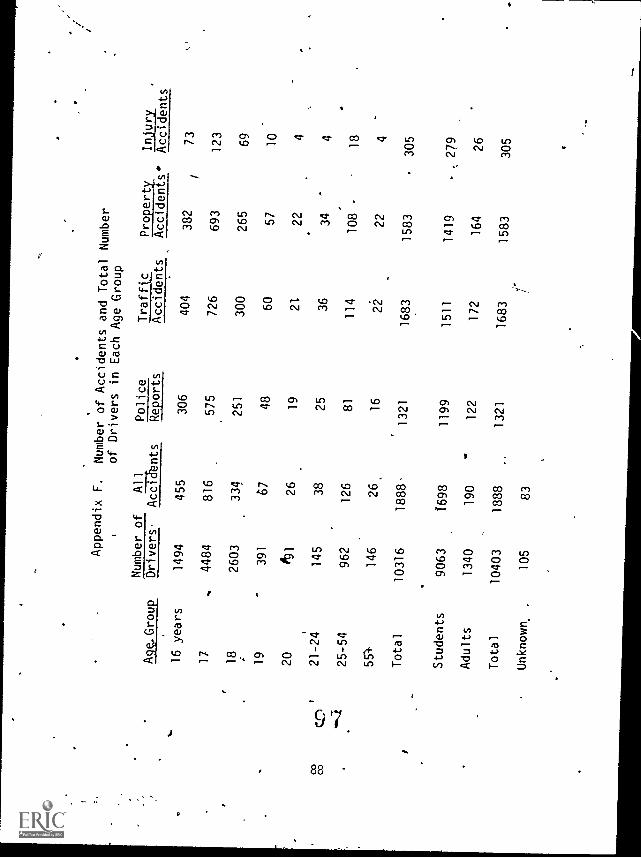
#11
...
Age. Group
Appendix F.
Number of Accidents and
Total Number
of Drivers in Each
Age Group
Number of
All
Police
Traffic
Property
Injury
Drivers
.
ACE-Cants
Reports
Accidents
Accidents' Accidents
16 years
1494
455
306
404
382
73
17
-.
4484
816
575
726
693
123
18
2603
334
251
300
265
69
19
391
67
48
60
57
10
20
'91
26
19
21
22
4
21-24
145
38
25
36
34
4
25-54
962
126
81
114
108
18
551
146
26
16
22
22
4
Total
10316
1888
1321
1683
1583
-305
Students
9063
1698
1199
1511
1419
..279
Adults
1340
190
..
122
172
164
26
Total
10403
1888
1321
1683
1583
305
Unknown
105
83
7
APPENDIX G
Statistical Explanation of Chi-Square Used(Written by Dr;,..Yosephj-lochbe*rg)
98
4
4,
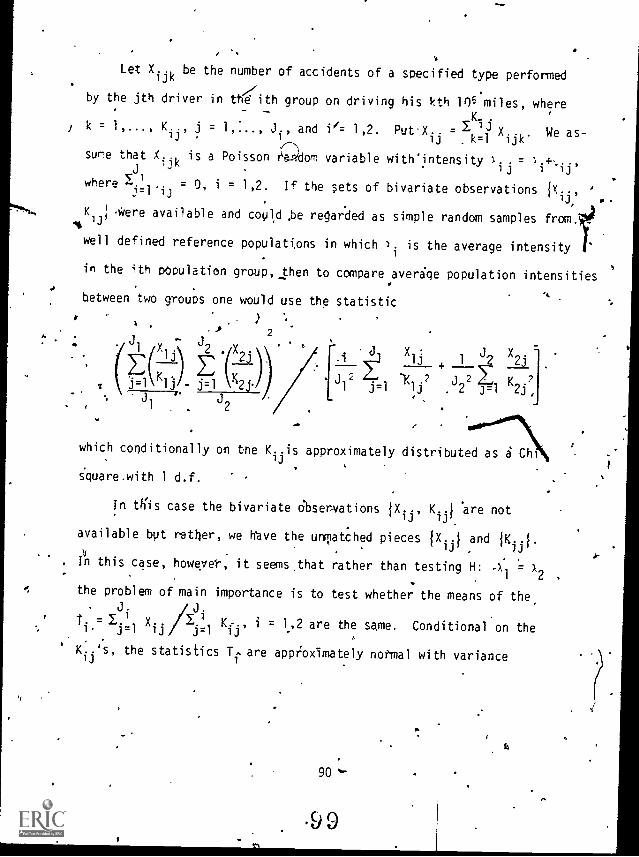
Let Xijk
be the number of accidents of a specified type performed
by the jth driver in the ith group on driving his kth 106 miles, where
K.;, J
i'and i/= 1,2. PutXij i1s;
ijk'X We as-
/Thsure that X
ijk is a Poisson ra_ndom variable with'intensityij
=i ij'
VJwhere
j=1 "ij =0, i = 1,2. If the sets of bivariate observations IX. I
Klji
I Were available and could be regarded as simple random samples from..*4
well defined reference populations in which )iis the average intensity
in the ith population group, then to compare average population intensities,
-,between two groups one would use the statistic
X , ) %1 .
2J ,
X1j..) 11.11)= C2j.)
, ,
J X :
__IL 1 2X
j 2 4 -K 2 j 2 Z K .2, j=A j1
.c..1 21
1 j=1 lj , 2 j=1 2j,
J
K1ji-
.
-
J1
J2
which conditionally on tne Kijis approximately distributed as S Chi
square.with 1 d.f.
In this case the bivariate Observations 1Xii, KO are not
available but nether, we hive the unlatched pieces {Xii} and
. In this case, however, it seems,that rather than testing H: = .2
1 the problem of main importance is to test whether the means of theJ. J.
1= /j1
1 ijxj1
ij'i = 1,2 are the same. Conditional on the, ==
Kij
's, the statistics T. are app:oximately normal with variance
90 %-
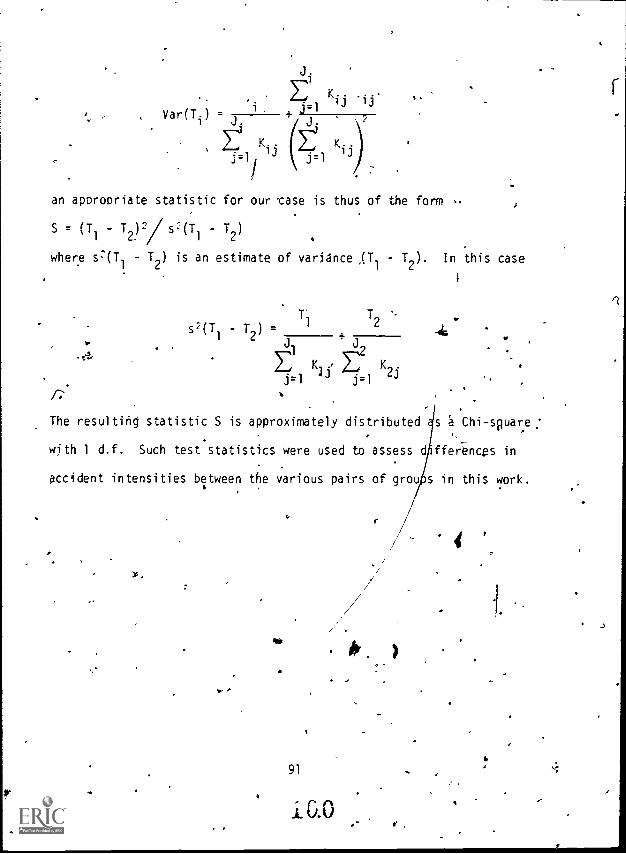
an appropriate statistic for our ase is thus of the form
S = (71 - 72)V - 72)
I
where s2(71 - 72) is an estimate of variance ,(712). In this case
s2(71
- 72
) =+
J0
J
j=1
Klj
j=1
72 4
The resulting statistic S is approximately distributed 4s a Chi-spare:
with 1 d.f. Such test statistics were used to, assess differences in
accident intensities between the various pairs of grou s in this work.
.-
91
1.0.0
r
. 4
I
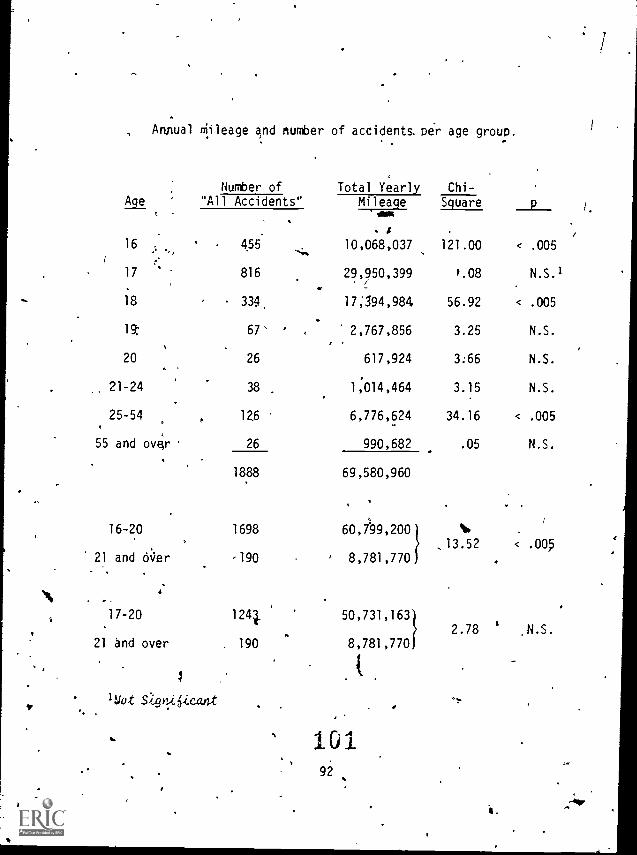
Annual
,
Age
Mileage and number
Number of
of accidents. per age group.
Total Yearly Chi-
1
All Accidents" Mileage Square
$
16.....,
/
455-:,
10,068,037 121.00 < .005
17.
816 29,950,399 .08 N.S.1. .
18 , 334, 17;594,984 56.92 < .005
lg 67' 2,767,856 3.25 N.S.
20 26 617,924 3.66 N.S.
21-24 38 1,014,464 3.15 N.S.
25-54 126 6,776,624 34.16 < .005
55 and ovcir 26 990,682 .05 N.S.
1888 69,580,960
/
16-20 1698 60,799,209,13.52 < .005
21 and over -190 8,781,770
ti
17-20 124. 50,731,1632.78 N.S.
21 and over . 190 8,781,770
1
lUct SZ9ni6icant
10192

I.
. ..
. ,
APPENDIX H
Number of Fatalities and Injuriesin Each Accident Bus Driver Age Group,'
r
f
0 0r-
r
I.
. "
"......" -
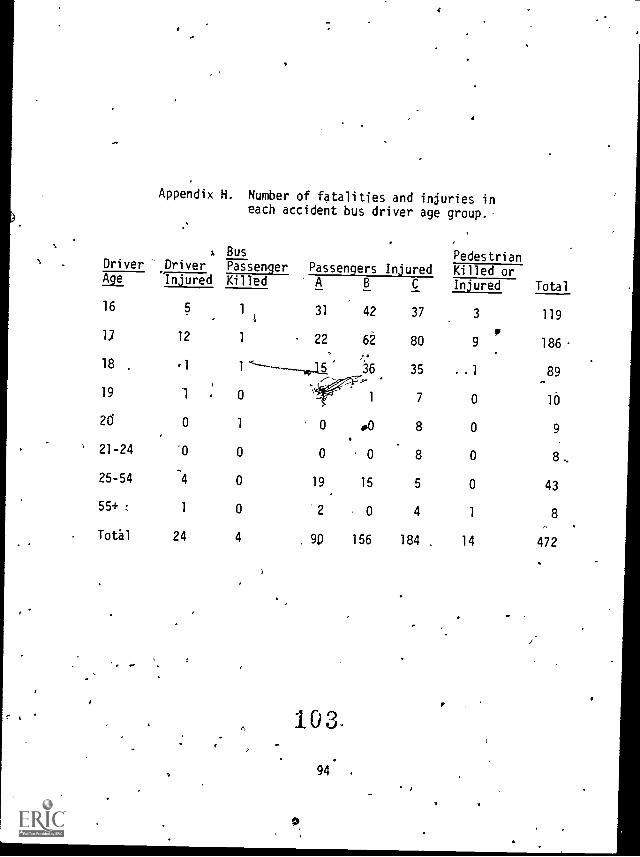
Appendix H. Number of fatalities and injuries ineach accident bus driver age group.
I
Driver-DriverPass"gerRasserigershijured
Bus Pedestrian
Total
Killed orLt Injured Killed A B C Injured
16 5 1 31 42 37 3 119i
9,12 12 1 22 62 80 9 186
,
18 .11 -----------15 36 35 1 89
19 1 0 1 7 0 10
26 0 1' 0 #0 8 0 9
21-24 .0 0 0 0 8 0 8 ,
25-54 4 0 19 15 5 0 43
55 +c 1 0 '2 0 4 1 8n
Total 24 4 9p 156 184 14 472
I. 0 e.3.
94


![Ana Paula Rocha - UPeol/TNE/APONT/Ontologies.pdf · Ana Paula Rocha Electronic Business Technologies TNE Motivation Battery ... [Uschold e Jasper, 1999] 5 TNE What is an ontology?](https://static.fdocuments.us/doc/165x107/5be6b4c809d3f23a518d4add/ana-paula-rocha-up-eoltneapont-ana-paula-rocha-electronic-business-technologies.jpg)