© Environment Analyst 2018 1 - Amazon Web Services · 2. List of figures Fig 1 Major UK EC...
12
Transcript of © Environment Analyst 2018 1 - Amazon Web Services · 2. List of figures Fig 1 Major UK EC...


UK Market Assessment 2018/19
© Environment Analyst 2018 1
This market assessment was produced by:
Liz Trew Editorial Director, Market Intelligence Service
Anya Hembrough Senior Analyst
Ross Griffiths Senior Analyst
Charlotte Edwards Analyst
Stuart Foxon Research Director
Julian Rose Managing Director
Thanks to the environmental consulting firms that have assisted us by responding to our surveys, participating in email/phone/face-to-face interviews and verifying/commenting on their company profiles.
Great care has been taken to ensure the accuracy of the information in this edition of the report at the time of publishing; however, changes may have occurred since then. Environment Analyst cannot accept liability for errors or omissions of any kind. We are undertaking an ongoing process of verification of the content – if you do wish to pass on any updated company information or discuss any aspect of the report, please contact Environment Analyst (details above).
Copyright notice
© 2018 Environment Analyst Ltd. All rights reserved.
Distribution policy
Strictly not for distribution outside the licensed organisation or beyond the specified team. This report is licensed on a “per user” basis, and is sold on the basis that users may not redistribute content to colleagues or anyone else without explicit consent from the publisher. Please contact Environment Analyst to discuss wider distribution options.
Disclaimer
While Environment Analyst takes every effort to ensure the accuracy of data, we cannot take responsibility for any adverse consequences arising from actions taken in response to our content and we recommend that readers take appropriate professional advice.
If you have any queries, comments or feedback, please contact:
Liz Trew
Email: [email protected]
Tel: 020 3603 2106
Environment Analyst Ltd Talbot House Market Street Shrewsbury SY1 1LG United Kingdom
Web: www.environment-analyst.com
Tel: 01743 818008 (switchboard)

UK Market Assessment 2018/19
© Environment Analyst 2018 2
1. Contents
1. Contents ............................................................................................................................................. 2
2. List of figures ..................................................................................................................................... 3
3. About.................................................................................................................................................. 6 3.1 Environment Analyst ............................................................................................................................................. 6 3.2 Report methodology and definitions ................................................................................................................... 6 3.3 Acknowledgements ................................................................................................................................................. 6 3.4 Accessing UK Top 28 Company Profiles and other reports in series ........................................................... 6
4. Market assessment overview ............................................................................................................. 7 4.1 Headline findings .................................................................................................................................................... 7 4.2 Recent market development.................................................................................................................................. 8 4.3 Current state of the market ................................................................................................................................... 9 4.4 Build it and they will come .................................................................................................................................. 10 4.5 ‘Austerity coming to an end’ ............................................................................................................................... 11 4.6 The fantastic five ................................................................................................................................................... 11 4.7 Expectations for 2018 and 2019 ......................................................................................................................... 11 4.8 Industry financial benchmarks and KPIs .......................................................................................................... 12 4.9 Company insights .................................................................................................................................................. 13 4.10 Infrastructure & development in overdrive, while government revenues back on tap ............................. 18 4.11 EIA, ecology and water dominate service area performance ........................................................................ 20 4.12 Five-year forecast raised to 3.0% CAGR despite Brexit uncertainty............................................................ 23
5. Market overview tables .................................................................................................................... 28
6. Top 28 aggregated data ................................................................................................................... 29
7. Top 28 environmental consulting revenue ...................................................................................... 34
8. Top 28 environmental consulting staff ............................................................................................ 42
9. Top 28 UK EC offices ...................................................................................................................... 46
10. Top 28 UK EC contracts .................................................................................................................. 47
11. Top 28 environmental services, including consulting ..................................................................... 49
12. Top 28 other environmental services (excluding consulting) ......................................................... 53
13. Top 28 group revenue and staff trends ............................................................................................ 57
14. Top 28 global environmental consultancy revenue and staff trends ............................................... 62
15. Wider market benchmark data ........................................................................................................ 66
16. Service area market data .................................................................................................................. 67
17. Service area consultancy rankings ................................................................................................... 71
18. Client sector market data ................................................................................................................. 77
19. Client sector consultancy rankings .................................................................................................. 79
20. Forecasts .......................................................................................................................................... 82
20. Growth in firms and location of industry charts .............................................................................. 84
21. Market revenue growth (vs. GDP) and structure charts .................................................................. 85
22. Top 28 charts ................................................................................................................................... 86
23. Questionnaire respondents charts ................................................................................................... 89
24. Work area charts .............................................................................................................................. 90
25. Client sector charts .......................................................................................................................... 97

UK Market Assessment 2018/19
© Environment Analyst 2018 3
26. Forecast charts ................................................................................................................................. 99
2. List of figures
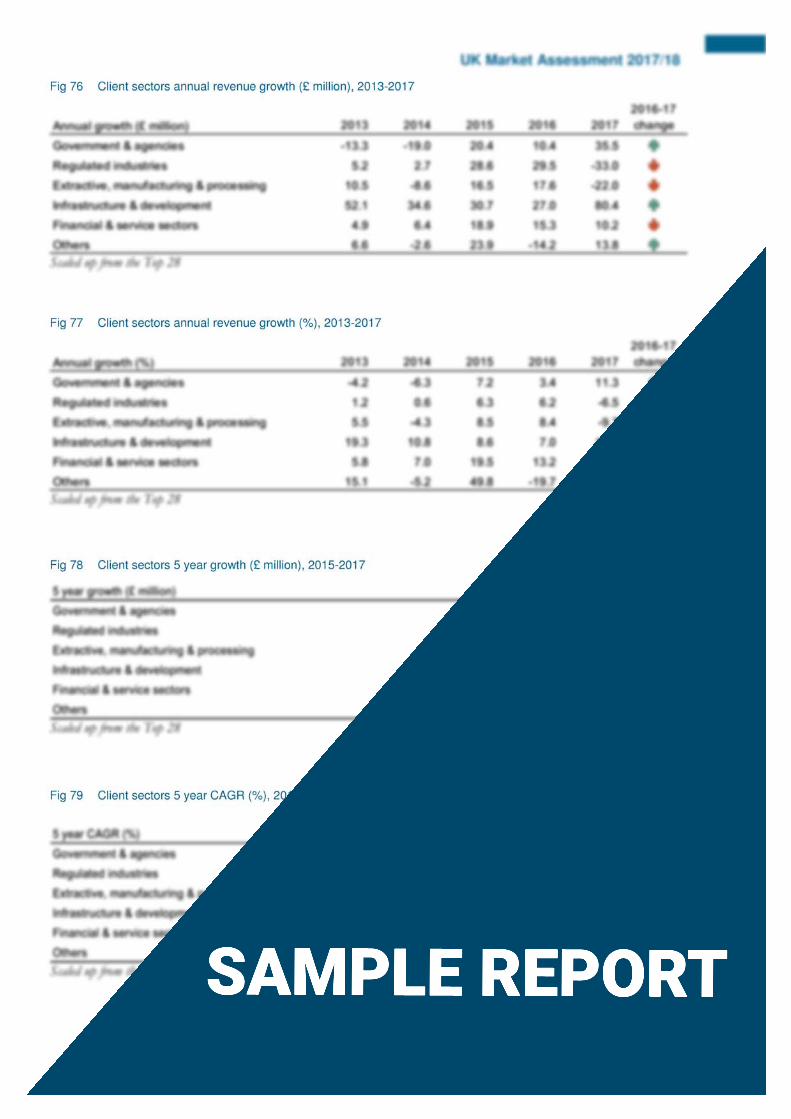
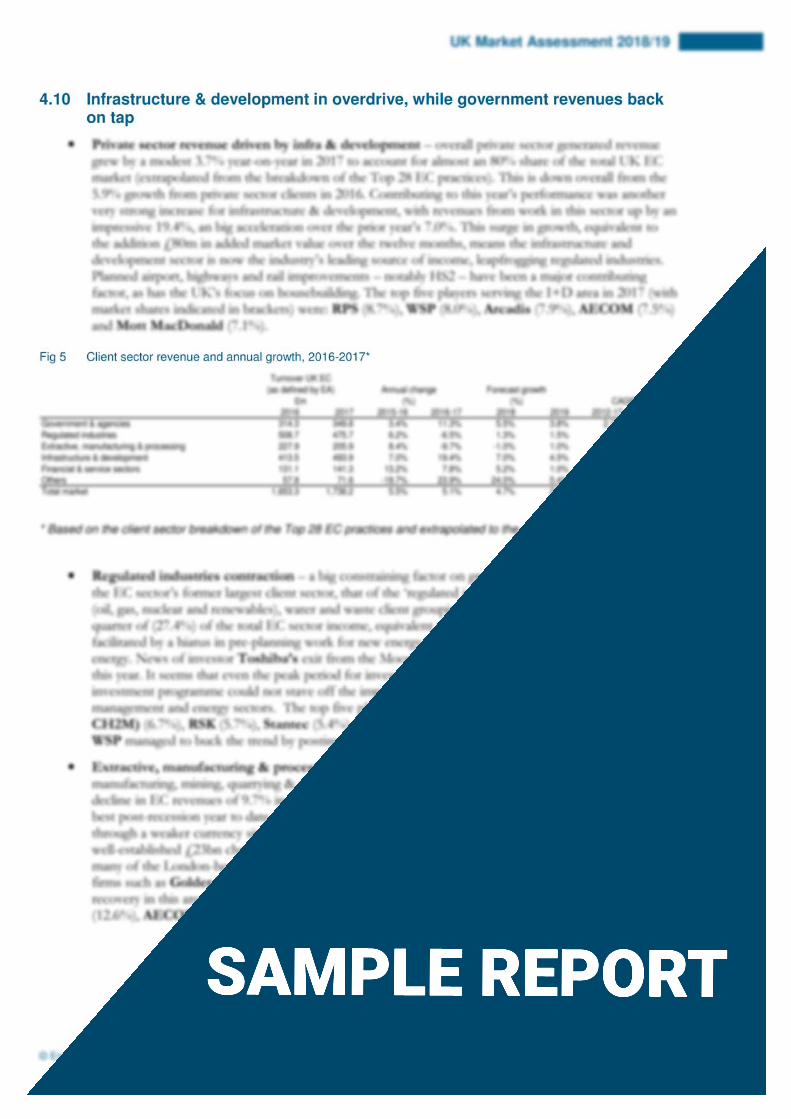
Fig 1 Major UK EC acquisitions 2016-2018 ................................................................................................................ 8 Fig 2 UK environmental consulting market revenues and annual growth, 2007-2022e ....................................... 9 Fig 3 Market share change of the Top 5 EC firms in 2017, since 2008 ................................................................. 16 Fig 4 Top 28 EC revenues, growth, staff and market share, 2016-2017 ................................................................ 17 Fig 5 Client sector revenue and annual growth, 2016-2017* ................................................................................... 18 Fig 6 Client sector gross added EC revenue 2016-17 ............................................................................................... 19 Fig 7 Client sector market leaders, 2017...................................................................................................................... 20 Fig 8 Service area revenues, annual growth and market forecasts, 2016-2022 ..................................................... 21 Fig 9 Service area gross added EC revenue 2016-17 ................................................................................................. 22 Fig 10 Service area market leaders, 2017 ....................................................................................................................... 22 Fig 11 Forecast value added to service areas between 2017-2022 ............................................................................ 26 Fig 12 Forecast value added to client sectors between 2017-2022 ........................................................................... 27 Fig 13 EC market data, 2013-2017 ................................................................................................................................. 28 Fig 14 Lastest reporting period ....................................................................................................................................... 29 Fig 15 Top 28 aggregated revenue metrics, 2013-2017 ............................................................................................... 30 Fig 16 Top 28 aggregated staff metrics, 2013-2017 ..................................................................................................... 31 Fig 17 Top 28 aggregated contracts metrics, 2013-2017 ............................................................................................ 32 Fig 18 Top 28 aggregated office numbers, 2015-2017 ................................................................................................ 32 Fig 19 Key metrics of Top 28 environmental consultancies in UK, 2016-2017..................................................... 33 Fig 20 Top 28 EC revenue, 2013-2017 .......................................................................................................................... 34 Fig 21 Top 28 EC revenue ranking, 2013-2017 ........................................................................................................... 35 Fig 22 Top 28 EC market share (%), 2013-2017 ......................................................................................................... 36 Fig 23 Top 28 EC annual revenue growth (£ million), 2013-2017 ........................................................................... 37 Fig 24 Top 28 EC revenue growth, 2013-2017 ............................................................................................................ 38 Fig 25 Top 28 5 year absolute EC revenue growth, 2013-2017 ................................................................................ 39 Fig 26 Top 28 5 year EC revenue CAGR, 2013-2017 ................................................................................................ 40 Fig 27 Top 28 5 year EC absolute revenue growth %, 2013-2017 ........................................................................... 41 Fig 28 Top 28 EC staff numbers, 2013-2017 ............................................................................................................... 42 Fig 29 Top 28 EC staff change, 2013-2017 .................................................................................................................. 43 Fig 30 Top 28 EC revenue per head, 2013-2017 ......................................................................................................... 44 Fig 31 Top 28 EC revenue per head change, 2014-2017 ............................................................................................ 45 Fig 32 Top 28 UK office numbers, 2013-2017 ............................................................................................................ 46 Fig 33 Top 28 UK EC contracts, 2013-2017 ................................................................................................................ 47 Fig 34 Top 28 UK EC average contract value, 2013-2017 ........................................................................................ 48 Fig 35 Top 28 environmental services (including consulting) revenue, 2013-2017 ............................................... 49 Fig 36 Top 28 environmental services (including consulting) rank, 2013-2017 ..................................................... 50 Fig 37 Top 28 environmental services (including consulting) annual revenue growth (£ million), 2013-
2017 ......................................................................................................................................................................... 51 Fig 38 Top 28 environmental services (including consulting) revenue growth (%), 2013-2017 .......................... 52 Fig 39 Top 28 other environmental services (excluding consulting) revenue, 2013-2017 .................................... 53 Fig 40 Top 28 other environmental services (excluding consulting) rank, 2013-2017 .......................................... 54 Fig 41 Top 28 other environmental services (excluding consulting) annual revenue growth (£ million),
2014-2017 ............................................................................................................................................................... 55 Fig 42 Top 28 other environmental services (excluding consulting) annual revenue growth (%), 2014-
2017 ......................................................................................................................................................................... 56 Fig 43 Top 28 UK group revenue, 2013-2017 ............................................................................................................. 57 Fig 44 Top 28 UK group rank, 2013-2017 ................................................................................................................... 58 Fig 45 Top 28 UK group annual revenue growth (£ million), 2014-2017 ............................................................... 59 Fig 46 Top 28 UK group annual revenue growth (%), 2014-2017 ........................................................................... 60 Fig 47 Top 28 UK group staff numbers, 2013-2017 ................................................................................................... 61 Fig 48 Top 28 global environmental consultancy revenue, 2013-2017 .................................................................... 62

UK Market Assessment 2018/19
© Environment Analyst 2018 4
Fig 49 Top 28 global EC revenue ranking*, 2013-2017 ............................................................................................. 63 Fig 50 Top 28 global EC annual revenue growth (£ million), 2014-2017 ............................................................... 64 Fig 51 Top 28 global EC annual revenue growth (%), 2014-2017 ............................................................................ 65 Fig 52 Benchmark key performance indicators of selected consultancies, 2017* .................................................. 66 Fig 53 Service areas annual revenue (£ million), 2013-2017 ...................................................................................... 67 Fig 54 Service areas ranking, 2013-2017 ........................................................................................................................ 67 Fig 55 Service areas market share, 2013-2017 .............................................................................................................. 68 Fig 56 Service areas annual revenue growth (£ million), 2013-2017 ........................................................................ 68 Fig 57 Service areas annual revenue growth (%), 2013-2017 ..................................................................................... 69 Fig 58 Service areas 5 year growth (£ million), 2013-2017 ......................................................................................... 69 Fig 59 Service areas 5 year CAGR (%), 2013-2017 ..................................................................................................... 70 Fig 60 Service areas 5 year absolute growth (%), 2013-2017 ..................................................................................... 70 Fig 61 The top 20 firms in air quality consultancy ...................................................................................................... 71 Fig 62 The top 20 firms in climate change & energy consultancy ............................................................................ 71 Fig 63 The top 20 firms in contaminated land/remediation consultancy ............................................................... 72 Fig 64 The top 20 firms in ecological/landscape services consultancy .................................................................... 72 Fig 65 The top 20 firms in EIA & sustainability consultancy .................................................................................... 73 Fig 66 The top 20 firms in environmental liabilities, risks & hazards consultancy ................................................ 73 Fig 67 The top 20 firms in environmental management & compliance consultancy ............................................ 74 Fig 68 The top 20 firms in noise & vibration ............................................................................................................... 74 Fig 69 The top 20 firms in environmental/sustainability policy & strategy consultancy ...................................... 75 Fig 70 The top 20 firms in waste management/recycling .......................................................................................... 75 Fig 71 The top 20 firms in water quality & resource management consultancy ..................................................... 76 Fig 72 The top 20 firms in other environmental consultancy ................................................................................... 76 Fig 73 Client sectors annual revenue (£ million), 2013-2017 ..................................................................................... 77 Fig 74 Client sectors ranking, 2013-2017 ...................................................................................................................... 77 Fig 75 Client sectors annual revenue share (%), 2013-2017 ....................................................................................... 77 Fig 76 Client sectors annual revenue growth (£ million), 2013-2017 ....................................................................... 78 Fig 77 Client sectors annual revenue growth (%), 2013-2017 ................................................................................... 78 Fig 78 Client sectors 5 year growth (£ million), 2015-2017 ....................................................................................... 78 Fig 79 Client sectors 5 year CAGR (%), 2015-2017 .................................................................................................... 78 Fig 80 Client sectors 5 year absolute growth (%), 2015-2017 .................................................................................... 79 Fig 81 The top firms working for government & agencies ........................................................................................ 79 Fig 82 The top firms working for regulated industries ............................................................................................... 80 Fig 83 The top firms working for extractive, manufacturing & processing clients ................................................ 80 Fig 84 The top firms working infrastructure and development clients .................................................................... 81 Fig 85 The top firms working for financial & service sectors clients ....................................................................... 81 Fig 86 The top firms working for other clients ............................................................................................................ 82 Fig 87 Forecast revenue 2017-2022 ............................................................................................................................... 82 Fig 88 Forecast service area revenue 2017-2022 .......................................................................................................... 82 Fig 89 Forecast service area growth, 2018-2022 .......................................................................................................... 83 Fig 90 Forecast client sector revenue 2017-2022 ......................................................................................................... 83 Fig 91 Forecast client sector growth, 2018-2022 ......................................................................................................... 83 Fig 92 Growth in the number of UK environmental consultancies ......................................................................... 84 Fig 93 UK branch office distribution (Top 28) ............................................................................................................ 84 Fig 94 UK environmental consulting market revenues and annual growth, 2007-2022e ..................................... 85 Fig 95 UK environmental consulting growth vs GDP growth, 2007-2017 ............................................................ 85 Fig 96 Market structure: 2017 environmental consulting revenues by size of firm ............................................... 86 Fig 97 Market structure: 2017 EC market breakdown by consultancy type ............................................................ 86 Fig 98 Top 28 UK turnover growth, EC vs. group, 2016-2017 ................................................................................ 86 Fig 99 Top 28 global turnover growth, EC vs. group, 2016-2017 ............................................................................ 86 Fig 100 Global v UK EC revenues of the Top 28 UK environmental consultancies, 2013-2017 ........................ 87 Fig 101 Revenue derived from overseas projects by Top 28 UK environmental consultancies, 2017 ................. 87 Fig 102 Top 28 UK EC staff change, 2013-2017 .......................................................................................................... 87 Fig 103 Top 28 UK staff change, 2016-2017.................................................................................................................. 87 Fig 104 Top 28 global staff change, 2016-2017 ............................................................................................................. 88
UK Market Assessment 2018/19
© Environment Analyst 2018 5
Fig 105 Top 28 UK turnover per head, 2016-2017 ....................................................................................................... 88 Fig 106 Top 28 global turnover per head, 2016-2017 ................................................................................................... 88 Fig 107 Top 28 number of contracts, 2016-2017 .......................................................................................................... 88 Fig 108 Top 28 average contract value, 2016-2017 ....................................................................................................... 89 Fig 109 Average revenue per employee, by size of consultancy, 2015-2017 ............................................................. 89 Fig 110 Average project value, by size of consultancy, 2015-2017 ............................................................................. 89 Fig 111 Related services offered by EC players ............................................................................................................. 90 Fig 112 Market revenue breakdown by service area 2016-2017 .................................................................................. 90 Fig 113 Proportion of market revenue in each service area, 2016-2017 .................................................................... 90 Fig 114 Revenue growth in each service area, 2016-2017 ............................................................................................ 91 Fig 115 CAGR in each service area, 2013-2017 ............................................................................................................. 91 Fig 116 Absolute revenue growth in each service area, 2013-2017 ............................................................................. 91 Fig 117 Numbers of professional staff (full-time equivalent) in each service area, 2017 ........................................ 92 Fig 118 Revenue per head in each service area, 2017 .................................................................................................... 92 Fig 119 Historic revenue growth in top 4 service areas, 2007-2017 ........................................................................... 92 Fig 120 Historic revenue growth in mid 4 service areas, 2007-2017 .......................................................................... 92 Fig 121 Historic revenue growth in low 4 service areas, 2007-2017 ........................................................................... 93 Fig 122 Market share of top ten firms by service area, 2016-2017 ............................................................................. 93 Fig 123 Historic revenue and growth rates in air quality consultancy, 2007-2018e ................................................. 93 Fig 124 Historic revenue and growth rates in climate change & energy consultancy, 2007-2018e ....................... 93 Fig 125 Historic revenue and growth rates in contaminated land consultancy, 2007-2018e .................................. 94 Fig 126 Historic revenue and growth rates in ecological/land services consultancy, 2007-2018e ........................ 94 Fig 127 Historic revenue and growth rates in EIA & sustainable development consultancy, 2007-2018e .......... 94 Fig 128 Historic revenue and growth rates in environmental liabilities, risks & hazards consultancy, 2007-
2018e ....................................................................................................................................................................... 94 Fig 129 Historic revenue and growth rates in environmental management & compliance consultancy,
2007-2018e ............................................................................................................................................................. 95 Fig 130 Historic revenue and growth rates in environmental noise & vibration consultancy, 2007-2018e ......... 95 Fig 131 Historic revenue and growth rates in environmental/sustainability policy & strategy consultancy,
2007-2018e ............................................................................................................................................................. 95 Fig 132 Historic revenue and growth rates in waste management/recycling consultancy, 2007-2018e ............... 95 Fig 133 Historic revenue and growth rates in water quality & resource management consultancy, 2007-
2018e ....................................................................................................................................................................... 96 Fig 134 Historic revenue and growth rates in other consultancy services, 2007-2018e .......................................... 96 Fig 135 Proportion of revenue in each client sector, 2015-2017 (Top 28) ................................................................ 97 Fig 136 CAGR in each client sector 2013-2017 (Top 28) ............................................................................................ 98 Fig 137 Proportion of revenue in each client sub-sector, 2016-2017* ....................................................................... 98 Fig 138 Indicative revenue change in each client sub-sector, 2016-2017* ................................................................. 98 Fig 139 Environment Analyst forecast market revenue, 2006-2022 ........................................................................... 99 Fig 140 Additional annual market revenue, 2007-2022 ................................................................................................. 99 Fig 141 Additional revenue forecast in each service area, 2017-2022 ........................................................................ 99 Fig 142 Forecast CAGR in each service area, 2017-2022 ............................................................................................. 99 Fig 143 Forecast revenue growth in top 4 service areas, 2017-2022 ........................................................................ 100 Fig 144 Forecast revenue growth in mid 4 service areas, 2017-2022 ........................................................................ 100 Fig 145 Forecast revenue growth in low 4 service areas, 2017-2022 ........................................................................ 100 Fig 146 Additional revenue forecast in each client sector, 2017-2022 ..................................................................... 101 Fig 147 Forecast CAGR in each client sector, 2017-2022 .......................................................................................... 101 Fig 148 Forecast revenue growth in client sectors, 2017-2022 .................................................................................. 101