theses.gla.ac.uktheses.gla.ac.uk/4110/1/2013saniphd.pdf · Emanuela Sani : Institute of Molecular,...
249
Glasgow Theses Service http://theses.gla.ac.uk/ [email protected] Sani, Emanuela (2013) Genome wide transcriptional changes and chromatin modifications associated with plant stress memory. PhD thesis. http://theses.gla.ac.uk/4110/ Copyright and moral rights for this thesis are retained by the author A copy can be downloaded for personal non-commercial research or study This thesis cannot be reproduced or quoted extensively from without first obtaining permission in writing from the Author The content must not be changed in any way or sold commercially in any format or medium without the formal permission of the Author When referring to this work, full bibliographic details including the author, title, awarding institution and date of the thesis must be given
Transcript of theses.gla.ac.uktheses.gla.ac.uk/4110/1/2013saniphd.pdf · Emanuela Sani : Institute of Molecular,...

Glasgow Theses Service http://theses.gla.ac.uk/
Sani, Emanuela (2013) Genome wide transcriptional changes and chromatin modifications associated with plant stress memory. PhD thesis. http://theses.gla.ac.uk/4110/ Copyright and moral rights for this thesis are retained by the author A copy can be downloaded for personal non-commercial research or study This thesis cannot be reproduced or quoted extensively from without first obtaining permission in writing from the Author The content must not be changed in any way or sold commercially in any format or medium without the formal permission of the Author When referring to this work, full bibliographic details including the author, title, awarding institution and date of the thesis must be given

Genome-wide transcriptional changes and
chromatin modifications associated with plant stress
memory
Thesis submitted for the degree of Doctor of Philosophy
Emanuela Sani
Institute of Molecular, Cellular and Systems Biology
College of Medical, Veterinary and Life Sciences
University Of Glasgow
January 2013

ii
Abstract
As sessile organisms, plants had to develop various biochemical and physiological
mechanisms to respond and adapt to abiotic stress conditions such as salt and drought
and thus acquire stress tolerance. A particular interesting mechanism is the so called
“priming effect”: an application of a mild short stress to plants at an early stage of
development appears to enable them to cope better when stressed again at mature
stage. However, the molecular effects of salt priming have not been systematically
quantified and as a consequence the molecular basis of priming remains unknown.
In this study an experimental procedure was established that allowed to test whether salt
priming of young Arabidopsis thaliana plants had an effect on plants exposed to more
severe salt stress at a later stage of development.
To quantify how primed and non-primed plants responded to the second salt stress,
global changes in their transcriptional expression profiles were monitored using
Affymetrix GeneChip ATH1 microarray. Results showed that both primed and non-primed
plants responded to the salt treatment modulating the same set of known stress
responsive genes. However, primed plants differentially regulated a smaller set of genes.
Furthermore, the vast majority of the stress responsive genes showed a weaker response
in primed than in non-primed plants. These results suggested that primed plants
channelled the stress response using only selected genes.
The next question addressed was how primed plants could “remember” the priming
treatment after a period of extensive growth. Several studies had indicated that
environmental stress induces changes in the chromatin structure thereby modifying the
accessibility of the DNA for transcription factors and other regulatory proteins. This
suggested a link between epigenetic modification and exposure of plants to stressful
conditions, where the chromatin status might act as an epigenetic mark that could be
maintained during plant growth and development. To investigate this hypothesis I carried
out a comparative analysis of the epigenetic landscapes of primed and non-primed plants
combining Chromatin Immuno-Precipitation with Illumina sequencing (ChIP-Seq).
Genome-wide profiles of H3K4me2, H3K4me3, H3K9me2 and H3K27me3 were generated
for roots and shoots of plants harvested immediately after the priming treatment. Roots
of primed plants showed indeed numerous differences in their epigenetic profiles
compared to non-primed roots, in particular at the level of H3K27me3. Therefore, I
carried out an additional ChIP-Seq experiment before the application of the second stress
to test if the priming induced changes in H3K27me3 were maintained over this period of
extensive growth. Results showed that several epigenetic differences caused by priming
were still maintained.
Finally, to elucidate the relationship between epigenetic modifications and transcriptional
responses the ChIP-Seq profiles were coupled with genome wide transcript profiles
obtained by RNA-seq. Results shown that in the non-steady state there was no clear
correlation between the differences detected at the transcriptional and at the epigenetic
level. The results identified H3K27me3 as a potential mark for salt stress memory and
they call for future studies extending both temporal and spatial resolution of epigenetic
and transcriptional changes after salt priming.

iii
Table of Contents
Abstract ........................................................................................................................ ii
Table of Contents ........................................................................................................ iii
List of Figures ............................................................................................................ viii
List of Tables ................................................................................................................. x
Acknowledgments ...................................................................................................... xiv
Author’s declaration ....................................................................................................xv
Chapter 1 : Introduction ................................................................................................ 1
1.1 Plant responses to water stress: mechanisms and strategies employed .................... 1
1.2 Effect of salt stress on the transcriptome .................................................................... 5
1.3 Concept of priming and memory in plants .................................................................. 7
1.3.1 Effect of priming on biotic stress tolerance .......................................................... 8
1.3.2 Effect of priming on abiotic stress responses ....................................................... 9
1.3.3 Does priming establish “stress memory”? .......................................................... 12
1.4 Chromatin: a dynamic and complex structure........................................................... 13
1.5 Histone acetylation in plants ..................................................................................... 16
1.6 Histone methylation in plants .................................................................................... 17
1.6.1 Histone H3 Lysine 4 ............................................................................................. 19
1.6.2 Histone H3 Lysine 9 ............................................................................................. 21
1.6.3 Histone H3 Lysine 27 ........................................................................................... 23
1.7 Dynamic alterations of histone modification profiles in plants subjected to
environmental changes .................................................................................................... 25
1.8 Aims and methodology of the thesis ......................................................................... 27
Chapter 2 : Materials and methods ............................................................................. 28
2.1 Materials .................................................................................................................... 28
2.2 Plant materials and growth conditions ...................................................................... 28
2.3 Determination of tissue ion content .......................................................................... 29
2.4 Plant treatments and sampling .................................................................................. 30

iv
2.5 RNA extraction and cDNA synthesis .......................................................................... 31
2.6 Polymerase chain reaction (PCR) and microarray hybridisation ............................... 34
2.6.1 Standard PCR ....................................................................................................... 34
2.6.2 Quantitative PCR ................................................................................................. 34
2.7 Transcriptome profiling by RNA-sequencing and microarray ................................... 36
2.8 Isolation and immune-precipitation of chromatin (ChIP) .......................................... 36
2.8.1 Tissue fixation and nuclei isolation ..................................................................... 36
2.8.2 Sonication ............................................................................................................ 37
2.8.3 Immuno-precipitation ......................................................................................... 37
2.8.4 Reverse cross-linking and DNA purification ........................................................ 38
2.9 Whole genome linear amplification ........................................................................... 40
Chapter 3 : Physiological analysis of priming ............................................................... 41
3.1 Introduction ............................................................................................................... 41
3.1.1 Background ......................................................................................................... 41
3.1.2 Aims of the chapter ............................................................................................. 42
3.1.3 Systematic optimization of an experimental protocol to test the effect of
priming on stress responses of A. thaliana .................................................................. 42
3.2 Results ........................................................................................................................ 45
3.2.1 Experimental design ............................................................................................ 45
3.2.2 Effect of priming before second stress ............................................................... 47
3.2.3 Effect of priming on plant drought tolerance ..................................................... 49
3.2.4 Effect of priming on transcriptional responses to a second salt stress treatment
...................................................................................................................................... 52
3.2.5 Effect of priming on plant sodium uptake .......................................................... 57
3.3 Discussion ................................................................................................................... 61
3.3.1 Establishment of an effective priming protocol ................................................. 61
3.3.2 Developmental stage is important to overcome of priming .............................. 62

v
3.3.3 Effect of priming on drought tolerance is additive to the effects of temperature
...................................................................................................................................... 62
3.3.4 Potential role of HKT1 in primed plants .............................................................. 63
Chapter 4 : Quantifying the effect of priming: expression profile ................................. 65
4.1 Introduction ............................................................................................................... 65
4.1.1 Background ......................................................................................................... 65
4.1.2 Aims of the chapter ............................................................................................. 66
4.2 Methods for the chapter ............................................................................................ 67
4.2.1 Statistical approaches and software used .......................................................... 67
4.3 Results ........................................................................................................................ 70
4.3.1 Quality dataset control and normalization ......................................................... 70
4.3.2 Priming induced changes in the transcriptional response .................................. 74
4.3.2.1 Data files....................................................................................................... 74
4.3.2.2 Genes differentially expressed in primed and control plants without second
stress ........................................................................................................................ 74
4.3.2.3 Genes differentially expressed upon stress in primed and control plants .. 74
4.3.2.4 Response to salt in primed and control plants ............................................ 76
4.3.2.5 Principal Component Analysis (PCA) ............................................................ 78
4.3.2.6 Analysis of Variance (ANOVA) ...................................................................... 80
4.3.2.7 Vector Analysis (VA) ..................................................................................... 83
4.3.3 Priming induces transcriptional changes in genes with specific functions ......... 87
4.3.3.1 Does priming induce an enrichment of new functional gene categories in
response to the salt stress? ..................................................................................... 90
4.3.3.2 Does priming regulate genes of specific function in response to salt stress?
.................................................................................................................................. 93
4.3.3.3 Gene categories that responded more strongly to salt upon priming ........ 94
4.3.3.4 Gene categories that responded less to the salt stress upon priming ......102
4.4 Discussion .................................................................................................................110

vi
4.4.1 Pros and cons of transcriptomics ......................................................................110
4.4.2 Primed plants show a different response to salt between roots and shoots...110
4.4.3 Primed plants respond to salt differentially from non-primed plants by
regulating less genes and/or evoking lower responses within the same genes .......111
4.4.4 Gene functions and signalling pathways affected by the priming treatment ..112
Chapter 5 : Epigenetic profile ................................................................................... 116
5.1 Introduction .............................................................................................................116
5.1.1 Background .......................................................................................................116
5.1.2 Aims of the chapter ...........................................................................................117
5.1.3 Workflow of data analysis .................................................................................118
5.2 Results ......................................................................................................................121
5.2.1 Development of an effective and reproducible Chromatin Immuno-
precipitation protocol ................................................................................................121
5.2.2 Genome wide histone modification landscape ................................................123
5.2.3 Priming affects histone modifications in a tissue specific manner ...................128
5.2.4 Effect of the priming treatment on different histone modifications in the roots
....................................................................................................................................132
5.2.4.1 Genome coverage, island number and island length for different histone
modifications ..........................................................................................................132
5.2.4.2 Identification of genome regions associated with changing in histone
methylation upon priming .....................................................................................135
5.2.4.3 Spectrum of genes with identified functions changed at the epigenetic
level upon priming .................................................................................................137
5.2.5 Genome wide profiles of histone H3K27me3 10 days after priming ...............139
5.2.5.1 Methylation coverage 10 days after the priming treatment .....................141
5.2.6 Differences upon priming 10 days after the treatment ....................................144
5.3 Discussion .................................................................................................................148
5.3.1 Novelty and robustness of the experimental design ........................................148

vii
5.3.2 Priming does not radically disrupt the epigenetic landscape ...........................149
5.3.3 Biological meaning of the measured parameters .............................................150
5.3.4 Are the observed priming induced changes in epigenetic modifications
significant? .................................................................................................................150
5.3.5 Observed differences between primed and non-primed samples were specific
for the particular histone modification measured ....................................................151
5.3.6 Individual priming induced changes .................................................................152
5.3.7 Do the observed changes in H3K27me3 constitute somatic memory?............152
Chapter 6 : Comparative analysis between epigenetic and transcriptional profiles .... 155
6.1 Introduction .............................................................................................................155
6.1.1 Background .......................................................................................................155
6.1.2 Aims of the chapter ...........................................................................................155
6.2 Results ......................................................................................................................156
6.2.1 Analysis of transcriptome immediately after priming ......................................156
6.2.2 Localization of epigenetic differences ..............................................................158
6.2.3 Relationship between gene transcription and epigenetic modification in primed
and non-primed plants ...............................................................................................160
6.2.4 Changes at the transcriptional level do not simply reflect changes in histone
methylation ................................................................................................................162
6.2.5 Dynamics of histone methylation H3K27me3 and transcriptional changes .....164
6.2.6 H3K27me3 differences and transcriptional responses after priming ...............166
6.3 Discussion .................................................................................................................168
6.3.1 Priming induced changes in histone modifications observed immediately after
priming are not a direct reflection of transcriptional changes induced by the
treatment ...................................................................................................................168
6.3.1.1 Changes in histone methylation upon stress are dynamic at single gene
level ........................................................................................................................169
viii
6.3.1.2 Salt responsive genes were preferentially marked with changes in
H3K27me3 ..............................................................................................................169
6.3.2 Priming-induced changes in H3K27me3 that were maintained for 10 days
underlie the different transcriptional responses of primed plants to a second stress
....................................................................................................................................170
Chapter 7 : Discussion ............................................................................................... 171
7.1 Original hypothesis and experimental observation .................................................171
References ............................................................................................................... 178
Appendix I ................................................................................................................ 198
Appendix II ............................................................................................................... 201
Appendix III .............................................................................................................. 212
Appendix IV .............................................................................................................. 221
Appendix V ............................................................................................................... 224
Appendix VI .............................................................................................................. 229
List of Figures
Fig. 1.1 Consequences of salt and drought stress on the signalling pathways. ..................... 2
Fig. 1.2 Model for the Salt Overly Sensitive (SOS) regulatory pathway. ................................ 3
Fig. 1.3 Nucleosome core with DNA and histone sites of post-translational modifications. .............................................................................................................................................. 14
Fig. 1.4 Representation of histone post-translational modifications. ................................. 18
Fig. 1.5 Methylation occurs at specific lysines along the histone H3 tails in Arabidopsis. .. 19
Fig. 2.1 Plant treatments and sample harvesting schematically summarized. ................... 30
Fig. 2.2 RNA quality check performed for RNA-Seq and Microarray samples. .................... 33
Fig. 2.3 Separation of chromatin on agarose gel. ................................................................ 37
Fig. 2.4 ChIP protocol overview. .......................................................................................... 39
Fig. 3.1 Schematic illustration of the factors that need to be considered in the experimental design. ............................................................................................................ 42
Fig. 3.2 Optimisation of the salt priming protocol. .............................................................. 46
Fig. 3.3 Effect of salt priming on plant growth..................................................................... 48
Fig. 3.4 Effect of drought stress on primed and non-primed plants.................................... 50
Fig. 3.5 Effect of drought stress on primed and non-primed plants after additional pre-exposure to a short heat treatment. ................................................................................... 51
Fig. 3.6 Stability of candidate reference genes in shoots and roots. ................................... 53
Fig. 3.7 Relative transcript level of Rd29A in shoots samples from plants primed at four different stages of development. ........................................................................................ 55
Fig. 3.8 Relative transcript level of Proline Synthase (P5CS1) in shoots samples from plants primed at four different stages of development. ................................................................ 56

ix
Fig. 3.9 Sodium content in shoots and roots of primed and non-primed plants at different time points after application of 80 mM NaCl. ..................................................................... 59
Fig. 3.10 Transcript levels of HKT1 in primed and non primed plants. ................................ 60
Fig. 3.11 Salt priming and cross protection. ........................................................................ 64
Fig. 4.1 Schematic representation of vector analysis. ......................................................... 68
Fig. 4.2 Relative Log Probe Cell Intensities of root and shoot samples before RMA normalization. ...................................................................................................................... 71
Fig. 4.3 Relative Log Probe Cell Intensities of roots and shoots samples after RMA normalization. ...................................................................................................................... 71
Fig. 4.4 Probe intensity distribution of root and shoot samples after RMA. ...................... 73
Fig. 4.5 Scatter plot of mean signal values from the Affymetrix gene chip. ........................ 75
Fig. 4.6 Scatter plot showing the response to salt stress in primed and non-primed roots and shoots . .......................................................................................................................... 77
Fig. 4.7 PCA maps with roots and shoots samples plotted in three dimensions using their projections onto the first three principal components. ...................................................... 79
Fig. 4.8 Venn diagram representing the number of genes between the two root list P+ vs P- and C+ vs C- ...................................................................................................................... 82
Fig. 4.9 Vectors representing gene responses to salt in root and shoot. ............................ 84
Fig. 4.10 Real time quantitative PCR (qPCR) analysis of relative expression of selected genes that responded higher to the salt in primed roots samples....................................101
Fig. 4.11 Real time quantitative PCR (qPCR) analysis of relative expression of selected genes that responded less to the salt in primed roots samples. .......................................109
Fig. 5.1 Data overview as appear in the IGB browser. .......................................................120
Fig. 5.2 DNA fragments amplified with different sets of primers ......................................122
Fig. 5.3 Total number of reads for different histone modifications. .................................123
Fig. 5.4 Genome-wide landscapes visualized with IGB ......................................................126
Fig. 5.5 Expected pattern of H3K4me3 and H3K27me3 histone modification on two representative genes in primed and control roots samples. .............................................127
Fig. 5.6 Number of methylated islands and percentage of genome coverage for H3K4 di- and tri-methylation in roots and shoots, non-primed and primed. ..................................129
Fig. 5.7 Distribution of differences of H3K4me2-me3 in roots and shoots of primed and non-primed plants along all five A. thaliana chromosomes. .............................................130
Fig. 5.8 Confirmation of individual differences of H3K4me2 and H3K4me3 between primed and non-primed roots. ..........................................................................................131
Fig. 5.9 Number of islands for H3K4 di- and tri-methylation, H3K9 di-methylation and H3K27 tri-methylation in roots of non-primed and primed plants. ..................................133
Fig. 5.10 Island length distribution in primed and non-primed roots analysed for the four histone modifications. ........................................................................................................134
Fig. 5.11 Total number of regions that differ in the level of methylation between control and primed roots in all the modifications considered. ......................................................136
Fig. 5.12 Genome-wide landscapes visualized using IGB of H3K27me3 modification. .....140
Fig. 5.13 Comparison of priming induced changes of H3K27me3 in roots 24h and 10 days after the transient priming treatment. ..............................................................................142
Fig. 5.14 Number of H3K27me3 islands mapped to genes in roots of non-primed and primed plants harvested 24h or 10d after the priming treatment. ..................................143
Fig. 5.15 Differences in H3K27me3 level between primed and non-primed plants at 24h and 10d after priming treatment. ......................................................................................145
Fig. 5.16 H3K27me3 levels determined by qPCR in roots of primed and non primed plants harvested 24h or 10d after the transient priming treatment. ..........................................147

x
Fig. 6.1 Scatter plot of mRNA levels in roots and shoots of non-primed and primed plants from the RNA-Seq. .............................................................................................................157
Fig. 6.2 Number of priming induced histone modifications related to the genome and the transcriptome. ....................................................................................................................159
Fig. 6.3 Percentage of genes presenting differences in histone modifications upon priming. ..............................................................................................................................159
Fig. 6.4 Correlation between transcription level and methylation level. ..........................161
Fig. 6.5 Number and direction of priming induced changes of mRNA and of H3K27me3, H3K4me3, H3K4me2, H3K9me2. .......................................................................................163
Fig. 6.6 Time course showing changes in H3K27me3 and mRNA during priming treatment. ............................................................................................................................................165
Fig. 7.1 Schematic representation of the original hypothesis. ..........................................171
List of Tables
Tab. 1.1 Chromatin modification and remodelling proteins involved in plant abiotic stress response. .............................................................................................................................. 26
Tab. 2.1 Growth medium used for plates and hydroponic culture. .................................... 29
Tab. 2.2 Standard reaction mix for PCR. .............................................................................. 34
Tab. 3.1 Summary of cross protection mechanisms enhancing stress tolerance. .............. 64
Tab. 4.1 Factors used for PCA and ANOVA .......................................................................... 80
Tab. 4.2 Number of genes differentially expressed in roots and shoots according to ANOVA analysis filtered by different criteria. ...................................................................... 81
Tab. 4.3 Angles that determine response categories in the VA. ......................................... 83
Tab. 4.4 Number of genes in roots and shoots showing different types of prototypic behaviour in response to salt in two backgrounds of Arabidopsis plants (primed P, non-primed C), as identified by vector analysis respectively in roots and shoots. ..................... 86
Tab. 4.5 Schematic summary of gene lists compared with DAVID. ..................................... 89
Tab. 4.6 Enriched GO categories among genes responding to salt in primed and non-primed plants based on ANOVA list C+ vs C-; and list P+ vs P- . .......................................... 91
Tab. 4.7 Enriched GO categories for genes showing differential expression between primed and non-primed salt-treated plants based on ANOVA list P+ vs C+ ....................... 92
Tab. 4.8 Enriched GO categories for genes showing higher response to salt in primed plants compared to non- primed plants in the selected background (FDR≤0.05). ............. 95
Tab. 4.9 Enriched GO categories for genes showing lower response to salt in primed plants compared to non-primed plants in the selected background (FDR≤0.05). ............103
Tab. 5.1 Workflow of ChIP-Seq analysis .............................................................................119
Tab. 5.2 Percentage of sequences that aligned to the genome for each individual modification sequenced. ....................................................................................................124
Tab. 5.3 Functional categories enriched among genes showing differences in histone modifications between primed and non-primed plants. ...................................................138
Tab. 6.1 Enriched GO categories for genes showing differential expression upon priming in roots and shoots.. ..............................................................................................................157
Tab. 6.2 List of genes maintained epigenetically different in H3K27me3 10 days after priming which were also differentially responding to salt stress on day 10 after priming. ............................................................................................................................................167
Tab. 7.1 Summary of the hypothesis and experimental observation ................................177

xi

xii
Abbreviation list
ABA abscisic acid
AGI arabidopsis genome initiative
ANOVA analysis of variance
ATP Adenosine triphosphate
BABA beta-amino-butyric acid
BLAST basic local alignment search tool
Bp base pair
cDNA complementary DNA
ChIP Chromatin immunoprecipitation
ChIP-Seq chromatin immunoprecipitation sequencing
DAVID database for annotation
visualization and Integrated discovery
DNA deoxyribonucleic acid
dsRNA double strand RNA
EDTA ethylene diamine tetra acetic acid
GO gene ontology
FC fold change
FDR false discovery rate
H3 histone 3
HAC histone acetlylase
HDAC histone deacetylase
HDM histone demethylase
HMT histone methyl transferase
HxAC hexanoic acid
IGB integrated genome browser
JA jasmonic acid
K lysine
KEGG Kyoto encyclopedia of genes and genomes
Lys lysine
mRNA messanger RNA
PCA principal component analysis
PCR polymerase chain reaction
PEG polyethylene glycol
Pol polymerase
qPCR quantitative PCR
RdDM RNA directed DNA methylation
RMA robust multichip average
RNA ribonucleic acid
RNA-Seq RNA-sequencing
ROS reactive oxygen species
RT reverse transcription
RT-PCR reverse transcript PCR
SA salicylic acid
siRNA small interfering RNA
ssRNA single strand RNA
TAE Tris base, acetic acid and EDTA
TAIR The arabidopsis information resource
UTR untranslate region
VA vectorial analysis
UV ultra violet

xiii
A ma’ e Pa’

xiv
Acknowledgments
I would firstly like to thank my supervisor Anna Amtmann for her support and
encouragement and for giving me the opportunity to work on this project.
I also would like to thank the people at the Glasgow Polyomics facility: in particular Pawel
Herzyk for his tremendous help in both data analysis and use of bioinformatics tools; Julie
and Jin for their help with microarray and sequencing analysis.
Special thanks to Andy for his immense help in both the lab and in my life.
Thanks also to my dear friends Connie, Maria and Annegret for reading and commenting
on my thesis, but most importantly, for cheering me up during the (too) long Scottish
winters and (too) short summers, thanks girls, you really kept me motivated in the lab
every day and on some nights too.
Thanks as well to all the members of the Blatt and Amtmann labs for helping me over the
four years including our wee George and his Johnny Cash CD played every Friday and Liz
O’Donnel and her great help in growing thousand of plants.
Finally I would like to thank my family who often believed in me more than I did.

xv
Author’s declaration
I declare that, except where explicit reference is made to the contribution of others, this
dissertation is the result of my own work and has not been submitted for any other
degree at the University of Glasgow or any other institution.
Emanuela Sani

1
Chapter 1: Introduction
1.1 Plant responses to water stress: mechanisms and strategies employed
Higher plants, owing to their sessile nature, have intricate mechanisms enabling them to
respond to environmental changes established over a long period of evolution.
Salinity is one of the major abiotic stresses, which adversely affects the agricultural
productivity in many parts of the world. Salinity afflicts 6% of land throughout the world
mostly as a natural result of the accumulation of salts over long periods of time in arid
and semiarid zones. Significant proportions (20%) of recently cultivated agricultural lands
were saline as a consequent of irrigation and clearing. Irrigated land accounts for only
15% of total cultivated land, but productivity is twice that of rain fed land, and
furthermore they produce one third of the world’s food (Munns and Tester, 2008).
The development of salt tolerant crops is an urgent challenge for plant scientists and
requires detailed understanding of plant responses to salinity. Plants respond to high salt
with a set of mechanisms that often overlap drought responses. The close relationship
between salt and drought responses is due to the dual effect that salinity has on the
plants (Fig.1.1). Initially salt increases rapidly the osmotic potential around the roots
making the extraction of water difficult from the soil mimicking a drought effect (osmotic
stress) and as a result growth is transiently arrested (Zhu, 2002). Secondly, toxic
concentrations of ions such as sodium (Na+) an chloride (Cl-) are slowly accumulated in
the mature leaves (ionic stress) accelerating their senescence and negatively affecting the
photosynthetic capacity and ultimately the supply of carbohydrates (Yokoi et al., 2002a;
Zhu, 2002).
Plants respond to an increased concentration of NaCl in the root environment within
seconds (Knight et al., 1997; Tracy et al., 2008), however, how they sense the salt remains
unclear.
Plants gain salinity tolerance using three main strategies: increase protection against
osmotic imbalance by preventing the entrance of ions, sequestration of Na+ in particular
in tissue or organs, increase protection against ion toxicity (Na+ and Cl-) by accumulation
of soluble organic compounds (Munns and Tester, 2008).

Introduction
2
Osmotic stress leads to a rapid inhibition in the rate of expansion of young leaves and to
the closing of stomata in mature leaves.
Fig. 1.1 Consequences of salt and drought stress on the signalling pathways. The signals for ionic and osmotic signalling pathways are ions (excess NaCl) and osmotic changes. The outputs of ionic and osmotic signalling are cellular and plant homeostasis. Direct input signals for detoxification signalling are derived stresses (i.e., injury), and the signalling output is damage control and repair (e.g., activation of dehydration tolerance genes). Interactions between the homeostasis, growth regulation and detoxification pathways are indicated (From Zhu 2002, modified).
Plants cope with ionic stress by preventing the entrance of Na+ into the root, controlling
transport to and allocation of Na+ within the leaf, and sequestering Na+ into the vacuole
(Apse and Blumwald, 2007). Due to the prevailing negative membrane potential the
entrance of Na+ in the roots is a passive mechanism, and conversely the efflux of Na+
from the cell requires an active process, particularly when external Na+ concentrations
are high. Higher plants lack Na+ pumps energized by ATP hydrolysis (Na+-ATPases),
making the electro-neutral exchange of sodium for protons via Na+/H+ antiporters the
only mode of transport that has been measured for efflux under physiological conditions
(Apse and Blumwald, 2007).
In Arabidopsis thaliana, different transporters have been identified as contributing to Na+
homeostasis at different cellular levels: antiporters at the plasma membrane (e.g. SALT
OVER SENSITIVE 1, SOS1)(Shi et al., 2000), vacuolar Na+/H+ antiporters (e.g. Na+/H+
EXCHANGER 1, NHX1) (Apse et al., 1999; Gaxiola et al., 1999), and the plasma membrane
uniporter (e.g. HIGH AFFINITY POTASSIUM TRANSPORTER 1, HKT1) (Uozumi et al., 2000).
The SOS1 gene encodes a Na+/H+ antiporter with 12 transmembrane domains in the N-
terminal half and a long hydrophilic C-terminal tail (Shi et al., 2002). SOS1 is expressed in
Salt &
Drought
Injury Cell division &
expansion regulation Growth inhibition
Detoxification signalling Damage control & repair
Osmotic signalling
Ionic signalling Ion and osmotic
homeostasis
Stress
Tolerance
Osmotic stress
Ionic stress

Introduction
3
epidermal cells at the root tip and in xylem parenchyma cells of roots and shoots; it
mediates Na+ extrusion out of the root and controls long-distance transport. SOS1 is
controlled by a pathway that involves a calcineurin-like Ca2+ binding protein (SOS3) and a
serine/threonine protein kinase (SOS2) that is activated by SOS3 (Liu et al., 2000; Halfter
et al., 2000). The concentration of free cytosolic Ca2+ increases with the increase in the
concentration of Na+ around the roots (Tracy et al., 2008). Ca2+ facilitates the dimerization
of SOS3 and the consequent interaction with SOS2 (Liu et al., 2000). Furthermore the
SOS3/SOS2 complex is targeted to the plasma membrane via a myristoyl fatty acid chain
covalently bound to SOS3 (Ishitani et al., 2000), enabling the phosphorylation and thus
the activation of the membrane antiporter, SOS1 (Qiu et al., 2002, 2003; Shi et al., 2002).
Fig. 1.2 Model for the Salt Overly Sensitive (SOS) regulatory pathway. Salt induced increases in cytoplasmatic calcium (Ca2+) are detected by SOS3. Ca2+, together with SOS3 activates SOS2, a serine/threonine kinase. Activated SOS2 phosphorylases and stimulates the activity of SOS1, a plasma membrane localized Na+/H+ exchanger leading to regulation of ion homeostasis during salt stress (From Chinnusamy et al., 2004, modified)
Interestingly the mutant sos3 phenotypes are suppressed by mutations in the AtHKT1
gene (Rus et al., 2001). HKT1 was initially described in wheat as a high affinity potassium
transporter (HKT) acting as a Na+/K+ symporter, or as Na+ selective uniporters depending
on the external Na+ concentration (Schachtman and Schroeder, 1994; Rubio et al., 1995).
Other species of plants harbour several HKT proteins combining both functions with
different affinities (Munns and Tester, 2008). In Arabidopsis, there is only a single
member of the HKT family, which acts as a low affinity Na+ uniporter (Uozumi et al.,
2000). AtHKT1 is mostly localized in the xylem parenchyma cells and at least in high-salt
conditions unloads Na+ from xylem vessels into xylem parenchyma cells (Sunarpi et al.,

Introduction
4
2005; Shi et al., 2002), giving a significant contribution in the allocation of Na+ from roots
to shoots.
The athkt1 mutant shows an over-accumulation of Na+ in xylem sap and in the leaves but
whether and how HKT1 also impacts on phloem loading remains to be determined
(Berthomieu et al., 2003). In addition to SOS1 and HKT1-type transporters non-selective
cation channels make a significant contribution to Na+ influx during salt stress. Volkov and
Amtmann (2006) demonstrated that root plasma membrane non selective channels have
selectivity for K+ over Na+ in Thellungiella halophila, a halophyte closely related to A.
thaliana. Consequently, during the salt exposure, a smaller depolarization occurs in T.
halophila, and hence the driving force for K+ uptake is maintained, leading to improved
K+/Na+ tissue concentrations. Interestingly, this higher K+/Na+ selectivity indicates that
there are different structural features of root ion channels that might underlie differential
ion accumulation in the two species (Volkov and Amtmann, 2006).
In Arabidopsis, a good candidate for channels that operate in Na+ uptake are cyclic
nucleotide-gated ion channels (CNGCs), a group of non selective cation channels that are
inhibited by calcium and calmodulin (Maathuis, 2001). The Arabidopsis CNGC gene family
comprises 20 members and several studies indicate that plant CNGCs are involved in the
control of growth processes and responses to abiotic and biotic stresses. These channels
contribute to cellular cation homeostasis, including calcium and sodium, as well as to
stress-related signal transduction. For example CNGC19 and CNGC20, which constitute
one of the five CNGC subfamilies, are involved in Arabidopsis' tolerance towards salt
(Kugler et al., 2009). Upon salinity both genes, CNGC19 and CNGC20, are up-regulated
within hours. Mature plants of CNGC10 anti-sense lines were more sensitive to salt stress
and contained higher Na+ concentrations in shoots compared with wild type, indicating
that CNGC10 could assist the plant in the allocation of sodium within the plant (Kugler et
al., 2009). Also because of their capacity to mediate calcium influx some CNGCs may
potentially act upstream of the SOS pathway (Zhu, 2002).
Another strategy that plants employ under salinity stress is vacuolar
compartmentalization of sodium (Apse and Blumwald, 2007). This is a critical mechanism
to avoid the toxic effects of Na+ in the cytosol while providing additional osmotic pressure
for water uptake and turgor maintenance. This function has been attributed to tonoplast
localized NHX-like antiporters, energized by the ∆pH across the tonoplast that facilitates
vacuolar compartmentalization of Na+ (Rodríguez-Rosales et al., 2009). In Arabidopsis, the

Introduction
5
family AtNHX contains six members with diverse degrees of response to salt stress. The
over expression of AtNHX1, for instance, has been shown to improve salt-tolerance in
Arabidopsis (Apse et al., 1999; Gaxiola et al., 1999). The most constitutively expressed
members of the family are AtNHX1 and AtNHX2, found in roots, shoots and seedlings
(Apse et al., 2003; Yokoi et al., 2002b; Shi and Zhu, 2002) while AtNHX3, 4 and 6 are less
expressed in these tissues. In particular, AtNHX1 is localized in all tissues except at tip of
the root. Interestingly, high activity has been detected in response to salt stress in root
hairs suggesting a role in Na+ accumulation in the enlarged vacuoles of these cells in
response to salt stress (Shi and Zhu, 2002). Even though AtNHX1 and AtNHX2 are
expressed constitutively in shoot and roots, their sensitivity to stress differs depending on
tissue. In seedlings, osmotic stress (NaCl, sorbitol) induces the transcription of AtNHX1
and AtNHX2 in an abscisic acid (ABA) dependent manner (Shi and Zhu, 2002). However, in
mature plants AtNHX1 expression was shown to be up-regulated in leaves but not in roots
by NaCl or ABA (Quintero et al., 2000). In addition, the expression of AtNHX5 was
induced during salt stress by NaCl but not ABA (Apse and Blumwald, 2007).
The constitutive base level of transcript abundance of AtNHX1, 2 and 5 was found to be
greater in sos mutants than wild type indicating that the SOS pathway negatively
regulates transcriptional expression of these Na+ antiporters genes (Yokoi et al., 2002a).
1.2 Effect of salt stress on the transcriptome
The perception of stress and its transmission in plants affects many regulatory elements
involved in the synthesis or alteration of different classes of proteins (i.e. ion channels,
transporters enzymes or transcriptional factors). Through this signal transduction
mechanism plants are able to recognize the stress situation and protect themselves
against the adverse conditions. Clearly, understanding of the functions of stress-inducible
genes will help to unravel the underlying mechanisms of stress tolerance. However, it
should be noted that, especially in the case of plants that are not salt-tolerant,
transcriptional responses do not necessarily have a direct benefit or even a consequence
at all. Numerous microarray datasets of the response of Arabidopsis to NaCl have been
made publicly available through databases, such as Gene Investigator and GEO (Hruz et
al., 2008; Barrett et al., 2011). One of the early studies carried out with A. thaliana,

Introduction
6
identified the convergent and divergent pathways between salinity and other abiotic
stress responses (Kreps et al., 2002). In this study, a microarray containing 8,100 probe
sets was used (Kreps et al., 2002). Expression profiles were obtained separately for roots
and leaves isolated from plants exposed for 3 or 27 h to a salt (100mM NaCl), osmotic or
cold stress. Results show that a total of 440 genes were differentially expressed only
under salt stress. However, the vast majority of genes were showing only a transient
change in expression, with only 22 genes showing the same response at both time points,
all of which were expressed in the roots. Among differentially expressed genes, the
largest category (50%) was related to oxidative stress related enzymes (e.g. glutathione
reductase and cytochrome P450) (Kreps et al., 2002). Ma et al., 2006 investigated the
global transcriptional response to different stresses using datasets available from
AtGenExpress representing a total of 12 studies made with Affymetrix GeneChip- ATH1,
which contains probes for approximately 22000 genes. The authors identified 1500 genes
that were most strongly regulated by salt. Among them the vast majority (680 genes)
were also induced by at least two different biotic stress treatments and, in addition,
shared common regulation with genes regulated by abiotic stresses related hormones
(elicitor, ABA and MeJa). Plants hormones are chemical messengers that are active at
extremely low concentrations and play critical roles in regulating developmental
processes and signalling networks involved in plant responses to a wide range of biotic
and abiotic stresses (Bari and Jones, 2009).
Only 171 genes were strictly salt-specific and they responded only in roots. Among this
set of transcripts nearly 20% of the genes were transcription factors such as MYB, WRKY
and AP2 genes. Several families of transcription factors are known to translate stress
signals into changes in gene expression. Many ethylene-synthesis and signalling genes
were observed, including ERF1 and ACS8 (Ma et al., 2006). Another transcript expression
study performed with the Affymetrix ATH1 microarray analysed the kinetic of the salt
stress by exposing the plants to 150 mM NaCl and harvesting separately roots and shoots
at several different time points (0.25, 0.5, 1, 3, 6, 12 and 24h) (Kilian et al., 2007). The
results showed that the alterations in gene expression occur rapidly. The first changes are
observed within 30 min after the application of stress in both tissues even though only
the roots were directly exposed to the stress. The latter observation suggests the
immediate production of a systemic signal, which is transferred between organs. As
before, it was found that salt stress caused a predominantly transient alterations in gene

Introduction
7
activity most of which were over after 24h (Kilian et al., 2007). Other studies investigated
the salt response focusing on tissue-specific response to the stress. Roots are the primary
site of perception for several types of water-limiting stresses, (i.e salinity and drought)
and in many circumstances the stress-sensitivity of the roots limits the productivity of the
entire plant (Steppuhn and Raney, 2005). Jiang and Deyholos, (2006) used Array-Ready
Oligo Set for Arabidopsis genome Version 1.0 (Qiagen Operon), a microarray representing
23,686 Arabidopsis genes, in order to identify root transcripts that changed in relative
abundance following 6, 24, or 48 h of hydroponic exposure to 150 mM NaCl. The
microarray profiling revealed that dynamic changes in transcript abundance occurred in
roots for at least 20% of the genome. Results of functional enrichment analysis were
consistent with generally observed stress response genes including hundreds of
transcription factors, kinases/phosphatases, hormone-related genes and effectors of
homeostasis, and overall emphasized the complexity of this stress response. Also several
novel classes of genes were found to be induced by NaCl treatment including transporters
(i.e. MATE, LeOPT1-like), signalling molecules (i.e. PERK kinases, MLO-like receptors),
carbohydrate active enzymes (i.e. XTH18), transcription factors (i.e. members of ZIM,
WRKY, NAC), and others (i.e. 4CL-like, COMT-like, LOB-Class1) (Jiang and Deyholos, 2006).
Taken together these data provided a detailed understanding of the pathways that are
induced by salinity stress in A. thaliana, the kinetics of the transcriptional response and
also reveal that only a small number of genes were strictly salt-specific and all are
localized in the roots. However, there are no available transcriptomic data describing the
effect of salt priming on the transcriptional responses of Arabidopsis roots and shoots to
NaCl treatment.
1.3 Concept of priming and memory in plants
Breeders and farmers have commonly observed an interesting event in the field: if at the
beginning of the season seedlings experience a moderate abiotic stress, caused for
example by adverse weather conditions, the plants show an enhanced tolerance if the
stress reoccurs. This phenomenon is known as priming or hardening and is a common
theme underlying responses to a range of stress factors. In the literature the term
“priming” is often used interchangeably with “acclimatization”. In this thesis we use the

Introduction
8
term “priming” to describe a short, brief and mild stress treatment that occurs for a
limited period of time leading to an increased tolerance when the stress re-occurs. While
“acclimatization” is here defined as a gradually increased or repeated stress, that leads to
a gradual acquisition of tolerance if the stress becomes more severe.
Priming can be induced through different environmental or chemical stimuli. Primed
plants display either faster or stronger activation of the various defence responses if the
stress recurs (Bruce et al., 2007).
1.3.1 Effect of priming on biotic stress tolerance
Among the chemical inducers of priming, the elicitor β-aminobutyric acid (BABA) is a
potent inducer of resistance against a wide range of pathogens. BABA acts by
potentiating pathogen-specific plant resistance mechanisms through activation of
defense mechanisms such as callose deposition, hypersensitive response, and the
formation of trailing necroses (Zimmerli et al., 2001).
Several studies have shown that pre-treatment with BABA directly up-regulates and
potentiates gene expression (e.g. SA-responsive genes) during bacterial infection. Tsai et
al. (2011) showed that BABA inhibits the Arabidopsis response to the bacterial effector
coronatine (COR). COR is known to promote bacterial virulence by mimicking jasmonic
acid (JA), which in turn antagonizes salicylic acid (SA) signalling. BABA specifically
represses the JA response induced by COR without affecting other plant JA responses
(Tsai et al., 2011).
Priming BABA treatment of tomato seeds induced defence against the fungal pathogen,
Oidium neolycopersici. Primed seeds showed a long lasting increase in resistance to up to
8 weeks associated with enhanced defence without influencing the growth and thus
making it suitable for commercial exploitation (Worrall et al., 2012).
Van Hulten et al. (2006) demonstrated that low doses of BABA caused only minor
reductions in relative growth rate and had no effect on seed production. However, high
doses of BABA strongly affected both fitness parameters (Van Hulten et al., 2006). This
implies that the benefits of priming prevail over its costs when disease occurs.
Consequently, plants in the primed state are efficiently protected against stresses without
major adverse effects on commercially and ecologically important traits, such as growth
and seed set.

Introduction
9
Another compound that acts as an inducer of plant defences by means of a priming
mechanism is hexanoic acid (HxAc). Root treatment with hexanoic acid (HxAc) protected
tomato plants against Botrytis cinerea by enhancing callose accumulation in an ABA
dependent manner (Vicedo et al., 2009). By contrast in Arabidopsis, plants primed with
HxAc showed a transient enhanced expression of JA- dependent defence, but the
mechanism of induced resistance by HxAc seems to be independent of callose deposition
or ABA after B. cinerea infection (Kravchuk et al., 2011). These results indicate that this
particular chemical priming activated mechanisms specific to the plant considered.
Furthermore, plants can secrete Volatile Organic Compounds (VOCs) and use them as a
message to warn other plants of the risk of herbivore attack in the environment, and
consequently preparing them to modulate their defensive strategy (Heil and Kost, 2006).
Experiments conducted in the field demonstrated that plants that had been exposed to
VOCs thereafter responded to subsequent leaf damage with an increased secretion of
extra-floral nectar (Heil and Kost, 2006). Whereas BABA induced resistance associated
with SA-dependent defence against biotrophic pathogens, VOC induced resistance seems
to function through priming by jasmonate (JA)-dependent defence against necrotrophic
pathogens and insects (Ton et al., 2009)
1.3.2 Effect of priming on abiotic stress responses
Several studies have also shown that applying a number of different abiotic priming
treatments can reduce the damage caused if the same stress reoccurs compared to non-
primed. Even though priming can be applied at different stages of development, the vast
majority of the studies investigated seed priming due to the easier application of the
treatment and thus better suitability for economical exploitation. Seed pre-treatments
are common practice in agriculture: typically antimicrobial or fungicidal are applied to
enhance crop protection prior to planting. However, it is important to mention that it is
also common agricultural knowledge that some plants, especially trees, need an
appropriate seed pre-treatment (i.e. cold exposure, soaking in water, acid treatment) for
breaking dormancy and synchronizing germination. These effects could mask other
effects that are obtained with similar pre-treatment technology. For this reason the
following literature report will distinguish between priming applied to seeds and priming
applied at later stages of plants development. It is important to point out that all carried

Introduction
10
out studies to date have described the effect of abiotic priming without fully investigating
the molecular basis of this phenomenon and thus the underlying mechanism still remains
unknown.
Priming of seeds
In a study by Cayuela et al. (1996) salt priming was applied by soaking the seeds of
tomato in a 6M NaCl solution and afterwards exposing the plants to a prolonged salt
stress from 11 to 60 days after sowing. Results showed that primed seeds germinated
earlier with a shorter shoot and root dry weight reduction than non-primed seeds.
Moreover, seed priming led to a significant reduction in Na+ and Cl- accumulation in roots.
Organic acids accumulated in roots of primed plants while leaves showed a significant
increase in sugars and organic acids. The authors ascribed the faster growth of tomato
plants from primed seeds to be the result of a higher capacity for osmotic adjustment
(Cayuela et al., 1996).
Other reasons for the better performance of primed seeds may be lower electrical
conductivity (EC) of the seed, higher sugars content along with increased α- amylase
activity (Nawaz et al., 2011). In this study priming was applied by exposing tomato seeds
to different concentrations of NaCl and KNO3 for 24 h. The seedling emergence observed
for seeds primed with 25 mM KNO3 was two times faster than for non-primed seeds along
with an increased percentage of seedling emergence and seedling growth; however, NaCl
priming resulted in poor seedling emergence and growth.
Seed priming of lettuce alleviated the thermo-inhibition that most cultivated varieties of
lettuce (Lactuca sativa) show during germination (i.e., above 25–30 °C) (Schwember and
Bradford, 2010). Priming treatment consisted in controlled hydration followed by drying
and led to an increased germination rate at high temperature. In order to further
investigate this phenomenon the authors carried out a quantitative trait locus (QTL)
analysis of seed germination after priming using a recombinant inbred line (RIL)
population derived from a cross between L. sativa cv. Salinas and L. serriola accession
UC96US23. The results showed that priming significantly increased the maximum
germination temperature of the RIL population. Also the authors identified a single major
QTL responsible for 47% of the phenotypic variation. The QTL collocated with Htg6.1, a

Introduction
11
major QTL from UC96US23 associated with high temperature germination capacity
(Schwember and Bradford, 2010).
Interestingly, within the QTL, was found the gene LsNCED4 that encodes a key enzyme (9-
cis-epoxy-carotinoid di-oxygenase) in the ABA biosynthetic pathway.
Priming applied at later stages of plant development
Several studies suggest that abiotic stress tolerance can be also improved by priming
seedlings. For example drought and salt stress tolerance of Arabidopsis plants increased
following treatment with the amino acid β-aminobutyric acid. BABA pre-treated plants
showed increased tolerance probably due to enhanced ABA accumulation that led to
accelerated stress gene expression and stomatal closure (Jakab et al., 2005).
In sugarcane, primed plants exhibited less salt and dehydration-induced leaf senescence
(Patade et al., 2009). Field experiments showed when salt priming was applied during
germination growth performance in terms of shoot length, shoot and root fresh weight
was improved in two-month old sugarcane plants subjected to 15 days of iso-osmotic
NaCl or polyethylene glycol (PEG) stress (Patade et al., 2009).
Priming applied to tomato seedlings (5 leaves stage) of a salt sensitive variety grown for
15 days in 35 mM NaCl resulted in an increased fruit yield by 29%. Moreover, the primed
plants accumulated about 20 mM less Na+ and 40 mM less Cl− in their adult leaves than
non-primed plants after 75 days of 70 mM NaCl treatment. Interestingly, seedlings
primed at 2-leaves stage did not show any long-term adaptive response. These results
suggest that there is a developmental window where priming has an effect on the
adaptive response (Cayuela et al., 2001). Different stages of development show significant
differences in morphology, membrane permeability and expression of specific genes
therefore the perception of the stress has a different impact on the plants at different
stages of development.
Finally, there are several reports suggesting that salt stress stimulates cold hardiness in
potatoes and spinach, water stress induces chilling resistance in rice and heat stress
increases tolerance to several abiotic stresses (Cuartero et al., 2006). Also water stress in
general induces salt tolerance: tomato plants pre-treated with drought stress were able
to grow better than non pre-treated plants after 21 days of salt stress. Furthermore pre-
treatment with PEG had a positive effect on salt tolerance tomato seedling (Cuartero et

Introduction
12
al., 2006). This intriguing phenomenon known as cross-tolerance could be potentially
used as strategy to protect crops against a wide spectrum of abiotic stresses (Mittler,
2006).
1.3.3 Does priming establish “stress memory”?
It is has been suggested that priming generates some sort of “stress imprint” lasting for
minutes, days, weeks or even generations (Conrath et al., 2006), and that the ability to
recall and to use this information (‘memory’) enhances the chance of survival of the plant
(Gális et al., 2009). However, the exact molecular nature of stress memory in plants is still
under debate. Priming could induce the accumulation of signalling compounds in active
configuration, or transcription factors or other regulatory proteins that enhance defence
gene transcription after stress recognition. Modification of structural elements such as
membrane lipids and cell wall components has also been proposed (Gális et al., 2009).
However, one could argue that due to the relatively fast turnover of proteins and lipids,
and due to dilution through growth, these changes should not be able to persist over
expanded periods between the priming treatment and the second stress exposure. An
alternative possibility is that the beneficial priming effect occurs as a result of changes in
DNA or chromatin structure. Numerous studies in the past decade have pointed out the
importance of the structural proprieties of DNA and chromatin for transcriptional
regulation of gene expression (Conrath, 2011; Conrath et al., 2006). Changes in DNA and
chromatin structure can be maintained during mitosis and even meiosis and they
therefore could provide an explanation for the so-called ‘epigenetic memory’, where
heritable traits occur without changing the DNA sequence.
The expression of the genes is enhanced or repressed through the interaction of
transcription factors and other regulatory proteins with short, non-coding DNA
sequences, such as promoters, introns and 5' or 3' UTRs. The accessibility of these
particular sequences for regulatory interactions can be modulated by the changes in the
conformation of the chromatin fibre including chemical modifications of the DNA strand
itself as well as the association of the DNA with histone proteins. Very recently an
increasing collection of data suggests that histone modifications could hold the
information of a primed state of transcription (Conrath, 2011). For example the promoter
of the defence gene PR1 is associated with high levels of H3 acetylation and H3K4

Introduction
13
methylation (H3K4me) in the permanently primed sni1 mutant with constitutively
enhanced immunity without the gene being activated (Mosher et al., 2006). Also several
WRKY transcription factors known to be involved in priming abiotic response were found
to be associated with a range of histone modifications. In particular, after priming with
benzothiadiazole the promoter of the transcription co-activator gene WRKY29 was
associated with H3K4me3 and H3K4me2, as well as acetylation of H3K9, H4K5, H4K8, and
H4K12 (Jaskiewicz et al., 2011). Interestingly the gene is not activated when the plants do
not encounter a further stress stimulus. Similar observations were made for WRKY6 and
WRKY53 when H3K4me3, H3K4me2, and activation of transcription were assayed
(Jaskiewicz et al., 2011).
These results suggest that certain WRKY promoters are subjected to chromatin
modifications that facilitate transcription activation of WRKY genes by subsequent stress.
Treatment with acibenzolar S-methyl (a synthetic version of the plant hormone salicylic
acid) or pathogen infection of distal leaves induced chromatin modifications on defence
gene promoters that were normally found on active genes, although the genes remained
inactive. This led to an amplified gene response upon exposure to stress (Jaskiewicz et al.,
2011).
Due to the relatively stable nature of biochemical modifications of DNA and histones,
they are very suitable candidates for stress imprints with the function of retaining stress
memory over longer time periods (Chinnusamy and Zhu, 2009). Unlike the biosynthesis of
proteins and metabolites, which requires a constant energy input during plant growth,
chromatin modifications, once established, are self-propagating. A role of epigenetic
modifications for plant stress memory is therefore an attractive hypothesis that merits
further investigation.
1.4 Chromatin: a dynamic and complex structure
In eukaryotes, genomic DNA is tightly packed into a complex structure of DNA and
proteins known as chromatin. The fundamental unit of chromatin is the nucleosome
(Fig.1.2), which is formed by wrapping ~147 bp of DNA around a histone octamer (two
copies each of histones H2A, H2B, H3 and H4). The chromatin complex is a truly dynamic
structure that can be subjected to several processes that, acting in concert, can change its

Introduction
14
structure (Roudier et al., 2009). Every single component (nucleosome, histone, DNA) can
be modified at different levels and thus create a cell-specific or stimulus-specific
accessible genome (the ‘epi’genome). Chromatin structure influences the accessibility of
factors and cofactors to the DNA and therefore gene regulation (Roudier et al., 2009).
Fig. 1.3 Nucleosome core with DNA and histone sites of post-translational modifications. The nucleosome is formed by two copies of each histone (H2A, H2B, H3 and H4) and 147 bp of DNA that wraps the histone octamer forming a left-handed super helix. The histone globular regions are shown in schematic with helices illustrated as cylinders, and the DNA shown in grey. The histone tails protrude from the nucleosome core allowing modifications to occur (picture taken from Lallous et al., 2011).
Chromatin (‘epigenetic’) modifications play an important role in genome organization and
stability as well as the control of gene expression without altering the nucleotide
sequence (Gendrel and Colot, 2005). Nucleosomes are able to change in position and
composition through placement of histone variants by chromatin remodelling ATPases.
The histone proteins within the octamer present a tail of amino acids in their N-terminal
protruding from the nucleosome core. These amino acid residues can be covalently
modified by particular enzymes and ultimately affect the histone-DNA interaction
(Gendrel and Colot, 2005). Some histone modifications, such as acetylation of histones H3
and H4 and tri-methylation of H3 lysine 4 (H3K4me3) are known as euchromatic marks
because they are often associated with high transcription rate, whereas other

Introduction
15
modifications, such as methylation of H3K9 and H3K27, are known as heterochromatic
marks and related to gene repression (Jenuwein and Allis, 2001; Li et al., 2007a).
At the DNA level, particular cytosine residues can be methylated, which interfere with
binding of transcriptional factors and other proteins (Chinnusamy and Zhu, 2009). In
plants, cytosine residues in a DNA molecule can be methylated in three different
sequence contexts: CG, CHG “Symmetric methylation” and CHH “asymmetric
methylation” (H=A, T or C). In Arabidopsis, multiple DNA methyl-transferases are involved
in the establishment and maintenance of methylation process: CHG methylation is
established by CHROMOMETHYLASE 3 (CMT3), while maintenance of CG methylation is
maintained by METHYLTRANSFERASE1 (MET1). CHH methylation is maintained by
continual de novo methylation by DOMAINS REARRANGED METHYLTRANSFERASE 1 and 2
(DRM2) guided by small RNAs in a process termed RNA-directed DNA methylation (RdDM)
(Simon and Meyers, 2011). In the current model for the RdDM pathway (Simon and
Meyers, 2011; Wierzbicki et al., 2012) the plant specific DNA-dependent-RNA
polymerases IV (Pol IV) transcribe transposons and other genomic regions copying single-
stranded RNA (ssRNA) into double-stranded RNA (dsRNA). Pol IV acts in a complex with
chromatin remodelling factors and the RNA-dependent RNA (RDR2) that copies single-
stranded RNA (ssRNA) into double-stranded RNA (dsRNA). The dsRNA molecules are then
cleaved into 24 nt RNAs by the double-stranded RNA endonuclease DICER- LIKE3 (DCL3)
and then loaded into a complex containing Argonaute 4 (AGO4).
In addition, another independent pathway containing the DNA-dependent-RNA
polymerases V generates other non-coding RNA. Pol V acts in a complex termed DDR
composed of DRD1 (DEFECTIVE IN RNA DIRECTED DNA METHYLATION a chromatin
remodelling factor), DMS3 (DEFECTIVE IN MERISTEM SILENCING 3, a protein related to
cohesions/condensins) and RDM1 (RNA-DIRECTED DNA METHYLATION1 ssDNA-binding
protein with a preference for methylated DNA). The Pol V non-coding RNAs serve as
“scaffolds” to which AGO4–siRNA complexes bind through RNA–RNA base-pairing. In
addition AGO4 can also interact with the C-terminal domain of the Pol V largest subunit,
presumably stabilizing the complex through protein–protein interactions.
Subsequently, recruitment of DRM2 and other chromatin-modifying machinery is
observed at the Pol V transcribed loci and then cytosines are methylated de novo.

Introduction
16
Although the exact mechanism is still not clear, the recruitment of DRM2 to AGO4-siRNA-
PolV transcript complexes is possibly mediated by RDM1, which has been shown to
interact with both AGO4 and DRM2 (Wierzbicki et al., 2012).
1.5 Histone acetylation in plants
Histone acetylation is a dynamic and reversible mark estabilished by the deposition of an
Acetyl-CoA group to lysine residues within histones (Servet et al., 2010). When the mark
is in place there is a neutralization of the positive charge of the histone tails which in turn
decreases their affinity to DNA and thereby forming a more relaxed structure. This
facilitates the association of transcription factors and other proteins involved in
replication, transcription etc to the DNA (Servet et al.2010). Histone acetylation is usually
associated with transcriptional activation whereas lack of acetylation forms a tighter
association between DNA and chromatin leading to transcriptional repression (Berger,
2007).
Histone acetylation in Arabidopsis occurs at the N-terminal lysine residues of histone H3
(K9, K14, K18, K23, and K27) and H4 (K5, K8, K12, K16, and K20) although acetylated
H3K27 is not detected by mass spectrometry (Zhang et al., 2007a; Earley et al., 2007).
The acetylated histone residues can be recognized and bound by chromatin remodelling
factors through a ‘bromodomain’ which therefore is considered as a reader of histone
acetylation markers (Zeng and Zhou, 2002). Histone acetyltransferases (HATs) (of which
there are numerous in plants) are the enzymes that add the Acetyl-CoA group to the
histone lysine residues, which in turn can be removed by histone de-acetylases (HDACs).
In Arabidopsis there have been 12 HAT and 18 HDAC genes identified, as part of
multigene families (Pandey et al., 2002).
Several studies showed that histone acetylation has an important influence on numerous
developmental and biological processes in plants (Chen and Tian, 2007, Jasencakova et
al., 2001, Chua et al., 2003, 2001)). In the cell cycle, mitosis is associated with changes in
the acetylation status of histones that are correlated with dynamic changes in
chromosome structure and function (Jasencakova et al., 2001). Furthermore acetylation
of histones has been shown to play an important role in light-responsive gene activation
in plants, for example it was first demonstrated in tobacco that the transcriptional

Introduction
17
activation of the light-induced pea plastocyanin gene is associated with hyperacetylation
of histones H3 and H4 (Chua et al., 2003, 2001). Flowering time is also influenced by
changes in histone acetylation. The repressor of flowering Flower locus C (FLC) is
repressed by vernalization and this is proportionally correlated with the reduced levels of
histone acetylation at the FLC locus (Sheldon et al., 2006). Finally the Arabidopsis histone
de-acetylase HDA6, has been found to interact with COI1, an F-box protein, which is
required for JA-mediated plant defence responses (Devoto et al., 2002). Overall histone
acetylation plays a major role during plant development and growth and also in response
to a number of environmental stimuli.
1.6 Histone methylation in plants
Histone methylation is generally recognized as a dynamic epigenetic mark often recruiting
other protein complexes to regulate diverse developmental processes (Gendrel and Colot,
2005). It is also involved in silencing repetitive sequences in order to maintain genome
stability (Gendrel and Colot, 2005). The histone methylation status is dynamic:
methylation marks can be established on lysine or arginine residues by histone lysine
methyltransferases (HKMTs) and removed by histone demethylases (HDMs) (Liu et al.,
2010). HKMTs can add up to three methyl groups to the residues (mono- (me1), di- (me2)
and tri- (me3)). Unbiased mass spectrometry in Arabidopsis has identified four major sites
on histone H3 of lysine methylation; Lys4 (K4), Lys9 (K9), Lys27 (K27), Lys36 (K36). Two
other residues with minor levels of methylation were also detected Lys18 (K18) and Lys23
(K23) (Johnson et al., 2004) (Fig.1.3).

Introduction
18
Fig. 1.4 Representation of histone post-translational modifications. The histone cores are represented as ellipsoids and the amino acid sequences of the tails are shown. These modifications may not occur in every organism or simultaneously in the same histone tail. Different combinations of modifications allow the generation of specific patterns (‘epigenetic code’). (Picture taken from Lallous et al., 2011). Approximately two-thirds of the Arabidopsis genome is associated with methylated
histones (Chinnusamy and Zhu, 2009). Histone methylation plays an important role in
transcriptional regulation. Depending on the type of amino acid residue and on the
degree of methylation, this type of modification can be correlated with both silent and
transcriptionally active chromatin domains (Fig.1.4). For example H3K4me3 is associated
with active genes and their promoters (Zhang et al., 2009). H3K9me2 is mainly associated
with the hetero-chromatic zone of the chromosome and is enriched in transposons and
repetitive sequences, and is therefore required for transcriptional silencing (Berger,
2007).
H3K27me3 and H3K36me are primarily involved in the repression of developmental genes
and are required for normal plant development, but their exact role in transcriptional
regulation remains unclear (Zhang et al., 2007b; Xu et al., 2008b).
H3K36 is mostly associated with actively transcribed genes while H3K27me3 causes
silencing of genes in euchromatic regions (Berger, 2007).

Introduction
19
Fig. 1.5 Methylation occurs at specific lysines along the histone H3 tails in Arabidopsis. In red are the four major sites of lysine methylation Lys4 (K4), Lys9 (K9), Lys27 (K27), Lys36 (K36), and underlined the other two with minor levels of methylation detected in Lys18 (K18) and Lys23 (K23).
1.6.1 Histone H3 Lysine 4
Molecular features and distribution
Approximately two-thirds of genes are associated with H3K4 methylation. 6.45%, 6.0%
and 12.1% of the sequenced nuclear genome are associated with mono-, di- or tri-
methylated H3K4 respectively (Zhang et al., 2009). Methylated H3K4 is highly enriched in
euchromatic regions and is absent from peri-centromeric heterochromatin regions. H3K4
methylation occurs almost exclusively within genes and their promoters; only a small
fraction of intergenic repetitive sequences or transposons are associated with this mark.
Zhang et al., 2009, showed that H3K4me3, H3K4me2 and H3K4me1 are distributed with a
5'-to-3' gradient along genes. H3K4me3 and H3K4me2 are enriched in the promoters and
within the 5' end of transcribed regions with H3K4me3 occurring slightly upstream of
H3K4me2. H3K4me1 is enriched in the transcribed regions with an apparent 3' bias. These
results suggest that H3K4me2 and H3K4me3 may be involved in both transcription
initiation and the early stages of transcript elongation. In contrast, it has been suggested

Introduction
20
that H3K4me1 may be primarily involved in the elongation step during the transcription
of longer genes. Comparative analysis from microarray datasets found that genes
associated with different combinations of H3K4me, me2 and me3 are expressed at
different levels and with different tissue specificity, suggesting that the three types of
H3K4me may have different effects on chromatin structure and transcription (Zhang et
al., 2009). In particular, H3K4me3 appears to be generally associated with actively
transcribed genes, but there is no evidence for a direct role of H3K4me1 and H3K4me2 in
transcriptional activation. H3K4me1 and H3K4me2 do not appear to have an additive
effect to H3K4me3 on transcription levels and in the absence of H3K4me3 they are not
preferentially associated with actively transcribed genes. Furthermore, H3K4me2 (but not
H3K4me1 or H3K4me3) often overlaps with H3K27me3 (Zhang et al., 2009).
Impact of H3K4me on the plant life cycle
To date several studies have been carried out using Arabidopsis mutant lines for different
methyl-transferase enzymes in order to unravel the impact of H3K4 methylation on plant
life. Four of the seven class III HMTase genes (ATX1/SDG27, ATX2/SDG30, ATXR7/SDG25
and SDG2) act on the H3K4 (Alvarez-Venegas et al., 2003; Saleh et al., 2008; Tamada et
al., 2009; Guo et al., 2010). These enzymes showed differential abilities of methylation:
ATX1 mediates H3K4 tri-methylation, ATX2 mediates only di-methylation (Pien et al.,
2008; Saleh et al., 2008) whereas SDG2 is capable of catalyzing all three types of
methylation in vitro. The loss of SDG2 activity in the sdg2 mutant leads, to a strong
decrease of H3K4me3 at numerous loci in vivo (Guo et al., 2010). The analysis of the
knockout mutants generally shows that a defect in the methylation of H3K4 leads to
severe abnormalities in development, with a particularly strong influence on flowering
time, flower development and fertility. For example atx1 mutants were reported to
display an altered leaf morphogenesis and an early flowering phenotype, via the
epigenetic regulation of the floral repressor FLOWERING LOCUS C (FLC), a MADS box
transcription factor, which controls the transition from vegetative development to
reproductive phase (Alvarez-Venegas et al., 2003; Saleh et al., 2008). Interestingly, some
of these mutants also show particular phenotypes that might suggest other roles of the
HTMase. For example, homozygous sdg2 seedlings present significantly shorter root and

Introduction
21
the plants remain dwarfed. In addition, flower organs are normal in morphology but the
plants are male sterile due to pollen defects (Guo et al., 2010).
1.6.2 Histone H3 Lysine 9
Molecular features and distribution
Histone H3K9 methylation occurs as mono (H3K9me1), di- (H3K9me2), and tri-
methylation (H3K9me3) and mass spectrometry in Arabidopsis revealed that the degree
of this modification is variable (Johnson et al., 2004). The main status is mono-
methylation, in fact 20% of the genome was found to be associated with mono, followed
by 10% of di-methylation, whereas only a small percentage of tri-methylation was
detected (100 fold lower than mono) (Johnson et al., 2004).
Genome wide ChIP assays in Arabidopsis coupled with high-resolution microarray analysis
(ChIP on ChIP) revealed that H3K9me2 covered a total of 27 Mb of the sequenced
genome (22.5%). It was found that di-methylation of H3K9 is highly enriched in peri-
centromeric regions and appears over long uninterrupted regions (3.4-350 kb), while
euchromatic arms showed isolated patches of smaller regions (0.6 kb) (Zhou et al., 2010;
Bernatavichute et al., 2008). Around the centromere H3K9me2 is more frequently
associated with transposons/pseudogenes (77% of all elements) than in the euchromatic
arms (23%). H3K9me2 is rarely found in genes. Genes lacking H3K9me2 were found to
have a higher average expression level than genes harbouring this modification,
suggesting that H3K9me2 correlates with gene suppression (Zhou et al., 2010;
Bernatavichute et al., 2008). H3K9me2 is localised either in promoters (46.4%) or in gene
bodies (48.8%), rarely in both (4.8%). Consistent with a function of H3K9me2 in repressing
transposon activity, further analysis showed that the majority of siRNA clusters present in
peri-centromeric regions are highly associated with H3K9me2 (90% or higher overlap)
(Bernatavichute et al., 2008).
H3K9 methylation is carried out by proteins of the SU(VAR)3-9 subgroup of
methyltransferases, which consists of 14 proteins in Arabidopsis: the SU(VAR) 3-
9 HOMOLOGs SUVH1-SUVH9, and the more distantly related SU(VAR) 3-9 RELATED
proteins SUVR1-5 (Veiseth et al., 2011). Unlike SUVH proteins, which contain a YDG/SRA
domain, the SUVR1, SUVR2 and SUVR4 proteins contain an N-terminal WIYLD domain of

Introduction
22
unknown function, suggesting different modes of action of these enzymes (Veiseth et al.,
2011). Interestingly, the mechanism of action of SUVH on K9 is tightly correlated to
methylation occurring at the DNA level. For example, SUVH4 and SUVH6 bind the
methylated CHG through their YDG/SRA domains suggesting a role of DNA methylation in
recruiting H3K9 methyltransferases. In particular, SUVH4 binds the chromodomain of the
Chromomethyltransferase 3 (CMT3) enzyme that mediates CHG DNA methylation
through its SRA domain (Veiseth et al., 2011). Once recruited to the target regions, the
SET domains of these histone H3K9 methyltransferases methylate adjacent histones,
resulting in mutually reinforcing H3K9 methylation and CG DNA methylation in
heterochromatin formation (Liu et al., 2010). SET domains and YDG/SRA domains of
SUVH2 and SUVH9 were also shown to be required for RNA-directed DNA methylation
(RdDM). The YDG/SRA domain of SUVH2 preferentially binds to methylated CG sites,
while that of SUVH9 mainly binds to methylated CHH sites (Liu et al., 2010). Thus the
SUVH proteins in Arabidopsis link the epigenetic gene-silencing marks H3K9me2 and DNA-
methylation to control constitutive heterochromatin formation and work in parallel as
transcriptional repressors of transposons or inverted repeat sequences (Pontvianne et al.,
2010).
More recently, the more distantly related SU(VAR) 3-9 RELATED has also been
investigated: while either SUVR1 or SUVR2 do not have detectable methyltransferase
activity, SUVR4 can add methyl groups to the mono-methylated H3K9 peptide as
substrate (Veiseth et al., 2011). SUVR4 is preferentially localized in non-condensed
nuclear bodies suggesting it acts on euchromatin regions and may function as a repressor
of rDNA gene clusters (Veiseth et al., 2011).
Impact of H3K9me on the plant life cycle
SUVH4, also known as KRYPTONITE (KYP), was the first plant histone H3K9
methyltransferase identified. Although histone H3K9 methylation is essential for gene
silencing, kyp lack of function mutants show no obvious phenotypes apart from the
reactivation of loci that were transcriptionally silenced by DNA methylation, suggesting its
role in DNA methylation–mediated gene silencing (Liu et al., 2010; Pontvianne et al.,
2010). Also the triple mutant suvh4/suvh5/suvh6 and the loss-of- function of suvh2 show
no visible phenotype (Liu et al., 2010; Pontvianne et al., 2010). Only the combined

Introduction
23
mutation of suvh2/suvh9/suvh4 show pleiotropic developmental defects, including curled
leaves and short stature, which are also seen in the drm1/drm2/cmt3 triple mutant. The
cause of these phenotypes is the activation of the F-box gene SUPPRESSOR of drm1 drm2
cmt3 (SDC), which in wild type is silenced by a combination of the RNA-directed DNA
methylation (RdDM) pathway and CMT3 (Liu et al., 2010; Pontvianne et al., 2010).
Interestingly, over-expression of SUVH2 induces development changes, such as delayed
leaf senescence, by a general chromatin re-organization resulting in increased repressive
histone marks including H3K9me2, H3K27me3 and H4K20me2 (Pontvianne et al., 2010).
1.6.3 Histone H3 Lysine 27
Molecular features and distribution
Histone H3 presents two isoforms (H3.1 and H3.2) that vary in the extent of methylation
at K27. Although the two variants cannot be separated by HPLC, they present enough
difference in the sequences to be separately detected by mass spectrometry (Johnson et
al. 2004). H3.1 has a mixture of peptide isoforms dominated by those methylated at K27:
60% K27me1, 16% K27me2 and 5% K27me3. In contrast, the peptide isoform observed
for H3.2 shows lower levels of methylation at K27: 36% K27me1, 6% K27me2 and no
detectable K27me3 (Johnson et al. 2004). Genome-wide ChIP assays coupled with high-
resolution microarray analysis (ChIP on ChIP) identified a total of 8,979 H3K27me3
regions covering 6.9 Mb and representing 5.7% of the sequenced nuclear genome (Zhang
et al., 2007b). H3K27me3 was found to be highly enriched in the euchromatic arms,
resembling the distribution of genes (Zhang et al., 2007b). This is in contrast to the
heterochromatic distribution of several other silencing marks such as DNA methylation,
small interfering RNAs (siRNAs) or H3K9me2. H3K27m3 is associated with a large number
of genes in Arabidopsis: 18.6% of expressed genes with known functions, 15.6% of
expressed genes with unknown functions and 7.2% of pseudogenes harbour this mark.
Indeed, 70.8% of the H3K27me3 regions were found in promoters (around 200-bp regions
upstream of transcription start sites) or in the transcribed regions of genes (Zhang et al.,
2007b).
Cluster analysis of genes based on their expression patterns show that most of H3K27me3
target genes are expressed in a very tissue-specific manner, suggesting that H3K27me3

Introduction
24
may facilitate tissue-specific repression of these genes (Zhang et al. 2007). Taken
together, these results suggest that H3K27me3 is a component of a gene silencing system
in Arabidopsis that is involved in the regulation of numerous genes and many
developmental processes.
Impact of H3K27me on the plant life cycle
The correct distribution of H3K27 is essential for correct plant development as it provides
a cellular memory to maintain the repressed transcriptional states of targets genes during
cell division (Zhang et al., 2007b).
The eukaryotic enzymes that methylate H3K27 in vivo are all homologous with the
Drosophila melanogaster SET-domain protein Enhancer of Zeste E(Z). E(Z) acts as part of
the Polycomb Repressive Complex 2 (PRC2) and requires the WD-40 protein Extra Sex
Combs for activity in Drosophila. Arabidopsis contains three E(Z) homologs: MEDEA
(MEA), CURLY LEAF (CLF) and SWINGER (SWN). Both CLF and SWN are expressed during
postembryonic development whereas MEA expression is limited to the female
gametophyte and embryo development (Pontvianne et al., 2010).
Mutations in the maternal allele of MEA cause embryo abortion and endosperm over-
proliferation. In addition, MEA has also been found to be involved in the regulation of its
own imprinted expression: before fecundation MEA is required to repress the expression
of the maternal copy of MEA while later in seed development the paternally
inherited MEA allele is kept silent by the maternal copy MEA (Baroux et al., 2006).
Mutations in CLF result in early flowering and pleiotropic phenotypes, including curled
leaves and partial homeotic transformation of the sepals and petals to carpels and
stamens (Ng et al., 2007). No obvious phenotype is observed in swn mutants but it
strongly enhances the phenotypes of clf and mea mutants in clf swn and mea swn double
mutants indicating redundant functions (Ng et al., 2007). Despite their similarity to E(Z)
and despite the fact of the mutants show lower level of H3K27me2 and H3K27me3 in
immunostaining experiments, the plant proteins remain biochemically uncharacterized;
possibly due to the requirement for the whole PRC2 complex for methyltransferase
activity to occur (Liu et al., 2010). In addition, the level of H3K27me1 was not affected in
clf swn double mutants which suggests that H3K27 methylation at centromers is
catalyzed by other proteins that are not homologous to E(Z). Recently, Jacob et al. 2009

Introduction
25
showed that the divergent SET-domain proteins TRITHORAX RELATED PROTEIN 5 (ATXR5)
and ATXR6 are able to catalyze the mono-methylation of H3K27 in Arabidopsis (Jacob et
al., 2009). Moreover the atxr5atxr6 double mutant shows partial disruption of
constitutive heterochromatin, reduced H3K27me1 around the centromer, and
reactivation of silenced genes such as Ta3 and other heterochromatin markers, indicating
that both H3K27me1 and H3K9me2 act at common loci (Jacob et al. 2009).
1.7 Dynamic alterations of histone modification profiles in plants subjected to
environmental changes
Several studies have indicated a link between epigenetic modifications and exposure of
plants to stressful environmental conditions, which could create a stress responsive
mechanism that controls gene expression at the chromatin level (Luo et al., 2012).
In tobacco and Arabidopsis cells, a change in nucleosome position occurs in response to
high salinity and cold stress, accompanied by H3 phospho-acetylation and histone H4
acetylation, and followed by enhanced expression of stress-specific genes (Sokol et al.,
2007). In rice seedlings, water submergence induced histone H3K4 tri-methylation and H3
acetylation of alcohol dehydrogenase1 (ADH1) and pyruvate decarboxylase1 (PDC1). As a
result the expression level of these two genes was enhanced, but was restored to the
basal level when the stress is relieved by re-aeration (Tsuji et al., 2006).
Furthermore, it was shown that K4 tri-methylation and K9 acetylation of the histone H3
was altered under drought stress resulting in gene activation of the affected drought
stress-responsive genes (Kim et al., 2008). Both abscisic acid (ABA) and salt stress can
induce histone H3K9-K14 acetylation and H3K4 tri-methylation and decrease H3K9 di-
methylation of some known ABA and abiotic stress-responsive genes (Chen et al., 2010). ,
These findings suggest that some functionally related gene groups are regulated co-
ordinately through histone modifications in response to abiotic stress in plant cells.
Dynamic changes in genome-wide histone H3K4 methylation patterns in response to
dehydration stress in Arabidopsis were also observed using a ChIP-Seq approach (Van Dijk
et al., 2010).
Mutations of histone modifying enzymes also cause altered abiotic stress responses and
can influence plant stress tolerance. For example, lack of function of the Arabidopsis
Trithorax-like Factor (ATX1), which tri-methylates histone H3 at lysine 4 leads to a

Introduction
26
phenotype including larger stomatal apertures, increased water loss and hyper-sensitivity
to dehydration stress (Ding et al., 2011).
Member of the histone deacetylase (HDAC) family have been found to regulate biotic and
abiotic stresses responses. For example, in Arabidopsis, knockout/knock-down of histone
de-acetylases HDA6 and/or HDA19 makes the plants hypersensitive to ABA and salt stress
(Chen and Wu, 2010; Chen et al., 2010). Knockout of HD2C, a member of the plant-
specific HD2 histone de-acetylase family that interacts with HDA6, also confers higher
sensitivity to ABA and NaCl and altered expression of ABA-dependent genes. Mutation of
a putative member of a histone de-acetylase complex, HOS15, caused higher levels of
acetylated histones and altered freezing tolerance in Arabidopsis (Zhu et al., 2008). In
addition to their role in stress responses, histone de-acetylases, as with other histone
modification enzymes (see previous sections), are also involved in plant development (Yu
et al., 2011; Tian and Chen, 2001; Tanaka et al., 2008). Over-expression of HDA19 led to
strong developmental aberrations in Arabidopsis (Zhou et al., 2005), and over-expression
of histone de-acetylases in maize and rice led to a range of morphological phenotypes
(Rossi et al., 2007; Jang et al., 2003). These findings highlight the dilemma of how histone
modification act as a process with a fundamental role in determining cell line identity can
contribute to dynamic stress signalling without interfering with basal developmental
patterns. One possibility is that the targeting of genes is very specific. Another possibility
is that changes induced by environmental stimuli are very small compared to the basal
patterns determining cell-specific expression.
Tab. 1.1 Chromatin modification and remodelling proteins involved in plant abiotic stress response.
Gene Histone modification Stress Development Reference
AtHD2C De-acetylation /catalytic Salinity/ABA Not known Luo et al.,
2012
HDA6 De-acetylation /catalytic Salinity/Cold Flowering Chen and
Wu, 2010
HDA19 De-acetylation /catalytic Salinity/ABA Embryo/Flowering Chen et al.,
2010
HOS15 De-acetylation/ histone-
binding Freezing Not known
Zhu et al.,
2008
ATX1 Methylation /catalytic Drought Flowering Ding et al.,
2011

Introduction
27
1.8 Aims and methodology of the thesis
The aim of this thesis was to address the question whether and how a transient mild salt
priming treatment at an early developmental stage influences the morphological,
transcriptional and epigenetic response of plants to a second treatment occurring later in
development. To answer this question I used several technical approaches. I first
subjected A. thaliana plants to a range of potentially effective priming treatments and
evaluated differences in stress tolerance as well as transcriptional responses of known
salt stress-marker genes between primed and non-primed plants. After developing an
optimised priming protocol, I determined genome-wide transcriptional profiles at various
stages of the protocol (24h after priming and 10 days after priming) by microarray
analysis and RNA-sequencing.
Secondly, I analysed epigenetic profiles of four histone modifications (H3K4me2-me3,
H3K27me3 and H3K9me2) 24h after priming and 10 days after priming. These marks are
stably transmitted through mitosis but their potential role in long-term somatic memory
of abiotic stress in plants was unknown. In addition, H3K27me3 and H3K9me2 were
known to be enriched in transcriptionally repressed genes and transposons while
H3K4me3 and H3K4me2 were known to be enriched in transcriptionally active genes; in
addition a previous study showed that H3K4me2 and H3K4me3 were associated with
dehydration-responsive genes, (Kim et al., 2008; Pfluger and Wagner, 2007). For this
purpose, DNA samples obtained both 24h after the priming treatment and 10 days after
the second treatment by Chromatin Immuno-Precipitation (ChIP) with antibodies against
H3K4me2, H3K4me3, H3K9me2, H3K27me3 were subjected to next generation
sequencing (Illumina, ChIP-Seq). The large datasets obtained were analysed with a range
of statistical methods to separate random noise from priming/stress induced changes.
Further data mining and quantitative analyses were subsequently carried out to better
understand the biological and molecular events associated with salt priming.

28
Chapter 2: Materials and methods
2.1 Materials
Except where otherwise stated all chemicals were purchased from Sigma (Pool, UK) or
Fisher Scientific (Southampton UK). Custom made primers were purchased from
Invitrogen and are listed in Appendix I. Sources of all equipment are given in the text. List
of solutions, antibodies and primers referred to in the text are given in the following
sections.
2.2 Plant materials and growth conditions
Growth of plants on agar plates:
For growth on agar plates Arabidopsis thaliana (ecotype Columbia 0) seeds were first
surfaced sterilized. The seeds were placed in a 1.5 ml centrifuge tube with 1 ml of
absolute ethanol for 1 minute, and mixed by inversion. The ethanol was then replaced
with 1 ml of mild bleach solution (2.5% sodium hypochlorite solution and 0.01%
Tween20), left to incubate for 5 minutes and occasionally mixed by inversion. Seeds were
washed five times in sterile distilled water and incubated in the dark at 4°C for two days
for stratification. To prepare the solid medium for plates, concentrated stocks of each
reagent listed in Table 2.1 were mixed and diluted to 1x concentration with distilled
water. Sucrose was added to a concentration of 3% and pH was adjusted to 5.6 with 0.1
M NaOH, and lastly 1 % agar was added before autoclaving at 121 °C for 20 minutes. The
medium was dispensed into square (120 x 70 mm, 70 ml per plate) tissue culture plates
(Greiner Bio-One, Frickenhausen, Germany) using a titration pipette. Ten seeds were
individually sown on sterile nylon mesh using a pipette on the surface of the solidified
medium in a horizontal line approximately 2 cm from the top of the plate. Plates were
sealed with Parafilm and placed vertically in a controlled growth chamber (10 h light/14 h
dark photoperiod, white fluorescent tubes L36W/30 with light intensity 120 μmol m-2s-1,
temperature 21 °C).

Materials and methods
29
Growth of plants in hydroponic culture:
To prepare the liquid nutrient medium, concentrated stocks of each reagent listed in
Table 2.1 were mixed and diluted to 1x concentration with distilled water. Three weeks
old seedlings (4 true leaves) were carefully peeled from Petri dishes and transferred to a
dark-taped 800-mL hydroponic container (dimension: 17 x 11 x 5.5 cm) containing the
nutrient medium. The containers were placed in a controlled growth room under a
propagator (10 h light/14 h dark photoperiod, light intensity approx 120 μmol m-2s-1, 21
°C) and the plants were generously sprayed with double distilled water to avoid
desiccation. Plants were sprayed with water every two days and after five days the
propagator was removed.
Tab. 2.1 Growth medium used for plates and hydroponic culture.
Control Minimal Medium, (pH= 5.6)
Reagent: Final concentration 1x KNO3 1.25 mM MgSO4 7H2O 0.5 mM KH2PO4 0.625 mM
Ca(NO3)2 4H2O 0.5 mM FeNaEDTA 42.5 mM Micronutrients: CuSO4 0.25mM, ZnSO4 0.68mM, MnSO4 2mM, H3BO3 45.3mM
1x
NaCl 2mM
2.3 Determination of tissue ion content
The sodium content in plant tissue was determined as described by Wang et al., 2006.
Four plants (primed and non-primed) were harvested individually at 0, 2, 4, 8 and 24 h
after salt treatment. Roots and shoots were separated and dried to determine dry
weights before ion content analysis. Dried tissues were incubated overnight in 2 M HCl
(1:100 w:v), diluted 50 times with double-distilled H2O, and analysed by flame
photometry using an 410 flame photometer (Sherwood-Scientific Ltd, UK).
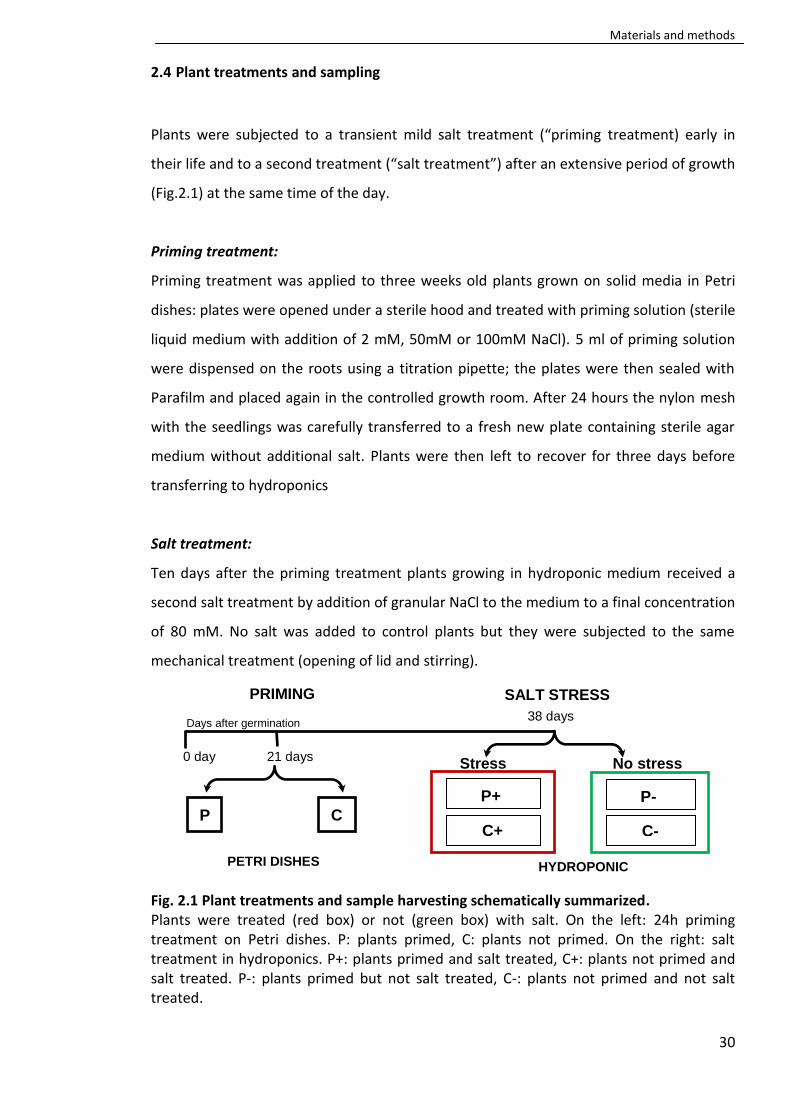
Materials and methods
30
2.4 Plant treatments and sampling
Plants were subjected to a transient mild salt treatment (“priming treatment) early in
their life and to a second treatment (“salt treatment”) after an extensive period of growth
(Fig.2.1) at the same time of the day.
Priming treatment:
Priming treatment was applied to three weeks old plants grown on solid media in Petri
dishes: plates were opened under a sterile hood and treated with priming solution (sterile
liquid medium with addition of 2 mM, 50mM or 100mM NaCl). 5 ml of priming solution
were dispensed on the roots using a titration pipette; the plates were then sealed with
Parafilm and placed again in the controlled growth room. After 24 hours the nylon mesh
with the seedlings was carefully transferred to a fresh new plate containing sterile agar
medium without additional salt. Plants were then left to recover for three days before
transferring to hydroponics
Salt treatment:
Ten days after the priming treatment plants growing in hydroponic medium received a
second salt treatment by addition of granular NaCl to the medium to a final concentration
of 80 mM. No salt was added to control plants but they were subjected to the same
mechanical treatment (opening of lid and stirring).
Fig. 2.1 Plant treatments and sample harvesting schematically summarized. Plants were treated (red box) or not (green box) with salt. On the left: 24h priming treatment on Petri dishes. P: plants primed, C: plants not primed. On the right: salt treatment in hydroponics. P+: plants primed and salt treated, C+: plants not primed and salt treated. P-: plants primed but not salt treated, C-: plants not primed and not salt treated.
38 days
SALT STRESS
Stress No stress
P+
C+
P-
C-
PRIMING
Days after germination
21 days
P C
0 day
PETRI DISHES HYDROPONIC

Materials and methods
31
Sample harvesting:
Plants were harvested at given time after the treatments, separated into shoots and roots
samples and frozen for RNA or DNA extraction or immediately fixed in formaldehyde for
isolation of chromatin as described in the following sections.
RNA-sequencing samples
Three week old plants (4 leaves stage) were primed (P) or not (C) with 50mM NaCl for
24h, samples were then separated into shoots and roots and total RNA was extracted. 30
plants have been used for each condition and three independent experiments were made
and pooled together.
Microarray samples
Three week old plants (4 leaves stage) were primed (P) or not (C) with 50 mM NaCl for
24h and 10 days later exposed to 80 mM salt treatment (+) or not (-); samples were then
separated into shoots and roots and RNA was extracted. 15 plants have been used for
each condition and three independent experiments were carried out.
2.5 RNA extraction and cDNA synthesis
RNA extraction:
Total RNA was extracted from A. thaliana tissue using Trizol solution (0.8 M Guanidinium
Thiocyanate, 0.4 M Ammonium thiocyanate, 0.1 M NaAc pH 5, 5% Glycerol, 38% Phenol
saturated in water pH 4.5). Frozen tissue was ground to powder using Mixer Mill MM 300
(Qiagen, Valencia, CA, USA) repeating three cycles of one minute at 25 Hz. The material
was kept frozen in liquid nitrogen between the cycles. 1.4 ml of Trizol solution was then
added to the frozen powder in a 2 ml centrifuge tube and the mixture was vortexed for
one minute and left standing at room temperature for 5 minutes.
Following centrifugation at 10000 x g for 2 minutes at 4 °C, 1.4 ml of supernatant was
transferred to a new 2 ml centrifuge tube containing 300 μl of Chloroform-Isoamylic (24
Vol Chloroform, 1 Vol Alcohol Isoamylic). The solution was vortexed for one minute and
incubated at room temperature for 2 minutes, then centrifuged at 12000 x g at 4 °C for 10
minutes producing two phases. 750 μl of the upper phase was transferred to a new 2 ml
centrifuge tube containing 200 μl of Chloroform-Isoamylic. Following another
centrifugation at 12000 x g at 4 °C for ten minutes, 750 μl of the upper phase was added

Materials and methods
32
into a new 1.5 ml tube containing 750 μl of isopropanol. The solution was mixed by
inversion and the RNA was left to precipitate at -20 °C for 30 minutes. The tube was then
centrifuged at 12000 x g for 20 minutes at 4 °C to produce a pellet. The pellet was washed
with 1 ml 70% ethanol centrifuged at 4 °C for 5 minute 12000 x g and washed again with 1
ml 70% ethanol and centrifuged at 4 °C for 5 minutes 12000 x g. The supernatant was
discarded and the pellet was dried in a speed vacuum centrifuge (Eppendorf) for 10
minutes before being re-suspended in 30 μl RNase-free water.
Total RNA used for Microarray analysis and RNA-sequencing was extracted and isolated
with RNeasy mini kit (Qiagen, Valencia, CA, USA) according to the manufacturer's
instructions.
RNA quantity was determined spectrophotometrically using an Eppendorf
spectrophotometer. Absorbance readings were normalized to RNase-free water. RNA
quality was checked by agarose gel electrophoresis. All the materials (gel tank, combs,
and electrophoresis apparatus) were pre-treated with NaOH 0.1 M for 30 minutes. 2 μl of
6x loading buffer (0.25 % orange G, 40 % sucrose) was added to 5 μl of RNA and loaded
on a 1.5 % agarose, 1% TAE gel, Ethidium bromide. Bands were separated at 100 V for 25
minutes and then visualized under UV light using a Gel Doc scanner (Bio-rad).
To avoid contamination with genomic DNA, total RNA was treated with DNA-free Kit
(Ambion) according to the manufacturer’s instructions. Efficiency of the DNase treatment
was tested on agarose gel electrophoresis and then RT-PCR with primers specifically
either designed spanning an intron region or either sides of an intron region.
RNA for microarray and RNA sequencing were tested for quality using Agilent® 2100
Bioanalyzer™ (Fig.2.2).

Materials and methods
33
Fig. 2.2 RNA quality check performed for RNA-Seq and Microarray samples. Bioanalyzer profiles for RNA-seq: capillary electropheresis profile (left) and spectrophotometer profile (right). (C: control, P: priming, S: shoots, R: roots)
cDNA synthesis:
cDNA for PCR was synthesized using QuantiTect® Reverse Transcription kit (Qiagen,
Valencia, CA, USA). 1 µg of total RNA was used to carry out the first-strand synthesis of
cDNA according to the manufacturer's instructions. The RNA was added to 2 μl of gDNA
Wipeout Buffer 7 x and RNase-free water up to a final volume of 14 μl. After incubation
for 2 minutes at 42 °C the tubes were put on ice and the following mix was added: 1 μl
Quantiscript Reverse Transcriptase, 4 μl Quantiscript RT Buffer (5x), 1 μl RT Primer. The
tubes were incubated for 15 min at 42°C to allow reverse transcription and finally
incubated for 3 min at 95 °C to inactivate reverse transcriptase.
50SRNA
Mar
ker
PS
RN
A
PR
RN
A
CS
RN
A
CR
RN
A

Materials and methods
34
2.6 Polymerase chain reaction (PCR) and microarray hybridisation
2.6.1 Standard PCR
Standard PCR mixes (final volume 25 µl) were set up as shown in Tab. 2.2. Template was
genomic DNA or cDNA. Stated cycling conditions were as follows: 1 min at 95 °C, 35 cycles
of 30 s at 95 °C, 30 s at 60 °C, 30 s at 72 °C, and 7 min at 72 °C. Primer annealing
temperature and cycle numbers were adjusted as appropriate for each reaction. PCR
products were added to 5 μl of 6x loading buffer (0.25 % orange G, 40 % sucrose) and
resolved by agarose gel electrophoresis loaded on a 1.5 % agarose, 1 % TAE gel,
containing Ethidium bromide. Bands were separated at 100 V for 15 minutes and then
visualized under UV light using a Gel Doc scanner (Bio-rad). If necessary, bands were
extracted using a QIAquick gel extraction kit (Quiagen) according to the manufacture
instructions. DNA was eluted from QIAquick columns using 30 μl of the supplied elution
buffer. DNA concentration was determined spectrophotometrically.
Tab. 2.2 Standard reaction mix for PCR.
Component Concentration Volume (μl)
5x buffer 1 x 5
dNTP mix (10mM each of dATP, dCTP, dGTP, dTTP) 0.2 mM each 0.5
Forward primer (10 μM) 0.1 μM 0.5
Reverse primer (10 μM) 0.1 μM 0.5
Taq Polymerase (5units/ μl) 0.15
Distilled water - variable
Template variable
2.6.2 Quantitative PCR
Quantitative PCR was performed in 96-well plates using Mx3000 Stratagene real-time PCR
system, and the Brilliant III SYBR Green qPCR kit (Stratagene). SYBR green fluorescence
was measured every PCR cycle at the end of the annealing step. As SYBR green
fluorescence is greatly increased in the presence of double stranded DNA, product
accumulation can be monitored in real time. For each reaction, the Ct (defined as the
number of cycles required to reach the threshold fluorescence or the point at which the

Materials and methods
35
fluorescence can be accurately related to initial template quantity) was calculated
automatically using Stratagene MX software. Cycling conditions were as follows: 3 min at
95 °C, 40 cycles of 10 s at 95 °C, 20 s at 60 °C, followed by a 60–95 °C dissociation
protocol to verify the amplification of a single PCR product. Primers were designed to
amplify 100–250 bp products and the primer sequences are given in Appendix I. Target
concentration was quantified by comparing its amplification to that of standards of
known concentration. Standards consisted of gel-purified PCR products identical to the
intended amplicon. They were produced by performing standard PCR on a cDNA sample
using the same primers as used for qPCR. PCR products were gel purified and DNA
concentration determined spectrophotometrically. Purified PCR products were first
adjusted to 10 pg/μl and then further diluted by ten-fold serial dilutions to produce six
different standards (ranging from 10 pg/μl to 10-4 pg/μl). A standard curve was produced
by plotting the Ct values obtained from qPCR for each standard dilution against the
logaritm of the initial template quantity. Initial target quantity in cDNA samples was
determined by comparing Ct values to this standard curve. Each reaction was performed
in duplicate.
As a control for variation in RNA quantification, reverse transcription efficiency and
template preparation, the template quantify each genes was expressed relative to the
reference gene. Several conventionally used reference genes were evaluated for their
stability under our experimental conditions using geNorm (Vandesompele et al., 2002).
Based on the results, the gene RpII (At4g26410) was selected for use as internal reference
for transcripts.
For determination of enrichment of target sequences in ChIP samples Input samples were
adjusted considering that 10% was immune-precipitated and the follow formula was
used:
[(IPtarget/(10*Inputtarget)]/ [(IPref/(10*Inputref)]
Enrichment for H3K27 tri-methylation was determined using AT5G56920 as a reference
gene, while enrichment for H3K4 di- and tri- methylation and was determined using
AT1G24560 as a reference with primers designed into different position of the gene.

Materials and methods
36
2.7 Transcriptome profiling by RNA-sequencing and microarray
For RNA sequencing 10 µg of quality checked total RNA was subjected to Illumina
sequencing by Polyomics Facility-University of Glasgow, using protocol for provided by
Illumina.
10 µg of quality checked total RNA were used for microarray analysis. The procedures of
labelling and hybridizing of the RNA to the Affymetrix® GeneChip™ ATH1 were carried out
according to manufacture protocols by the Polyomics Facility- University of Glasgow.
2.8 Isolation and immune-precipitation of chromatin (ChIP)
The protocol used for Chromatin Immuno-Precipitation (ChIP) in this study is a modified
version of the protocol described by Bowler et al., 2004. An overview is shown in Fig.2.4.
2.8.1 Tissue fixation and nuclei isolation
Approximately 4 g of plant tissue was harvested, separate into shoots and roots samples
and fixed in 30 ml of 1% (w/v) formaldehyde for 15 min under a vacuum. Cross-linking
was stopped by adding 125 mM glycine and the vacuum was re-applied for another 5
min. The tissue was rinsed twice with distilled water, blotted dry and flash frozen in liquid
nitrogen. The tissues were ground in liquid nitrogen to obtain a fine powder and the
powder was re-suspended in 30 ml of buffer containing 0.4 M sucrose, 10 mM Tris-HCl pH
8, 10 mM MgCl2, 5 mM β-mercaptoethanol, 0.1 mM PMSF and one protease inhibitor mix
tablet (Complete Mini, Roche). The homogenate was then filtered through two layers of
Miracloth and centrifuged for 20 min at 4,000 g. The pellets were re-suspended in a 1 ml
of buffer containing 0.25 M sucrose, 10 mM Tris-HCl pH 8, 10 mM MgCl2, 1% (v/v) Triton
X-100, 5 mM β-mercaptoethanol, 0.1 mM PMSF and protease inhibitor, followed by a 10-
min centrifugation at 12,000 g. The pellet was resuspended in 1 ml of buffer containing
1.7 M sucrose, 10 mM Tris-HCl pH 8, 0.15% (v/v) Triton X-100, 2 mM MgCl2, 5 mM
β−mercaptoethanol, 0.1 mM PMSF and protease inhibitor and was deposited on a layer
of 1ml of the same buffer followed by centrifugation for 1 hour at 16,000 g. The pellet

Materials and methods
37
was resuspended in nuclei lysis buffer (50 mM Tris-HCl pH 8, 10 mM EDTA, 1% (w/v) SDS
and protease inhibitor).
2.8.2 Sonication
In order to break the chromatin into fragments of approximately 500 base pairs, the re-
suspended pellets were fragmented for six 15 sec pulses using a sonicator (Sanyo-
Soniprep 150) with an output of 10 - 15% and centrifuged for 10 min at 16,000 g. To
assure the correct fragmentation 1 μl of sheared chromatin was added to 1 μl of 6x
loading buffer (0.25 % orange G, 40 % sucrose) and loaded on a 1.5 % agarose, 1 % TAE
gel, Ethidium bromide. Bands were separated at 100 V for 15 minutes and then visualized
under UV light using a Gel Doc scanner (Bio-rad) (Fig.2.3).
Fig. 2.3 Separation of chromatin on agarose gel. C: chromatin not sonicated, 1: chromatin sonicated for 4 pulses of 15-sec, 2: chromatin sonicated for five pulses of 15-sec, 3: chromatin sonicated for six pulses for 15-sec (optimal fragmentation length), 1kb: molecular marker.
2.8.3 Immuno-precipitation
100 μl of sheared chromatin was diluted in 900 μl ChIP dilution buffer (1.1 % (v/v) Triton
X-100, 1.2 mM EDTA, 16.7 mM Tris-HCl pH 8, 167 mM NaCl).The chromatin-enriched
solution was pre-cleared with 25 μl of protein A Dynabeads (Invitrogen, Carlsbad, CA), at
4 ºC constant rotation for 1 hour. Protein A beads were collected using a magnet and the
pre-cleared chromatin was incubated overnight at 4 °C with antibodies for dimethylated
H3K4 (6 μL, Diagenode pAb-035-050 Liège-Belgium), trimethylated H3K4 (1 μL, Diagenode
pAb-003-050, Liège-Belgium), dimethylated H3K9 (2 μL, 17-681, Millipore, Billerica, MA),
trimethylated H3K27 (2 μL, Diagenode, pAb-069-050, Liège-Belgium). A sample without
antibody addition was also used as a mock control. Next the antibody/chromatin complex
300 bp
1000 bp 500 bp

Materials and methods
38
was precipitated by incubating the mix with 50 μl of protein A Dynabeads for 2 h: this
step allowed the binding of the antibody/chromatin complex to the magnetic beads for
separation using a magnet. The immunoprecipitated chromatin and the associated
proteins were washed at 4 ºC constant rotating with 1 ml of each of the following buffers:
low salt buffer (150 mM NaCl, 0.1 % SDS, 1 % TritonX-100, 2 mM EDTA, 20 mM Tris-HCl
pH 8.1), high salt wash buffer (500 mM NaCl, 0.1 % SDS, 1% TritonX-100, 2 mM EDTA, 20
mM Tris-HCl pH 8.1), LiCl wash buffer (0.25 M LiCl, 1% NP40, 1% sodium deoxycholate, 1
mM EDTA, 10 mM Tris-HCl pH 8.1), TE wash buffer (10 mM Tris-HCl pH 8.1, 1 mM EDTA).
The beads were washed, with some modifications depending on which antibody was
used: for anti- H3K4me2- and H3K4me3 beads were washed twice for 10 minutes
incubation at 4 ºC, for H3K9me2 once for 5 minutes, for H3K27 twice for 5 minutes.
2.8.4 Reverse cross-linking and DNA purification
The chromatin was eluted and reverse cross-linked in one step by overnight incubation at
65 ºC in presence of 500 μl elution buffer (1% (w/v) SDS, 0.1 MNaHCO3, 0.2 M NaCl). The
eluted antibody/chromatin complex was separated from the beads using a magnet.
Residual proteins were removed by Proteinase K (20 μg ml-1) treatment and DNA was
recovered by phenol/chloroform extraction and ethanol precipitation in the presence of 1
μl of Glicogen. The purified DNA pellets were resuspended in 50 μl of Tris-EDTA pH 8 and
subsequently purified using a Qiagene Mini Elute column following the manufactures
instructions.

Materials and methods
39
Fig. 2.4 ChIP protocol overview. After cross-linking of chromatin and DNA by formaldehyde fixation (in fresh plant material), nuclei are isolated and the chromatin is extracted and fragmented to the right size by sonication. An input sample (1) is collected immediately after the sonication and will represent the positive control. The rest of the samples are split in two reactions: a sample (2) is immune-precipitated with the specific antibody (i.e. H3K4me2) and one sample (3) is used as a negative control without addition of antibody. DNA is isolated and purified from the proteins by reverse cross-linking, proteinase (Pase K) treatment and phenol/chloroform extraction.

Materials and methods
40
2.9 Whole genome linear amplification
For qPCR reactions, ChIP DNA samples and Inputs were linearly amplified using
GenomePlex Complete Whole Genome Amplification (WGA2) (Sigma-Aaldrich). The
reaction was carried out following the manufacture’s instructions with the only exception
being that no DNA fragmentation was carried over because the samples had previously
been sonicated. The kit utilizes an amplification technology based on random
fragmentation of genomic DNA and conversion of the resulting small fragments to PCR-
amplifiable library molecules flanked by universal priming sites. The library is then PCR
amplified using universal oligonucleotide primers and a limited number of cycles.
Library was prepared by adding 1 μL of Library Stabilization Solution and 2 μL of 1x Library
Preparation Buffer to 20 μL of each sample. The mix was placed in a thermal cycler at 95
°C for 2 minutes. Samples were cooled on ice, consolidated by centrifugation, and
returned to ice where 1 μL of Library Preparation Enzyme was added. Samples were
placed in a thermal cycler and incubated as follows: 16 °C for 20 mins, 24 °C for 20 mins,
37 °C for 20 mins, 75 °C for 5 mins, 4 °C hold. Linear Amplification was prepared by adding
the following reagents to the 15 μL reactions from the previous step: 7.5 μL of 10X
Amplification Master Mix, 47.5 μL of water, 5 μL of WGA DNA Polymerase. Samples were
vortexed thoroughly, centrifuged briefly, then placed in a thermal cycler and incubated
for Initial Denaturation at 95 °C for 3 minutes. Then 14 cycles were performed as follows:
Denature at 94 °C for 15 seconds, Anneal/Extend at 65 °C for 5 minutes. The amplified
samples were used for PCR (section 2.6).

41
Chapter 3: Physiological analysis of priming
3.1 Introduction
3.1.1 Background
If at the beginning of the season plant seedlings experienced a moderate abiotic stress,
the mature plants often show an enhanced tolerance when the stress condition reoccurs.
This phenomenon, known as priming, has often been reported by farmers, breeders and
gardeners. However, the reports are mostly anecdotal and the effect lacks quantification
and still awaits confirmation through rigorous scientific testing. As described in the
general Introduction (Chapter 1.3) several studies have shown that prior application of
either a biotic stress or a pathogen elicitor enables plants to respond quicker or stronger
to a subsequent pathogen infection (Tsai et al., 2011; Van Hulten et al., 2006; Worrall et
al., 2012; Ton et al., 2009; Conrath et al., 2006, 2001; Conrath, 2011; Kravchuk et al.,
2011; Heil and Kost, 2006). Other studies have found that pre-treatment of plants with an
abiotic stress reduced the damage caused if the same stress reoccurred (Cayuela et al.,
1996; Jakab et al., 2005; Schwember and Bradford, 2010; Sedghi et al., 2010; Nawaz et al.,
2011; Patade et al., 2009; Farooq et al., 2008). However, in all of these studies the
priming effect was only investigated on seeds and the molecular basis of this
phenomenon was not explored and thus the underlying mechanisms remain still
unknown. In this first part of the project the effect of an abiotic priming treatment on the
response of A. thaliana plants to a later abiotic stress was investigated systematically. The
aim was to optimise the experimental design for subsequent exploration of the molecular
processes underlying abiotic priming of plants.

Physiological analysis of priming
42
3.1.2 Aims of the chapter
In this chapter I investigated the effects of different abiotic priming treatments on the
physiology of the model organism Arabidopsis thaliana. In particular, I focused on the
effect of salt priming applied at different key-stages (seeds, one day after germination, 2
true leaves, 4 true leaves) of development of Arabidopsis. I will describe how these
observations influenced the choice of the final experimental design that I used in all
further experiments presented in this thesis.
3.1.3 Systematic optimization of an experimental protocol to test the effect of priming
on stress responses of A. thaliana
The optimization of a priming protocol requires consideration of many different factors
(Fig. 3.1). Clearly not all of these can be tested experimentally in all combinations. The
optimization of the protocol was therefore based on a combination of existing
knowledge, informed guess and experimental testing.
PRIMING treatment
STRESS treatment
OUTPUT
Time ? Time ? ? MOLECULAR MARKER
Strength ? TIME? Strength ?
Stage ? Stage ? ? PHYSIOLOGICAL MARKER
Fig. 3.1 Schematic illustration of the factors that need to be considered in the experimental design.
Factors that are expected to determine the outcome of a priming experiment are the
following: biological system (plant species, developmental stage), growth system (plates,
hydroponics, soil), type of abiotic stress to be investigated (salt, osmotic, drought),
strength and duration of the priming treatment, length of period between priming and
(second) stress treatment, strength and duration of (second) stress treatment. In
addition, decisions had to be taken on how to measure the outcome of the experiment
(physiological and molecular marker). In this section I present the individual factors
Physiological analysis of priming
43
together with a reasoning of choices made to narrow down the number and the range of
conditions that were tested.
Strength of treatments
The selection of the priming/stress treatment strength was made taking into
consideration the salt sensitive nature of A. thaliana, which prevents the plants from
completing their life cycle if continuously exposed to 100 mM NaCl (Munns and Tester,
2008). This indicates that a harsh priming treatment could severely damage the plant,
leaving a choice between applying a solution with a high concentration of salt for a short
period of time, or a solution with a lower concentration for a longer time. It was decided
to test a concentration range of 20-100 mM NaCl.
Length of treatments
From the literature it is known that the response to salt stress in plants is rapid. The vast
majority of transcriptional changes are detectable after only 30 minutes and are
completed after 24 hours (Kilian et al., 2007). Therefore, considering this time frame it is
possible to conclude that a 24 hour treatment is a good informed guess. It should be long
enough to induce a strong response to the salt but not long enough to change the
morphology of the plants.
Time between treatments
Another essential parameter to be considered is the time that elapses between the
priming and the stress treatment. The purpose of the experiment was to leave the plants
growing for an extensive period of time, during which the plants have gone through
numerous cell divisions but without switching from vegetative growth to reproductive
phase. In fact after this switch, the cell differentiation profile changes completely from
leaves to flower and consequently all the patterns of gene expression change as well. An
informed guess of 10 days was made. This period of growth should be long enough to

Physiological analysis of priming
44
ensure that transcripts and other molecular entities transiently induced by the priming
treatment are substantially diluted and/or turned over.
Choice of species
A. thaliana is a widely used model plant. A large body of information already exists on its
transcriptional responses to stress and also some epigenetic studies are avaible .
Stage of development
It is also important to establish at which developmental stage plants are most responsive
to the priming/stress treatment, bearing in mind the practical amount of material that
further analysis required. It is likely that priming has a different effect depending on the
stage of development when it is applied. Thus, priming of seeds could have a different
effect from priming seedlings or mature plants due to development specific gene
expression or structural properties (Catusse et al., 2008). Here, four different key stages
of development (seed, one day after germination-G0, two real leaves-2L and four real
leaves-4L), were considered for the priming treatment.
Evaluation method to test the effectiveness of the treatment
The final outcome of the experiment was difficult to establish because the priming
treatment did not result in a clearly visible phenotype. Hence, a molecular marker was
needed. Two candidate responsive genes (rd29A and P5C1S) were selected on the basis
of previously published transcriptional responses to high salinity stress (Yoshiba et al.,
1999; Yamaguchi-Shinozaki and Shinozaki, 1993). However, the choice of a few individual
molecular markers without knowing if they are targets of priming treatment is
problematic. For this reason a wider approach using microarrays was also taken.

Physiological analysis of priming
45
3.2 Results
3.2.1 Experimental design
Figure 3.2 details the experimental protocol designed on the basis of the reasoning given
in the previous section.
Four different developmental stages of A. thaliana (seed, one day after germination-G0,
two real leaves-2L and four real leaves-4L), were subjected to the priming treatments,
one moderately harmful (50 mM) and one rather critical (100 mM). The salt priming
solution was left in direct contact with the roots (or seeds) for 24 hours. Non-primed
control plants were treated with 0 mM NaCl. After 24 hours both primed and non-primed
plants were transferred to new plates without the salt solution. The plants were then
grown until they reached the 4L stage (three weeks), and then individually transferred to
hydroponic culture. The second salt stress was provided 10 days after priming treatment
occurred, by adding granular salt directly to the hydroponic media to reach the final
concentration of 80 mM.
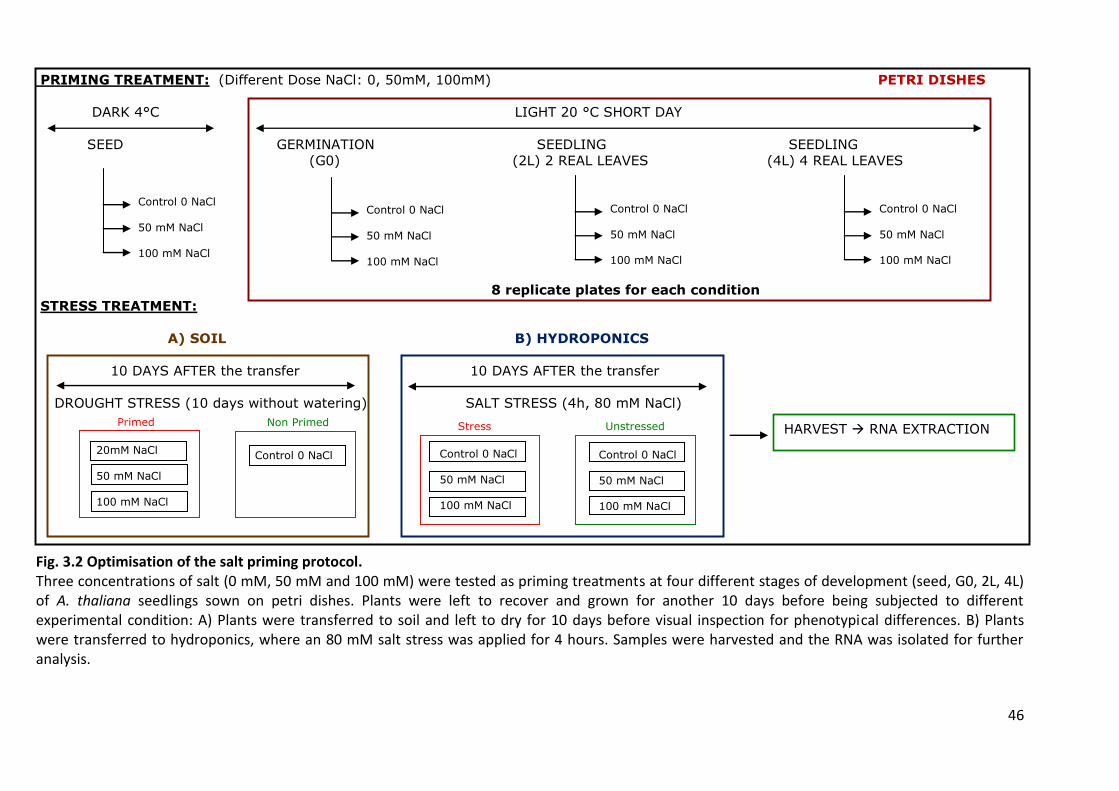
46
PRIMING TREATMENT: (Different Dose NaCl: 0, 50mM, 100mM) PETRI DISHES
DARK 4°C LIGHT 20 °C SHORT DAY
SEED GERMINATION SEEDLING SEEDLING
(G0) (2L) 2 REAL LEAVES (4L) 4 REAL LEAVES
8 replicate plates for each condition
STRESS TREATMENT:
A) SOIL B) HYDROPONICS
10 DAYS AFTER the transfer 10 DAYS AFTER the transfer
DROUGHT STRESS (10 days without watering) SALT STRESS (4h, 80 mM NaCl)
Fig. 3.2 Optimisation of the salt priming protocol. Three concentrations of salt (0 mM, 50 mM and 100 mM) were tested as priming treatments at four different stages of development (seed, G0, 2L, 4L) of A. thaliana seedlings sown on petri dishes. Plants were left to recover and grown for another 10 days before being subjected to different experimental condition: A) Plants were transferred to soil and left to dry for 10 days before visual inspection for phenotypical differences. B) Plants were transferred to hydroponics, where an 80 mM salt stress was applied for 4 hours. Samples were harvested and the RNA was isolated for further analysis.
Control 0 NaCl 50 mM NaCl 100 mM NaCl
Control 0 NaCl 50 mM NaCl 100 mM NaCl
Control 0 NaCl 50 mM NaCl 100 mM NaCl
Control 0 NaCl 50 mM NaCl 100 mM NaCl
HARVEST RNA EXTRACTION
20mM NaCl 50 mM NaCl 100 mM NaCl
Non Primed Primed
Control 0 NaCl Control 0 NaCl 50 mM NaCl 100 mM NaCl
Control 0 NaCl 50 mM NaCl 100 mM NaCl
Unstressed Stress

Physiological analysis of priming
47
3.2.2 Effect of priming before second stress
To investigate a somatic memory that is not simply due to differences in growth or
development caused by the priming treatment, it was important that the priming
treatment had no effect on the plant morphology. In accordance with this Fig. 3.3 shows
that there was no delay in growth or development of plants that had been primed with 50
mM NaCl.
Two days (upper panel Fig.3.3) or ten days (lower panel Fig.3.3) after the transfer from
plates to the hydroponics culture, there were no visible differences in phenotype
between primed plants and non-primed plants. Thus, at the time when the second stress
was applied (lower panel Fig.3.3) the primed plants were morphologically
indistinguishable from non-primed plants. The same was true for plants primed at other
developmental stages with the same or lower concentrations of NaCl (data not shown).
However, plants primed with 100 mM NaCl sometimes showed slower growth (see for
example Fig.3.4)

Physiological analysis of priming
48
Fig. 3.3 Effect of salt priming on plant growth. In A are shown plants that had been primed at 4L stage with 50 mM salt for 24h or not (control), two days after transfer from plates to hydroponics. In B are shown plants that had been primed at 4L stage with 50 mM salt for 24h or not (control), ten days after transfer from plates to hydroponics, the day when the salt stress was applied.
CONTROL PRIMED 50mM
2 DAYS
10 DAYS
DAYS IN HYDROPONIC
B
A

Physiological analysis of priming
49
3.2.3 Effect of priming on plant drought tolerance
As discussed in the general Introduction, treatment of plants with salt for a short period
of time induces osmotic stress rather than sodium toxicity. It is therefore reasonable to
speculate that a 24h salt priming treatment could protect the plant against osmotic stress
e.g. drought. Moreover, several studies indicate that, at the beginning of a stress, plants
activate non-specific protective responses independently of the nature of the stress
applied (Golldack et al., 2011; Mittler, 2006; Kilian et al., 2007).
To investigate this hypothesis in a first experiment A. thaliana plants were grown under
long-day conditions (16 h light/8 h dark) for three weeks at 22 °C in a growth chamber
and were primed on plates for 24 h with different concentrations of salt (0, 50, 100 mM).
The day after, 30 plants were transferred to soil in two trays containing 15 plants each,
and then watered for 10 days. Plants were then transferred into a greenhouse and left to
dry for 10 days. Visual inspection showed clear differences between primed and non-
primed plants (Fig.3.4). Primed plants survived the drought stress while non-primed
plants were dead. To assess whether the priming effect was dependent on other
environmental factors an additional experiment was carried out.
10 days after the salt priming, all plants (including non-primed) were exposed to a heat
stress of 38 °C for 6 and 24 hours. Plants were watered once after the heat treatment and
then left to dry. The plants coped generally better with the drought stress than the plants
in the previous experiments that had not been exposed to a short period of heat stress.
Nevertheless, the difference between primed and non-primed plants was still apparent.
Fresh weight, dry weight and rosette area determined 10 days after the last watering
were always greater in primed plants than non-primed plants, and primed plants looked
overall healthier than non-primed plants (Fig. 3.5). However, the length of the heat
treatment modified the sensitivity of the plants to the salt concentration applied during
priming. The strongest effect was obtained with 50 mM NaCl-priming and at 6h heat
treatment.

Physiological analysis of priming
50
Fig. 3.4 Effect of drought stress on primed and non-primed plants. Control (non-primed) plants (upper panel), 50 mM NaCl-primed plants (central panel) and 100 mM NaCl-primed plants (lower panel) 10 days after the last watering. This experiment was carried out in duplicate and the two replicates showed the same phenotypical result.
50 mM primed
100 mM primed
Non-primed

Physiological analysis of priming
51
0.0
0.1
0.2
0.3
0.4
0.5
0.6
0.7
Control 20mM 50mM 100mM
Fre
sh w
eig
ht/g
FRESH WEIGHT
0.0
0.1
0.2
0.3
0.4
0.5
0.6
Control 20mM 50mM 100mM F
resh w
eig
ht/g
FRESH WEIGHT
0.00
0.01
0.02
0.03
0.04
0.05
0.06
Control 20mM 50mM 100mM
Dry
weig
ht/g
DRY WEIGHT
0.00
0.01
0.02
0.03
0.04
0.05
0.06
Control 20mM 50mM 100mM
Dry
weig
ht/g
DRY WEIGHT
0
2
4
6
8
10
12
14
Control 20mM 50mM 100mM
Rosette a
rea/c
m2
ROSETTE AREA
0
5
10
15
20
25
Control 20mM 50mM 100mM
Rosette a
rea/c
m2
ROSETTE AREA
6h 38C 24h 38C
Fig. 3.5 Effect of drought stress on primed and non-primed plants after additional pre-exposure to a short heat treatment. The upper row of panels shows plants primed with different concentration of salt (0, 100, 50, 20 mM), exposed to 24h of heat stress and finally subjected to drought for 10 days. The graphs show fresh weight, dry weight and rosette area of salt primed (20 mM, 50 mM, 100 mM NaCl) and non-primed (0 mM NaCl) plants, exposed to heat (38 C) for 6 hours (left) or 24 hours (right) and left to dry for 10 days.
Control 20mM 50mM 100mM

Physiological analysis of priming
52
3.2.4 Effect of priming on transcriptional responses to a second salt stress treatment
Optimization of a reference gene for qPCR analysis
Initially, priming-induced differences at the molecular level were investigated by
measuring transcript levels of known salt/osmotic stress induced genes by qPCR. This
technique permits one to accurately quantify gene expression, measuring the amount of
cDNA of a gene of interest. The obtained values are normalized to a “constitutively
expressed” reference gene that shows equal levels of expression across conditions. The
normalization permits direct comparison of expression of a gene of interest in different
samples. However, many studies have reported that the most commonly used reference
genes can vary considerably, depending on conditions, tissues or the ecotypes
(Vandesompele et al., 2002; Nolan et al., 2006). Therefore, it was of high importance to
identify a good reference gene for the experimental conditions and tissues used here.
Appropriate reference genes were identified using geNorm software, which determines
the stability of expression across a representative set of samples by comparing their Ct
values (Vandesompele et al., 2002). geNorm is an algorithm that selects an optimal pair of
reference genes out of a larger set of candidate genes. It calculates and compares the so
called M-value of all candidate genes, eliminates the gene with highest M-value, and
repeats the process until there are only two genes left. An M-value describes the
variation of a gene compared to all other candidate genes. The last pair of candidates
remaining is recommended as the optimum pair of reference genes.
Five common reference genes (UBQ4, EF1, YLS8, TUB9, ALFA-ALFA) and two additional
genes At4g35800 and At1g56070 (selected from publicly available microarray data) were
selected as starting set of candidate references genes (Hruz et al., 2008). Ct values for
each gene were determined in cDNA sample derived from root and shoot of 4L plants
subjected to two priming treatments (0, 50 mM NaCl) and two stress treatments (0, 80
mM NaCl, 4h). geNorm identified At4g35800 and At1g56070 as the best reference genes
for this particular experiment for both shoots and roots (Fig.3.6).

Physiological analysis of priming
53
A)
B)
Fig. 3.6 Stability of candidate reference genes in shoots (A) and roots (B). Variation of Ct values of candidate genes (UBQ4, EF1, YLS8, TUB9, alfa-alfa, At4g35800 and At1g56070) in four samples (primed, non-primed, stress and non-stressed) as determined by qPCR and geNorm software. From left to right are plotted the most stable transcripts across all 4L stage shoots samples.
UB4 EF1 YLS8 TUB9 B-alfa-alfa At4g35800 At1g56070
Less stable More stable
Average expression stability of candidate reference genes in shoots
Vari
ation
Alfa-alfa EF1 TUB9 UBQ4 YLS8 At4g35800 At1g56070
Less stable More stable
Average expression stability of candidate reference genes in roots
Vari
ation

Physiological analysis of priming
54
Primed plants respond differently to salt stress depending on the stage of development
at which the priming treatment is applied
qPCR analysis was carried out on shoots samples of plants primed at different stages of
development to detect changes in the expression level of two known salt stress-
responsive genes, Rd29A (a transcription factor involved in drought, salt and cold
responses) and P5CS-1 (Delta 1-pyrroline-5-carboxylate synthetase, an enzyme involved
in the synthesis of proline, induced by ABA and salt) (Yoshiba et al., 1999; Yamaguchi-
Shinozaki and Shinozaki, 1993). Two biological replicates were carried out. The transcript
levels of Rd29A and P5CS-1 always increased after the salt treatment independently of
the stage of priming or the concentration used. These results clearly attested the
efficiency of the treatment (Fig.3.7-3.8). However, the amount of up-regulation
(“response”) was dependent on the stage of development at which priming was applied
and on the concentration of NaCl used for priming. Very similar expression patterns were
observed for Rd29A (Fig.3.7) and P5CS-1 (Fig.3.8). Plants primed at the “G0 stage” showed
a slightly increased response to salt compared to non-primed plants and this effect was
more pronounced in 100 mM NaCl primed plants than in 50 mM primed plants. In
contrast, plants primed at seedling stage (2L and 4L) showed a weaker response than
non-primed plants. Again this effect was more pronounced in 100 mM NaCl primed plants
than in 50 mM primed plants. Plants primed at seed stage showed less clear expression
patterns with both base levels and responses of transcripts varying between differentially
primed plants. This variability among developmental stages in the transcriptional
response to the stress upon priming suggests a different perception of the stress and its
signalling network between embryonic tissue (Seed and G0 stage) and adult tissues (2L-4L
stage).

Physiological analysis of priming
55
Fig. 3.7 Relative transcript level of Rd29A in shoots samples from plants primed at four different stages of development. RNA was isolated from plants primed with two different concentrations of salt (50 mM, 100 mM) or 0 mM NaCl (C) at the stage of development indicated (seed, G0, 2L and 4L) and later exposed for 4 hours to salt treatment with 80 mM (+) or not (-). Values are averages of 3 technical replicates ± SE, each normalised to the respective value obtained for the reference gene RpII.
0
50
100
150
200
250
300
350
400
C- C+ P50- P50+ P100- P100+
Re
lati
ve e
xpre
ssio
n R
d2
9A
/Rp
II
4L priming
0
20
40
60
80
100
120
140
C- C+ P50- P50+ P100- P100+
Re
lati
ve
ex
pre
ss
ion
Rd
29
A/R
pII
4L priming
0
50
100
150
200
250
300
350
400
C- C+ P50- P50+ P100- P100+
Re
lati
ve e
xpre
ssio
n R
d2
9A
/Rp
II
Seed priming
0
50
100
150
200
250
300
350
400
C- C+ P50- P50+ P100- P100+
Re
lati
ve e
xpre
ssio
n R
d2
9A
/Rp
II
G0 priming
0
50
100
150
200
250
300
350
400
C- C+ P50- P50+ P100- P100+
Re
lati
ve e
xpre
ssio
n R
d2
9A
/Rp
II
2L priming
0
10
20
30
40
50
60
70
80
90
100
C- C+ P50- P50+ P100- P100+R
ela
tiv
e e
xp
res
sio
n R
d2
9A
/Rp
II
Seed priming
0
10
20
30
40
50
60
70
80
90
C- C+ P50- P50+ P100- P100+
Re
lati
ve
ex
pre
ss
ion
Rd
29
A/R
pII
2L priming

Physiological analysis of priming
56
Fig. 3.8 Relative transcript level of Proline Synthase (P5CS1) in shoots samples from plants primed at four different stages of development. RNA was isolated from plants primed with two different concentrations of salt (50 mM, 100 mM) or 0 mM NaCl (C) at the stage of development indicated (seed, G0, 2L and 4L) and later exposed for 4 hours to salt treatment with 80 mM (+) or not (-). Values are averages of 3 technical replicates ± SE, each normalised to the respective value obtained for the reference gene RpII.
0
1
2
3
4
5
6
C- C+ P50- P50+ P100- P100+
Re
lati
ve e
xpre
ssio
n P
5C
S1/R
pII
Seed priming
0
1
2
3
4
5
6
C- C+ P50- P50+ P100- P100+
Re
lati
ve e
xpre
ssio
n P
5C
S1/R
pII
G0 priming
0
1
2
3
4
5
6
C- C+ P50- P50+ P100- P100+
Re
lati
ve e
xpre
ssio
n P
5C
S1/R
pII
2L priming
0
1
2
3
4
5
6
C- C+ P50- P50+ P100- P100+
Re
lati
ve e
xpre
ssio
n P
5C
S1/R
pII
4L priming
0
0.5
1
1.5
2
2.5
C- C+ P50- P50+ P100- P100+
Re
lati
ve
ex
pre
ss
ion
P5
CS
1/R
pII
G0 priming
0
0.1
0.2
0.3
0.4
0.5
0.6
0.7
C- C+ P50- P50+ P100- P100+
Re
lati
ve
ex
pre
ss
ion
P5
CS
1/R
pII
2L priming
0
0.5
1
1.5
2
2.5
3
C- C+ P50- P50+ P100- P100+R
ela
tiv
e e
xp
res
sio
n P
5C
S1
/Rp
II
4L priming

Physiological analysis of priming
57
The expression patterns of P5CS1 and Rd29A suggest that when priming was applied to
seedlings (2L and 4L) the plants were responding consistently differently to the second
salt treatment. The basal level of the transcripts before the stress exposure was very
similar in primed and non-primed plants. Thus, the priming treatment affected the
transcriptional response to salt without changing the base level of the transcripts. Priming
at G0 stage also changed the stress responsiveness of the plants. Also, taking into account
that ChIP-Seq analysis requires a large amount of fresh material, it was decided to use
plants primed at 4L stage for all subsequent experiments. Priming with 50 mM NaCl was
selected as the most efficient concentration of salt for priming with no apparent impact
on plants growth and development. The final experimental design is summarized in the
chapter Materials and Methods Fig.2.1.
3.2.5 Effect of priming on plant sodium uptake
The results of the previous sections showed that priming modulated early transcriptional
responses of genes to the application of 80 mM NaCl. This concentration is known to
negatively impact on plant growth if applied for several days due to accumulation of toxic
Na+ concentration in the plant (Wang et al., 2006). But the early response will be
dominated by adjustment to the osmotic stress. To investigate whether priming also had
an effect on how the plants dealt with the ionic (sodium) stress component, the
concentration of Na+ accumulated in roots and shoots of primed and non-primed plants
was measured over a period of 24 hours after salt application. As expected from other
studies, non-primed plants showed an initial increase in root Na+ concentration and a
steady increase of Na+ concentration in the shoots. Primed plants also showed an initial
increase in root Na+, but they accumulated considerably less Na+ in their shoots over the
entire 24 hour time-course (Fig.3.9). Because a similar phenotype had been described for
mutants in the root xylem Na+ transporter HKT1 (see Introduction 1.1), the transcript
level of this gene was measured in roots and shoots. qPCR results confirmed root
specificity of HKT1 expression and showed induction of the gene upon salt treatment. It
also revealed that HKT1 transcript levels were expressed in primed roots when the stress
occurred (Fig.3.10). However, despite the observed differences in Na+ uptake no obvious

Physiological analysis of priming
58
difference in salt tolerance between primed and non-primed plants was apparent if plants
were left in the salt solution for longer periods of time (10 days).

Physiological analysis of priming
59
A)
B)
Fig. 3.9 Sodium content in shoots (A) and roots (B) of primed (red) and non-primed (blue) plants at different time points after application of 80 mM NaCl. Values are means ± SE of four plants.
0
5
10
15
20
25
0 2 4 8 24
Sho
ot
Na+
[m
g/g]
Control
Primed
0
5
10
15
20
25
0 2 4 8 24
Ro
ots
Na+
[m
g/g]
Time after 2nd salt treatment [hours]
Control
Primed

Physiological analysis of priming
60
A) ROOTS
B) SHOOTS
Fig. 3.10 Transcript levels of HKT1 in primed and non primed plants. RNA was isolated from shoots (A) and roots (B) of plants primed with 50 mM (P) or 0 mM NaCl (C) at 4L stage of development and later exposed for 4 hours to salt treatment with 80 mM (+) or not (-). Values are averages of 3 technical replicates ± SE, each normalised to the respective value obtained for the reference gene RpII. Results obtained in three independent experiments are shown.
0
3
6
CR- PR- CR+ PR+
Re
lati
ve e
xpre
ssio
n H
KT1
/Rp
II
0
1.4
2.8
CR- PR- CR+ PR+ R
ela
tive
exp
ress
ion
HK
T1/R
pII
0
7
14
CR- PR- CR+ PR+
Re
lati
ve e
xpre
ssio
n H
KT1
/Rp
II
0
0.07
0.14
CS- PS- CS+ PS+
Re
lati
ve e
xpre
ssio
n H
KT1
/Rp
II
0
0.07
0.14
CS- PS- CS+ PS+
Re
lati
ve e
xpre
ssio
n H
KT1
/Rp
II
0
0.6
1.2
CS- PS- CS+ PS+
Re
lati
ve e
xpre
ssio
n H
KT1
/Rp
II

Physiological analysis of priming
61
3.3 Discussion
3.3.1 Establishment of an effective priming protocol
In this first part of the thesis it was shown that a transient priming treatment of A.
thaliana plants with 50 mM NaCl at the 4L-seedling stage led to enhancement of drought
tolerance of adult plants and modulation of early transcriptional responses to a second
salt treatment applied 10 days after the priming treatment. In addition, the expression
pattern of the Na+ transporter HKT1 and Na+ uptake into shoots upon the second stress
treatment were altered in primed plants. However, these effects did not lead to
enhanced long-term tolerance to salt. This finding is in accordance with the notion that a
24h priming treatment is not long enough for the plants to accumulate Na+ to toxic levels
and hence to induce protective mechanisms that are needed to deal effectively with ion
toxicity, which is the predominant stress factor during long-term salt stress (Munns and
Tester, 2008). This work therefore established an effective protocol for osmotic priming
of A. thaliana plants and provided a first quantitative proof of a long-term somatic
“memory” of A. thaliana plants for osmotic stress, both at physiological and molecular
level. The period of time between the transient priming treatment and the second stress
was at least 10 days. During this time the plants increased their biomass by a factor of
approx. 10 times (average fresh weight of 4L-seedlings was 0.01 g, while average fresh
weight of plants at time of second stress was 0.1 g, respectively). This means that any
molecular entities (e.g. transcriptional factors, etc.) would have been considerably diluted
in the tissues at the time of the second treatment. The established protocol therefore
provides an excellent basis for investigating the involvement of epigenetic processes in
somatic stress memory.

Physiological analysis of priming
62
3.3.2 Developmental stage is important to overcome of priming
Plants primed at the seedling stage (2 and 4 real leaves) showed lower expression levels
of Rd29A and P5CS1, when exposed to salt stress compared to the non-primed plants.
Interestingly priming applied at G0 stage of germination had the opposite effect. G0
priming was applied after the seeds were completely imbibed and put on plates. This
phase is recognized as germination in sensu strictu, during which important metabolic
processes are initiated. At this crucial point a decision was made whether to continue
towards radicle emergence and plantlet establishment or to remain in the dormant state,
as would be the case during adverse environmental conditions such as salt or drought
(Finch-Savage and Leubner-Metzger, 2006; Catusse et al., 2008). Our results indicate that
transcriptional responses to the same treatment differ depending on whether the stress
occurs before or after this checkpoint, but they do not differ during the later stages of
development (2L to 4L). This also suggests a different perception of the stress and its
signalling network between the embryonic tissues and the adult tissues might occur.
3.3.3 Effect of priming on drought tolerance is additive to the effects of temperature
Plants often respond to different stresses by activating the same protective mechanism
(Kilian et al., 2007; Mao et al., 2011; Kreps et al., 2002). This could be because the
simultaneous combination of stresses is frequently imposed on plants, e.g. drought stress
is often accompanied by high salinity or high temperature (Mittler, 2006) or because
different stresses often cause similar problems particularly in early stages of growth
(Wang et al., 2003; Mahajan and Tuteja, 2005; Hussain et al., 2010; Golldack et al., 2011).
For example, a high external salt concentration lowers the water potential in the soil and
hence presents a challenge for root water uptake that is similar to what is caused upon
drought or freezing (Munns and Tester, 2008). Table 3.1 summarises the problems caused
and the protective mechanisms induced for a number of environmental conditions.
Overlapping responses also occur at the level of transcription. It has been shown that a
large number of drought-inducible genes are also induced by salt stress (Kilian et al.,
2007). The observation that salt priming had a positive effect on drought tolerance is
therefore reasonable and it suggests that drought tolerance is based on protection

Physiological analysis of priming
63
against osmotic stress. Furthermore, it was found here that the salt priming effect was
additive to the temperature-priming, re-enforcing the hypothesis that overlapping
mechanisms can enhance the stress tolerance. In both experiments the plants generally
coped better with the drought stress showing an enhancement in all the parameters
previously mentioned when they had experienced the salt-priming treatment. In
summary, the results indicate a scenario as shown in Fig. 3.11: (1) Priming treatment
leads to osmotic protection and drought tolerance (green arrows). (2) A short heat
treatment, was found to be also beneficial when plants were under drought stress (red
arrows) possibly due to the induction of additional protective mechanisms (e.g. ROS
detoxification). (3) Long-term salt tolerance would require additional protection against
ion toxicity (blue arrows) which is not provided by the short priming treatment.
3.3.4 Potential role of HKT1 in primed plants
The sodium uptake experiment showed that primed plants accumulated less Na+ in their
shoots. Shoot Na+ accumulation is known to be controlled by the root xylem Na+
transporter HKT1 and indeed HKT1 was found to have higher transcript levels in primed
than in non-primed plants. The results are interesting in several aspects. Firstly, they
indicate that the priming treatment did induce ionic and not just osmotic responses
triggered directly by high external Na+ rather than high internal Na+. The notion that
external Na+ can act as a signal in its own right is supported by the fact that it induces a
cytoplasmic calcium signal, which in turn regulates Na+ transporters via the CBL/CIPK
(SOS) pathway (Liu et al., 2000; Halfter et al., 2000). Secondly, a lower Na+ content in
shoots of primed plants 4 hours after application of the second stress (Fig. 3.9) could
explain why the stress marker genes showed a weaker transcriptional response (Fig. 3.7-
3.8); the primed plants were simply less ‘stressed’. Thirdly, lower Na+ uptake should delay
the onset of Na+ toxicity and therefore delays, if not prevents, stress symptoms and plant
death. This is in contrast to the finding that primed plants were not more tolerant to salt
in the long term. However, the tolerance was assessed here by scoring survival after 10
days. A more detailed scoring of symptoms at a better time resolution needs to be carried
out to assess whether salt stress was delayed in primed plants. It is also possible that the
beneficial effect of HKT1 induction is only transient.

Physiological analysis of priming
64
Tab. 3.1 Summary of cross protection mechanisms enhancing stress tolerance.
Stress Problem at tissue/cell level Protective mechanism Tolerance
Salt Na/Cl toxicity Ion transport e.g. HKT1, and compartmentalization
Salt, drought
Osmotic imbalance Increase osmotic potential inside the cells (e.g. compatible osmolites such as proline)
Water loss Stomatal closure
Drought Protein denaturation Chaperones Salt, drought, freezing
DNA damage DNA repair
ROS, oxidative stress Anti-oxidant
Freezing Salt, drought, freezing Structural instability of
proteins/nucleic acids Chaperones
Cellular dehydration Osmo-protecting
ROS, oxidative stress Anti-oxidant
Membrane fluidity Changes in lipid components
Heat ROS, oxidative stress Anti-oxidant Salt, drought, heat Water loss Stomatal closure
Fig. 3.11 Salt priming and cross protection.
Ionic stress
Sodium toxicity protection
Tolerance against long-term salt stress
Osmotic stress
Osmotic protection
Tolerance against drought
ROS protection
SALT
Priming treatment
Heat stress

65
Chapter 4: Quantifying the effect of priming: expression profile
4.1 Introduction
4.1.1 Background
In the previous chapter it was shown that a transient priming treatment of seedlings
modified the transcriptional response of two osmotic-stress marker genes to a second
salt treatment 10 days later. This result raised the question which other set of genes
respond differently in primed plants? In this chapter the effect of priming on the
transcriptional responses of primed and non-primed plants was analysed at the level of
the entire transcriptome using microarrays.
Numerous microarray analyses, studying the response of Arabidopsis to NaCl, have been
made publicly available through several databases (See Introduction 1.2). For example,
some studies have identified the convergent and divergent pathways between salinity
and other abiotic stress responses (Ma et al., 2006; Kreps et al., 2002). While others have
investigated the kinetics of salt stress at several different time points (Kilian et al., 2007),
or the tissue-specific response to the stress (Jiang and Deyholos, 2006). All together the
results from these microarray profiles have revealed that the vast majority of the genes
identified are responding to a range of different stresses and only a small number of
genes were strictly salt-specific but importantly all were localized in the roots (Ma et al.,
2006; Kreps et al., 2002). Also the alterations in gene expression occur rapidly within 30
min after the application of stress (Kilian et al., 2007). The vast majority of the stress
responsive genes showed dynamic changes in transcript abundance with different
turnovers. Finally, results of functional enrichment analysis generally showed stress
response genes including hundreds of transcription factors, kinases/phosphatases,
hormone-related genes and effectors of homeostasis, and overall emphasized the
complexity of this stress response (Jiang and Deyholos, 2006). Even though these data
provided a detailed understanding of the pathways that are induced by salinity stress in

Quantifying the effect of priming
66
A. thaliana, no available transcriptomic data describes the effect of salt priming on the
transcriptional responses of Arabidopsis roots and shoots to NaCl treatment.
4.1.2 Aims of the chapter
In this chapter I describe the influence of priming on the genome-wide transcriptional
response of Arabidopsis plants after exposure to salt treatment. This is the first study to
my knowledge that investigated the effect of salt priming using a global expression
profiling strategy. Arabidopsis Affymetrix GeneChip ATH1 microarray was used, which
provided probe sets for approximately 23,000 genes. When a broad approach of this type
is taken technical factors, such as salt applications, processing of samples or quality of
probe hybridisation might obscure the biological responses. It is therefore very important
to identify which factors are influencing the data set, and also to eliminate undesired
effects in order to extract reliable results. For these reasons several different statistical
approaches were carried out to identify genes and pathways related to salt priming. The
differences detected by microarray analysis were further confirmed by Real Time
quantitative PCR. The final part of the chapter presents an analysis of functional
annotations of the genes differentially responsive to salt stress between primed and non-
primed plants. Also, possible roles of priming and molecular targets are discussed.

Quantifying the effect of priming
67
4.2 Methods for the chapter
Plants growth and treatments, RNA extractions, microarray hybridisation and PCR
methods are described in Chapter 2.
4.2.1 Statistical approaches and software used
Affymetrix® Expression Console™ version 1.1 was used in order to analyze the microarray
quality of the samples. Partek® Genomics Suite™ version 6.10.1020 was used to normalize
the microarray data and to analyse differential gene expression in the samples by Analysis
of Variance (ANOVA). Functional annotation gene clusters, were made using the free
access software The Database for Annotation, Visualization and Integrated Discovery
(DAVID).
Quality control and normalization
Quality control on the microarray data was performed using the software Expression
Console™ (version 1.1). The software also performs data normalization using robust
multi-array average (RMA) of the signal intensities adjusting the signal values to a
common median for subsequent comparison.
Vector Analysis (VA)
The challenge of this study resided in the two-factor nature of the comparison (+/- salt,
+/- priming). Vector analysis provides a tool to quantitatively compare transcriptional
responses (+/-salt) between two different backgrounds (e.g. wild type/mutant, here
primed/not-primed) (Breitling et al., 2005). The basic principle is to represent the
response of each gene by a vector in a Cartesian plane. Various sectors of the plane will
correspond to various prototypical behaviour of gene: genes that respond the same in
both factors, genes that respond in opposite directions or genes that are changed only in
one of the factors. Depending how the vector is oriented along the plane it is possible to
establish how the gene(s) behave (Fig.4.1). Importantly, this method allows one to

Quantifying the effect of priming
68
establish the statistical significance of the behaviour of each gene by calculating a sum
vector based on all replicates.
Fig. 4.1 Schematic representation of vector analysis. On the two axes is reported the normalized fold change of transcript in response to salt in primed (y-axis) and non-primed (x-axis) plants. The plane can be systematically subdivided into sectors corresponding to the main behaviour types that are possible. In the centre, genes show very little response in either condition (white). Other genes respond about the same in both conditions (blue sector), are specifically changed in only one background (green), or are regulated in opposite directions in primed and non-primed plants (red).
Principal Component Analysis (PCA)
PCA is a mathematical algorithm that reduces the dimensionality of the data while
retaining most of the variation in the data set. The idea behind PCA is to identifying
directions (principal components), along which the variation of the data is maximal
(Ringnér, 2008). As a result, each individual sample can be represented by using a few
components rather than values for thousands of variables. Samples can then be plotted
for pairs of components, making it possible to visually assess similarities and differences
between samples and to determine whether samples can be grouped (Ringnér, 2008). In
other words the more the samples are separated along a component the more the
samples differ from each other.
PR
IMED
NOT PRIMED
Quantifying the effect of priming
69
Analysis of Variance (ANOVA)
ANOVA (Zar, 1999) is a statistical technique which is useful to establish if significant
differences occur between groups. The idea behind ANOVA is to divide the total
variability into variability between groups and variability within groups. If the variability
between groups is large compared to the variability within groups, as determined via a
statistical test, conclude that there are significant differences between groups (Zar, 1999).
The analysis was performed within the software Partek® Genomics Suite™.
Database for Annotation, Visualization and Integrated Discovery (DAVID)
DAVID software (Huang et al., 2009) was used to generate functional annotation clusters
which are enriched within a certain set of genes. The functional categories can be derived
from various sources (i.e. Gene Ontology, BLAST result key words, KEGG database) and
the detection algorithm will calculate the probability that the number of genes belonging
to a cluster is random with the respect to the number in a chosen background e.g. the
Arabidopsis genome. A p-value is extracted together with a fold discovery rate and an
enrichment score.

Quantifying the effect of priming
70
4.3 Results
4.3.1 Quality dataset control and normalization
To compare transcriptional profiles, RNA samples were extracted from 15 plants grown
under controlled conditions in three independent experiments. In brief, three weeks old
(4L-stage) plants were primed for 24h (P) or not (C) and 10 days later exposed to 80 mM
salt treatment for 4h (+) or not (-); samples were separated into shoots and roots and
RNA was extracted, labelled and hybridized to Affymetrix® GeneChip™ ATH1 (see Chapter
2).
A total of 24 arrays (two tissues, four conditions C-, C+, P-, P+, three replications) were
performed. The hybridization intensities of the probes were recorded in the form of
Affymetrix® .CEL files by GCOS software used at the Glasgow Polyomics Facility. This
software operates a preliminary correction for the background noise within the individual
probes belonging to a probe set. The presence of outlier samples was identified using the
software Expression Console (v.1.1) that contains graphic capabilities for visual inspection
of the hybridization results. In Fig. 4.2 is reported a box plot created prior to any
normalization, loading the Affymetrix® .CEL files obtained from the individual samples.
The plot summarizes the distribution of the intensities from one array compared to the
median probe intensity across all arrays. If individual arrays are different from the other
replicates in the same group (in this case shoots and roots), the box will shift up or down
with respect to the median value.
The arrays of the replicate E3 for both roots and shoots clearly showed lower probe
intensities then the other arrays. The individual array sample E1RC- showed slightly
higher intensities relative to its roots groups as well as E1SC- and E1SP+ in shoots group
(Fig.4.2). This data demonstrates that in order to allow analysis without biases it is
essential that all data are subjected to normalization. Expression Console uses the Robust
Multichip Analysis (RMA) algorithm that provides a robust linear model at the probe level
to minimize the differences of probe-specific affinity. Fig.4.3 shows the relative log probe
cell intensities of roots and shoots samples after RMA normalization; all the values are
now comparable in intensity.

Quantifying the effect of priming
71
Fig. 4.2 Relative Log Probe Cell Intensities of root (left) and shoot (right) samples before RMA normalization. Each box represents the distribution of the probe intensity values for each sample relative to the median of intensities of their replicate group (E1, E2, and E3). (E: replicate number, R: Roots, S: Shoots, p: primed, C: non-primed, +: salt applied, -: no salt applied).
Fig. 4.3 Relative Log Probe Cell Intensities of roots (left) and shoots (right) samples after RMA normalization. Each box represents the distribution of the probe set intensities for each sample adjusted to the median of intensity values of their replicate group after RMA normalization. (E: replicate number, R: Roots, S: Shoots, P: primed, C: non-primed, +: salt applied, -: no salt applied)
E53
P-
E3R
P+
E3R
C-
E3R
C+
E1R
P-
E1R
P+
E1R
C-
E1R
C+
E2R
P-
E2R
P+
E2R
C-
E2R
C+
E3SP
-
E3SP
+
E3SC
-
E3SC
+
E1SP
-
E1SP
+
E1SC
-
E1SC
+
E2SP
-
E2SP
+
E2SC
-
E2SC
+
Roots samples Shoots samples
Roots samples Shoots samples
E3SP
-
E3SP
+
E3SC
-
E3SC
+
E1SP
-
E1SP
+
E1SC
-
E1SC
+
E2SP
-
E2SP
+
E2SC
-
E2SC
+
E53
P-
E3R
P+
E3R
C-
E3R
C+
E1R
P-
E1R
P+
E1R
C-
E1R
C+
E2R
P-
E2R
P+
E2R
C-
E2R
C+

Quantifying the effect of priming
72
Fig. 4.4 shows the comparison of the distribution of signal intensities within the two
groups of samples, generated by Expression Console™. The graphs were created by
plotting the number of probe sets (y-axis) producing a certain signal intensity (x-axis) for
each sample. Fig. 4.4 confirmed that samples originated from the same tissue presented a
similar pattern of gene expression. In detail, the vast majority of genes showed low
expression under all conditions, as represented in the graph by the highest peak at low
signal intensities. The curve drops to moderate intensity values before peaking again at a
lower level than the previous peak showing that a large number of genes were expressed
at moderate levels. Finally after the second peak there is a slow decrease, indicating that
there was a relatively small, but still a significant number of genes that were highly
expressed in the samples.

Quantifying the effect of priming
73
Fig. 4.4 Probe intensity distribution of root (top graph) and shoot (bottom graph) samples after RMA. X-axis: intensities range, y- axis number of probes producing certain intensity. Different coloured lines represent the different samples.
Nu
mb
er o
f p
rob
es
Nu
mb
er o
f p
rob
es

Quantifying the effect of priming
74
4.3.2 Priming induced changes in the transcriptional response
4.3.2.1 Data files
Raw data in the form of CEL files were loaded into the software Partek® Genomics Suite™
and subjected to RMA normalization along with a batch correction. Two text files (one for
root and one for shoot samples) including the collection of the normalized probe signal
intensities for all the four conditions and the three replicates were generated. Without
any further filtering, all probe signal intensities were loaded into Microsoft Excel© (24
columns) together with Affymetrix probe identifier, AGI code and TAIR10 annotations,
and subjected to different calculations.
4.3.2.2 Genes differentially expressed in primed and control plants without second
stress
Fig.4.5 A-B shows the average signal intensities of the primed plants without salt
exposure (P-) plotted against the average signal intensities of the control plants without
salt exposure (C-). For both shoots (A) and roots (B) the vast majority of points were
positioned close to a linear regression line with a slope of 1 representing equal x and y
values. This indicated that the priming treatment did not have a strong influence on the
transcriptional response 10 days later if the salt stress was not applied (Fig.4.5).
4.3.2.3 Genes differentially expressed upon stress in primed and control plants
Fig.4.5 C-D shows the average of the signal intensities of the primed plants exposed to
salt (P+) plotted against the average of the signal intensities of the control plants exposed
to salt (C+). For the roots samples (D), the scatter plot became clearly more spread
indicating that the priming treatment had an impact on the gene transcription after
exposure to the salt treatment 10 days later.

Quantifying the effect of priming
75
Fig. 4.5 Scatter plot of mean signal values from the Affymetrix gene chip showing the comparison between primed and non-primed plants under control without salt application (-, A shoots, B roots) and with salt applied (+, C shoots, D roots,). Line indicates the position of the linear regression for the data. Left: Average of the log signal intensity from primed (P) and non-primed plants (C) not exposed to salt stress (-). Right: Average of the log signal intensity from primed (P) and non-primed plants (C) exposed to salt stress (+).
A)
B)
C)
D)

Quantifying the effect of priming
76
4.3.2.4 Response to salt in primed and control plants
Fig.4.6 shows the log response to salt of primed plants (P+/P-) plotted against the log
response to salt of control plants (C+/C-). The response to salt was calculated for both
shoots and roots, as the average of the +/- ratios of the absolute signal intensities in each
replicate. Thus:
Equation 1
Response to salt in Control = [Average ((E1C+/E1C-), (E2C+/E2C-), (E3C+/E3C-))]
Response to salt in Primed = [Average ((E1P+/E1P-), (E2P+/E2P-), (E3P+/E3P-))]
A similar response to salt in primed and non-primed plants would result in a linear
relationship with a slope of 1. As shown in Fig.4.6 in roots the slope is less than 1 (0.73),
indicating that upon salt stress the vast majority of the genes responded less strongly to
salt in primed than in non-primed plants (Fig.4.6 A).
Data from the shoots generated a significantly more condensed graph indicating an all-
together weaker response than in roots. Nevertheless, similar to roots they showed less
of a response in primed than non-primed plants (slope of response 0.69) Fig.4.6 B.

Quantifying the effect of priming
77
A)
B)
Fig. 4.6 Scatter plot showing the response to salt stress in primed and non-primed roots (A) and shoots (B). The log of the response to salt calculated for primed plants (y axis, P+/P-) is plotted against the log of the response to salt calculated for control plants (x axis, C+/C-). Black line indicates the position of the linear regression for the data. Red line indicates y=x line; every point above this line represents a gene having a stronger response to salt in priming while every point below the line represents a gene having stronger response to salt in control.
Quantifying the effect of priming
78
4.3.2.5 Principal Component Analysis (PCA)
Partek® Genomics Suite™ was also used to perform PCA on the data set. In Fig. 4.7 is
shown the position of the samples with respect to three components. In both tissues, the
salt treated samples are clearly separated from the non-salt treated samples (Fig.4.7),
indicating the strong effect of a 4 hours salt treatment on gene expression. Furthermore,
the roots samples are also split into two clusters representing primed and non-primed
plants (Fig.4.7A). This separation is only evident in the samples stressed with salt. This
means that the factor Priming (P) presents a good source of variation between the
samples but only in the stress factor group (+). In the shoot (Fig.4.7B), the samples are
again separated in two main groups along the factor Stress, even though separation is
less strong for roots samples. However, there was no clear separation of primed from
non-primed samples for shoots unlike than roots.

Quantifying the effect of priming
79
Fig. 4.7 PCA maps with roots (A) and shoots (B) samples plotted in three dimensions using their projections onto the first three principal components. The different colours correspond to the factor Priming (Red: Primed, Blue: non-primed). Labels indicate the three different replicates (1: E1, 2: E2, 3: E3). The elliptical lines represent the factor Salt, + salt (purple) and - not salt (green).
SHOOTS
A) ROOTS
B)
Priming: ● P ● C
Priming ● P ● C
Salt addition: ○ + ○ -
Salt addition: ○ + ○ -

Quantifying the effect of priming
80
4.3.2.6 Analysis of Variance (ANOVA)
Partek® Genomics Suite™ was used to perform ANOVA to investigate differential gene
expression in the samples depending on the experimental conditions applied.
The ANOVA output is a table containing genes in 22,810 rows and columns containing p-
values and fold changes for each of the contrasts presented in Tab.4.1.
Tab. 4.1 Factors used for PCA and ANOVA
FACTORS FOR PCA AND ANOVA ANALYSIS
Factor 1: Priming, Level: C, P
Factor 2: Stress, Level: -, +
Factor 3: Replication, Level: E1, E2, E3
Interaction Between Factors: Priming * Stress
Analysed contrast: P vs C, - vs +, P- vs P+, P+ vs C+, C+ vs C- and P- vs C-
The ANOVA performs a considerable high number of multiple tests due to the high
number of genes, during which false positives may arise by virtue of performing many
tests. In order to keep the overall error rate/false positives as low as possible, several
statistic corrections have to be made. Therefore each contrast mentioned in Tab.4.1 was
filtered several times according to different cut-off criteria for fold-change (FC), p-value
and False Discovery Rate (FDR) values as presented in Tab.4.2.
One of the main properties of this dataset was that the changes in expression are
predominant in the roots samples. In the roots of non-primed plants 3757 genes were
identified as differentially expressed with FC ≥1.5, FDR ≤0.05 and p-value ≤ 0.05 after salt
treatment. This number dropped of 25% when the plants had been previously primed.
The analysis also identified 56 root genes as being differentially expressed in primed vs
non-primed plants under salt + condition (P+ vs C+). This number decreased by about half
when the fold change was raised to 2 (25 genes), and only one gene passed the filtering
of a stringent p-value of 0.01. However, it is interesting to notice that even using less
stringent criteria no genes entered the C-vs P- category in the roots samples.
In the shoots samples, with a cut off FC ≥1.5, FDR ≤0.05 and p-value ≤ 0.05 only 73 genes
were identified as differentially expressed after salt treatment in non-primed plants (C+

Quantifying the effect of priming
81
vs C-) when exposed to a later salt stress in control condition. This number dropped to 3
genes when the plants had been previously primed (P+ vs P-). Also within these criteria
none of 22,810 genes in total were differentially expressed in shoots of primed plants vs
non-primed plants (P+ vs C+) exposed to salt stress. This was also the case even when the
FDR was set to 0.1, although the number of genes differentially expressed under salt
stress was now 648 in non-primed (C+ vs C-) and 281 in primed (P+ vs P-) shoots. To find
any priming specific genes an unadjusted p-value had to be used, resulting in 28 genes
entering in both (P+ vs C+) and (C- vs P)- categories.
Tab. 4.2 Number of genes differentially expressed in roots and shoots according to ANOVA analysis filtered by different criteria. FC: Fold Change, FDR: False Discovery Rate. P: Primed, C: non-Primed, +: salt treated, -: not salt treated.
ROOTS FC≥ 1.5 p-Value≤ 0.05
FDR≤ 0.05
FC≥ 2 p-Value≤ 0.05
FDR≤ 0.05
FC ≥1.5 p-Value≤ 0.05
FDR≤ 0.01
P-vsP+ 2804 1387 1780
C-vsC+ 3757 1925 2630
C-vsP- 0 0 0
P+vsC+ 56 25 1
SHOOTS FC≥ 1.5 p-Value≤0.05
FDR≤ 0.05
FC≥ 1.5 p-Value≤0.05
FDR≤ 0.1
FC≥ 1.5 Unadjusted p-Value
FDR≤ 0.01
FC≥ 1.5 Unadjusted p-Value
FDR≤ 0.05
P-vsP+ 3 281 862 1818
C-vsC+ 73 648 1100 2149
C-vsP- 0 0 28 141
P+vsC+ 0 0 28 159

Quantifying the effect of priming
82
ANOVA Root lists P+ vs P- and C+ vs C- (FC≥ 1.5, p-value≤0.05, FDR≤0.05)
Within these criteria roots of non-primed plants strongly responded to the salt stress (C+
vs C-) differentially expressing a large number of genes. 2037 transcripts were up-
regulated and 1721 were down-regulated. Shoots of control plants also responded to the
treatment but in a minor way, 46 transcripts were up-regulated and 28 were down-
regulated. Interestingly, in primed plants a considerably lower number of genes
responded to salt stress (P+ vs P-): 1523 were up-regulated in roots (only 3 in shoots) and
1281 were down-regulated in roots, (only 1 in shoots). The weaker response in primed
plants was not due to constitutively different expression levels in primed versus non-
primed plants. At the given statistical criteria no gene was differentially expressed in
primed (P-) versus non-primed plants (C-) that were not exposed to salt stress (Tab.4.2).
However, after the salt treatment 11 transcripts were up-regulated and 45 transcripts
were down regulated in primed plants compared to non primed plants (P+ vs C+).
The genes present in the roots lists P+ vs P- and C+ vs C- required a further examination.
628 out of 2804 genes present on the P+ vs P- were unique for the P list. 1581 out of 3757
genes present in the list C+ vs C-, do not overlap with the P list. This means a total of 2168
genes overlap between the two lists C+ vs C- and P+ vs P-. Functional annotated genes
identified as differentially expressed by ANOVA will be analysed in section 4.3.3.2.
Fig. 4.8 Venn diagram representing the number of genes between the two root list P+ vs P- and C+ vs C-
2168 628 1580
P+ vs P-
C+ vs C-

Quantifying the effect of priming
83
4.3.2.7 Vector Analysis (VA)
Vector Analysis (VA) was used in order to visualize the differential response to the salt
treatment of genes in primed and non-primed plants.
VA was achieved using an Excel file organized as detailed by Breitling et al., 2005, using an
extended algorithm for 3 replicates. The number of genes in a given category was
established according to the angle of the representative vector as specified in Tab.4.3.
Tab. 4.3 Angles that determine response categories in the VA. The assignment of a particular gene to a response type was decided by calculating the angle between the representative vector and the various possible prototype vectors (Compare Fig. 4.1). Depending on the angle reported in the table a gene was categorized in one of the four categories. Same: same response to salt in control and priming, P specific: specific for primed plants, C specific: specific for non-primed plants, Opposite: opposite response in primed and non-primed plants.
GENE RESPONSE VECTOR ANGLE
Same 22.5°-67.5° 202.5°-247.5°
P specific 67.5°-112.5° 247.5°-292.5°
C specific 157.5°-202.5° 22.5°-337.5°
Opposite 112.5°-157.5° 292.5°-337.5°
Since the average length of the vector (L) indicates the average strength of the response,
this parameter was used as a statistic correction to filter out genes that show a very low
response together with the p-value obtained from the 3 replicates. One of the properties
of this dataset was that genes showed the same response to salt treatment in primed and
non-primed plants, in both roots and shoots. When (L) was set to greater than 1 (roughly
corresponding to a two-fold expression change) the vast majority of the vectors of root
genes resided at the periphery of the graph whereas many shorter vectors were found in
the shoots, meaning that root responses in the replicates were more consistent (Fig.4.9).
A larger number of genes appeared to have a specific response to salt in roots than in
shoots, when the L-value is greater than 0.5 and a consistent p-value is set smaller than
0.05. From Fig.4.9 it also notable that a large number of genes are residing across the
border of the established angle-categories and this makes an assignment to a response
category problematic. Therefore safety margins for angles should be taken into account
when individual genes are assigned to response categories.

Quantifying the effect of priming
84
Fig. 4.9 Vectors representing gene responses to salt in root and shoot. On the two axes are reported the sum vectors length for control and primed (x: VSUM-C control and y: VSUM-P primed). Two criteria were used to create the graphs: on the left average length vector (L) equal or larger than 1, on the right average length vector (L) equal or larger than 0.5 and p-value ≤ 0.05. Each dot corresponds to a particular gene response in the form of a sum vector: the longer the vector then the more the response is consistent among replicates; the angle of the vector describes the gene response (angle types are specified in Tab. 4.3). Genes responding similarly in primed and non-primed are shown in blue. Genes that responded specifically in primed plants are shown in yellow. Genes that changed specifically in non-primed plants are in green. Genes that responded in opposite directions in primed and non-primed plants are shown in red.
L>1 and unadjusted p-value L>0.5 and p-value ≤ 0.05
L>1 and unadjusted p-value L>0.5 and p-value ≤ 0.05
VSUM-C
VSUM-P
VSUM-C
VSUM-P
VSUM-C
VSUM-P
VSUM-C
VSUM-P

Quantifying the effect of priming
85
As detailed in Tab. 4.4 vector analysis applied to shoots identified a large number of
genes with specific responses at a consistent p-value smaller than 0.05 and L-value larger
than 0.5. In particular 244 genes show a specific response in non-primed plants, 194
showed specific response in primed plants, 34 genes showed opposite responses in
primed and non-primed plants. Among the 194 genes with P-specific responses more
than half (134 out of 221) were down-regulated by salt (Tab.4.4). In contrast, vector
analysis applied with the same statistical parameters to roots, identified an overall higher
number of genes compared to the shoots VA. 454 genes showed a specific response in
non-primed plants, 221 genes in primed plants with specific response in P and 42 showed
opposite responses. Among the 221 root genes with P specific responses, more than half
(132 out of 221) were down-regulated (as in shoots). Interestingly in the shoots, with L≥1
the number of genes that showed a specific response in non-primed plants was 513 while
when the 0.05 p-value threshold was introduced the number dropped to 244 even
though the (L) value was lowered to 0.5 (Tab.4.4). This reflects the representation in
Fig.4.9 showing that lower consistency in the samples is due to the lower fold change of
the response.
In summary VA revealed that primed plants responded less to the salt treatment.
Functional annotations of the genes assigned to different response categories are
analysed in section 4.3.3.2.

Quantifying the effect of priming
86
Tab. 4.4 Number of genes in roots and shoots showing different types of prototypic behaviour in response to salt in two backgrounds of Arabidopsis plants (primed P, non-primed C), as identified by vector analysis respectively in roots and shoots. The numbers of genes vary according to stringency of parameters selected, such as Vsum: sum vector, V length: average vector length from nine pairwise comparisons of the fold change. (C: control, P: priming down/up: up-/down- regulated gene).
Roots no cut off Vsum ≥3
p-value ≤0.05
V length ≤0.5
V length ≥1
V length≥0.5 AND
p-value≤ 0.05
C specific up 1231 881 276 605 228 217
C specific down 3947 3210 937 773 168 237
TOT C specific 5178 4091 1213 1378 396 454
P specific up 1359 970 187 368 77 89
P specific down 1495 1130 224 597 88 132
TOT P specific 2854 2100 411 965 165 221
C and P up 4003 3496 2260 2918 1857 2104
C and P down 6715 5885 3250 4116 1308 2637
TOT Same 10718 9381 5510 7034 3165 4741
C up, P down 814 366 39 200 20 24
C down, P up 3246 2498 900 242 37 18
TOT Opposite 4060 2864 939 442 57 42
Shoots no cut off
Vsum ≥3
p-value ≤0.05
V length ≥ 0.5
V length ≥1
V length≥0.5 AND
p-value≤0.05
C specific up 1849 1149 193 881 254 120
C specific down 1811 1160 199 892 259 124
TOT C Specific 3660 2309 392 1773 513 244
P specific up 4062 2830 351 696 116 60
P specific down 1662 1030 205 929 273 134
TOT P Specific 5724 3860 556 1625 389 194
C and P up 5253 3915 1487 2566 1187 1216
C and P down 4699 3771 1619 3367 1359 1401
TOT Same 9952 7686 3106 5933 2546 2617
C up, P down 1237 531 56 537 147 20
C down, P up 2237 1221 136 409 81 14
TOT Opposite 3474 1752 192 946 228 34

Quantifying the effect of priming
87
4.3.3 Priming induces transcriptional changes in genes with specific functions
In the first part of this chapter several different algorithms were used to identify
differentially expressed genes comparing primed and non-primed plants exposed to salt
treatment or not. In the second part of this chapter the functions (known and predicted)
of these genes are considered to establish the role of priming for plant stress responses.
In order to investigate the function of the genes, which were differentially expressed
across the different experimental conditions, the Database for Annotation, Visualization
and Integrated Discovery (DAVID) (Huang et al., 2009) was used. This software permits
one to identify genes within functional categories that were, as a group, differentially
expressed between the priming (P) and control (C) condition, giving a p-value and a false
discovery rate. Only roots samples were analyzed, since the filtered number of genes
differentially expressed in shoots was too low.
Different gene lists were loaded into DAVID in order to answer the following questions:
Does priming introduce new functionalities into the salt stress response?
To answer this question functional annotation in the ANOVA gene lists P+ vs P-, C+
vs C- and P+ vs C+ were compared to functional annotations in the Arabidopsis
genome background. This will indicate if new functional gene categories, normally
not induced by salt, emerged upon priming.
Does priming regulate genes of specific functions in response to salt stress?
To answer this question I used 3 different types of gene lists obtained using the
follow parameters:
Gene List 1) “Ranked genes”: the response to salt was calculated for each
individual gene using the Equation1-Section 4.3.2.3. Genes were ranked according
to their increased response to salt. Then, the top 300 genes (out of 712) were
selected with expression ratio of P/C higher than 1.5 and the top 300 genes (out
1892) with expression ratio of C/P higher than 1.5. In particular these 300 selected
genes showed expression ratios of primed/control ratio higher than 1.7 and

Quantifying the effect of priming
88
control/primed ratio higher than 2.2. This higher cut-off was used in an attempt to
ensure that the selected genes were genuinely differentially responsive. Both lists
were then compared against two backgrounds. Background 1 “roots
transcriptome”: gene list with average absolute signal intensities greater than 10
and Background 2 “salt responsive genes”: list that combined genes with average
ratio P +/- greater than 1.5, with genes of an average ratio C+/- greater than 1.5.
Gene List 2) “VA P specific-up” and “VA P specific-down” against Background 1
“Complete VA list” and Background 2 “salt responsive genes”: ANOVA combined
lists P +/- AND C+/-”.
Gene List 3) “ANOVA P+/- list Unique P-up” and “ANOVA P+/- list Unique P-down”
against the Background1 “complete ANOVA list P +/-” and against Background2
“salt responsive genes: ANOVA combined lists P +/- AND C+/-”.
Using these criteria I will show that the different comparisons identified similar
functional clusters as being responsive to salt in primed and non-primed plants
but also identified a specific subset of these clusters that responded more or less
strongly to salt in primed plants.

Quantifying the effect of priming
89
Tab. 4.5 Schematic summary of gene lists compared with DAVID.
Does priming introduce new functionalities into the salt stress response?
ANOVA LIST P +/- List loaded in DAVID Background
Total list P+/- Arabidopsis
ANOVA LIST C+/- List loaded into DAVID Background
Total list C+/- Arabidopsis
ANOVA LIST P+/C+ List loaded into DAVID Background
Total list P+/C+ Arabidopsis
Does priming regulate genes of specific functions in response to salt stress?
VA LIST p-Value 0.05
l>0.5
List loaded into DAVID Background 1 Background 2
Specific for P UP Total VA list
Salt responsive genes from ANOVA lists P +/- AND C+/- combined
Specific for P DOWN Total VA list
Salt responsive genes from ANOVA lists P +/- AND C+/- combined
RANKED RESPONSE
LIST
List loaded into DAVID Background 1 Background 2
Top 300 genes which salt response P>C
Roots transcriptome with average signal intensities > 10*
Salt responsive genes: P +/- and C+/- (fold changed 1.5) combined
Top 300 genes which salt response C>P
Roots transcriptome with average signal intensities > 10*
Salt responsive genes: P +/- and C+/- (fold changed 1.5) combined
ANOVA LIST P +/-
List loaded into DAVID Background 1 Background 2
Unique for P UP ANOVA LIST P +/-
Salt responsive genes from ANOVA lists P +/- AND C+/- combined
Unique for P DOWN ANOVA LIST P +/-
Salt responsive genes from ANOVA lists P +/- AND C+/- combined
* Based on absolute average signal intensities of RMA normalised microarray data

Quantifying the effect of priming
90
4.3.3.1 Does priming induce an enrichment of new functional gene categories in
response to the salt stress?
ANOVA gene lists P+ vs P- and C+ vs C-
To answer this question the ANOVA gene lists P+ vs P- and C+ vs C- (statistical criteria Tab.
4.2) were loaded into DAVID and functional annotations compared with the Arabidopsis
genome background. In both lists the highest enrichment score was assigned to the
category “GO: Response to organic substance” that included genes involved in the
biosynthesis of plant hormones (e.g. ethylene, ABA, brassinosteroid, gibberellic acid).
Other categories significantly enriched in both lists included: “Response to organic
substance”, “Toxin metabolic process”, “Secondary metabolic process”, “Response to
abiotic stimulus”, “Plant-type/cell wall” and “Transcription regulator” (Tab. 4.6). The
results of this analysis showed that upon stress primed and non-primed plants activated
the same functional gene categories.

Quantifying the effect of priming
91
Tab. 4.6 Enriched GO categories among genes responding to salt in primed and non-primed plants. Gene lists based on ANOVA list C+ vs C-; and list P+ vs P- (FDR ≤ 0.05, p-value ≤ 0.05 and FC ≥ 1.5).
P+ vs P- Annotation
Cluster GOTERM
Enrichment Score
Count % p-Value FDR
1 GO:0010033~response to organic substance 8.2 255 9.1 3.62E-24 6.11E-21
2 GO:0009407~toxin catabolic process 6.3 21 0.8 6.23E-08 1.05E-04
3 GO:0019748~secondary metabolic process 5.6 97 3.5 9.65E-11 1.63E-07
4 GO:0009628~response to abiotic stimulus 4.8 195 7.0 1.05E-06 0.001763
5 GO:0005618~cell wall 3.5 94 3.4 2.15E-04 0.281909
6 GO:0006955~immune response 3.1 69 2.5 2.11E-08 3.56E-05
7 GO:0015238~drug transporter activity 2.8 24 0.9 4.14E-05 0.064842
8 GO:0050662~coenzyme binding 2.5 63 2.3 0.001534 2.373695
9 GO:0005911~cell-cell junction 2.5 9 0.3 2.64E-04 0.347339
10 GO:0006979~response to oxidative stress 2.5 68 2.4 2.10E-08 3.54E-05
C+ vs C- Annotation
Cluster GOTERM
Enrichment Score
Count % p-Value FDR
1 GO:0010033~response to organic substance
11.9 283 9.5 4.185E-30 7.07E-27
2 GO:0009404~toxin metabolic process 7.2 22 0.7 3.119E-08 5.27E-05
3 GO:0019748~secondary metabolic process
6.1 105 3.5 4.296E-12 7.26E-09
4 GO:0003700~transcription factor activity 4.2 282 9.5 1.563E-08 2.46E-05
5 GO:0006955~immune response 4.2 77 2.6 2.523E-10 4.26E-07
6 GO:0009628~response to abiotic stimulus 3.9 222 7.4 4.819E-10 8.14E-07
7 GO:0009505~plant-type cell wall 3.5 53 1.8 7.945E-05 0.1051
8 GO:0006979~response to oxidative stress 3.1 68 2.3 2.420E-07 4.09E-04
9 GO:0009644~response to high light intensity
3.0 15 0.5 6.630E-04 1.1145
10 GO:0055114~oxidation reduction 3.0 198 6.6 1.160E-05 0.0195

Quantifying the effect of priming
92
ANOVA gene lists P+ vs C+
The list contains 56 genes differentially expressed between primed and non-primed
plants under salt stress. Although the list contains a relative small number of genes 37 of
them were still grouped into clusters by DAVID, however the FDR values obtained are
very high (Tab.4.7). 23.3% of the genes are included in the category “intrinsic to
membrane”. This category contained genes involved in ionic and osmotic signalling
together with transporters and ion channels, such MPK3 (mitogen activated protein
kinase 3), CRK6 (RECEPTOR-LIKE PROTEIN KINASE 6), a member of the cyclic nucleotide
gated channel family (ATCNGC13, CYCLIC NUCLEOTIDE-GATED CHANNEL 13) and a
member of a family of proteins related to purine transporters (PUP14- PURINE PERMEASE
14). Also cell wall biosynthesis related genes are included in this category such as
CELLULOSE SYNTHASE LIKE E1, a beta-glycan synthase that polymerizes the backbones of
hemicelluloses. 18.3% of the genes were grouped in the cluster “response to organic
substance” that included genes related to plant hormone pathways, in particular
ERF019 (ethylene responsive element binding factor) and JAZ6 (jasmonate-ZIM-domain
protein). Finally 10% of the genes were annotated as “immune response/defence”
including genes from the salicylic acid signalling pathway such as WRKY transcription
factors (WRKY48, WRKY8) and a gene from the cytokine signalling pathway, ARR15
(RESPONSE REGULATOR 15), which encodes a nuclear response regulator acting as a
negative regulator. In conclusion, these clusters are similar to the ones enriched in the
ANOVA lists previously described confirming that the priming treatment did not alter
expression of genes with new functions.
Tab. 4.7 Enriched GO categories for genes showing differential expression between primed and non-primed salt-treated plants based on ANOVA list P+ vs C+ (FDR ≤ 0.05, p-value ≤ 0.05 and FC ≥ 1.5).
Cluster 1 Enrichment Score: 1.9 Count % p-value FDR
GOTERM_BP_FAT GO:0006955~immune response 6 10.0 2.64E-03 3.35
Cluster 2 Enrichment Score: 1.3 Count % p-value FDR
GOTERM_CC_FAT GO:0031224~intrinsic to membrane 14 23.3 1.01E-03 0.908
Cluster 3 Enrichment Score: 1.07 Count % p-value FDR
GOTERM_BP_FAT GO:0010033~response to organic substance 11 18.3 4.19E-03 5.27

Quantifying the effect of priming
93
4.3.3.2 Does priming regulate genes of specific function in response to salt stress?
In order to answer this question a number of different approaches were used as
summarized in Tab.4.5. All three lists loaded into DAVID identified similar functionality
clusters however the “Ranked response list” was the only list showing consistently low
FDR and p-values while both lists “ANOVA P+/- Unique P” and “VA- P specific” resulted in
high FDR. Therefore, the “Ranked response list” was selected for further analysis but also
subjected to further controls. To evaluate the incidence of false positive a random
selection of 300 genes from all genes represented on the microarray was loaded into
DAVID and this was repeated with three randomized lists. The obtained ‘enriched’
clusters were different for every random set of genes and had very high p-values and FDR.
The “ranked response lists” Primed>Control and Control>Primed were loaded into DAVID.
The analysis delineated a bias in function between the genes that responded more
strongly to salt stress in primed than in non-primed plants and the genes that responded
less.

Quantifying the effect of priming
94
4.3.3.3 Gene categories that responded more strongly to salt upon priming
List: Top 300 genes Primed>Control
DAVID analysis background: salt responsive genes/ roots transcriptome
Results from DAVID analysis reported in Tab. 4.8 showed the main categories with a FDR
lower than 0.05 were Ion binding related (including GO:0005509~calcium,
“GO:0020037~heme binding”, “GO:0006800~oxygen and reactive oxygen species
metabolic process”, “GO:0034599~cellular response to oxidative stress”) and cell wall
related (including “GO:0005199~structural constituent of cell wall”, “GO:0042545~cell
wall modification”, “GO:0009664~plant-type cell wall organization”). The enriched GO
categories for “Ranked response genes” gave similar results when compared against the
two different backgrounds (Appendix IV).
Because DAVID clusters are redundant (meaning that the same gene can be shown in two
different clusters), redundant genes were manually excluded, then the genes underlying
the enriched lists were compared resulting in a core set of functionally related genes
underlying the difference in salt response between primed and non-primed plants, which
is shown in Tab. 4.8. In accordance with the previously ANOVA and VA analysis, the vast
majority of these genes had a higher expression level in the primed plants only after salt
stress. Thus, if the stress did not reoccur, expression in primed and non-primed plants
was the same.
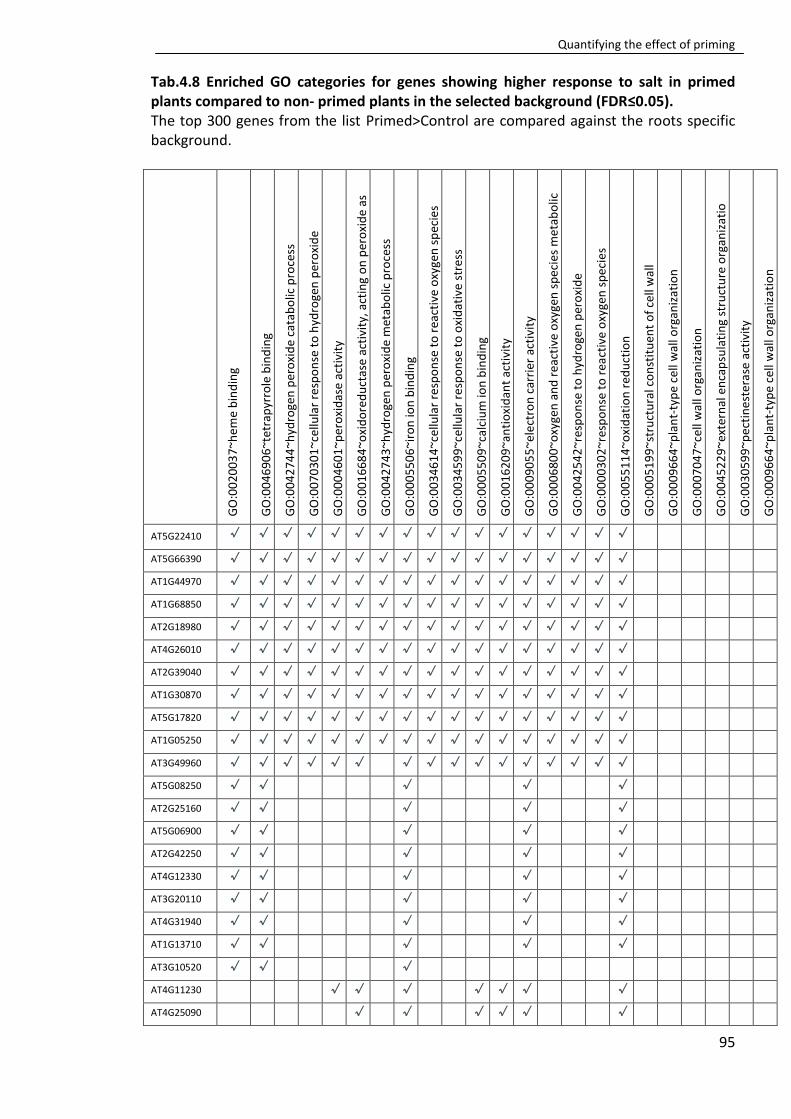
Quantifying the effect of priming
95
Tab.4.8 Enriched GO categories for genes showing higher response to salt in primed plants compared to non- primed plants in the selected background (FDR≤0.05). The top 300 genes from the list Primed>Control are compared against the roots specific background.
GO
:00
20
03
7~h
em
e b
ind
ing
GO
:00
46
90
6~t
etra
pyr
role
bin
din
g
GO
:00
42
74
4~h
ydro
gen
per
oxi
de
cata
bo
lic p
roce
ss
GO
:00
70
30
1~c
ellu
lar
resp
on
se t
o h
ydro
gen
per
oxi
de
GO
:00
04
60
1~p
ero
xid
ase
acti
vity
GO
:00
16
68
4~o
xid
ore
du
ctas
e ac
tivi
ty, a
ctin
g o
n p
ero
xid
e as
acce
pto
r G
O:0
04
27
43
~hyd
roge
n p
ero
xid
e m
etab
olic
pro
cess
GO
:00
05
50
6~i
ron
ion
bin
din
g
GO
:00
34
61
4~c
ellu
lar
resp
on
se t
o r
eact
ive
oxy
gen
sp
ecie
s
GO
:00
34
59
9~c
ellu
lar
resp
on
se t
o o
xid
ativ
e st
ress
GO
:00
05
50
9~c
alci
um
ion
bin
din
g
GO
:00
16
20
9~a
nti
oxi
dan
t ac
tivi
ty
GO
:00
09
05
5~
ele
ctro
n c
arri
er a
ctiv
ity
GO
:00
06
80
0~o
xyge
n a
nd
rea
ctiv
e o
xyge
n s
pec
ies
met
abo
lic
pro
cess
G
O:0
04
25
42
~res
po
nse
to
hyd
roge
n p
ero
xid
e
GO
:00
00
30
2~r
esp
on
se t
o r
eact
ive
oxy
gen
sp
ecie
s
GO
:00
55
11
4~o
xid
atio
n r
edu
ctio
n
GO
:00
05
19
9~
stru
ctu
ral c
on
stit
uen
t o
f ce
ll w
all
GO
:00
09
66
4~p
lan
t-ty
pe
cell
wal
l org
aniz
atio
n
GO
:00
07
04
7~c
ell w
all o
rgan
izat
ion
GO
:00
45
22
9~
exte
rnal
en
cap
sula
tin
g st
ruct
ure
org
aniz
atio
GO
:00
30
59
9~p
ect
ine
ster
ase
acti
vity
GO
:00
09
66
4~p
lan
t-ty
pe
cell
wal
l org
aniz
atio
n
AT5G22410 √ √ √ √ √ √ √ √ √ √ √ √ √ √ √ √ √
AT5G66390 √ √ √ √ √ √ √ √ √ √ √ √ √ √ √ √ √
AT1G44970 √ √ √ √ √ √ √ √ √ √ √ √ √ √ √ √ √
AT1G68850 √ √ √ √ √ √ √ √ √ √ √ √ √ √ √ √ √
AT2G18980 √ √ √ √ √ √ √ √ √ √ √ √ √ √ √ √ √
AT4G26010 √ √ √ √ √ √ √ √ √ √ √ √ √ √ √ √ √
AT2G39040 √ √ √ √ √ √ √ √ √ √ √ √ √ √ √ √ √
AT1G30870 √ √ √ √ √ √ √ √ √ √ √ √ √ √ √ √ √
AT5G17820 √ √ √ √ √ √ √ √ √ √ √ √ √ √ √ √ √
AT1G05250 √ √ √ √ √ √ √ √ √ √ √ √ √ √ √ √ √
AT3G49960 √ √ √ √ √ √ √ √ √ √ √ √ √ √ √ √
AT5G08250 √ √ √ √ √
AT2G25160 √ √ √ √ √
AT5G06900 √ √ √ √ √
AT2G42250 √ √ √ √ √
AT4G12330 √ √ √ √ √
AT3G20110 √ √ √ √ √
AT4G31940 √ √ √ √ √
AT1G13710 √ √ √ √ √
AT3G10520 √ √ √
AT4G11230 √ √ √ √ √ √ √
AT4G25090 √ √ √ √ √ √

Quantifying the effect of priming
96
GO
:00
20
03
7~h
em
e b
ind
ing
GO
:00
46
90
6~t
etra
pyr
role
bin
din
g
GO
:00
42
74
4~h
ydro
gen
per
oxi
de
cata
bo
lic p
roce
ss
GO
:00
70
30
1~c
ellu
lar
resp
on
se t
o h
ydro
gen
per
oxi
de
GO
:00
04
60
1~p
ero
xid
ase
acti
vity
GO
:00
16
68
4~o
xid
ore
du
ctas
e a
ctiv
ity,
act
ing
on
per
oxi
de
as
acce
pto
r G
O:0
04
27
43
~hyd
roge
n p
ero
xid
e m
etab
olic
pro
cess
GO
:00
05
50
6~i
ron
ion
bin
din
g
GO
:00
34
61
4~c
ellu
lar
resp
on
se t
o r
eact
ive
oxy
gen
sp
ecie
s
GO
:00
34
59
9~c
ellu
lar
resp
on
se t
o o
xid
ativ
e st
ress
GO
:00
05
50
9~c
alci
um
ion
bin
din
g
GO
:00
16
20
9~a
nti
oxi
dan
t ac
tivi
ty
GO
:00
09
05
5~
ele
ctro
n c
arri
er a
ctiv
ity
GO
:00
06
80
0~o
xyge
n a
nd
rea
ctiv
e o
xyge
n s
pec
ies
met
abo
lic
pro
cess
G
O:0
04
25
42
~res
po
nse
to
hyd
roge
n p
ero
xid
e
GO
:00
00
30
2~r
esp
on
se t
o r
eact
ive
oxy
gen
sp
ecie
s
GO
:00
55
11
4~o
xid
atio
n r
edu
ctio
n
GO
:00
05
19
9~
stru
ctu
ral c
on
stit
uen
t o
f ce
ll w
all
GO
:00
09
66
4~p
lan
t-ty
pe
cell
wal
l org
aniz
atio
n
GO
:00
07
04
7~c
ell w
all o
rgan
izat
ion
GO
:00
45
22
9~
exte
rnal
en
cap
sula
tin
g st
ruct
ure
org
aniz
atio
GO
:00
30
59
9~p
ect
ine
ster
ase
acti
vity
GO
:00
09
66
4~p
lan
t-ty
pe
cell
wal
l org
aniz
atio
n
AT1G80320 √ √
AT4G19690 √ √
AT1G52800 √ √
AT1G06090 √ √
AT1G06080 √ √
AT4G22080 √
AT3G62950 √ √
AT3G14415 √ √
AT1G24620 √
AT1G11920 √
AT3G51860 √
AT5G46370 √
AT3G07490 √
AT4G13440 √
AT2G32300 √
AT5G50590 √
AT4G29740 √
AT4G33790 √
AT5G03260 √
AT1G54970 √
AT4G08410 √ √ √
AT1G26240 √ √ √
AT3G20470 √

Quantifying the effect of priming
97
GO
:00
20
03
7~h
em
e b
ind
ing
GO
:00
46
90
6~t
etra
pyr
role
bin
din
g
GO
:00
42
74
4~h
ydro
gen
per
oxi
de
cata
bo
lic p
roce
ss
GO
:00
70
30
1~c
ellu
lar
resp
on
se t
o h
ydro
gen
per
oxi
de
GO
:00
04
60
1~p
ero
xid
ase
acti
vity
GO
:00
16
68
4~o
xid
ore
du
ctas
e ac
tivi
ty, a
ctin
g o
n p
ero
xid
e as
acce
pto
r G
O:0
04
27
43
~hyd
roge
n p
ero
xid
e m
etab
olic
pro
cess
GO
:00
05
50
6~i
ron
ion
bin
din
g
GO
:00
34
61
4~c
ellu
lar
resp
on
se t
o r
eact
ive
oxy
gen
sp
ecie
s
GO
:00
34
59
9~c
ellu
lar
resp
on
se t
o o
xid
ativ
e st
ress
GO
:00
05
50
9~c
alci
um
ion
bin
din
g
GO
:00
16
20
9~a
nti
oxi
dan
t ac
tivi
ty
GO
:00
09
05
5~
ele
ctro
n c
arri
er a
ctiv
ity
GO
:00
06
80
0~o
xyge
n a
nd
rea
ctiv
e o
xyge
n s
pec
ies
met
abo
lic
pro
cess
G
O:0
04
25
42
~res
po
nse
to
hyd
roge
n p
ero
xid
e
GO
:00
00
30
2~r
esp
on
se t
o r
eact
ive
oxy
gen
sp
ecie
s
GO
:00
55
11
4~o
xid
atio
n r
edu
ctio
n
GO
:00
05
19
9~
stru
ctu
ral c
on
stit
uen
t o
f ce
ll w
all
GO
:00
09
66
4~p
lan
t-ty
pe
cell
wal
l org
aniz
atio
n
GO
:00
07
04
7~c
ell w
all o
rgan
izat
ion
GO
:00
45
22
9~
exte
rnal
en
cap
sula
tin
g st
ruct
ure
org
aniz
atio
GO
:00
30
59
9~p
ect
ine
ster
ase
acti
vity
GO
:00
09
66
4~p
lan
t-ty
pe
cell
wal
l org
aniz
atio
n
AT3G19430 √
AT3G28550 √ √ √
AT5G35190 √ √ √
AT5G06640 √ √ √
AT5G06630 √ √ √
AT1G12560 √ √ √
AT2G20750 √ √ √ √
AT1G62980 √ √ √ √
AT5G56320 √ √ √ √
AT1G48930 √ √
AT1G05650 √ √
AT2G43050 √ √ √
AT5G04970 √ √ √
AT4G28850 √ √
AT3G59850 √ √
AT2G15350 √ √
AT5G57530 √ √
AT1G53830 √ √ √
AT4G15290 √ √
AT1G65570 √ √
AT5G51490 √ √ √
AT5G04960 √
AT2G23630 √
AT5G51520 √
AT4G25250 √
AT4G37160 √

Quantifying the effect of priming
98
In the following sections, individual functions within the enriched categories are
described in more detail.
Ion binding and transporters
A higher response to salt upon priming was found for the gene IRON-REGULATED
TRANSPORTER 1 (AT4G19690, IRT1) which encodes Fe2+ transporter protein with broad
specificity for divalent heavy metals, mediating the transport of zinc, manganese, cobalt
and cadmium. It has also been recognized as the major transporter responsible for high-
affinity metal uptake under iron deficiency (Vert et al., 2002).
Several calcium ion binding genes were also found be enriched. CALMODULIN-LIKE 3
(CML3, AT3G07490) contribute into the calcium/calmodulin regulation network in the
peroxisomes (Chigri et al., 2012). Calcium-binding EF-hand family protein genes
(AT4G13440 and AT1G24620) were found. In particular, it has been shown that mutation
in the gene AT1G24620, led to longer root hairs under Pi-deficient conditions (Lin et al.,
2011).
It was also found CATION EXCHANGER 3 (AT3G51860, CAX3), a Ca2+/H+ tonoplast
antiporter that mediates the sequestration of Ca2+ into the vacuole. Arabidopsis knockout
mutants or over-expression of CAX3 results in perturbations in ion homeostasis and
altered responses to salinity and cold stresses (Zhao et al., 2008). Finally, a member of the
Arabidopsis thaliana K+ channel family of AtTPK/KCO proteins (AT5G46370, KCO2), was
also found. This gene is reported as being a Ca2+ activated outward rectifying K+ channel 2
and located at the vacuolar membrane.
Oxidation reduction
Genes in this class are involved in ionic and osmotic homeostasis signalling together with
transporters and ion channels. 12 genes classified as “Peroxidase” have been found as
particularly enriched in the category. The oxidoreductase AtHSD4 (hydroxysteroid
dehydrogenase 4) was 4.9 times higher expressed after the second stress in the primed
plants but did not present any change after the priming without second salt exposure.
Members of electron carriers involved in ion binding, CYP93D1 and CYP712A1 were
respectively 3 and 2.5 times higher expressed in the primed plants after but not before

Quantifying the effect of priming
99
the second stress. These are presumably involved in oxidative signalling responding to
altered levels of various reactive oxygen species (ROS).
Cell wall related proteins
Genes associated with cell wall biosynthesis important for correct cell developments were
also found to respond stronger upon stress in primed roots. Among them were structural
constituents of the cell wall such as ATPRP1 (PROLINE-RICH PROTEIN 1, AT1G54970) or
genes required for correct cell expansion such as AGP30 (ARABINOGALACTAN PROTEIN
30) and SP1L5 (SPIRAL1-LIKE5), which regulates cortical microtubule organization
(Nakajima et al., 2004; van Hengel and Roberts, 2003). The SKU5 and SKS6 genes (SKU5
Similar 15 and SKU6 Similar 16) encoding multiple-copper oxidases play an important role
in regulating directional root growth (Sedbrook et al., 2002; Jacobs and Roe, 2005). SKS16
was induced upon priming: in non-primed plants the level of transcription dropped when
the salt was applied whereas in primed plants the level of expression is maintained high.
SKS15 was higher expressed in primed plants only upon salt.
Additional individual genes found more responsive to salt upon priming
Several individual genes were found among the ranked list as been most responsive but
not among the enriched DAVID categories.
Numerous genes encoding disease responsive proteins and proteins involved in SA
biosynthesis such as ICS2 (ISOCHORISMATE SYNTHASE 2) were found to be more
responsive to the salt treatment in primed plants compared to non-primed.
A member of glutathione transferase family GSTs (ATGSTF13) may be involved in cellular
detoxification by catalyzing the conjugation of glutathione (GSH).
The gene encoding the unique largest subunit of nuclear DNA-dependent RNA
polymerase V (AT2G40030) was also differentially responsive to salt stress in primed and
non-primed plants.
A member of the SYP12 gene family SYP123 (SYNTAXIN OF PLANTS 123) known to be
involved in the tip growth of root hairs (Enami et al., 2009) was found to be more
responsive to salt upon priming. It has been shown that this gene plays an essential role
in the membrane fusion event that occurs at the final step of membrane trafficking; it is

Quantifying the effect of priming
100
specifically expressed in the root hair cells and showed focal accumulation to the tip
region of the growing root hairs (Enami et al., 2009).
Enrichment of several functional categories was based on genes encoding ion
transporters. Among these SLAH1 (SLAC1 HOMOLOGUE 1, AT1G62280) was the only one
that showed higher expression in primed roots even prior to application of salt. SLAH1
encodes a root-specific anion channel protein similar to the guard-cell SLAC1 known to be
involved in stomatal closure (Negi et al., 2008). All other transporter genes showed
similar expression in primed and non-primed plants before application of salt but
responded more strongly to the second stress in primed plants. ATCHX16 (CATION/H+
EXCHANGER 16) belongs to a family of cation/H+ antiporters some of which have been
shown to be involved in K(+) and pH homeostasis of distinct intracellular compartments
(Chanroj et al., 2011). AMT1-1 (AMMONIUM TRANSPORTER 1-1, AT4G13510) and
ATAMT1-2 (AMMONIUM TRANSPORTER 1-2, AT1G64780) encode proteins essential for
ammonium uptake (Yuan et al., 2007). Ammonium can enter the symplastic route for
radial transport toward the root stele via AMT1-1, AMT1-3, and AMT1-5, which are
localized at the plasma membrane of rhizodermis cells, including root hairs. Ammonium
can also bypass outer root cells via the apoplastic transport route and subsequently enter
the root symplast by AMT1-2 mediated transport across the plasma membrane of
endodermal (in the root hair zone) and cortical (in the basal root zones) cells (Yuan et al.,
2007).
The expression profiles of selected genes were further confirmed using qPCR (Fig. 4.10).

Quantifying the effect of priming
101
Fig. 4.10 Real time quantitative PCR (qPCR) analysis of relative expression of selected genes that responded higher to the salt in primed roots samples. Total RNA was isolated from one experimental sample, reverse transcribed and cDNA was analyzed by qPCR using primers for genes that showed differential responses on the microarrays (see above). RpII was used as reference gene for the normalization. Standard errors are from four pairwise comparisons of technical duplicates.
0
0.3
0.6
C+ P+ C- P-
Re
lati
ve e
xpre
ssio
n t
o R
pII
CLX16 (AT1G64170)
0
0.02
0.04
C+ P+ C- P-
SKOR (AT3G02850)
0
0.25
0.5
C+ P+ C- P-
SKS15 (AT4G37160)
0
0.3
0.6
C+ P+ C- P- Re
lati
ve e
xpre
ssio
n t
o R
pII
AMT1;1 (AT4G13510)
0
0.6
1.2
C+ P+ C- P-
SLAH1 (AT1G62280)
0
3
6
C+ P+ C- P-
PHT3 (AT5G43360)
0
1.5
3
C+ P+ C- P-
Re
lati
ve e
xpre
ssio
n t
o R
pII
GMD1 (AT5G66280)
0
0.06
0.12
C+ P+ C- P-
TOM7,2 (AT1G64220)
0
0.4
0.8
C+ P+ C- P-
HSD4 (AT5G50590)

Quantifying the effect of priming
102
4.3.3.4 Gene categories that responded less to the salt stress upon priming
List: Top 300 genes Control>Primed
DAVID analysis background: salt responsive genes/roots transcriptome
DAVID analysis reported in Tab. 4.9 shows that the enriched GO categories for “Ranked
response genes” and results were similar independent of the chosen background
(Appendix V). The program identified three main enriched categories with a FRD lower
than 0.05: transcription factors (including GO:0003700~ transcription factor activity,
GO:0006350~ transcription, GO:0030528~transcription regulator activity,
GO:0006355~regulation of transcription, DNA-dependent, GO:0051252~regulation of
RNA metabolic process, GO:0045449~ regulation of transcription), hormonal response
genes (including GO:0010033~ response to organic substance, and
GO:0009723~response to ethylene stimulus), and oxidative stress related genes
(GO:0009644~response to high light intensity).
The vast majority of the genes in the list showed a higher transcript level in the non-
primed plants only after salt stress as predicted by the previous ANOVA and VA analysis.
Thus, when the stress did not occur the gene expression was the same in primed and non-
primed plants.

Quantifying the effect of priming
103
Tab.4.9 Enriched GO categories for genes showing lower response to salt in primed plants compared to non-primed plants in the selected background (FDR≤0.05). The top 300 genes from the list Control>Primed are compared against roots specific background.
GO
:00
09
72
3~r
esp
on
se t
o e
thyl
ene
stim
ulu
s
GO
:00
10
03
3~r
esp
on
se t
o o
rgan
ic s
ub
stan
ce
GO
:00
09
71
9~r
esp
on
se t
o e
nd
oge
no
us
stim
ulu
s
GO
:00
03
70
0~t
ran
scri
pti
on
fac
tor
acti
vity
GO
:00
09
87
3~
eth
ylen
eed
iata
lg p
ath
way
GO
:00
00
16
0~t
wo
-co
mp
on
ent
sign
al t
ran
sdu
ctio
n s
yste
m
(ph
osp
ho
rela
y)
GO
:00
30
52
8~t
ran
scri
pti
on
re
gula
tor
acti
vity
GO
:00
06
35
0~t
ran
scri
pti
on
GO
:00
06
35
5~r
egu
lati
on
of
tran
scri
pti
on
, DN
A-d
epen
den
t
GO
:00
51
25
2~r
egu
lati
on
of
RN
A m
etab
olic
pro
cess
GO
:00
09
72
5~r
esp
on
se t
o h
orm
on
e st
imu
lus
GO
:00
45
44
9~r
egu
lati
on
of
tran
scri
pti
on
GO
:00
03
67
7~
DN
A b
ind
ing
GO
:00
09
64
4~r
esp
on
se t
o h
igh
ligh
t in
ten
sity
GO
:00
09
64
2~r
esp
on
se t
o li
ght
inte
nsi
ty
GO
:00
09
62
8~r
esp
on
se t
o a
bio
tic
stim
ulu
s
GO
:00
09
64
4~r
esp
on
se t
o h
igh
ligh
t in
ten
sity
GO
:00
09
64
2~r
esp
on
se t
o li
ght
inte
nsi
ty
GO
:00
09
40
8~r
esp
on
se t
o h
eat
AT3G23230 √ √ √ √ √ √ √ √ √ √ √ √ √
AT5G13330 √ √ √ √ √ √ √ √ √ √ √ √ √ AT3G23250 √ √ √ √ √ √ √ √ √ √ √ √ √ √ AT1G74430 √ √ √ √ √ √ √ √ √ √ AT5G40990 √ √ √ √ √ √ √ √ √ √ √ √ AT1G43160 √ √ √ √ √ √ √ √ √ √ √ √ √ AT4G11280 √ √ √ √ √ AT2G44840 √ √ √ √ √ √ √ √ √ √ √ √ √ AT5G51190 √ √ √ √ √ √ √ √ √ √ √ √ √ AT3G23240 √ √ √ √ √ √ √ √ √ √ √ √ √ AT5G61890 √ √ √ √ √ √ √ √ √ √ √ √ √ AT3G50060 √ √ √ √ √ √ √ √ √ √ √ AT4G05100 √ √ √ √ √ √ √ √ √ √ √ AT5G64900 √ √ √ √ AT3G47600 √ √ √ √ √ √ √ √ √ AT1G28370 √ √ √ √ √ √ √ √ √ √ √ √ √ AT3G06490 √ √ √ √ √ √ √ √ √ √ √ AT2G47520 √ √ √ √ √ √ √ √ √ √ √ √ √ AT1G19210 √ √ √ √ √ √ √ √ √ √ √ √ √ AT1G22810 √ √ √ √ √ √ √ √ √ √ √ √ √ AT3G23220 √ √ √ √ √ √ √ √ √ √ √ √ √

Quantifying the effect of priming
104
GO
:00
09
72
3~r
esp
on
se t
o e
thyl
ene
stim
ulu
s
GO
:00
10
03
3~r
esp
on
se t
o o
rgan
ic
sub
stan
ce
GO
:00
09
71
9~r
esp
on
se t
o e
nd
oge
no
us
stim
ulu
s G
O:0
00
37
00
~tra
nsc
rip
tio
n f
acto
r ac
tivi
ty
GO
:00
09
87
3~
eth
ylen
eed
iata
lg p
ath
way
GO
:00
00
16
0~t
wo
-co
mp
on
ent
sign
al
tran
sdu
ctio
n s
yste
m (
ph
osp
ho
rela
y)
GO
:00
30
52
8~t
ran
scri
pti
on
re
gula
tor
acti
vity
G
O:0
00
63
50
~tra
nsc
rip
tio
n
GO
:00
06
35
5~r
egu
lati
on
of
tran
scri
pti
on
,
DN
A-d
epen
den
t G
O:0
05
12
52
~reg
ula
tio
n o
f R
NA
met
abo
lic
pro
cess
G
O:0
00
97
25
~res
po
nse
to
ho
rmo
ne
stim
ulu
s G
O:0
04
54
49
~reg
ula
tio
n o
f tr
ansc
rip
tio
n
GO
:00
03
67
7~
DN
A b
ind
ing
GO
:00
09
64
4~r
esp
on
se t
o h
igh
ligh
t
inte
nsi
ty
GO
:00
09
64
2~r
esp
on
se t
o li
ght
inte
nsi
ty
GO
:00
09
62
8~r
esp
on
se t
o a
bio
tic
stim
ulu
s
GO
:00
09
64
4~r
esp
on
se t
o h
igh
ligh
t
inte
nsi
ty
GO
:00
09
64
2~r
esp
on
se t
o li
ght
inte
nsi
ty
GO
:00
09
40
8~r
esp
on
se t
o h
eat
AT1G21910 √ √ √ √ √ √ √ √ √ √ √ √ √ AT5G07310 √ √ √ √ √ √ √ √ √ √ √ √ √ AT1G15520 √ √ √ √ AT2G47190 √ √ √ √ √ √ √ √ √ AT5G47220 √ √ √ √ √ √ √ √ √ √ √ √ √ AT5G61600 √ √ √ √ √ √ √ √ √ √ √ √ √ AT1G74930 √ √ √ √ √ √ √ √ √ √ √ √ √ AT4G34410 √ √ √ √ √ √ √ √ √ √ √ √ √ AT1G21250 √ AT1G27730 √ √ √ √ √ √ √ √ √ √ √ AT5G13930 √ √ √ AT4G30270 √ √ √ AT1G17380 √ √ √ √ AT5G49620 √ √ √ √ √ √ √ √ √ √ AT5G10380 √ AT5G59820 √ √ √ √ √ √ √ √
AT1G72450 √ √ √ √ AT1G17420 √ √ √ √ √ √ √ AT3G26830 √ √ √ AT5G09980 √ √ AT2G26740 √ √ √ √ AT1G80840 √ √ √ √ √ √ √ √ AT1G56150 √ √ √ AT5G66700 √ √ √ √ √ √ √ √ √ √ AT1G70700 √ √ √ √ AT4G26120 √ AT3G16530 √ AT1G20823 √ AT5G22570 √ √ √ √ √ √ √ √ AT3G56400 √ √ √ √ √ √ √ √ √ AT2G24850 √ √

Quantifying the effect of priming
105
GO
:00
09
72
3~r
esp
on
se t
o e
thyl
ene
stim
ulu
s
GO
:00
10
03
3~r
esp
on
se t
o o
rgan
ic
sub
stan
ce
GO
:00
09
71
9~r
esp
on
se t
o e
nd
oge
no
us
stim
ulu
s G
O:0
00
37
00
~tra
nsc
rip
tio
n f
acto
r ac
tivi
ty
GO
:00
09
87
3~
eth
ylen
eed
iata
lg p
ath
way
GO
:00
00
16
0~t
wo
-co
mp
on
ent
sign
al
tran
sdu
ctio
n s
yste
m (
ph
osp
ho
rela
y)
GO
:00
30
52
8~t
ran
scri
pti
on
re
gula
tor
acti
vity
G
O:0
00
63
50
~tra
nsc
rip
tio
n
GO
:00
06
35
5~r
egu
lati
on
of
tran
scri
pti
on
,
DN
A-d
epen
den
t G
O:0
05
12
52
~reg
ula
tio
n o
f R
NA
met
abo
lic
pro
cess
G
O:0
00
97
25
~res
po
nse
to
ho
rmo
ne
stim
ulu
s G
O:0
04
54
49
~reg
ula
tio
n o
f tr
ansc
rip
tio
n
GO
:00
03
67
7~
DN
A b
ind
ing
GO
:00
09
64
4~r
esp
on
se t
o h
igh
ligh
t
inte
nsi
ty
GO
:00
09
64
2~r
esp
on
se t
o li
ght
inte
nsi
ty
GO
:00
09
62
8~r
esp
on
se t
o a
bio
tic
stim
ulu
s
GO
:00
09
64
4~r
esp
on
se t
o h
igh
ligh
t
inte
nsi
ty
GO
:00
09
64
2~r
esp
on
se t
o li
ght
inte
nsi
ty
GO
:00
09
40
8~r
esp
on
se t
o h
eat
AT2G46400 √ √ √ √ √ √ √ √ AT5G57560 √ √ √ √ √
AT1G28480 √ √ AT5G13220 √ √ √ √ AT2G17040 √ √ √ √
AT4G37850 √ √ √ √ √
AT5G54470 √ √ √ √
AT1G01720 √ √ √ √ √
AT3G63350 √ √ √ √ √ √ √ √ √ √ √ √ √
AT5G05410 √ √ √ √ √ √ √ √ √
AT3G01970 √ √ √ √ √ √ √
AT4G25490 √ √ √ √ √ √ √ √
AT1G52890 √ √ √ √ √ √
AT5G22380 √ √ √ √ √
AT1G80590 √ √ √ √ √ √ √
AT2G38250 √ √ √ √
AT1G12610 √ √ √ √ √ √ √ √
AT3G11580 √ √ √ √ √ √ √
AT3G11020 √ √ √ √ √ √ √ √ √
AT2G40740 √ √ √ √ √ √ √
AT5G46350 √ √ √ √ √ √ √
AT2G18550 √ √ √ √ √ √ √
AT2G22760 √ √ √ √ √
AT1G30135 √ √
AT3G44260 √ √
AT5G10760 √
AT4G25380 √
AT1G52560 √ √ √ √ √ √
AT5G12030 √ √ √ √ √ √
AT1G54050 √ √ √ √ √ √

Quantifying the effect of priming
106
GO
:00
09
72
3~r
esp
on
se t
o e
thyl
ene
stim
ulu
s
GO
:00
10
03
3~r
esp
on
se t
o o
rgan
ic
sub
stan
ce
GO
:00
09
71
9~r
esp
on
se t
o e
nd
oge
no
us
stim
ulu
s G
O:0
00
37
00
~tra
nsc
rip
tio
n f
acto
r ac
tivi
ty
GO
:00
09
87
3~
eth
ylen
eed
iata
lg p
ath
way
GO
:00
00
16
0~t
wo
-co
mp
on
ent
sign
al
tran
sdu
ctio
n s
yste
m (
ph
osp
ho
rela
y)
GO
:00
30
52
8~t
ran
scri
pti
on
re
gula
tor
acti
vity
G
O:0
00
63
50
~tra
nsc
rip
tio
n
GO
:00
06
35
5~r
egu
lati
on
of
tran
scri
pti
on
,
DN
A-d
epen
den
t G
O:0
05
12
52
~reg
ula
tio
n o
f R
NA
met
abo
lic
pro
cess
G
O:0
00
97
25
~res
po
nse
to
ho
rmo
ne
stim
ulu
s G
O:0
04
54
49
~reg
ula
tio
n o
f tr
ansc
rip
tio
n
GO
:00
03
67
7~
DN
A b
ind
ing
GO
:00
09
64
4~r
esp
on
se t
o h
igh
ligh
t
inte
nsi
ty
GO
:00
09
64
2~r
esp
on
se t
o li
ght
inte
nsi
ty
GO
:00
09
62
8~r
esp
on
se t
o a
bio
tic
stim
ulu
s
GO
:00
09
64
4~r
esp
on
se t
o h
igh
ligh
t
inte
nsi
ty
GO
:00
09
64
2~r
esp
on
se t
o li
ght
inte
nsi
ty
GO
:00
09
40
8~r
esp
on
se t
o h
eat
AT5G59720 √ √ √ √ √
AT2G29500 √ √ √ √ √
AT2G05620 √ √ √ √ √
AT5G20230 √ √ √
AT1G53540 √ √
AT5G12020 √ √
AT1G07400 √ √
AT3G46230 √ √
AT3G25760 √
AT3G51240 √
AT3G01500 √
AT3G55120 √
AT1G56600 √
AT5G07990 √
AT3G57260 √
AT5G62520 √
AT2G37970 √
AT1G75040 √
AT5G11210 √
In the following sections, the individual functions within the enriched categories are
described in more detail.

Quantifying the effect of priming
107
Transcription factors
Transcription factors are well known to be primarily involved in the initiation stage of RNA
transcription and they are the key factors that regulate gene expression. A large number
of transcription factors in the roots responded to the NaCl treatment. Many of these were
less responsive to salt upon priming, including key regulatory gene families involved in
response to abiotic and biotic sources of stress such as WRKY (WRKY38, WRKY70,
WRKY46, WRKY45, WRKY66, WRKY55, WRKY8, WRKY40), DREB2B (DRE/CRT-BINDING
PROTEIN 2B, 1F, 2A, 1B), ANAC (ANAC6, ANAC019, Arabidopsis NAC domain containing
protein), MYB (MYB108, MYB2, MYB15, MYB95, MYB77, MYB74, MYB94, MYB108,
MYB78). Others identified are related to hormone signalling such as JASMONATE-ZIM-
DOMAIN PROTEIN (JAZ8, JAZ10, JAZ5, JAZ6, JAZ9, JAZ11) proteins acting as repressors of
jasmonate (JA) and ethylene response factors (ERF98, ERF113, ERF13, ERF105, ERF114,
ERF71, ERF11, ERF17, ERF19, ERF95, ERF12, ERF115, ERF2, ERF104, ERF18, ERF109). Also
found was a kinase (ERS2-ETHYLENE RESPONSE SENSOR 2), as well as auxin-inducible
AtHB53 and ARGOS (Auxin-Regulated Gene Involved in Organ Size). Finally, several
disease resistance-responsive family proteins (AT1G75040, AT5G40990, AT5G09980,
AT5G64900) were also less responsive to salt in primed plants.
Kinase and cell wall related genes
A lower response to salt upon priming was found for key factors in promoting formative
cell divisions in the pericycle CCR4 (ARABIDOPSIS THALIANA CRINKLY4 RELATED 4,
AT3G44260) and for BGLU2 (BETA GLUCANASE 2, AT3G57260). In addition, cell wall
enzymes were also found such as wall-associated receptor kinase 1 (AT1G21250), ABC40
transporter family (AT1G15520), two Xyloglucan endotransglucosylase/hydrolase proteins
(AT5G57560, AT4G30270), GDSL esterase/lipase 1 (AT5G40990) and a Lectin like protein
(AT3G16530).
Ion binding and oxy/reduction signalling
Several genes involved in the oxy/reduction pathway were identified as being less
responsive to stress upon priming: Chalcone--flavonone isomerase 1 (AT3G55120),
Chalcone synthase (AT5G13930), Flavanone hydroxylase (AT3G51240), Flavonoid 3'-
monooxygenase (AT5G07990), Carbonic anhydrase (AT3G01500), lipoxigenase

Quantifying the effect of priming
108
(AT1G17420, LOX3), Glutaredoxin-C9 (AT1G28480), 1-aminocyclopropane-1-carboxylate
synthase 6 (AT4G11280). Electron carrier iron binding proteins such as CYP715A1
(CYTOCHROME P450 715A1) were also identified. Finally, two cation transporters were
also identified in this category such as Blue copper protein (AT5G20230) and PROTON
GRADIENT REGULATION 5 (AT2G05620).
Chaperones and Heat Shock genes
Numerous chaperones were found to be less responsive upon priming these included
HSP18 (AT5G59720), HSP16.4 (AT5G12030), HSP17.6 (AT5G12020), HSP17.4
(AT3G46230), (AT3G63350, A-7b), HSP20 (AT1G52560) and many HSP20-like (AT2G29500,
AT1G53540, AT1G07400, AT1G54050).
The expression profiles of selected genes were further confirmed using qPCR (Fig. 4.11).

Quantifying the effect of priming
109
Fig. 4.11 Real time quantitative PCR (qPCR) analysis of relative expression of selected genes that responded less to the salt in primed roots samples. Total RNA was isolated from one experimental sample, reverse transcribed and cDNA was analyzed by qPCR using primers for genes that showed differential responses on the microarrays (see above). RpII was used as reference gene for the normalization. Standard errors are from four pairwise comparisons of technical duplicates.
0
0.02
0.04
C+ P+ C- P-
Re
lati
ve e
xpre
ssio
n t
o R
pII
ERF1 (AT3G23240)
0
0.03
0.06
C+ P+ C- P-
NAC19 (AT1G52890)
0
0.2
0.4
C+ P+ C- P-
NAC55 (AT3G15500)
0
1
2
3
4
5
C+ P+ C- P-
Re
lati
ve e
xpre
ssio
n t
o R
pII
MYB108 (AT3G06490)
0
0.1
0.2
C+ P+ C- P-
CYP715A1 (AT5G52400)
0
0.9
1.8
C+ P+ C- P-
JAZ10 (AT5G13220)
0
1
2
C+ P+ C- P-
Re
lati
ve e
xpre
ssio
n t
o R
pII
WRKY30 (AT5G24110)
0
0.7
1.4
C+ P+ C- P-
WRKY40 (AT1G80840)
0
0.1
0.2
0.3
C+ P+ C- P-
WRKY46 (AT2G46400)

Quantifying the effect of priming
110
4.4 Discussion
4.4.1 Pros and cons of transcriptomics
The work presented herein generated a genome-wide dataset that identified and
quantified the differences occurring at the transcriptional level between primed and non-
primed plants exposed to a salt stress at a later stage in development. Furthermore,
differences were identified at the organ specific level, as shoots and roots were analysed
and compared separately. A particular effort was made to attest quality, comparability
and reliability of the data by using several different statistical approaches. However,
statistics are limited by the background variability (noise) of the data and therefore small
changes that potentially could have a significant impact on the overall biology might not
be detected. Furthermore, microarray technology is based on a one-to-one (non-
amplifying) hybridisation process between probes and samples making the detection of
low abundant transcripts difficult. This is particularly true for genes that are transiently
expressed and/or only in a specific location because the temporal window or specific cell
type may not be well represented in the experimental sample tested. For example, qPCR
found significant changes in the expression of HKT1, a sodium transporter that is
specifically expressed in root xylem parenchyma cells and was not detected by the
microarray. For these reasons, it cannot be excluded that other changes occurring in
individual transcripts upon stress/priming will be revealed by a more detailed analysis.
Nevertheless the genome-wide results obtained here provided an excellent tool not only
to identify candidate target genes of priming but also to reveal the overall effect of
priming on transcriptional regulation and functional trends therein.
4.4.2 Primed plants show a different response to salt between roots and shoots
One of the new finding from this work was that primed and non-primed plants responded
differently to the salt stress. This was demonstrated by a slope significantly smaller than 1
on the scatter plot of the transcript response to salt in primed and non-primed plants
(Fig.4.6), by a smaller number of differentially expressed genes in primed and non-primed
plant for a given p-value and FDR cut-off (Table 4.2), and by principal component

Quantifying the effect of priming
111
separation of primed from non-primed root samples after salt treatment (Fig.4.7).
Because the roots were in direct contact with the applied salt, the fact that the priming
effect was more pronounced in the roots is more likely to be a consequence of the way
the treatment was applied than a strictly tissue-specific response. The short-term
treatment is not long enough for the salt (or downstream signals) to accumulate in the
aerial part of the plants and perhaps a longer treatment could herald more significant
responses in the shoots. As a consequence, only a few genes were found to be
differentially responsive in the shoots. These genes were reported as typically activated
during the early phase of stress response signalling (i.e. response to unbalanced osmotic
potential, detoxification pathways and ROS protection) (Tab.4.2).
4.4.3 Primed plants respond to salt differentially from non-primed plants by regulating
less genes and/or evoking lower responses within the same genes
Primed plants showed a vast spectrum of genes being differentially regulated when
exposed to the latter salt stress. However, compared to non-primed plants, the primed
plants responded differentially regulating a lower number of genes or regulating the same
genes less strongly, in fact the curve returned a slope lower than 1. (Fig. 4.6). In fact,
according to ANOVA, 25% of the genes responding to salt in non-primed plants did not
respond in primed plants (Tab.4.2). One possible explanation for the finding is that the
plants were “less stressed” (e.g. contained less Na+). Another possibility is that they did
not sense the stress (‘desensitization’), and a third possibility is that primed plants
focussed the response. Our finding that primed plants accumulated less Na+ (Fig. 3.9)
could argue for the first explanation as far as shoot genes are concerned. However, the
roots of primed and non-primed plants were exposed to the same sodium concentration.
The second possibility is supported by the finding that many genes were still responsive
but showed a lower response. The third possibility is supported by the fact that A.
thaliana is a salt-sensitive species that induces many genes that do not necessarily help
with adaptation (‘panic’) response. It has been argued that a close salt-tolerant relative of
Arabidopsis has a more focussed response to salt in fewer genes (Wong et al., 2006; Gong
et al., 2005). If this was the case, primed plants should also show some genes with a

Quantifying the effect of priming
112
higher response to salt. Indeed this was the case (Tab. 4.2 and 4.4) and upon priming
treatment a more focused response occurred in a determinate group of genes (Tab.4.8).
Interestingly, no differences were detected in primed plants either in the overall
transcripts profile (Fig.4.5 and 4.7) or at the vast majority of individual genes (Tab.4.2) 10
days after priming plants without the additional stress exposure. This demonstrated that
the priming treatment influenced the transcriptional regulation of genes without
interfering with the basal level of expression but only when salt is applied. For these
reasons, it was decided to further investigate the differences occurring at the chromatin
level and these data will be presented in Chapter 5.
4.4.4 Gene functions and signalling pathways affected by the priming treatment
To obtain clues about the downstream pathways and physiological processes that were
affected by differential transcriptional responses in primed plants, several gene lists were
subjected to analysis of functional enrichment (DAVID). The analysis did not reveal any
new salt-responsive functional clusters as being specifically regulated in primed plants but
identified a subset of salt-responsive functional clusters that were further enriched in
primed plants. The genes underlying this enrichment (Tab. 4.8 and 4.9) along with
individual genes found particularly to be more responsive upon priming compared to non-
primed plants represent the different strategies plants use for coping with salt stress and
are further described in the following text.
Strategy 1: Avoid toxic ions
One of the strategies that a plant can employ in order to improve its chances of surviving
salt stress is to keep sodium out by activating an active transporter. Ion transporters are
essential in order to detoxify the cell when elevated concentrations of sodium are
reached. Interestingly functional categories identified by DAVID as being more salt-
responsive upon priming included regulators of ion homeostasis, transporters and
channels.
Other genes were also found individually to be very highly responsive to salt upon
priming. Among those, two chloride channels CLC-B (AT3G27170) and SLAH1

Quantifying the effect of priming
113
(AT1G62280) have been found to show a higher response to salt upon priming. CLC-B is
localized at the tonoplast and was identified as a proton-coupled anion transporter,
involved in anion release from the vacuole (Von der Fecht-Bartenbach et al., 2010). The
chloride transporter SLAH1 has been found to be strictly localized to the plasma
membrane of lateral root primordia and in the vascular systems of root. SLAH1 has
similarity to the SLAC1 protein involved in ion homeostasis in guard cells where it controls
the extrusion of chloride (Negi et al., 2008). Although it is not naturally expressed in guard
cells, SLAH1 (At1g62280) can complement the ion accumulation phenotypes of slac1-
2 mutants when expressed under the control of the SLAC1 guard-cell-specific promoter,
suggesting that it performs a similar function but in a particular tissue specific localization
(Negi et al., 2008).
Strategy 2: Maintain a good balance in the ion and water content
In the mature root, the Casparian strip present at the endodermis blocks diffusion into
the stele (Pitman, 1982). Therefore, root epidermal and cortical cells mediate the net
uptake of ions into the root symplasm, whereas the stelar cells of the root mediate the
net passage of ions from the root symplasm into the xylem vessels (Cellier et al., 2004).
Spatial differences in expression could explain why two members of the same family
show an opposite response to the priming treatment and also shed light on the specificity
of priming in gene regulation. For example, AtCHX17 was found to be less up-regulated to
salt upon priming whereas the AtCHX16 was more up-regulated. AtCHX16 is described as
having a function in pH homeostasis and K+ uptake in yeast. When AtCHX16 was
expressed in a K+ uptake-deficient yeast mutant the gene restored the ability of the cells
to grow at alkaline pH (Chanroj et al., 2011). AtCHX17 has also been described as
important in ion transport (Chanroj et al., 2011). Intriguingly, according to the Efp
browser (Winter et al., 2007) AtCHX16 is localized in the inner layer of the roots
(endodermis and perycicle) whereas AtCHX17 was found to be strongly expressed in
zones (epidermis and cortex) that are in apoplastic contact with the external medium
(Cellier et al., 2004). This brings about the possibility that the sodium is localized in some
cells and therefore some genes are more responsive than others because they are located
in cells that are in contact with the Na+ stress while others are not.

Quantifying the effect of priming
114
Salt stress lowers the external water potential and hence the driving force for water influx
into root cells. It was found here that priming abolished the down-regulation of the water
channel TIP4;1 (tonoplast intrinsic protein 4;1) upon salt exposure. Aquaporins facilitate
the uptake of water and regulate root hydraulic conductivity in response to
environmental stresses (Boursiac et al., 2005). TIP4;1 expression is restricted to the root
epidermis and cortex, with no signal detectable in the inner layers (Gattolin et al., 2009).
Also, the expression is in the main root at the base of the elongation zone whereas in
lateral roots it is localized in the differentiation zone (Gattolin et al., 2009).
This brings about the possibility that the priming treatment can potentially lead to an
advantage in stress adaptation by an improved uptake of water during the over
accumulation of ions, a feature that becomes essential during osmotic stress where the
ion inbalance simulates a drought stress.
Strategy 3: Modify cell wall components
Along with transporters cell wall related genes are the other category identified by DAVID
as enriched among genes differentially regulated in primed and non-primed plants. Cell
wall processes are likely to play an important role in several responses to salt, such as
growth inhibition, ROS detoxification and pH homeostasis (Hamann, 2012; Hossain et al.,
2012). Two multicopper oxidase genes targeted to the cell wall SKS16 (SKU5 Similar 16)
and SKS15 (SKU5 Similar 15) were found to be highly expressed upon priming during salt
stress. SKS6 expression in roots changed when root seedlings were brought into direct
contact with auxins and ACC indicating that the hormones could enhance SKS16
expression directly or through a root-delimited signalling cascade (Jacobs and Roe, 2005).
The SKS15 gene plays an important role in regulating directional root growth (Sedbrook et
al., 2002). The gene product localizes to the cell wall and plasma membrane in all the
expanding plant parts, which suggests a role in plant growth processes, possibly through
cell wall remodelling (Sedbrook et al., 2002). AnnAt7 encoding an annexin protein was
more responsive to salt upon priming. Annexins form a multifunctional gene family whose
members have been found in many cellular locations and are involved in a number of
diverse physiological processes, including the secretion of new cell wall materials during
growth and development (Laohavisit et al., 2012; Laohavisit and Davies, 2011). AnnAt7
has been shown to be highly expressed under salt stress and to be specifically localized in

Quantifying the effect of priming
115
the roots (Cantero et al., 2006). The actions of these genes suggest that priming can
stimulate mechanisms that regulate the root growth and consequently plants can either
avoid the stress or grow quicker to combat the stress.
Very few genes showed higher fold changes in response to priming without salt
application; among them members of Cytochromes P450 (P450s) and the hydroxysteroid
dehydrogenase AtHSD4. P450s are hemethiolate mono-oxygenases involved in the
synthesis of backbone structures of different classes of primary and secondary
metabolites and are highly conserved throughout the plant kingdom. AtHSD4 encodes a
protein involved in sterol biosynthesis. Sterols are lipids of biological membranes that
contribute to membrane compartmentalization, such as lipid and protein segregation in
the secretory or endocytic pathways along with providing precursors for biosynthesis of
plant brassinosteroids (Li et al., 2007b). The end product of the brassinosteroid
biosynthesis pathway is synthesized by sequential hydroxylation reactions catalysed by
P450 enzymes (Morant et al., 2007). Interestingly, the administration of epibrassinolide
has been shown to enhance the tolerance to drought in seedlings of A. thaliana and B.
napus as well as to help in overcoming the inhibition of germination under high salt
conditions (Kagale et al., 2007).

116
Chapter 5: Epigenetic profile
5.1 Introduction
5.1.1 Background
Epigenetic changes can be defined as modifications to the genome that do not alter the
nucleotide sequence. Examples of such changes are DNA methylation and histone
modifications, both of which regulate gene expression without altering the underlying
DNA sequence. Some histone modifications, such as acetylation of histones H3 and H4
and trimethylation of H3 lysine 4 (H3K4me3), are known as euchromatic marks and are
often associated with increased transcription whereas other modifications, such as
methylation of H3K9 and H3K27, are known as heterochromatic marks and related to
gene transcription repression (Jenuwein and Allis, 2001; Li et al., 2007a).
Several pieces of evidence suggest that exposure of plants to stressful conditions modifies
their epigenetic landscape (Luo et al., 2012). Studies investigating the effects of mutation
in histone modifying enzymes found altered abiotic stress response and tolerance. For
example, mutations of the histone methyltransferase Trithorax-like Factor (ATX1), which
tri-methylates H3K4me3, caused higher sensitivity to dehydration stress (Ding et al.,
2011), while mutation of the members of the histone de-acetylases caused altered
freezing tolerance and higher sensitivity to ABA and NaCl (Zhu et al., 2008; Luo et al.,
2012b; Chen et al., 2010; To et al., 2011).
However, mutant studies have their limitations: most of the histone modifying enzymes
are still unknown and often the mutations have a severe effect on the plant health and
can disrupt several signal transduction pathways making it difficult to pin-point primary
effects. A more detailed analysis of the impact of environmental stress on histone
modification can be achieved using Chromatin immuno-precipitation (ChIP) associated
with next generation sequencing or hybridization with tiling array (respectively ChIP-Seq
or ChIP-on-ChIP). In these methods, the modified histone proteins are immuno
precipitated using an antibody that specifically recognizes the histone carrying a

Epigenetic profile
117
particular modification at its tail. The isolated modified histones can then be separated
from the associated DNA and the obtained DNA is sequenced or hybridized to DNA
microarrays.
When this project started no studies had used ChIP-Seq or ChIP-on-ChIP to investigate the
effect of abiotic stress on the histone modification landscape. Since then, a small
numbers of studies have been published, in which genome wide approaches have been
applied to investigate changes in the chromatin structure upon abiotic stress exposure of
plants. For example, van Dijk et al., (2010) compared genome wide histone 3 lysine 4
methylation in A. thaliana plants exposed to dehydration stress against normally watered
plants. To address the role of chromatin modifications in salt stress response and
adaptation we carried out a comparative analysis of the epigenetic landscape of A.
thaliana plants after exposure to a short salt priming treatment.
The large set of data obtained provides new experimental evidences for the hypothesis
that epigenetic changes caused by a priming treatment reduce the need for great
transcriptional changes upon later stress exposure (“plant stress memory”) (Bruce et al.,
2007).
5.1.2 Aims of the chapter
In this chapter I describe the genome wide epigenetic landscape of A. thaliana plants
after exposure to a short (24h) priming treatment with 50mM NaCl. Chromatin immuno-
precipitation sequencing (ChIP-Seq) was used to create genome-wide maps of H3K4me2,
H3K4me3, H3K9me2 and H3K27me3 in primed and non-primed A. thaliana. Differences in
epigenetic markers were detected using statistical tools and further confirmed by qPCR. A
second set of ChIP-Seq experiments investigated the H3K27me3 profile 10 days after the
priming treatment to test whether priming induced changes were maintained over
periods of extensive growth and hence can act as a somatic memory of stress events.

Epigenetic profile
118
5.1.3 Workflow of data analysis
Analysis of ChIP-Seq data has been carried out at the Glasgow Polyomics facility in the
Glasgow University. In particular ChIP-Sequencing, reads aligment and mapping has been
carried out by Dr. Pawel Herzyk at the Glasgow Polyomics facility. The complete analysis
workflow is summarised in the Tab 5.1.
The obtained sequences determined by Illumina sequencing were firstly filtered from the
identical sequences. The remained sequences were aligned against the Arabidopsis
genome (version TAIR9) and from among those, only the ones which aligned to a
determinate number of genome locations were considered.
To build quantitative landscapes for the individual histone modifications, the number of
reads was counted within 200 bp windows along the genome.
In a next step, the whole Arabidopsis genome model from TAIR together with the
datasets derived from the sequencing of different ChIP samples was loaded into the
Integrated Genome Browser (IGB) browser. IGB is a free-access software that permits the
analysis of the distribution and exploration of genome-scale datasets in an easy visual
format (Nicol et al., 2009). Furthermore, the nucleotide sequences are loaded into the
browser, which allows the design of specific primers that are needed to confirm the level
of modification in particular areas of the gene by PCR amplification (Fig.5.1). Once these
lists were generated I performed a data mining analysis in an attempt to explore and
extrapolate biological meaning from this vast dataset.

Epigenetic profile
119
Tab. 5.1 Workflow of ChIP-Seq analysis.
SEQUENCING AND READS ALIGNEMENT
Input Activity Software Output File Reference
DNA from ChIP Sequencing Illumina GAIIX
Reads (Redundant/non redundant)
Fastq
Reads Align to A. thaliana genome TAIR 9
Bowtie Aligned and non redundant reads
.bam (Langmead et al., 2009)
Aligned reads Select reads that align to a pre-specified number of genome location UNIQUE: only single alignment permitted ALL: every alignments permitted
Assembly Aligned reads .bam
Aligned reads 1. Aligned reads within bins of 200 bp size.
SICER
Number of aligned reads per bin. = “bar” in profile.
.wig (Zang et al., 2009)
2. Identify continuous stretches of eligible bins. Gap optimized for histone modification: H3K4me2, gap=0 H3K4me3, gap=0 H3K9me2, gap=3 H3K27me3, gap=2
Islands of methylation or “Islands”.
.bed
Aligned reads from 2 samples
Find significant differences
ChIP-Diff Differences .bed Xu et al., 2008
MAPPING
Input Activity Software Output File Reference
Islands Map to coding regions Bowtie
Mapped islands .bam
Differences Map to coding regions Mapped differences
.bam
GRAPHICAL VISUALIZATION
Input Activity Software Output File Reference
Number of aligned reads per bin
Load into IGB genome browser
IGB
Visualised profiles (‘landscape’).
Islands Visualised islands
Differences Visualised differences

Epigenetic profile
120
Fig. 5.1 Data overview as appear in the IGB browser. READS: Number of reads over 200 bp window. ISLANDS: consecutive region with a significant enrichment of reads by SICER (Zang et al., Bioinformatics, 2009). DIFFERENCES: significant difference between control and primed calculated with ChIP-Diff (Xu et al., Bioinformatics, 2008).

Epigenetic profile
121
5.2 Results
5.2.1 Development of an effective and reproducible Chromatin Immuno-precipitation
protocol
In order to investigate whether salt priming induces changes in the chromatin state of
plants, Chromatin Immuno-Precipitation (ChIP) was carried out on root and shoot
samples from primed and non-primed plants harvested directly after a 24 hours exposure
to priming (50mM NaCl) or control solution (0mM NaCl) (see Chapter 2 for methods).
Since several different antibodies against histone modifications were used, a particular
effort was made to optimize the ChIP protocol such as by adjusting the stringency of the
conditions used (e.g number of washes, amount of antibody) and identifying the
appropriate time of sonication necessary to obtain fragments of the correct length.
Once an efficient protocol was generated, the analysis was focused on quantifying the
methylation level of different lysine residues in the tail of the histone H3, such as: di- and
tri-methylation of Lysine 4 (K4me2, K4me3), di-methylation of Lysine 9 (K9me2) and tri-
methylation of Lysine 27 (K27me3). Material from three independent priming treatments
was used for all ChIP experiments. In each replicate all antibodies were applied to
samples originating from the same population of plants. DNA samples obtained from each
ChIP were tested for enrichment of the particular marker (e.g H3K27me3) in specific
regions of the Arabidopsis genome previously shown to be enriched (Zhang et al., 2009;
Zhou et al., 2010; Zhang et al., 2007b). Fig. 5.2 shows PCR amplification of these regions
used as quality control to confirm the expected absence/presence pattern for the
different samples. Finally, after passing the quality control, the three replicate ChIP
samples were pooled together and subjected to sequencing with the Illumina technology.

Epigenetic profile
122
Fig. 5.2 DNA fragments amplified with different sets of primers designed against genome regions known to be associated with (Positive Control) or lacking (Negative Control) a particular marker. (CS) Non-primed Shoots, (PS) Primed Shoots, (CR) Non-primed Roots, (PS) Primed Roots. I: Total genomic DNA (ChIP input), NA: ChIP without antibody, A: ChIP with antibody specified in the figure, M2: ChIP with antibody against anti di-methyl H3K4, M3: ChIP with antibody against anti tri-methyl H3K4. In A-B) the sets of primers were designed in order to distinguish between di- (Positive Control), tri- (Positive Control) or un- (Negative control) methylated H3K4. In (C) the sets of primers were designed in order to distinguish between di- (Positive Control), or un- (Negative Control), methylated H3K9. In (D) the sets of primers were designed in order to distinguish between tri- (Positive Control), or un- (Negative Control), methylated H3K27.
B DI-METHYLATION
ENRICHED
TRI-METHYLATION
ENRICHED
NO METHYLATION
H3K9Me2
H3K27Me3
METHYLATION NO METHYLATION C
A
Positive Control Positive Control Negative Control
Positive Control Positive Control Negative Control
Positive Control Positive Control Negative Control
Positive Control Positive Control Negative Control
TRI-METHYLATION
ENRICHED
DI METHYLATION
ENRICHED
NO METHYLATION
Negative Control Positive Control
CS PS CS PS
CS PS CS PS
CS PS
CS PS
CR PR CR PR
CR PR
CR PR
CR PR
CR PR CR PR
CR PR
CR PR CR PR
D METHYLATION NO METHYLATION Positive Control Negative Control

Epigenetic profile
123
5.2.2 Genome wide histone modification landscape
Chip sequencing was used to identify and quantify genome regions associated with the
follow histone modifications: H3K4me2, H3K4me3, H3K9me and H3K27me3. Quality
controlled samples from Arabidopsis shoots and roots, primed or not with 50 mM NaCl
for 24h (see previous section) were used for this analysis. In order to confirm that the
sequencing process produced consistent results, the total number of sequences (reads)
obtained was compared between samples. As shown in Fig.5.3, the total number of
sequences obtained from the ChIP-Seq was very similar independent of antibody, sample,
treatment and tissue.
Fig. 5.3 Total number of reads for different histone modifications. Plotted are the total numbers of redundant sequences obtained from individual Illumina sequencing for each modification (H3K4me2, H3K4me3, H3K9me2, H3K27me3), tissue (shoots/roots) and treatment (control/primed). In the next step identical sequences were removed from the dataset and the non-
redundant reads were aligned against the A. thaliana genome (version TAIR9). Initially
only unique alignments were allowed. Modifications generally described as being
localized in euchromatic areas such as H3K4me2, H3K4me3 and H3K27me3, showed a
good percentage of alignment (approximately of 80-90%) (Tab.5.2). In contrast, for
H3K9me2, known to be associated with transposons and highly repetitive sequences
(Zhou et al., 2010), less than half of the sequences aligned to a unique position in the
genome. When multiple alignments were allowed, a high percentage of alignment for
H3K9me2 was restored. This demonstrates that depending on the targets of the
modification different alignment parameters have to be applied. Therefore, in our
TOTAL NUMBER OF READS FOR EACH MODIFICATION
Mill
ion
s o
f se
qu
ence
s
Control Roots
Primed Roots
Control Shoots
Primed Shoots
20
30
40
H3K4me2 H3K4me3 H3K9me2 H3K27me3

Epigenetic profile
124
analysis, unique alignment was used for H3K4me2, H3K4me3 H3K7me3, while for
H3K9me2 all possible alignments were used.
Tab. 5.2 Percentage of sequences that aligned to the genome for each individual modification sequenced (H3K4me2, H3K4me3, H3K9me2, H3K27me3). Shown are shoots and roots in control conditions.
SHOOTS Max number of
alignments %
Aligned ROOTS
Max number of alignments
% Aligned
CSH3K4me2 1 84.1 CRH3K4me2 1 75.6
CSH3K4me3 1 94.3 CRH3K4me3 1 87.5
CSH3K9me2 1 41.7 CRH3K9me2 1 43.4
CSH3K27me3 1 90.4 CRH3K27me3 1 87.3
CSH3K4me2 50 94.5 CRH3K4me2 50 84.2
CSH3K4me3 50 97.5 CRH3K4me3 50 91.4
CSH3K9me2 50 78.3 CRH3K9me2 50 71.6
CSH3K27me3 50 96.7 CRH3K27me3 50 96.7
CSH3K4me2 All 95.4 CRH3K4me2 all 85.0
CSH3K4me3 All 97.7 CRH3K4me3 all 91.7
CSH3K9me2 All 82.2 CRH3K9me2 all 74.6
CSH3K27me3 All 97.0 CRH3K27me3 all 97.5
SHOOTS Max number of
alignments %
Aligned ROOTS
Max number of alignments
% Aligned
CSH3K9me2 1 41.7 CRH3K9me2 1 43.4
CSH3K9me2 50 78.3 CRH3K9me2 50 71.6
CSH3K9me2 All 82.2 CRH3K9me2 all 74.6

Epigenetic profile
125
A general overview of the epigenetic landscape of roots from primed and non-primed
plants using IGB is shown in Fig.5.4. These data confirm the known association of
particular histone modifications with specific regions along the chromosome (Zhang et al.,
2009; Zhou et al., 2010; Zhang et al., 2007b). H3K4me2, H3K4me3 and H3K27me3 were
widely spread along the euchromatic arms of the chromosomes, while H3K9me2 was
localized in and around the centromeric regions which are rich in hetero-chromatin.
Fig.5.4 also shows that the overall methylation landscape of control and primed roots
were very similar. Therefore, the mild priming treatment did not lead to dramatic changes
in the overall epigenetic landscape.
Validity of the data was also evaluated by observing gene tracks with an expected
methylation patterns shown by a previous study (Brusslan et al., 2012). Fig.5.5 shows the
constitutive gene ACTIN2 (At3g18780) as being highly associated with H3K4me3 marks
but lacking in H3K27me3, while the floral gene FLC (At5g10140) shows significant level of
H3K27me3 but no H3K4me3 except for a small peak that spans the first exon.
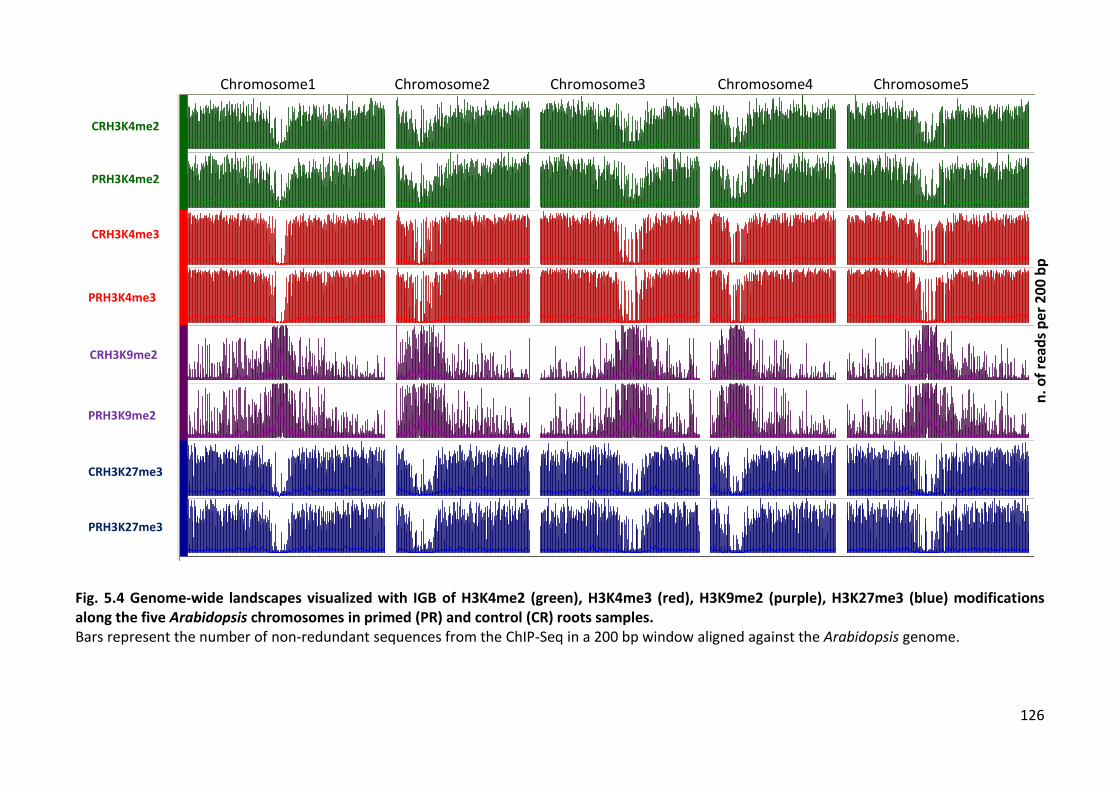
126
1 2 3 4 5 130,534,819
CRH3K4me2
PRH3K4me2
CRH3K4me3
PRH3K4me3
CRH3K9me2
PRH3K9me2
CRH3K27me3
PRH3K27me3
Coordinates
Fig. 5.4 Genome-wide landscapes visualized with IGB of H3K4me2 (green), H3K4me3 (red), H3K9me2 (purple), H3K27me3 (blue) modifications along the five Arabidopsis chromosomes in primed (PR) and control (CR) roots samples. Bars represent the number of non-redundant sequences from the ChIP-Seq in a 200 bp window aligned against the Arabidopsis genome.
Chromosome1 Chromosome2 Chromosome3 Chromosome4 Chromosome5
CRH3K4me2
PRH3K4me2
PRH3K4me3
CRH3K4me3
PRH3K27me3
CRH3K27me3
PRH3K9me2
CRH3K9me2
n. o
f re
ads
per
20
0 b
p

127
At3g18780, ACT2
B)
At5g10140, FLC
Fig. 5.5 Expected pattern of H3K4me3 and H3K27me3 histone modification on two representative genes in primed (PR) and control (CR) roots samples. Genes are shown at the bottom of this Genome Browser image, exons are represented in black as thick lines and introns are shown as black thin lines. The black arrows indicate the direction of transcription. Bars represent the number of non-redundant sequences from the ChIP-Seq in a 200 bp window aligned against the Arabidopsis genome.
CRH3K4me3
PRH3K4me3
CRH3K27me3
PRH3K27me3
GENE
CRH3K4me3 PRH3K4me3 CRH3K27me3 PRH3K27me3 GENE
n. o
f re
ads
per
20
0 b
p
n. o
f re
ads
per
20
0 b
p

128
5.2.3 Priming affects histone modifications in a tissue specific manner
Root and shoot profiles were further analysed in order to evaluate the effect of the
priming treatment on specific tissues. For this purpose we initially compared the whole
genome wide profile of two modifications (H3K4me2 and H3K4me3) between root and
shoot of the same plants.
Firstly, continuous stretches of significant number of reads (islands) were identified using
SICER (Zang et al., 2009) (Ref. Tab.5.1). Results reported in Fig.5.6A, show that in neither
root or shoot the number of H3K4me2 and H3K4me3 islands changed upon priming.
However, the total coverage of the genome with H3K4me3 showed a slight decrease by
1.1% in the roots upon priming, while there was no difference in the shoots (Fig.5.6B). In
addition, comparison of the island length distribution for H3K4me3 between primed and
non-primed roots, revealed a slight shift towards shorter island (Fig.5.6C). Once more no
such difference was seen in the shoots.
Positions displaying significant differences in histone modifications between primed and
non-primed plants were identified by ChIP-Diff (Xu et al., 2008a) and displayed in the IGB
browser. Fig.5.7 shows differences in H3K4me2 and H3K4me3 of at least 1.2 fold between
primed and non-primed plants. A large number of differences were identified in roots
while hardly any differences were identified in shoots of the same plants.
This finding indicates that the differences observed in the roots, even if they are small,
are not random fluctuations. Several of these differences were subsequently confirmed
by qPCR (Fig.5.8). On the basis of these results, it was decided to focus solely on root
tissue and here extend the analysis to other histone modifications.

129
A) B)
C)
Fig. 5.6 Number of methylated islands and percentage of genome coverage for H3K4 di- and tri-methylation in roots (R) and shoots (S), non-primed (C) and primed (P). A) Total number of Islands. B) Percentage of genome coverage with islands. C) Island length distribution in primed (light colour) and non-primed (darker colour) samples. The islands were divided into bins of a given length increasing by 200 bps and the number of islands in each bin was counted.
22247
22009
21389
21209
17584
17798
18297
18468
CSH3K4me2
PSH3K4me2
CRH3K4me2
PRH3K4me2
CSH3K4me3
PSH3K4me3
CRH3K4me3
PRH3K4me3
Number of methylated islands
21.7 %
21.4%
20.6%
21.0%
15.1%
15.1%
16.8%
15.7%
CSH3K4me2
PSH3K4me2
CRH3K4me2
PRH3K4me2
CSH3K4me3
PSH3K4me3
CRH3K4me3
PRH3K4me3
% of the genome associated with methylated islands
0
1000
2000
3000
4000
200 600 1000 1400 1800 2200 2600 3000 5000 7000
Nu
mb
er
of
Isla
nd
s
Island length (bp)
SH3K4me2
0
1000
2000
3000
4000
200 600 1000 1400 1800 2200 2600 3000 5000 7000
Nu
mb
er
of
Isla
nd
s
Island length (bp)
RH3K4me2
0
1000
2000
3000
4000
5000
200 600 1000 1400 1800 2200 2600 3000 5000 7000
Nu
mb
er
of
Isla
nd
s
Island length (bp)
SH3K4me3
0
1000
2000
3000
4000
5000
200 600 1000 1400 1800 2200 2600 3000 5000 7000
Nu
mb
er
of
Isla
nd
s
Island length (bp)
RH3K4me3
non-primed primed
non-primed primed
non-primed primed
non-primed primed

130
A)
B)
Fig. 5.7 A) Distribution of differences of H3K4me2-me3 in roots and shoots of primed and non-primed plants along all five A. thaliana chromosomes. Bars represent differences in the level of H3K4me2 and -me3 between primed and control with a change of at least 1.2 fold. B) Distribution of differences of H3K4me2-me3 in roots and shoots of primed and non-primed plants along Chromosome 1 of A. thaliana. Top panel: profile of H3K4me2 in roots of primed (PRH3K4me2) and non-primed (CRH3K4me2) plants; profile of H3K4me3 in roots of primed (PRH3K4me3) and non-primed (CRH3K4me3) plants. Lower panel: profile of H3K4me2 in shoots of primed (PSH3K4me2) and non-primed (CSH3K4me2) plants; profile of H3K4me3 in shoots of primed (PSH3K4me3) and non-primed (CSH3K4me3) plants. Red bars represent differences in H3K4me2 –me3 level between primed and non-primed plants with a change of at least 1.2 fold.
CRH3K4me2
PRH3K4me2
Differences H3me2
Differences H3Kme2
CSH3K4me2
PSH3K4me2
CRH3K4me3
PRH3K4me3
Differences H3K4me3
Differences H3K4me3
CSH3K4me3
PSH3K4me3
SHOOTS
ROOTS
CRH3K4me2 (1, 347)
PRH3K4me2 (1, 360)
CSH3K4me2 (1, 359)
PSH3K4me2 (1, 351)
PRH3K4me3 (1, 396)
CRH3K4me3 (1, 383)
PSH3K4me3 (1, 392)
CSH3K4me3 (1, 388)
0 5,000,000 10,000,000 15,000,000 20,000,000 25,000,000 30,000,000
30,401,154
CRH3K4me2 (1, 347)
PRH3K4me2 (1, 360)
CSH3K4me2 (1, 359)
PSH3K4me2 (1, 351)
PRH3K4me3 (1, 396)
CRH3K4me3 (1, 383)
PSH3K4me3 (1, 392)
CSH3K4me3 (1, 388)
0 5,000,000 10,000,000 15,000,000 20,000,000 25,000,000 30,000,000
30,401,154
CRH3K4me2 (1, 347)
PRH3K4me2 (1, 360)
CSH3K4me2 (1, 359)
PSH3K4me2 (1, 351)
PRH3K4me3 (1, 396)
CRH3K4me3 (1, 383)
PSH3K4me3 (1, 392)
CSH3K4me3 (1, 388)
0 5,000,000 10,000,000 15,000,000 20,000,000 25,000,000 30,000,000
30,401,154
CRH3K4me2 (1, 347)
PRH3K4me2 (1, 360)
CSH3K4me2 (1, 359)
PSH3K4me2 (1, 351)
PRH3K4me3 (1, 396)
CRH3K4me3 (1, 383)
PSH3K4me3 (1, 392)
CSH3K4me3 (1, 388)
0 5,000,000 10,000,000 15,000,000 20,000,000 25,000,000 30,000,000
30,401,154
TAIR9
Roots K4me2
Shoots K4me2
Shoots K4me3
Roots K4me3
1 2 3 4 5
Differences Roots
H3K4me2 (+)
Differences Shoots
H3K4me2 (+)
Differences Roots
H3K4me3 (+)
Differences Shoots
H3K4me3 (+)
Differences Roots
H3K27me3 (+)
Differences Roots
H3K9me2 (+)
Coordinates
TAIR10 (+)
Chromosome 2 Chromosome 3 Chromosome 4 Chromosome 1 Chromosome 5
Chromosome1
n. o
f re
ads
per
20
0 b
p
n. o
f re
ads
per
20
0 b
p

131
Fig. 5.8 Confirmation of individual differences of H3K4me2 and H3K4me3 between primed and non-primed roots. On the left are shown selected differences determined by ChIP-Seq displayed in the IGB browser: in the top panel are reported the differences between priming and control determined by ChIP-Diff (fc ≥1.2) and in the lower panel are the H3K4me2 and –me3 profiles where every bar corresponds to the read number over a 200 bps window. Primers were designed against the border of the identified differences. On the right the qPCR results are shown in a graph displaying enrichment of H3K4me2—me3 relative to Input. Standard errors are derived from four pairwise comparisons of technical duplicates.
0
1
2
3
4
5
SOS5 LRP1 SCARECROW
Re
lati
ve t
o In
pu
t
H3K4me2
0
1
2
3
4
5
6
SOS5 LRP1 SCARECROW
Re
lati
ve t
o In
pu
t
H3K4me3
CRH3K4me2 (1, 347)
PRH3K4me2 (1, 360)
CRH3K4me3 (1, 383)
PRH3K4me3 (1, 396)
AT5G12350.1
AT5G12330.1AT5G12330.2AT5G12330.4AT5G12330.3AT5G12340.1
3,984,000 3,986,000 3,988,000 3,990,000 3,992,000 3,994,000 3,996,000 3,998,000
PvsCRH3K4me2 (+)
CRH3K4me2
PRH3K4me2
PvsCRH3K4me3 (+)
CRH3K4me3
PRH3K4me3
TAIR10 mRNA (+)
TAIR10 mRNA (-)
Coordinates
CRH3K4me2 (1, 347)
PRH3K4me2 (1, 360)
CRH3K4me3 (1, 383)
PRH3K4me3 (1, 396)
AT5G66770.1 AT5G66780.1 AT5G66790.1 AT5G66800.1 AT5G66810.1
26,656,000 26,658,000 26,660,000 26,662,000 26,664,000 26,666,000 26,668,000 26,670,000 26,672,000 26,674,000
PvsCRH3K4me2 (+)
CRH3K4me2
PRH3K4me2
PvsCRH3K4me3 (+)
CRH3K4me3
PRH3K4me3
TAIR10 mRNA (+)
TAIR10 mRNA (-)
Coordinates
CRH3K4me2 (1, 347)
PRH3K4me2 (1, 360)
CRH3K4me3 (1, 383)
PRH3K4me3 (1, 396)
AT3G46560.1
AT3G46550.1 AT3G46570.1
17,134,000 17,136,000 17,138,000 17,140,000 17,142,000 17,144,000 17,146,000
PvsCRH3K4me2 (+)
CRH3K4me2
PRH3K4me2
PvsCRH3K4me3 (+)
CRH3K4me3
PRH3K4me3
TAIR10 mRNA (+)
TAIR10 mRNA (-)
Coordinates
CR
K4m
e2
PR
K4
me2
C
RK
4me
3 P
RK
4m
e3
Diff.
CRH3K4me2 (1, 347)
PRH3K4me2 (1, 360)
CRH3K4me3 (1, 383)
PRH3K4me3 (1, 396)
AT5G12350.1
AT5G12330.1AT5G12330.2AT5G12330.4AT5G12330.3AT5G12340.1
3,984,000 3,986,000 3,988,000 3,990,000 3,992,000 3,994,000 3,996,000 3,998,000
PvsCRH3K4me2 (+)
CRH3K4me2
PRH3K4me2
PvsCRH3K4me3 (+)
CRH3K4me3
PRH3K4me3
TAIR10 mRNA (+)
TAIR10 mRNA (-)
Coordinates
CRH3K4me2 (1, 347)
PRH3K4me2 (1, 360)
CRH3K4me3 (1, 383)
PRH3K4me3 (1, 396)
AT3G46560.1
AT3G46550.1 AT3G46570.1
17,134,000 17,136,000 17,138,000 17,140,000 17,142,000 17,144,000 17,146,000
PvsCRH3K4me2 (+)
CRH3K4me2
PRH3K4me2
PvsCRH3K4me3 (+)
CRH3K4me3
PRH3K4me3
TAIR10 mRNA (+)
TAIR10 mRNA (-)
Coordinates
CRH3K4me2 (1, 347)
PRH3K4me2 (1, 360)
CRH3K4me3 (1, 383)
PRH3K4me3 (1, 396)
AT5G66770.1 AT5G66780.1 AT5G66790.1 AT5G66800.1 AT5G66810.1
26,656,000 26,658,000 26,660,000 26,662,000 26,664,000 26,666,000 26,668,000 26,670,000 26,672,000 26,674,000
PvsCRH3K4me2 (+)
CRH3K4me2
PRH3K4me2
PvsCRH3K4me3 (+)
CRH3K4me3
PRH3K4me3
TAIR10 mRNA (+)
TAIR10 mRNA (-)
Coordinates
Diff.
SOS5 LRP1 SCARECROW-LIKE
SOS5 LRP1 SCARECROW-LIKE non-primed primed
non-primed primed
n. o
f re
ads
per
20
0 b
p
n. o
f re
ads
per
20
0 b
p

132
5.2.4 Effect of the priming treatment on different histone modifications in the roots
A comparative analysis between control and primed roots was carried out to show
differences in various histone modifications. An initial analysis was made using the list of
all islands and differences generated by SICER and ChIP-Diff in order to investigate
priming induced changes for all the histone modifications considered. Then I performed a
more detailed analysis looking at differences that could be mapped to genes in order to
investigate which type of gene functions were associated with the differences.
5.2.4.1 Genome coverage, island number and island length for different histone
modifications
In Fig.5.9 is shown the total number of methylation islands for all four modifications as
well as percentage of genome coverage. In the primed samples the genome coverage
with H3K27me3 dropped by 2.8% and the genome coverage with H3K4me3 dropped by
1.1%, respectively. Genome coverage with H3K9me2 and H3K4me2 slightly increased by
0.9% and 0.4%, respectively (Fig.5.9A). Intriguingly, these changes in the total amount of
methylation were not positively correlated to the total number of islands. In fact the
number of methylated islands was very similar in primed and non-primed samples for all
the modifications apart from H3K27me3, which showed an increase by 20% in islands
number in the primed sample (Fig.5.9B). Accordingly, for this modification the
distribution of the island length also dramatically changed upon priming, showing a
higher number of short islands and a smaller number of large islands. This suggests that
the priming treatment divides the existing methylated islands into smaller islands
(Fig.5.10). From these results H3K27me3 emerged as the most affected modification by
the priming treatment; the priming treatment decreased the overall coverage of the
genome with H3K27me3 and generated a higher number of shorter H3K27me3 islands.

133
A)
B)
Fig. 5.9 Number of islands for H3K4 di- and tri-methylation, H3K9 di-methylation and H3K27 tri-methylation in roots of non-primed (CR) and primed (PR) plants. A) Percentage of genome; B) Number of Islands.
21389
21209
18297
18468
2093
2335
6288
7687
CRH3K4me2
PRH3K4me2
CRH3K4me3
PRH3K4me3
CRH3K9me2
PRH3K9me2
CRH3K27me3
PRH3K27me3
Total number of methylated islands
20.6%
21%
16.8%
15.7%
13.9%
14.8%
19.3%
16.5%
CRH3K4me2
PRH3K4me2
CRH3K4me3
PRH3K4me3
CRH3K9me2
PRH3K9me2
CRH3K27me3
PRH3K27me3
% of the genome associate with methylated islands

134
Fig. 5.10 Island length distribution in primed and non-primed roots analysed for the four histone modifications. The islands were divided into bins of a given length increasing by 200 bp and the number of islands contained in each bin was counted.
0
1000
2000
3000
4000
20
0
40
0
60
0
80
0
10
00
12
00
14
00
16
00
18
00
20
00
22
00
24
00
26
00
28
00
30
00
40
00
50
00
60
00
70
00
80
00
Nu
mb
ero
of
Isla
nd
s
Islands length (bp)
H3K4me2
0
1000
2000
3000
4000
5000
20
0
40
0
60
0
80
0
10
00
12
00
14
00
16
00
18
00
20
00
22
00
24
00
26
00
28
00
30
00
40
00
50
00
60
00
70
00
80
00
Nu
mb
ero
of
Isla
nd
s
Islands length (bp)
H3K4me3
0
100
200
300
400
500
600
700
20
0
60
0
10
00
14
00
18
00
22
00
26
00
30
00
34
00
38
00
42
00
46
00
50
00
54
00
58
00
62
00
66
00
70
00
74
00
78
00
Nu
mb
er
of
Isla
nd
s
Islands length (bp)
H3K27me3
0
50
100
150
200
40
0
80
0
12
00
16
00
20
00
24
00
28
00
32
00
36
00
40
00
44
00
48
00
52
00
56
00
60
00
64
00
68
00
72
00
76
00
80
00
Nu
mb
ero
of
Isla
nd
s
Island length (bp)
H3K9me2
non-primed primed
non-primed primed
non-primed primed
non-primed primed

135
5.2.4.2 Identification of genome regions associated with changing in histone
methylation upon priming
ChIP-Diff was used to identify methylated regions that significantly differed between
control and primed samples. ChIP-Diff works by partitioning the genome into bins then
computing the fold-change of the number of ChIP fragments in each bin and finally taking
into account the correlation between consecutive bins (Xu et.al 2008).
The total number of differences identified by ChIP-diff is reported in Fig. 5.11A. When
differences of at least 1.2 fold were included, the program detected 7733 differences for
H3K27me3, 744 for H3K4me2, 1500 for H3K4me3 and 509 for H3K9me2. When the cut-
off was increased to 2 fold, H3K27me3 was the only modification that passed this
criterion with 1679 differences being detected. When the direction of the differences
(more or less methylation upon priming) was taken into account, it was found that the
priming had a different influence on the level of methylation depending on the
modification considered (Fig. 5.11A). For H3K4me2 and H3K4me3 the majority of
differences (87% and 97% respectively) resulted in an increase of the modification in
primed plants. In contrast, the majority of differences consisted in a decrease (84 %) for
H3K27me3. Only for H3K9me2 half of the differences resulted in an increase of the
modification in primed plants (52%) and consequently half decreased.
Fig.5.11B relates the number of differences to the total number of islands. The island
number of H3K4me2 –me3 is large (almost 20000) while the number of differences is
small. In contrast, the number of H3K27me3 islands is smaller (almost 8000) but a similar
number of differences were identified (an average of one difference per island). Figure
5.11B also shows the number of mapped regions that had a different level of methylation
upon priming, including a change of at least 1.2 fold.
These results demonstrate that the effect of priming differed among the different
modifications analysed.
The opposite effect on H3K4me3 (increased) and H3K27me3 (decreased) is particularly
interesting, because it suggests that priming acts on the chromatin configuration in a
manner that opens the chromatin at specific loci.

136
A) B)
Fig. 5.11 Total number of regions that differ in the level of methylation between control and primed roots in all the modifications considered. A) Number of differences higher than 1.2 fold. Bars above the red line give the number of sequences with an increase in the mark after priming; bars below the red line give the number of sequences with a decrease in the mark after priming. B) Total number of mapped islands. Non-primed samples are in darker colours and primed samples are in lighter colours. The total number of differences higher than 1.2 fold change is shown in open bars.
646
1454
233
1213
98 46
6520
276
P/C
< 1
.2
P
/C>1
.2
Total no. of differences
0
5000
10000
15000
20000
25000
Nu
mb
er
of
osl
and
s/d
iffe
ren
ces
No.of mapped islands and differences
K4me2
K4me3
K9me2
K27me3
C P Diff C P Diff C P Diff C P Diff
C P Diff
K4
me2
K4
me3
K9
me2
K2
7m
e3

137
5.2.4.3 Spectrum of genes with identified functions changed at the epigenetic level
upon priming
The type of genes which were associated with different histone modifications and priming
induced changes was further investigated by generating lists of islands and differences
that were mapped to genes (criteria reported in Tab.5.1). The lists containing the TAIR ID
of individual genes that showed a difference detected by ChIP-Diff were further analysed
using DAVID. This software identified groups over-representing GO-terms and displayed
them together with an enrichment score, a false discovery rate and a p-value (Huang et
al., 2009). The results from this analysis are summarized in Tab. 5.3.
To exclude an enrichment in categories that were simply more associated with the
specific modification, the appropriate list of genes resulting from mapped islands was
used as background.
Interestingly, genes associated with priming-induced differences in histone modifications
showed a bias in function. In particular, the most enriched categories were: “cell wall
related” for H3K4me2, “transcriptional factors related” for H3K27me3 and “response to
organic substance (hormones) for H3K4me3. DAVID analysis of differences for H3K9me2
was not possible due to their low number (resulting in high FDR).
Considering all these findings together, it is clear that priming has an effect on different
histone modifications and in specific gene categories.

138
H3K4me2 Total
DAVID ID 428
Enrichment score 5.9 Count P-Value Fold Enrichment FDR
Cell wall 28 2.2E-07 3.1 2.56E-04
H3K4me3 Total
DAVID ID 1480
Enrichment Score: 9.4 Count P-Value Fold Enrichment FDR
Transcription factor activity
165 2.1E-14 1.8 3.14E-11
Response to organic substance
124 9.7E-10 1.7 1.58E-06
H3K27me3 Total
DAVID ID 3375
Enrichment Score: 17.2 Count P-Value Fold Enrichment FDR
Transcription factor activity
188 2.8E-30 2.3 4.11E-27
Enrichment Score: 7.3 Count P-Value Fold Enrichment FDR
Secondary metabolites 38 1.1E-12 3.5 8.19E-10
Enrichment Score: 7.1 Count P-Value Fold Enrichment FDR
Signal 88 1.2E-09 1.9 1.55E-06
Tab. 5.3 Functional categories enriched among genes showing differences in histone modifications between primed and non-primed plants. The DAVID analysis was performed using the list of mapped islands as background for the respective modification.

139
5.2.5 Genome wide profiles of histone H3K27me3 10 days after priming
It was shown in the previous section that the histone modification most affected by the
priming treatment in terms of islands length, number of differences and fold change was
H3K27me3. Based on these observations, H3K27me3 was selected to investigate if these
changes were maintained over time. In order to explore this possibility, additional
experiments were performed on plants (primed or not) that had been grown in
hydroponic culture without salt for a further 10 days after the 24h priming treatment.
Plants were harvested and ChIP was performed on roots samples using the antibody
against H3K27me3. Three independent experiments were carried out and each
independent immuno-precipitated DNA sample was quality tested before the samples
were pooled, sent for sequencing and analysed as before.
Fig.5.12 shows the genome wide epigenetic landscape of primed and non-primed roots
after 24h and 10 days. Considerably less DNA was recovered from the 10 days samples.
However the overall profiles were the same in all four samples.

140
Fig. 5.12 Genome-wide landscapes visualized using IGB of H3K27me3 modifications along the five Arabidopsis chromosomes in roots samples obtained 24 hours and 10 days after priming. H3K27me3 associated reads are shown in dark blue for roots samples harvested after 24h and in light blue for 10 days samples harvested 10 days after the priming treatment. Samples from non-primed plant roots at the same times are shown in darker shades.
PR 24h
CR 24h
CR 10d
PR 10d
Chr1 Chr2 Chr3 Chr4 Chr5
n. o
f re
ads
per
20
0 b
p

141
5.2.5.1 Methylation coverage 10 days after the priming treatment
Fig.5.13 shows the percentage of genome coverage, number of islands and island length
distributions of H3K27me3 in samples harvested 10 days after the priming treatment
compared to the same parameters in samples harvested after 24h (same data as Fig.5.9).
H3K27me3 coverage had dropped from 19.3% to 16.5% (2.8% difference) 24h after
priming. 10 days later the difference in coverage between primed and non-primed
samples was much smaller (13.5 and 13% respectively, 0.5% difference), but coverage
was still lower in the primed samples (Fig.5.13A).
Fig.5.13B shows that immediately after 24h priming there was an increase in the number
of H3K27me3 islands from 6288 detected in the non-primed to 7687 detected after
priming (+1399 islands). The number of H3K27me3 islands was still greater in primed with
4330 in control and 5672 in primed (+1342 islands) 10 days after the treatment
(Fig.5.13B).
Analysis of the distribution of the island length has shown that 24 hours after priming the
island length had been shifted towards shorter islands. This shift was still apparent 10
days after the treatment (Fig.5.13C). In summary, these data show that in the older plants
there was an all together lower coverage of the genome with H3K27me3 and a lower
number of islands in older than in younger plants (Fig.5.13A-B). However, 10 days after
priming there were still consistent differences to non-primed plants that mirrored those
observed immediately after priming although these differences were smaller. The data
suggest that priming induced changes are retained through cell division and plant
development.
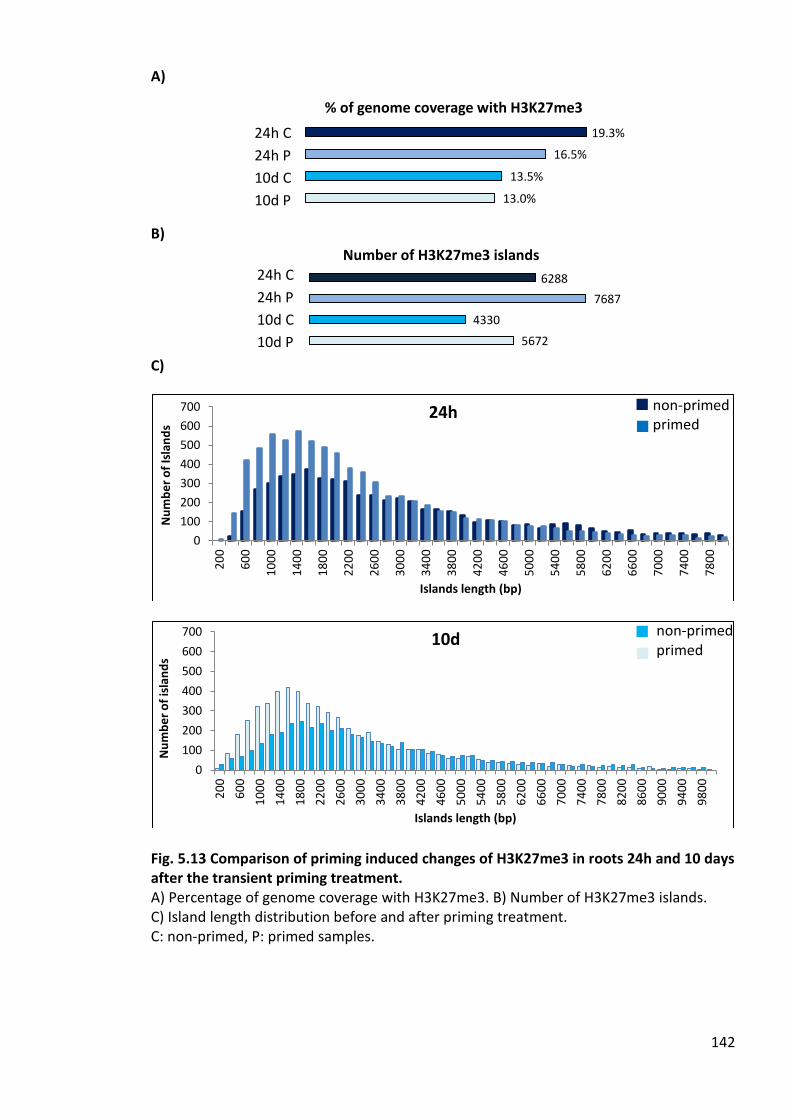
142
A)
B)
C)
Fig. 5.13 Comparison of priming induced changes of H3K27me3 in roots 24h and 10 days after the transient priming treatment. A) Percentage of genome coverage with H3K27me3. B) Number of H3K27me3 islands. C) Island length distribution before and after priming treatment. C: non-primed, P: primed samples.
19.3%
16.5%
13.5%
13.0%
% of genome coverage with H3K27me3
6288
7687
4330
5672
Number of H3K27me3 islands
0
100
200
300
400
500
600
700
20
0
60
0
10
00
14
00
18
00
22
00
26
00
30
00
34
00
38
00
42
00
46
00
50
00
54
00
58
00
62
00
66
00
70
00
74
00
78
00
Nu
mb
er
of
Isla
nd
s
Islands length (bp)
24h
0
100
200
300
400
500
600
700
20
0
60
0
10
00
14
00
18
00
22
00
26
00
30
00
34
00
38
00
42
00
46
00
50
00
54
00
58
00
62
00
66
00
70
00
74
00
78
00
82
00
86
00
90
00
94
00
98
00
Nu
mb
er
of
isla
nd
s
Islands length (bp)
10d
24h C
24h P
10d C
10d P
24h C
24h P
10d C
10d P
non-primed primed
non-primed primed

143
It was then investigated, if the methylated islands detected in the primed samples were
the same ones as those detected in the control samples for both the 24h and 10 days
time points. For this purpose, only the islands that occurred within genes were analysed.
The 24 hours samples showed 3680 mapped islands overlapping between non-primed
and primed plants while 2677 islands were unique for the primed and 1745 were unique
for non-primed plants (Fig.5.14). The 10 days samples showed 1411 islands overlapping
between non-primed and primed plants while 2499 were unique for primed and 1572 for
non-primed plants (Fig.5.14).
Finally, I wanted to establish if the islands detected 24h after priming were the same as
the ones that were detected 10 days after the priming treatment or if new islands were
generated once the stress was ended. In non-primed plants 1117 islands overlapped
between the 24 hours and the 10 days sample, while 1866 were unique in the 10 days
sample and 4308 in the 24 hours sample. In primed plants 3102 islands overlapped
between 24 hour and 10 days samples, while 808 were unique in the 10 days sample and
3244 in the 24 hours sample (Fig.5.14).
Fig. 5.14 Number of H3K27me3 islands mapped to genes in roots of non-primed and primed plants harvested 24h or 10d after the priming treatment.
3102 808
3244
10 d 24h
primed
1117 1866
4308
10 d 24h
non-primed
3680 2677 1745
primed non-primed
24 hours
1411 2499 1572
primed non-primed
10 days

144
5.2.6 Differences upon priming 10 days after the treatment
To investigate whether the individual changes in H3K27me3 that occurred after 24 hours
of priming were still maintained 10 days later, the total number of differences identified
by ChIP-Diff (FC> 1.2) was compared between the two time points. A general overview of
differences in H3K27me3 along the five Arabidopsis chromosomes shows that the
number of differences 10 days after priming is significantly reduced, passing from ~8000
differences to ~500. Of these differences 70% are represented by a decrease in
H3K27me3 in the primed plants (Fig.5.15B). When only the differences which occurred
within genes were considered (370 differences in total), 80% were already different after
24h of priming exposure (Fig.5.15C).
These results demonstrate that differences in H3K27me3 level, which were established by
the priming treatment, are still retained 10 days after the exposure although the level is
still predominantly lower. More intriguingly, most of the differences detected within
genes had also been previously detected in the 24 hours sample, indicating that there is
gene specific retention of methylation. Among these genes there were ion transporters
such as HAK5, ATCHX5, ATCHX10, ATCHX17, ATCHX24, lipid transporter (TGD1), genes
involved in the defence responses (AZI1). Furthermore genes encoding transcriptional
factors (AP2-like, MYB47, MYB112) and a hormonal regulator (ARR11) were found. In
particular, among the transcriptional factors one of the most predominant categories was
involved in the cell cycle and cell fate determination (JACKDAW, APELA, CAULIFLOWER
and SUPERMAN). The complete list is reported in Appendix VI.

145
A)
B) C)
Fig. 5.15 Differences in H3K27me3 level between primed and non-primed plants at 24h and 10d after priming treatment. A) Differences plotted along the five Arabidopsis chromosomes as visualized in IGB. Bars indicate differences in the level of H3K27me3 between primed and non-primed roots with a fold change higher than 1.2. B) Total number of differences higher than 1.2 fold detected by ChIP-Diff. Lighter bars represent the number of sequences with a lower level of H3K27me3 in primed than in non-primed plants and darker bars represent the number of sequences with a higher level of H3K27me3 in primed than in non-primed plants. C) Number of differences higher than 1.2 fold detected by ChIP-Diff within genes. The number of differences higher than 1.2 fold mapped against TAIR9 genes is detected in samples taken after 24h after priming (left circle), 10 days after priming (right circle) or both (overlap).
1213
145
6520
364
C/P
>1
.2
P/C
>1.2
Tot. no of differences
10dK27me3
24hK27me3
Chr1 Chr2 Chr3 Chr4 Chr5
263 3611 107
10 days 24 hours
NUMBER OF DIFFERENCES IN H3K27me3 OCCURING WHITHIN GENES
24 hours 10 days

146
To assess whether individual differences in H3K27me3 between primed and non-primed
plants detected 24 hours after priming were still maintained 10 days later, several genes
were selected for which significant differences had been found after 24 hours.
Primers were chosen using the sequences visualized on IGB and designed on the borders
of differences identified by ChIP-Diff and used to amplify the respective regions by
quantitative real-time RT-PCR (Fig.5.16).

147
Fig. 5.16 H3K27me3 levels determined by qPCR in roots of primed (P) and non primed (C) plants harvested 24h or 10d after the transient priming treatment. Primers were designed on the border of the identified differences. The percentage of enrichment was calculated relative to the reference gene At5g56920 (C: ChIP K27me3 control, P: ChIP K27me3 Primed) for both time points (24h and 10 days). Standard errors are calculated from four pair wise comparison of technical duplicates.
0
1.5
3
C 24h P 24h C 10d P 10d
Me
thyl
atio
n le
vel r
ela
tive
to
Inp
ut
and
At5
g56
92
0
AT4G02780 (GA1)
0
1
2
3
4
5
6
7
C 24h P 24h C 10d P 10d
Me
thyl
atio
n le
vel r
ela
tive
to
Inp
ut
and
At5
g56
92
0
AT3G26120 (TEL1)
0
0.5
1
C 24h P 24h C 10d P 10d
Me
thyl
atio
n le
vel r
ela
tive
to
Inp
ut
and
At5
g56
92
0
(AT5G25180) CYP71B14
0
0.7
1.4
C 24h P 24h C 10d P 10d
Me
thyl
atio
n le
vel r
ela
tive
to
Inp
ut
and
At5
g56
92
0
AT3G28890 (RLP43)
0
2
4
6
C 24h P 24h C 10d P 10d
Me
thyl
atio
n le
vel r
ela
tive
to
Inp
ut
and
At5
g56
92
0
AT3G58780 (SHP1)
0
4
8
C 24h P 24h C 10d P 10d
Me
thyl
atio
n le
vel r
ela
tive
to
Inp
ut
and
At5
g56
92
0
AT4G18960 (AG8)

148
5.3 Discussion
5.3.1 Novelty and robustness of the experimental design
In the last few years several studies have investigated, on a genome wide scale, the
correlation between different epigenetic markers, gene expression and gene function.
The approach used here differed from previous studies in several aspects. Firstly, in
previous studies the plant material used was whole seedlings (Charron et al., 2009) or
leaves (Van Dijk et al., 2010), which means a lack of consideration of differences between
aerial and underground parts of the plant. This is very important when considering that
stress responses may occur at an organ specific level and might result in a completely
different epigenetic landscape for different tissues or cell types. Secondly, rather than
combining Chromatin Immuno-Precipitation (ChIP) with microarray hybridization (ChIP-
on-chip), I used every single DNA molecule pulled down with an antibody to be
sequenced by Illumina technology (ChIP-Seq). While ChIP-on-chip measures relative signal
strength, ChIP-Seq provides an absolute measure with every single sequence aligning to a
genome region being counted, and is therefore much less prone to errors (Ho et al.,
2011). Finally, for the first time a dual-factor comparative analysis was carried out to
investigate the differences between primed and non-primed plants and between roots
and shoots. The ChIP experiment itself is a methodology that can lead to variability in the
results, because the recovered DNA is detected by an indirect method: a specific antibody
recognizes a specific modification on the histone tail associated with a precise part of the
DNA sequence. This indirect determination makes the quality of a ChIP experiment largely
dependent on the antibody’s affinity and specificity which in turn depends on the exact
environment and timing during the process and hence can lead to variation between IP
assays from the same material (‘technical replicates’). Furthermore, as in all biological
experiments, conditions of plant growth and treatment applications cannot always be
fully controlled leading to variation between plant batches and replicate experiments
(‘biological replicates’), which adds to the phenotypic plasticity within an isogenic
population caused by variation between individual plants. Due to the high costs of
Illumina sequencing and the antibodies used, I could not quantify all of these variations.
Instead I have taken the approach to pool tissue from a large number of individual plants

149
for a particular developmental stage (300 plants at 4-leaf stage per biological replicate)
from three independently treated plant batches. The technical quality of the ChIP
performed was checked by PCR for each of the three replicate samples before pooling.
Several antibodies were used to explore the effect of salinity priming on the chromatin
structure including antibodies against di- and tri-methylation of Lysine 4 (H3K4me2 and
me3), di-methylation of Lysine 9 (H3K9me2) and tri-methylation of Lysine 27 (H3K27me3)
of the histone tail H3. The quality of the sequencing was very good; in particular the
number of fragments was similarly high for each sample, independent of experiment,
condition or tissue (Fig.5.2). The sequences obtained were aligned against the Arabidopsis
genome (version TAIR9). Interestingly, a comparable level of alignment for H3K9me2 was
only reached if multiple alignments were allowed (Tab.5.2). If multiple alignments were
not allowed, a severe loss of information occurred for this particular modification,
because H3K9me2 is a heterochromatic marker typically associated with transposons and
highly repetitive sequences. Therefore to retain this information, multiple alignments
were allowed for this modification. However, this leads to uncertainty as to which of the
identical sequences in the genome really carry the modification.
5.3.2 Priming does not radically disrupt the epigenetic landscape
The overall patterns of the four histone modifications analysed in this study were found
to be in agreement with previous studies (Fig.1.4): H3K4me2-me3 and H3K27me3 occur
with high frequency in euchromatic arms and rarely in heterochromatin (Zhang et al.,
2009, 2007b), while H3K9me2 shows the opposite pattern (Bernatavichute et al., 2008).
Furthermore, these overall genome-wide signatures were also found unaltered when the
priming treatment was applied (Fig.5.4). It has been shown that one of the roles of the
epigenetic marks is to define gene expression in a particular cell line (Lafos et al., 2011).
For example, genes associated with H3K27me3 were found to be associated with tissue-
specific repression and are highly enriched in transcription factors and DNA binding
proteins that are important to developmental regulation (Ha et al., 2011) . Thus, it is more
likely that during environmental perturbation the overall patterns of methylation are
robust but can be fine-tuned. The finding that changes in the histone modification
patterns were small is in accordance with this reasoning.

150
5.3.3 Biological meaning of the measured parameters
Significant differences between primed and non-primed plants were detected by
comparing the reads obtained from the two ChIP samples. Overall, primed plants were
not found to gain (or loose) entire islands along the chromosomes. Instead, the variation
was in the number of reads at the same position. Within a given DNA molecule a specific
genomic position can either be associated with a histone modification or not. Within a
mixed cell sample a change in reads at a given position can be due to several reasons: I)
Only a specific cell type reacts to the stress changing its contribution to the overall profile.
II) The stress enhances the probability of the modification to occur in several or all cells
types in the sample. The first possibility is supported by the fact that some cell types carry
specific histone modification patterns (Lafos et al., 2011). It is therefore possible that
some cell types are more prone to epigenetic changes upon stress than others and this is
detected as a small change in a particular position in the overall profile.
The second possibility is supported by a recent study that investigated the vernalization
process involving the negative regulator of flowering gene FLC (FLOWER LOCUS C). The
authors found that during cold exposure the H3K27me3 levels progressively increase
spreading through the FLC locus, until the overall coverage is reached and thus prevents
the plants from flowering (Angel et al., 2011). Furthermore, it was shown that cold
exposure increased the number of cells carrying H3K27me3 in the FLC gene (Angel et al.
2011). Thus, during repetitive cold treatments the silencing marker appeared associated
with different cell types in random positions within the root, suggesting a change in
overall methylation probability rather than targeting of a specific cell type. This
probability model could explain small changes observed after priming; perhaps not all the
cells are carrying the modification because a single priming treatment is not sufficient to
further stimulate the switch in the vast majority of the cells.
5.3.4 Are the observed priming induced changes in epigenetic modifications significant?
As mentioned above, ChIP sequencing is a very expensive technique, therefore the
number of replicates is a limiting factor.

151
It was decided to pool 3 ChIP replicates into one sequencing sample meaning that it was
not possible to test the significance of the observed changes. However, several
observations indicate that the identified differences between primed and non-primed
plants were significant even if they only showed a small difference in fold change.
Firstly, root and shoot of the same plant were compared and this allowed us to use the
shoot data as a proof for the soundness of the design of the experiments. For example
the two profiles of H3K4me2 and H3K4me3 showed that the shoot profiles of primed and
non-primed plants were almost identical, whereas considerable variation was found
between the root profiles (Fig.5.4). Secondly, differences in island number, percentage of
coverage and length distribution upon priming were only found in roots. It should be
noted that even though roots and shoots were harvested separately the obtained profiles
are still likely to be a combination of profiles overlaid from different cell types. As a
consequence changes that are strongly cell type specific will be detected as small
differences because they are diluted.
Taking all these observations into account, it is possible to conclude that the small
differences observed in the roots are real and significant.
5.3.5 Observed differences between primed and non-primed samples were specific for
the particular histone modification measured
Interestingly, no major changes upon priming were detected in the total methylation
coverage for H3K4me2-me3 and H3K9me2. The number of islands and the island lengths
for these modifications was also relatively constant (Fig.5.9 and Fig.5.10). In contrast,
H3K27me3 showed a 3% decrease in the general methylation coverage when priming
treatment was applied (Fig.5.9). These results indicate that rather than creating new
methylation islands, priming tunes the level of histone methylation in specific sequence
positions. Interestingly, a similar conclusion was reached by van Dijk et al., (2010) who
compared patterns of H3K4me3 methylation of Arabidopsis leaves between plants that
were watered normally and plants that had undergone a prolonged dehydration stress.
Even though the authors found that dehydration stress increased the H3K4me3 gene
coverage by 4.8%, the location of islands did not change. The data obtained in my work
also indicated that priming increased the number of H3K27me3 islands while shortening
152
the length of the islands. This could be explained by a small decrease of H3K27 in a
position within an island that already has a low probability for the modification. As a
result islands would be interrupted (‘chopped’). Closer inspection of individual islands
proved that this was indeed the case.
5.3.6 Individual priming induced changes
It was found that the direction of priming-induced changes differed for different
modifications, in particular the level of H3K27me3 mostly decreased after priming, while
the level of H3K4me3 increased (Fig.5.11). Furthermore, H3K27me3 was by far the most
responsive modification to the priming treatment (Fig.5.11). This suggests that priming
acts most strongly by releasing silencing in specific loci (through a decrease of
H3K27me3), and in a moderate way by activating specific genes (through an increase in
H3K4me3).
It was also investigated which type of genes were associated with the priming-induced
differences in methylation levels. Results from this analysis showed that all four histone
modifications targeted specific functional gene families: including categories related to
stress responses, transcription factor activity and cell wall remodelling (Tab.5.3). This bias
in function among the different histone modifications suggests that priming has a specific
effect on particular gene families. In addition, other studies indicate that, in Arabidopsis,
H3K27me3 targets are enriched for genes with tissue-specific expression patterns or are
induced by abiotic or biotic stresses. This suggests that H3K27me3 is dynamically
regulated in response to developmental or environmental cues as suggested by previous
studies (Lafos et al., 2011; Zhang et al., 2007b).
5.3.7 Do the observed changes in H3K27me3 constitute somatic memory?
H3K27me3 was identified as the modification most responsive to the priming treatment
in terms of the total number of sequences and fold change (Fig. 5.11). These results made
H3K27me3 the ideal candidate to further explore the persistence of these priming
induced changes. A further ChIP-Seq of H3K27me3 was carried out using plants exposed
to priming treatment, then removed from the stress and left to grow for another 10 days

153
in hydroponics. The results showed that the overall level of H3K27me3 after 10 days
appeared to be slightly lower than after 24 hours, even in control conditions. However,
despite the fact that 10 days after priming the difference in methylation coverage
between primed and non-primed samples dropped by 2.3% (Fig. 5.13A), a difference in
the number of islands (+1342) between primed and non-primed plants was still detected
suggesting that overall the changes in methylation are retained (Fig. 5.13B). The data also
reflected another exciting finding: the distribution of the island length was found not only
changed after 24 hours of priming but still continued to be changed even after 10 days of
priming (Fig. 5.13C).
In addition, 509 individual differences were still detected 10 days after the priming (Fig.
5.15B) and more than half of them were present within genes (270). Out of these, more
than a third occurred in the same genes (Fig. 5.15C). Taken together these results suggest
that priming-induced changes of H3K27me3 are maintained in the same genes 10 days
after the priming. It does not, however, clarify whether and how this mechanism takes
part in the complex network of signalling pathways that regulate stress responses. These
observations certainly raise the question of how this retention of histone methylation is
possible through replication or cell division. It has to be noted that plants older than 10
days are not dividing anymore. Instead, they are entering in a phase of expansion and
maturation (after 21 days), where endoreduplication is only occurring in the cells
(Beemster et al., 2005). During this process the cells often become polyploid (i.e up to
16C genomic) (Beemster et al., 2005). It has been shown that osmotic stress (i.e salt,
mannitol) stops both cell division and endoreduplication (Skirycz et al., 2011). However, it
is very unlikely that this delay causes the observed differences in H3K27me3 because the
stop of cell division and endoreduplication is transient. Skirycz et al. (2011) have shown
that stressed cells were undistinguishable from non-stressed cells for a period of three
days after the stress was removed (Skirycz et al., 2011).
The fact that the changes in H3K27me3 are still detectable after 10 days could have two
interpretations: I) The methylation marks are actively maintained and deposited during
replication; II) The methylation marks are diluted during the replication process but
remain and are still detectable even after 10 days.
In the first hypothesis, the low level of H3K27me3 could be explained by the fact that the
modification primarily occurs in specific cell types, which are outgrown by other cell types
during the 10 day period.

154
In the second hypothesis, what is seen here, is the end of the priming effect: there are
still traces of the marks put into place by the priming treatment but these will be
eventually removed through the action of de-methylase enzymes. It should be interesting
to find out whether repeated treatments prevent the marks from being lost, and what is
the required length of time between two treatments to fully maintain marks.
How histone methylation marks are maintained through the DNA replication is still under
debate. Currently two models have been proposed for Drosophila (Abmayr and
Workman, 2012).
The first model proposes that histones carrying the modification pass through the
replication fork, but not the histone methyltransferase complex (MTCs) that is associated
with them. Upon replication, histones are inherited by the daughter strands in a semi-
conservative way and new MTCs are recruited to re-establish the methylated domain
(Corpet and Almouzni, 2009).
In the second model, the modifications are removed from the histone prior to the
passage through the replication fork. The MTCs methylation machinery is distributed onto
the daughter strands where it re-methylates the parental nucleosomes and methylates
the new nucleosomes. This leads to a recruitment of new MTCs to fully complete the
methylation domain (Petruk et al., 2012).
However, the process of how histone modifications are inherited still awaits detailed
study in plants.

Chapter 6: Comparative analysis between epigenetic and transcriptional profiles
6.1 Introduction
6.1.1 Background
The relationship between particular histone modifications and gene expression is well
documented and well conserved among organisms: H3K4me3 is positively correlated with
gene expression meaning that high levels of methylation at Lysine 4 are usually associated
with actively transcribed genes. On the contrary H3K27me3 is often associated with non
transcribed genes (Roudier et al., 2009).
However, the question whether specific histone modifications and transcription are still
correlated during or after a salt stress, has to my knowledge, never been investigated.
One question is whether changes in histone modifications observed after 24 hours (as
shown in Chapter 5) merely reflect transient changes in gene expression. Another
question is whether differential transcriptional responses after the second treatment are
related to priming induced changes in histone modifications.
6.1.2 Aims of the chapter
In order to investigate the relationship between epigenetic changes and transcriptional
differences, the gene-specific epigenetic differences between primed and non-primed
plants detected after 24 hours of priming were integrated with transcript levels in the
same samples determined by RNA sequencing.
Furthermore, the differences in transcriptional responses of primed and non-primed
plants detected after the second stress exposure (described in Chapter 4) were compared
with the differences in H3K27me3 at 10 days after the priming.

Comparative analysis between epigenetic and transcriptional profiles
156
6.2 Results
6.2.1 Analysis of transcriptome immediately after priming
To investigate the relationship between changes occurring in histone modifications and
changes in gene expression after priming, complete mRNA sequencing (RNA-Seq) was
carried out on roots and shoots samples from primed and non-primed plants harvested
directly after exposure for 24 hours of priming solution (50mM NaCl). The sequencing
data were recorded at the Glasgow Polyomics Facility. Reads obtained from Illumina
sequencing were aligned to A. thaliana genome and cumulative read values were
assigned to each transcript (mRNA level). To provide a first representation of the data, all
mRNA levels were used to generate scatter plots. Fig.6.1, shows the mRNA level for
primed plants (P) plotted against the mRNA level for non-primed plants (C). As expected
the priming treatment influenced the gene expression (Fig.6.1). In shoots, RNA-Seq
detected a total number of 22787 significantly expressed genes, of which 1248 (~5%)
were differentially expressed with a fold change higher than 2 (634 were up-regulated,
614 down-regulated). In roots, RNA-Seq detected a total number of 23222 significantly
expressed genes, of which 2987 (~13%) were differentially expressed with a fold change
higher than 2 (1689 up regulated, 1298 down regulated). The differentially expressed
gene lists (Fc> 2) were loaded into DAVID and functional annotation compared against the
Arabidopsis genome background. The results of the DAVID analysis showed that the
functions of the genes that changed in expression upon priming were the same as those
identified by the Affymetrix array as responding to the second salt exposure (Tab.6.1,
compared with Tab.4.6).

Comparative analysis between epigenetic and transcriptional profiles
157
Fig. 6.1 Scatter plot of mRNA levels in roots (left) and shoots (right) of non-primed (C) and primed (P) plants from the RNA-Seq. Red line indicates the position of the linear regression for the data. Tab. 6.1 Enriched GO categories for genes showing differential expression upon priming in roots (blue) and shoots (green). (UP: up-regulated genes where P>C with Fc>2; DOWN: down-regulated genes where C>P with Fc>2). ROOTS
UP
Cluster1 Enrichment Score: 6.0
Count % P-Value FDR
GO:0045449~ regulation of transcription
71 11.7 1.0E-09 1.5E-06
Cluster 2 Enrichment Score: 2.9
Count % P-Value FDR
GO:0006350 ~transcription
48 7.9 4.2E-07 6.1E-04
Cluster 3 Enrichment Score: 1.5
Count % P-Value FDR
GO:0009695~jasmonic acid biosynthetic 5 0.8 5.4E-04 8.0E-01
DO
WN
Cluster 1 Enrichment Score: 3.5
Count % P-Value FDR
GO:0030528 ~transcription regulator activity
47 9.2 2.2E-05 2.8E-02
GO:0051252 ~regulation of RNA metabolic process
31 6.0 5.5E-05 7.6E-0.2
SHOOTS
UP
Cluster 1 Enrichment Score: 3.2
Count % P-Value FDR
GO:0020037~heme binding 22 3.4 1.5E-05 2.0E-02
GO:0009055~electron carrier activity 27 4.1 4.0E-04 5.3E-01
Cluster 2 Enrichment Score: 2.7
Count % P-Value FDR
GO:0005199 ~structural constituent of cell wall
9 1.4 8.2E-07 1.1E-03
Cluster 3 Enrichment Score: 2.4
Count % P-Value FDR
GO:0004601 ~peroxidase activity
10 1.5 7.5E-04 9.9E-01
DO
WN
Cluster 1 Enrichment Score: 4.4
Count % P-Value FDR
GO:0003700 ~transcription factor
60 8.8 1.2E-07 1.5E-04
Cluster 2 Enrichment Score: 2.5
Count % P-Value FDR
GO:0009055 ~electron carrier
25 3.6 3.6E-04 4.7E-01
mRNA level C mRNA level C
mR
NA
leve
l P
mR
NA
leve
l P

Comparative analysis between epigenetic and transcriptional profiles
158
6.2.2 Localization of epigenetic differences
To enable comparison between priming induced changes in mRNA levels and the level of
histone modifications the latter had to be mapped to genes. The total number of
differences in histone modifications detected by ChIP-Diff (fc>1.2) was compared to the
number of differences localized within genes and to the number of differences in mRNA
levels. 51% of the total number of differences detected in H3K27me3 could be mapped to
genes (3981 out of 7733). Furthermore, more than half of the genes that harboured
differences (2600) were expressed (as detected by RNA-Seq). The vast majority of
differences in H3K4me3 were localized in genes (1438 out 1500) most of which were
expressed (1381) (Fig.6.2). Similarly, 53% of the total number of differences detected in
H3K4me2 could be mapped to genes (449 out of 744) most of which were expressed
(400).
On the contrary, H3K9me2 presented very few differences which were localized in
expressed genes (50 out of 118 mapped differences, out of a total of 509 total differences
detected along the genome) (Fig.6.2).
I then compared the changes in individual genes with changes for histone modifications in
the same genes (Fig.6.3). As shown in Fig.6.3, 11.2% of the expressed genes (detected by
RNA-Seq) harboured changes in H3K27me3 upon priming, followed by H3K4me3 (5.9%),
H3K4me2 (1.7%) and H3K9me2 (0.2%). However, if only the differentially expressed genes
were considered, these values doubled for H3K27me3 and H3K9me2 (22.1% and 0.4%
respectively), but decreased by half for H3K4me3 and H3K4me2 (2% and 1% respectively).

Comparative analysis between epigenetic and transcriptional profiles
159
Fig. 6.2 Number of priming induced histone modifications related to the genome and the transcriptome. Blue: total number of differences occurring over the entire genomic DNA. Red: number of differences occurring exclusively in coding DNA (mapped using TAIR9). Green: number of differences occurring in expressed genes detected by RNA-Seq.
Fig. 6.3 Percentage of genes presenting differences in histone modifications upon priming. Dark green: differences in the percentage of all expressed genes detected by RNA-Seq. Light green: differences in the percentage of all differentially expressed genes between primed and non-primed roots.
7733
1500
744 509
3981
1438
449 118
2600
1381
400 50
0
4000
8000
H3K27me3 H3K4me3 H3K4me2 H3K9me2
Nu
mb
er
of
dif
fere
nce
s d
ete
cte
d b
y C
hIP
Dif
f
Number of differences in histone modification over the entire genomic DNA
Number of differences whithin coding DNA
Number of differences in expressed genes (as identified by RNA-Seq)
11.2%
5.9%
1.7%
0.2%
22.1%
2.0%
1.0%
0.4%
K27me3
K4me3
K4me2
K9me2
% of genes presenting differences in histone modifications upon priming
% of all gene expressed % of differentially expressed genes

Comparative analysis between epigenetic and transcriptional profiles
160
6.2.3 Relationship between gene transcription and epigenetic modification in primed
and non-primed plants
In order to investigate the quantitative relationship between the level of a specific
epigenetic modification and the level of the transcripts obtained by RNA-Seq were
compared against the methylation islands mapped to genes.
Each individual gene was assigned two values: one indicating the gene expression level
(obtained from the RNA-Seq) and the other one the histone modification level (ChIP-Seq
cumulative number of reads over the entire gene normalized to gene length). Genes with
zero value for either histone modification or RNA level were excluded from the analysis.
Genes were ranked by increasing levels of gene transcription then the average of the
histone modification level over the neighbouring ~200 genes was assigned along with the
average of the RNA level (± 100 windows size= 10% of total number of genes). Scatter-
plots were generated by plotting the ranked genes against average histone methylation
(Fig.6.4). The underlying mRNA profiles were also included. As shown in Fig.6.4, the data
confirmed the previously reported correlation between histone modification level and
gene expression: high level of H3K4me3 correlated with high transcripts level, while high
levels of H3K27me3 corresponded to a low gene expression level. No correlation was
observed for H3K4me2 and H3K9me2 (data not shown). The results show that even
though priming impacts on histone modifications, differences in individual genes do not
affect the general correlation between specific modifications and transcription.

Comparative analysis between epigenetic and transcriptional profiles
161
Fig. 6.4 Correlation between transcription level and methylation level. On the x axis: Genes ranked by mRNA level. Green curves are mRNA levels averaged over windows of 200 genes (left y axis). Other colours: histone modification levels over windows of 200 genes (right y axis). Top: H3K4me3 level in non-primed (red) and primed (orange) roots. Bottom: H3K27me3 level in non-primed (blue) and primed (light blue) roots.
0
200
400
600
0
25
50
75
100
0 10000 20000M
eth
yla
tio
n a
mo
unt
RN
A a
mo
un
t
Number of genes
CR H3K4me3
CR RNA
CR K4me3
0
200
400
600
0
25
50
75
100
0 10000 20000
Met
hyl
atio
n a
mo
unt
RN
A a
mo
un
t
Number of genes
PR H3K4me3
PR RNA
PR K4me3
0
200
400
600
0
25
50
75
100
0 10000 20000
Me
thy
lati
on
am
ou
nt
RN
A a
mo
un
t
Number of genes
CR H3K27me3
RNA CR
CRK27me3
0
200
400
600
0
25
50
75
100
0 10000 20000
Met
hyl
ati
on
am
oun
t
RN
A a
mo
un
t
Number of genes
PR H3K27me3
RNA PR
PRK27me3

Comparative analysis between epigenetic and transcriptional profiles
162
6.2.4 Changes at the transcriptional level do not simply reflect changes in histone
methylation
The overall correlation between transcript levels and H3K4me3 (positive) and H3K27me3
(negative) has been shown previously. Nevertheless, going through the exercise of
establishing these correlations from my data, revealed two important facts. Firstly if the
values were plotted individually for each gene the data was much too noisy to reveal any
correlation. Secondly the correlation is much stronger for low mRNA levels than for high
mRNA levels (Fig.6.4). These observations imply that at the level of individual genes
changes in mRNA levels cannot be predicted from changes in histone modification levels
and vice-versa. Indeed when mRNA levels and histone modifications levels were
compared for individual genes the results did not reflect the established correlation.
Out of 1689 genes transcriptionally up-regulated upon priming only 372 also showed
differences in methylation in H3K27me3, (83 up and 289 down), 42 genes in H3K4me3 (7
down, 35 up), 17 for H3K4me2 (2 down, 15 up) and 7 for H3K9me2 (1 down, 6 up). Out of
the 1298 genes down-regulated upon priming, only 288 also showed changes in
H3K27me3 (58 up, 230 down), 18 for H3K4me3 (0 down, 18 up), 13 for H3K4me2 (2
down, 11 up), and finally only 4 for H3K9me2 (1 down, 3 up) (Fig. 6.5). These findings
indicate that at single genes level priming-induced changes in histone modifications were
either largely independent of priming-induced changes in transcription or that the
dynamics of histone modifications and mRNA are quite different and can therefore not be
compared at one single time point only.

Comparative analysis between epigenetic and transcriptional profiles
163
Fig. 6.5 Number and direction of priming induced changes of mRNA and of H3K27me3 (blue), H3K4me3 (red), H3K4me2 (green), H3K9me2 (purple). Arrows indicate the direction of differences between primed (P) and non-primed (control, C) root samples as indicated in the central diagram.
H3K27me3 H3K4me3
RN
A
Methylation
1317
83 289
230 58
1010
586 2014
RN
A
Methylation
C>P
1672
15 2
2 11
1285
354 265
RN
A
Methylation
1647
35 7
0 18
1280
1334 43
H3K4me2 H3K9me2
RN
A
Methylation
1682
6 1
1 3
1294
28 22
RNA P>C
Methylation P>C Methylation C>P
RNA C>P
Methylation C>P AND RNA C>P
Methylation P>C AND RNAC>P
Methylation P>C AND RNA P>C
Methylation C>P AND RNA P>C

Comparative analysis between epigenetic and transcriptional profiles
164
6.2.5 Dynamics of histone methylation H3K27me3 and transcriptional changes
In order to investigate the dynamics between histone modification and transcriptional
changes, selected genes indicated by the ChIP-Seq or RNA-Seq as being changed in
H3K27me3 or mRNA after priming were analysed at additional time points using ChIP-RT
qPCR. Roots from 3 weeks old plants (4L stage) were subjected, as before, to 50 mM NaCl
and samples harvested after 0, 1, 4 and 8 hours. The results are reported in Fig.6.6.
In summary changes in methylation upon stress exposure can be extremely dynamic. This
preliminary kinetic analysis, made from one experiment, show how little we understand
about the exact relationship between histone modifications and gene expression in a
non-steady state. The data indicate that H3K27me3 is indeed negatively correlated with
mRNA for some genes but this correlation is reversed or absent for other genes.

Comparative analysis between epigenetic and transcriptional profiles
165
Histone modification mRNA level
Fig. 6.6 Time course showing changes in H3K27me3 and mRNA during priming treatment. qPCR were performed on ChIP samples to obtain the fold of enrichment relative to input for each time point. qPCR were performed on cDNA samples in order to detect gene expression relative to reference gene RpII. Errors bars are standard errors of technical duplicates of qPCR.
0
3
6
0
0.2
0.4
0h 1h 4h 8h R
ela
tive
me
thyl
atio
n le
vel
Re
lati
ve g
en
e e
xpre
ssio
n
HKT1
0
4
8
0
0.2
0.4
0h 1h 4h 8h
Re
lati
ve m
eth
ylat
ion
leve
l
Re
lati
ve g
en
e e
xpre
ssio
n
PTAC16
0
5
10
0
0.04
0.08
0h 1h 4h 8h
Re
lati
ve m
eth
ylat
ion
leve
l
Re
lati
ve g
en
e e
xpre
ssio
n
LOB
0
2
4
0
0.06
0.12
0h 1h 4h 8h
Re
lati
ve m
eth
ylat
ion
leve
l
Re
lati
ve g
en
e e
xpre
ssio
n
WRKY47
0
10
20
0
0.04
0.08
0h 1h 4h 8h
Re
lati
ve m
eth
ylat
ion
leve
l
Re
lati
ve g
en
e e
xpre
ssio
n
ERF12
0
5
10
0
0.02
0.04
0h 1h 4h 8h
Re
lati
ve m
eth
ylat
ion
leve
l
Re
lati
ve g
en
e e
xpre
ssio
n
TEL1
0
3
6
0
0.15
0.3
0h 1h 4h 8h
Re
lati
ve m
eth
ylat
ion
leve
l
Re
lati
ve g
en
e e
xpre
ssio
n
MYB30
0
3.5
7
0
0.05
0.1
0h 1h 4h 8h
Re
lati
ve m
eth
ylat
ion
leve
l
Re
lati
ve g
en
e e
xpre
ssio
n
HAK5
0
5
10
0
0.004
0.008
0h 1h 4h 8h
Re
lati
ve m
eth
ylat
ion
leve
l
Re
lati
ve g
en
e e
xpre
ssio
n
MYB75

Comparative analysis between epigenetic and transcriptional profiles
166
6.2.6 H3K27me3 differences and transcriptional responses after priming
Finally, I compared the differences in H3K27me3 levels apparent at 10 days after priming
(Chapter 5) with the genes that showed differences in transcriptional responses to the
second salt treatment applied 10 days after priming as detected by the microarray
analysis (see Chapter 4).
After 10 days, 34 genes showed a difference in H3K27me3 between primed and non-
primed samples and also showed a differential response to the second salt treatment. 21
of these responded less to salt in primed plants, while 13 genes responded more strongly.
The complete gene lists are reported in Tab.6.2.
The list includes transcriptional factors such as MYB92, MYB112, WRKY8, electron carriers
(CYP714A1, CYP708A3), oxidoreductase, peroxidase, transporter HAK5, ATCHX17, calcium
ion binding TSA1 (TSK-ASSOCIATING PROTEIN 1); WAK1 (CELL WALL-ASSOCIATED KINASE);
kinase, as well as several unknown proteins. Only four genes showed a decrease in
H3K27me3 and an increase in transcriptional response. Other genes combined higher
H3K27me3 with a lower transcriptional response (9 genes) or had parallel changes (12
genes combined lower H3K27me3 with lower transcriptional response, while 8 genes
combined higher H3K27me3 with a high transcriptional response.

Comparative analysis between epigenetic and transcriptional profiles
167
TAIR ID H3K27me3
day 10 (P/C) Description Response
(P+/P-)/(C+/C-)
AT1G52060 down Function unknown UP
AT1G52070 down jacalin lectin family protein UP
AT1G62510 down protease inhibitor/seed storage/lipid transfer protein (LTP) family protein UP
AT1G33840 down unknown protein UP
AT5G24910 down CYP714A1; electron carrier/ heme binding / iron ion binding / monooxygenase/ oxygen binding UP
AT5G10280 up ATMYB92 (MYB DOMAIN PROTEIN 92); DNA binding / transcription factor UP
AT1G63560 up Function unknown UP
AT4G13420 up HAK5 (HIGH AFFINITY K+ TRANSPORTER 5); potassium ion transmembrane transporter/ potassium:sodium symporter UP
AT2G36690 up oxidoreductase, 2OG-Fe(II) oxygenase family protein UP
AT2G45220 up pectinesterase family protein UP
AT3G49960 up peroxidase, putative UP
AT1G12080 up unknown protein UP
AT1G56660 up unknown protein UP
AT1G62710 up BETA-VPE (BETA VACUOLAR PROCESSING ENZYME); cysteine-type endopeptidase DOWN
AT4G23700 up ATCHX17 (CATION/H+ EXCHANGER 17); monovalent cation:proton antiporter/ sodium:hydrogen antiporter DOWN
AT3G29970 up germination protein-related DOWN
AT2G14960 up GH3.1 DOWN
AT2G23170 up GH3.3; indole-3-acetic acid amido synthetase DOWN
AT5G59070 up glycosyl transferase family 1 protein DOWN
AT5G60250 up zinc finger (C3HC4-type RING finger) family protein DOWN
AT1G21250 up WAK1 (CELL WALL-ASSOCIATED KINASE); kinase DOWN
AT5G13880 up unknown protein DOWN
AT5G53020 down unknown protein DOWN
AT1G78490 down CYP708A3; electron carrier/ heme binding / iron ion binding / monooxygenase/ oxygen binding DOWN
AT4G11170 down disease resistance protein (TIR-NBS-LRR class) DOWN
AT2G36080 down DNA-binding protein, putative DOWN
AT3G29970 down germination protein-related DOWN
AT5G48010 down THAS1 (THALIANOL SYNTHASE 1); catalytic/ thalianol synthase DOWN
AT1G52410 down TSA1 (TSK-ASSOCIATING PROTEIN 1); calcium ion binding / DOWN
AT5G46350 down WRKY8; transcription factor DOWN
AT4G04840 down methionine sulfoxide reductase domain-containing protein / SeIR domain-containing protein DOWN
AT1G48000 down MYB112 (myb domain protein 112); transcription factor DOWN
AT2G22760 down basic helix-loop-helix (bHLH) family protein DOWN
AT5G10180 down AST68; sulfate transmembrane transporter DOWN
Tab. 6.2 List of genes maintained epigenetically different in H3K27me3 10 days after priming which were also differentially responding to salt stress on day 10 after priming.

Comparative analysis between epigenetic and transcriptional profiles
168
6.3 Discussion
6.3.1 Priming induced changes in histone modifications observed immediately after
priming are not a direct reflection of transcriptional changes induced by the treatment
The general correlation between particular histone modifications and transcription
occurring in the steady state is well known: H3K4me3 is positively correlated while
H3K27me3 is negative (Roudier et al., 2009). However, if and how this correlation
changes in case a stress occurs has never been addressed. In order to investigate this
aspect the transcriptional data obtained by RNA-Seq were compared with the islands of
histone methylation occurring within genes (Fig.6.4). Results confirmed the previous
reported overall correlation between H3K4me3 and H3K27me3 levels and gene
expression and showed that the priming treatment does not affect this general
correlation.
However two important results were found:
A strong correlation (i.e. the slope of the curve is not 1) is only observed in
constitutively low expressed genes (approx. a third of total) meaning that only
within these genes changes in the transcription can predict changes in the histone
methylation and vice versa.
By simply plotting the histone methylation level against the transcript level for
each gene no correlation is visible. In order to obtain the shown curves both
values have to be averaged over many ranked genes. This showed that at single
gene level the correlation is not always followed.
The latter point was further exemplified by plotting the direction of changes in H3K4me3
and H3K27me3 against the direction of changes in RNA levels for the same genes
(Fig.6.5). The majority of genes did not lie on the expected lines with a positive or
negative slope respectively. These findings could suggest that at a single gene level the
correlations between histone methylation and transcript level are interrupted by the salt
treatment, i.e. changes at epigenetic and transcriptional level occur independently from
each other. Alternatively, it could be that the dynamics of epigenetic and transcriptional

Comparative analysis between epigenetic and transcriptional profiles
169
processes differ and hence monitoring them at the same time does not account for these
differences, i.e methylation differences take place after transcriptional changes have
occurred.
6.3.1.1 Changes in histone methylation upon stress are dynamic at single gene level
For selected genes ChIP assays coupled with qRT-PCR were performed at different time
points to investigate the dynamic behaviour of gene expression and histone methylation
after application of the priming treatment. It has to be noticed that this method does not
distinguish between transcriptional and post-transcriptional effects on mRNA levels
making it impossible to determine the exact timing of gene activation. In future RNA-Pol II
binding assay should be carried out at loci of interest. The results showed that changes in
histone methylation upon stress are extremely dynamic displaying different temporal
behaviours (Fig.6.6). Clearly, it is not possible to generalize the kinetic of histone
methylation and gene transcription because they are differently correlated depending on
the gene considered. Three possible cases were distinguished. I) Direct correlation at the
same time (i.e. high level of H3K27me3 and low level of transcription at the same time
point). II) No correlation. A lack of correlation does not necessarily exclude the possibility
that histone modifications have a different turnover from the transcripts and the
modification might be placed at a later time point not sampled here. III) Partial
correlation (e.g. high H3K27me3 and low transcript levels at one or more but not all time
points). This indicates that one of the changes may be only transient or follow the other
one in time. Interestingly, in some cases histone methylation preceded transcriptional
changes, while in others the opposite was the case (Fig.6.6).
These results explained, for selected genes, why correlation analysis at one time point in
a non-steady state does not necessarily reveal the expected correlations.
6.3.1.2 Salt responsive genes were preferentially marked with changes in H3K27me3
It was found that priming induced differences in H3K4me3 mostly occurred in expressed
genes (Fig.6.2), however, this value was reduced to half if differentially expressed genes
were considered (Fig.6.3). On the contrary, the percentage of priming induced differences

Comparative analysis between epigenetic and transcriptional profiles
170
in H3K27me3 doubled when the salt differentially expressed genes were considered
(Fig.6.3). This suggests that differentially expressed genes are more likely to have changes
in H3K27me3 suggesting that this modification modulates the transcriptional response to
environmental changes.
6.3.2 Priming-induced changes in H3K27me3 that were maintained for 10 days underlie
the different transcriptional responses of primed plants to a second stress
Initially it was thought that changes in histone modification after 10 days were reflecting
the differential gene expression shown after salt stress in the microarray (Chapter 4).
However, only 34 genes showed differential methylation level of H3K27 between primed
and non-primed plants as well as a differential salt response upon priming (Tab.6.2). Thus
only few modifications are dynamically responding to salt stress, maintained during plant
growth, and perhaps having a direct influence on gene transcription. It is possible that
most of the H3K27me3 marks established by priming are transient and are lost if the
stress does not re-occur within a shorter time period, and the few detected differences
only reflected the end of the memory process. Further experiments should be performed
either waiting fewer days between priming and stress, or applying repeated priming
treatments, to assess whether this could improve the “memorization” process.

Chapter 7: Discussion
7.1 Original hypothesis and experimental observation
At the beginning of this project it was hypothesized that a priming treatment causes
epigenetic changes that modify the chromatin structure (I). These epigenetic changes are
reflected by changes in specific histone residues and make the stress responsive genes
more accessible to transcription factors and to the transcriptional machinery (II). When a
second stress is applied primed plants respond with a greater and faster induction of
stress protective genes (III) and consequently become more salt tolerant (IV) (Fig.7.1).
Fig. 7.1 Schematic representation of the original hypothesis.
Whether and how the experimental evidence obtained in this work supported the original
hypothesis will be discussed in the following paragraphs and summarized in Tab.7.1.
Chromatin more accessible in stress protective genes
Salt stress
I III
Tolerance
II
IV
10 days
Epigeneticchanges
Transcriptional changes
Priming
Higher and faster transcription of stress
protective genes
primed
non-primed Tr
ansc
rip
tio
n

Discussion
172
Does the application of priming lead to increased salt tolerance?
The main aim of this study was to investigate differences in genome wide epigenetic
profiles between primed and non-primed plants. Considering that these profiles
represent the overlay of specific profiles from many different cell types, it was important
to develop a mild priming treatment that did not lead to visible morphological
differences. In addition, roots and shoots were harvested separately and plants were
grown under short day condition in order to delay the transition from vegetative to
reproductive phase during which many epigenetic differences occur. The use of this
optimal experimental procedure allowed us to compare adult plants of the same size,
with similar cell type content but with the priming/stress applications as the only source
of variability. This was very important considering that previous studies demonstrated
that changes in the photoperiod (long day vs short day) or light intensity strongly
influenced the plant stress response (Becker et al., 2006).
During the preliminary assessment of the priming treatments it was found that, when the
second stress was applied, the transcriptional response of two known salt responsive
genes was different depending on which developmental stage the priming treatment was
applied.
Nevertheless, primed plants did not show signs of long term acquired salt tolerance
although in the short term they accumulated less sodium in the shoots. To understand if
priming treatment leads only to transient alleviation of salt stress or can lead to long term
adaptation more accurate physiological analyses are required. These were not the main
focus of the thesis but should be carried out in the future.
It was observed, however, that primed plants coped better with drought stress suggesting
an overlap between the two stress tolerance pathways as previously observed for the
combination of drought and heat stress (Mittler et al., 2004). Therefore, it seems that the
short and mild salt priming prepared plants to perform better upon osmotic stress than
for salt toxicity. Unfortunately our laboratory is not equipped for controlled drought
experiments and it was therefore not possible to carry out quantitative transcriptional
studies on the drying plants. In general, it is difficult to assess fast responses to drought
stress because of the gradual onset of the stress. The transcriptional response was
therefore assessed immediately after a second salt application, representing the ‘osmotic’
phase of salt stress. In the future, transcriptional responses of primed/non-primed plants

Discussion
173
exposed to salt and drought should be carried out over extended time courses. Future
experiments should also compare the effect of priming in Arabidopsis mutants of specific
salt genes to elucidate which signalling pathways are influenced by priming.
Do primed plants have a stronger response to a second stress?
A 10-day period of growth resulting in a 10 times increase of fresh weight was deemed
long enough to revert any transcriptional changes induced by the priming treatment, as
shown by the microarray data, where no changes were detected between control and
primed plants not exposed to the second salt stress. Indeed, microarray analysis showed
differences in transcript levels between primed and non-primed plants only when the
second stress was applied. Against the original expectation, primed plants generally
responded less (less genes and lower transcriptional response) than non-primed plants.
Furthermore, it was found that primed plants accumulated less sodium in the shoots but
not in the roots. It was therefore surprising that less transcriptional activity was detected
in the roots of primed plants as they were less stressed. Nevertheless, a few genes did
actually respond more strongly. These genes belong to diverse functional classes but may
act all together to relieve the stress. This brings about the possibility that primed plants
are channelling their stress response to a specific set of genes that collectively have the
potential to enhance stress tolerance. To investigate this possibility a selection of
salt/drought tolerance Arabidopsis mutants for the genes responding more strongly after
priming should be further investigated.
Does priming lead to epigenetic differences?
Differences at the epigenetic level were detected after priming as originally hypothesized.
Differences were small but robust. The observed differences have to be seen in the
context that epigenetic profiles shape the landscape of a cell/s differentiation. Thus
plants cannot ‘risk’ changing the entire epigenetic profile in response to a mild
environmental perturbation because this leads to severe cell defects. Therefore it is more
likely that either subtle changes occur in a wide range of genes or bigger changes occur in
a precise gene subset in specific cell types. To explore these possibilities further
experiments should be conducted in order to enhance either the spatial resolution using

Discussion
174
cell sorting or micro-dissection, or enhance the time resolution by using different time
points. Another interesting finding was that the epigenetic differences in primed plants
were mainly detected as a reduction of H3K27me3 (where the most changes in number
and amplitude were found) together with an increase in H3K4me3. This suggests that
upon priming there is a pronounced release of silencing in the genes marked by
H3K27me3 and a small increase of genes associated with active marker such as H3K4me3.
Does the epigenetic difference induced by priming lead to differences in gene
transcription?
Very few epigenetic differences that occurred after priming matched the differentially
responding genes after the second stress application. Furthermore, when the differences
detected by ChIP-Seq were compared with the differences detected by RNA-Seq, after
24h of priming, not much correlation was found either. This could indicate that in non-
steady state the changes at the epigenetic level are not necessarily reflected by changes
at the transcriptional level, despite the fact that the overall general correlation between
specific histone modification and transcription was still maintained.
Plants respond to salt stress with very dramatic transcriptional changes, in particular, in
the first phase of the stress when a huge variety of genes have been reported to be
differentially regulated (Killian et al., 2007). However, the genes encoding enzymes
involved in chromatin modification were not found to be differentially regulated upon
stress, indicating that chromatin modification enzymes are likely to be regulated at the
post-transcriptional level.
It could be that the epigenetic response is the first step in preparing a reorganization of
the transcriptional response to a stress. Or, alternatively, the differences in the
transcriptional profile created by a perturbation leads to changes at the epigenetic level.
Analysing both epigenetic and transcriptional changes over a time course as carried out
here, is the first step towards answering these questions and should be carried out more
extensively in the future. However the lack of a relationship between the epigenetic and
the transcriptional changes raises the question if and how the observed epigenetic
differences do actually cause the altered stress response of primed plants.

Discussion
175
Do plants have memory?
The lack of correlation between differences found at the epigenetic level and differences
in transcriptional response to the second stress could indicate that either the two
responses are independent from each other or the epigenetic changes are ‘forgotten’ 10
days after the priming. The second possibility is supported by the fact that very few
epigenetic changes were still detected 10 days after priming both with respect to the
genes that were targeted and to the position within these genes. However, the overall
decrease in H3K27me3 island length produced by the priming treatment was still
apparent after 10 days indicating that the overall effect of the priming treatment on the
epigenetic landscape was maintained. From these results it looks like that the priming
treatment generates initial localised interruptions of silenced islands that are maintained
but are eventually lost over time. It would be interesting to investigate whether repeated
priming treatments enlarge these interruptions. Further experiments using several
administrations of priming before the stress could answer this question.
Future outlook
The identified candidate genes shown to be differentially responsive upon priming
can be now followed by qPCR: further experiments using plants harvested at
different time points after the priming treatment can elucidate for how long the
priming-induced-changes are maintained.
To investigate if the epigenetic changes detected upon priming take place before
the changes in the transcriptional level or vice versa, more extended time course
following candidate genes by coupling ChIP-qPCR and RT-qPCR are needed.
The specific genes responding more strongly to the salt application upon priming
can be further investigated in specific localization and types of cells, e.g. root
epidermis, xylem parenchyma.
Functional mutant analysis of genes responding differentially to stress upon
priming could elucidate the effect of the priming treatment on the plant. In
particular, the use of HKT1 mutants will clarify the role of this gene in the
acquisition of salt tolerance.

Discussion
176
It is not clear if the priming response is lost after 10 days. Further experiments
with repeated priming treatments might further stimulate the “stress memory”
using a selection of specific genes to be followed by ChIP-qPCR.
The specific genes responding more strongly to the salt application upon priming
can be tested using ChIP-qPCR if associated with other histone modifications eg.
acetylation.
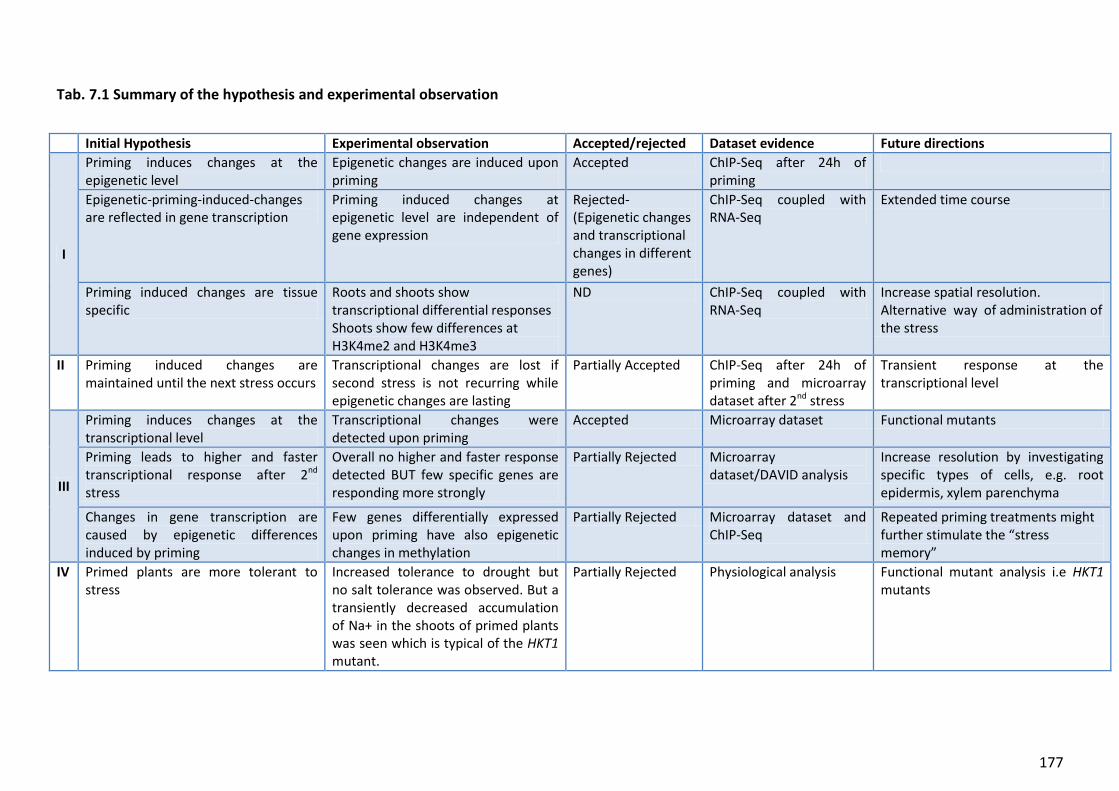
177
Tab. 7.1 Summary of the hypothesis and experimental observation
Initial Hypothesis Experimental observation Accepted/rejected Dataset evidence Future directions
I
Priming induces changes at the epigenetic level
Epigenetic changes are induced upon priming
Accepted ChIP-Seq after 24h of priming
Epigenetic-priming-induced-changes are reflected in gene transcription
Priming induced changes at epigenetic level are independent of gene expression
Rejected- (Epigenetic changes and transcriptional changes in different genes)
ChIP-Seq coupled with RNA-Seq
Extended time course
Priming induced changes are tissue specific
Roots and shoots show transcriptional differential responses Shoots show few differences at H3K4me2 and H3K4me3
ND ChIP-Seq coupled with RNA-Seq
Increase spatial resolution. Alternative way of administration of the stress
II Priming induced changes are maintained until the next stress occurs
Transcriptional changes are lost if second stress is not recurring while epigenetic changes are lasting
Partially Accepted ChIP-Seq after 24h of priming and microarray dataset after 2nd stress
Transient response at the transcriptional level
III
Priming induces changes at the transcriptional level
Transcriptional changes were detected upon priming
Accepted Microarray dataset Functional mutants
Priming leads to higher and faster transcriptional response after 2nd stress
Overall no higher and faster response detected BUT few specific genes are responding more strongly
Partially Rejected Microarray dataset/DAVID analysis
Increase resolution by investigating specific types of cells, e.g. root epidermis, xylem parenchyma
Changes in gene transcription are caused by epigenetic differences induced by priming
Few genes differentially expressed upon priming have also epigenetic changes in methylation
Partially Rejected Microarray dataset and ChIP-Seq
Repeated priming treatments might further stimulate the “stress memory”
IV Primed plants are more tolerant to stress
Increased tolerance to drought but no salt tolerance was observed. But a transiently decreased accumulation of Na+ in the shoots of primed plants was seen which is typical of the HKT1 mutant.
Partially Rejected Physiological analysis Functional mutant analysis i.e HKT1 mutants

Appendix
178
References
Abmayr, S. M., and Workman, J. L. (2012). Holding on through DNA Replication: Histone
Modification or Modifier? Cell 150, 875–877.
Alvarez-Venegas, R., Pien, S., Sadder, M., Witmer, X., Grossniklaus, U., and Avramova, Z.
(2003). ATX-1, an Arabidopsis homolog of trithorax, activates flower homeotic genes.
Current Biology 13, 627–637.
Angel, A., Song, J., Dean, C., and Howard, M. (2011). A Polycomb-based switch underlying
quantitative epigenetic memory. Nature 476, 105–108.
Apse, M. P. (1999). Salt Tolerance Conferred by Overexpression of a Vacuolar Na+/H+
Antiport in Arabidopsis. Science 285, 1256–1258.
Apse, M. P., and Blumwald, E. (2007). Na+ transport in plants. FEBS letters 581, 2247–
2254.
Apse, M. P., Sottosanto, J. B., and Blumwald, E. (2003). Vacuolar cation/H + exchange, ion
homeostasis, and leaf development are altered in a T-DNA insertional mutant of
AtNHX1 , the Arabidopsis vacuolar Na + /H + antiporter. The Plant Journal 36, 229–
239.
Bari, R., and Jones, J. D. G. (2009). Role of plant hormones in plant defence responses.
Plant Molecular Biology 69, 473–488.
Baroux, C., Gagliardini, V., Page, D. R., and Grossniklaus, U. (2006). Dynamic regulatory
interactions of Polycomb group genes: MEDEA autoregulation is required for
imprinted gene expression in Arabidopsis. Genes & development 20, 1081–1086.
Barrett, T., Troup, D. B., Wilhite, S. E., Ledoux, P., Evangelista, C., Kim, I. F., Tomashevsky,
M., Marshall, K. a, Phillippy, K. H., Sherman, P. M., et al. (2011). NCBI GEO: archive
for functional genomics data sets--10 years on. Nucleic acids research 39, D1005–10.

Appendix
179
Becker, B., Holtgrefe, S., Jung, S., Wunrau, C., Kandlbinder, A., Baier, M., Dietz, K.-J.,
Backhausen, J. E., and Scheibe, R. (2006). Influence of the photoperiod on redox
regulation and stress responses in Arabidopsis thaliana L. (Heynh.) plants under long-
and short-day conditions. Planta 224, 380–393.
Beemster, G. T. S., De Veylder, L., Vercruysse, S., West, G., Rombaut, D., Van Hummelen,
P., Galichet, A., Gruissem, W., Inzé, D., and Vuylsteke, M. (2005). Genome-wide
analysis of gene expression profiles associated with cell cycle transitions in growing
organs of Arabidopsis. Plant physiology 138, 734–743.
Berger, S. L. (2007). The complex language of chromatin regulation during transcription.
Nature 447, 407–412.
Bernatavichute, Y. V, Zhang, X., Cokus, S., Pellegrini, M., and Jacobsen, S. E. (2008).
Genome-wide association of histone H3 lysine nine methylation with CHG DNA
methylation in Arabidopsis thaliana. PloS one 3, e3156.
Berthomieu, P., Conéjéro, G., Nublat, A., Brackenbury, W. J., Lambert, C., Savio, C.,
Uozumi, N., Oiki, S., Yamada, K., Cellier, F., et al. (2003). Functional analysis of
AtHKT1 in Arabidopsis shows that Na+ recirculation by the phloem is crucial for salt
tolerance. the The European Molecular Biology Organization Journal 22, 2004–2014.
Boursiac, Y., Chen, S., Luu, D. T., Sorieul, M., Van Den Dries, N., and Maurel, C. (2005).
Early effects of salinity on water transport in Arabidopsis roots. Molecular and
cellular features of aquaporin expression. Plant Physiology 139, 790–805.
Bowler, C., Benvenuto, G., Laflamme, P., Molino, D., Probst, A. V, Tariq, M., and
Paszkowski, J. (2004). Chromatin techniques for plant cells. The Plant journal : for cell
and molecular biology 39, 776–789.
Breitling, R., Armengaud, P., and Amtmann, A. (2005). Vector analysis as a fast and easy
method to compare gene expression responses between different experimental
backgrounds. BMC bioinformatics 6, 181.
Bruce, T. J. A., Matthes, M. C., Napier, J. A., and Pickett, J. A. (2007). Stressful “memories”
of plants: Evidence and possible mechanisms. Plant Science 173, 603–608.

Appendix
180
Brusslan, J. a, Rus Alvarez-Canterbury, A. M., Nair, N. U., Rice, J. C., Hitchler, M. J., and
Pellegrini, M. (2012). Genome-wide evaluation of histone methylation changes
associated with leaf senescence in Arabidopsis. PloS one 7, e33151.
Cantero, a, Barthakur, S., Bushart, T. J., Chou, S., Morgan, R. O., Fernandez, M. P., Clark, G.
B., and Roux, S. J. (2006). Expression profiling of the Arabidopsis annexin gene family
during germination, de-etiolation and abiotic stress. Plant physiology and
biochemistry : PPB / Société française de physiologie végétale 44, 13–24.
Catusse, J., Job, C., and Job, D. (2008). Transcriptome- and proteome-wide analyses of
seed germination. Comptes rendus biologies 331, 815–822.
Cayuela, E., Parra, M., and Caro, M. (2001). NaCl pre-treatment at the seedling stage
enhances fruit yield of tomato plants irrigated with salt water. Plant and Soil, 231–
238.
Cayuela, E., Perez-Alfocea, F., Caro, M., and Bolarin, M. C. (1996). Priming of seeds with
NaCl induces physiological changes in tomato plants grown under salt stress.
Physiologia Plantarum 96, 231–236.
Cellier, F., Conéjéro, G., Ricaud, L., Luu, D. T., Lepetit, M., Gosti, F., and Casse, F. (2004).
Characterization of AtCHX17, a member of the cation/H+ exchangers, CHX family,
from Arabidopsis thaliana suggests a role in K+ homeostasis. The Plant journal : for
cell and molecular biology 39, 834–846.
Chanroj, S., Lu, Y., Padmanaban, S., Nanatani, K., Uozumi, N., Rao, R., and Sze, H. (2011).
Plant-specific cation/H+ exchanger 17 and its homologs are endomembrane K+
transporters with roles in protein sorting. The Journal of biological chemistry 286,
33931–33941.
Charron, J.-B. F., He, H., Elling, A. a, and Deng, X. W. (2009). Dynamic landscapes of four
histone modifications during deetiolation in Arabidopsis. The Plant cell 21, 3732–
3748.

Appendix
181
Chen, L.-T., Luo, M., Wang, Y.-Y., and Wu, K. (2010). Involvement of Arabidopsis histone
deacetylase HDA6 in ABA and salt stress response. Journal of Experimental Botany
61, 3345–3353.
Chen, L.-T., and Wu, K. (2010). Role of histone deacetylases HDA6 and HDA19 in ABA and
abiotic stress response. Plant signaling & behavior 5, 1318–1320.
Chen, Z. J., and Tian, L. (2007). Roles of dynamic and reversible histone acetylation in
plant development and polyploidy. Biochimica et biophysica acta 1769, 295–307.
Chigri, F., Flosdorff, S., Pilz, S., Kölle, E., Dolze, E., Gietl, C., and Vothknecht, U. C. (2012).
The Arabidopsis calmodulin-like proteins AtCML30 and AtCML3 are targeted to
mitochondria and peroxisomes, respectively. Plant molecular biology 78, 211–222.
Chinnusamy, V., Schumaker, K., and Zhu, J.-K. (2004). Molecular genetic perspectives on
cross-talk and specificity in abiotic stress signalling in plants. Journal of experimental
botany 55, 225–236.
Chinnusamy, V., and Zhu, J.-K. (2009). Epigenetic regulation of stress responses in plants.
Current opinion in plant biology 12, 133–139.
Chua, Y. L., Brown, A. P. C., and Gray, J. C. (2001). Targeted Histone Acetylation and
Altered Nuclease Accessibility over Short Regions of the Pea Plastocyanin Gene. The
Plant Cell 13, 599–612.
Chua, Y. L., Watson, L. A., and Gray, J. C. (2003). The transcriptional enhancer of the pea
plastocyanin gene associates with the nuclear matrix and regulates gene expression
through histone acetylation. The Plant Cell 15, 1468–1479.
Conrath, U. (2011). Molecular aspects of defence priming. Trends in plant science 16,
524–531.
Conrath, U., Beckers, G. J. M., Flors, V., García-Agustín, P., Jakab, G., Mauch, F., Newman,
M.-A., Pieterse, C. M. J., Poinssot, B., Pozo, M. J., et al. (2006). Priming: getting ready
for battle. Molecular plant-microbe interactions : MPMI 19, 1062–1071.

Appendix
182
Conrath, U., Thulke, O., Katz, V., Schwindling, S., and Kohler, A. (2001). Priming as a
mechanism in induced systemic resistance of plants. European Journal of Plant
Pathology 107, 113–119.
Corpet, A., and Almouzni, G. (2009). Making copies of chromatin: the challenge of
nucleosomal organization and epigenetic information. Trends in cell biology 19, 29–
41.
Cuartero, J., Bolarín, M. C., Asíns, M. J., and Moreno, V. (2006). Increasing salt tolerance in
the tomato. Journal of experimental botany 57, 1045–1058.
Devoto, A., Nieto-Rostro, M., Xie, D., Ellis, C., Harmston, R., Patrick, E., Davis, J., Sherratt,
L., Coleman, M., and Turner, J. G. (2002). COI1 links jasmonate signalling and fertility
to the SCF ubiquitin-ligase complex in Arabidopsis. The Plant Journal 32, 457–466.
Van Dijk, K., Ding, Y., Malkaram, S., Riethoven, J.-J. M., Liu, R., Yang, J., Laczko, P., Chen,
H., Xia, Y., Ladunga, I., et al. (2010). Dynamic changes in genome-wide histone H3
lysine 4 methylation patterns in response to dehydration stress in Arabidopsis
thaliana. BMC plant biology 10, 238.
Ding, Y., Avramova, Z., and Fromm, M. (2011). The Arabidopsis trithorax-like factor ATX1
functions in dehydration stress responses via ABA-dependent and ABA-independent
pathways. The Plant journal : for cell and molecular biology 66, 735–744.
Earley, K. W., Shook, M. S., Brower-Toland, B., Hicks, L., and Pikaard, C. S. (2007). In vitro
specificities of Arabidopsis co-activator histone acetyltransferases: implications for
histone hyperacetylation in gene activation. The Plant Journal 52, 615–626.
Enami, K., Ichikawa, M., Uemura, T., Kutsuna, N., Hasezawa, S., Nakagawa, T., Nakano, A.,
and Sato, M. H. (2009). Differential expression control and polarized distribution of
plasma membrane-resident SYP1 SNAREs in Arabidopsis thaliana. Plant & cell
physiology 50, 280–289.
Farooq, M., Aziz, T., Basra, S. M. A., Cheema, M. A., and Rehman, H. (2008). Chilling
tolerance in hybrid maize induced by seed priming with salicylic acid. Journal of
Agronomy and Crop Science 194, 161–168.

Appendix
183
Von der Fecht-Bartenbach, J., Bogner, M., Dynowski, M., and Ludewig, U. (2010). CLC-b-
mediated NO-3/H+ exchange across the tonoplast of Arabidopsis vacuoles. Plant &
cell physiology 51, 960–968.
Finch-Savage, W. E., and Leubner-Metzger, G. (2006). Seed dormancy and the control of
germination. New Phytologist 171, 501–523.
Gális, I., Gaquerel, E., Pandey, S. P., and Baldwin, I. T. (2009). Molecular mechanisms
underlying plant memory in JA-mediated defence responses. Plant cell environment
32, 617–627.
Gattolin, S., Sorieul, M., Hunter, P. R., Khonsari, R. H., and Frigerio, L. (2009). In vivo
imaging of the tonoplast intrinsic protein family in Arabidopsis roots. BMC plant
biology 9, 133.
Gaxiola, R. A., Rao, R., Sherman, A., Grisafi, P., Alper, S. L., and Fink, G. R. (1999). The
Arabidopsis thaliana proton transporters, AtNhx1 and Avp1, can function in cation
detoxification in yeast. Proceedings of the National Academy of Sciences of the
United States of America 96, 1480–1485.
Gendrel, A.-V., and Colot, V. (2005). Arabidopsis epigenetics: when RNA meets chromatin.
Current opinion in plant biology 8, 142–147.
Golldack, D., Lüking, I., and Yang, O. (2011). Plant tolerance to drought and salinity: stress
regulating transcription factors and their functional significance in the cellular
transcriptional network. Plant cell reports.
Gong, Q., Li, P., Ma, S., Indu Rupassara, S., and Bohnert, H. J. (2005). Salinity stress
adaptation competence in the extremophile Thellungiella halophila in comparison
with its relative Arabidopsis thaliana. The Plant journal : for cell and molecular
biology 44, 826–839.
Guo, L., Yu, Y., Law, J. a, and Zhang, X. (2010). SET DOMAIN GROUP2 is the major histone
H3 lysine [corrected] 4 trimethyltransferase in Arabidopsis. Proceedings of the
National Academy of Sciences of the United States of America 107, 18557–18562.

Appendix
184
Ha, M., Ng, D. W.-K., Li, W.-H., and Chen, Z. J. (2011). Coordinated histone modifications
are associated with gene expression variation within and between species. Genome
research 21, 590–598.
Halfter, U., Ishitani, M., and Zhu, J. K. (2000). The Arabidopsis SOS2 protein kinase
physically interacts with and is activated by the calcium-binding protein SOS3.
Proceedings of the National Academy of Sciences of the United States of America 97,
3735–3740.
Hamann, T. (2012). Plant cell wall integrity maintenance as an essential component of
biotic stress response mechanisms. Frontiers in plant science 3, 1–5.
Heil, M., and Kost, C. (2006). Priming of indirect defences. Ecology letters 9, 813–817.
Van Hengel, A. J., and Roberts, K. (2003). AtAGP30, an arabinogalactan-protein in the cell
walls of the primary root, plays a role in root regeneration and seed germination.
The Plant Journal 36, 256–270.
Ho, J. W. K., Bishop, E., Karchenko, P. V, Nègre, N., White, K. P., and Park, P. J. (2011).
ChIP-chip versus ChIP-seq: lessons for experimental design and data analysis. BMC
genomics 12, 134.
Hossain, Z., Nouri, M.-Z., and Komatsu, S. (2012). Plant cell organelle proteomics in
response to abiotic stress. Journal of proteome research 11, 37–48.
Hruz, T., Laule, O., Szabo, G., Wessendorp, F., Bleuler, S., Oertle, L., Widmayer, P.,
Gruissem, W., and Zimmermann, P. (2008). Genevestigator V3: A Reference
Expression Database for the Meta-Analysis of Transcriptomes. Advances in
bioinformatics 2008, 420747.
Huang, D. W., Sherman, B. T., and Lempicki, R. A. (2009). Systematic and integrative
analysis of large gene lists using DAVID bioinformatics resources. Nature protocols 4,
44–57.

Appendix
185
Van Hulten, M., Pelser, M., Van Loon, L. C., Pieterse, C. M. J., and Ton, J. (2006). Costs and
benefits of priming for defense in Arabidopsis. Proccedings of the National Academy
of Sciences 103, 5602–5607.
Hussain, K., Nisar, M. F., Majeed, A., Nawaz, K., Bhatti, K. H., Afghan, S., Shahazad, A., and
Zia-ul-Hussnian, S. (2010). What molecular mechanism is adapted by plants during
salt stress tolerance. Afr. J. Biotechnol 9, 416–422.
Ishitani, M., Liu, J., Halfter, U., Kim, C.-S., Shi, W., and Zhu, J.-K. (2000). SOS3 function in
plant salt tolerance requires N-myristoylation and calcium binding. The Plant Cell 12,
1667–1678.
Jacob, Y., Feng, S., LeBlanc, C. a, Bernatavichute, Y. V, Stroud, H., Cokus, S., Johnson, L. M.,
Pellegrini, M., Jacobsen, S. E., and Michaels, S. D. (2009). ATXR5 and ATXR6 are
H3K27 monomethyltransferases required for chromatin structure and gene silencing.
Nature structural & molecular biology 16, 763–768.
Jacobs, J., and Roe, J. L. (2005). SKS6, a multicopper oxidase-like gene, participates in
cotyledon vascular patterning during Arabidopsis thaliana development. Planta 222,
652–666.
Jakab, G., Ton, J., Flors, V., Zimmerli, L., Métraux, J.-P., and Mauch-Mani, B. (2005).
Enhancing Arabidopsis Salt and Drought Stress Tolerance by Chemical Priming for Its
Abscisic Acid Responses1. Plant Physiology 139, 267–274.
Jang, I.-C., Pahk, Y.-M., Song, S. I., Kwon, H. J., Nahm, B. H., and Kim, J.-K. (2003). Structure
and expression of the rice class-I type histone deacetylase genes OsHDAC1-3:
OsHDAC1 overexpression in transgenic plants leads to increased growth rate and
altered architecture. The Plant journal : for cell and molecular biology 33, 531–541.
Jasencakova, Z., Meister, A., and Schubert, I. (2001). Chromatin organization and its
relation to replication and histone acetylation during the cell cycle in barley.
Chromosoma 110, 83–92.

Appendix
186
Jaskiewicz, M., Conrath, U., and Peterhänsel, C. (2011). Chromatin modification acts as a
memory for systemic acquired resistance in the plant stress response. EMBO Reports
12, 50–55.
Jenuwein, T., and Allis, C. D. (2001). Translating the histone code. Science (New York, N.Y.)
293, 1074–1080.
Jiang, Y., and Deyholos, M. K. (2006). Comprehensive transcriptional profiling of NaCl-
stressed Arabidopsis roots reveals novel classes of responsive genes. BMC plant
biology 6, 25.
Johnson, L., Mollah, S., Garcia, B. a, Muratore, T. L., Shabanowitz, J., Hunt, D. F., and
Jacobsen, S. E. (2004). Mass spectrometry analysis of Arabidopsis histone H3 reveals
distinct combinations of post-translational modifications. Nucleic acids research 32,
6511–6518.
Kagale, S., Divi, U. K., Krochko, J. E., Keller, W. a, and Krishna, P. (2007). Brassinosteroid
confers tolerance in Arabidopsis thaliana and Brassica napus to a range of abiotic
stresses. Planta 225, 353–364.
Kilian, J., Whitehead, D., Horak, J., Wanke, D., Weinl, S., Batistic, O., D’Angelo, C.,
Bornberg-Bauer, E., Kudla, J., and Harter, K. (2007). The AtGenExpress global stress
expression data set: protocols, evaluation and model data analysis of UV-B light,
drought and cold stress responses. The Plant Journal 50, 347–363.
Kim, J.-M., To, T. K., Ishida, J., Morosawa, T., Kawashima, M., Matsui, A., Toyoda, T.,
Kimura, H., Shinozaki, K., and Seki, M. (2008). Alterations of lysine modifications on
the histone H3 N-tail under drought stress conditions in Arabidopsis thaliana. Plant &
cell physiology 49, 1580–1588.
Knight, H., Trewavas, A. J., and Knight, M. R. (1997). Calcium signalling in Arabidopsis
thaliana responding to drought and salinity. The Plant journal : for cell and molecular
biology 12, 1067–1078.
Kravchuk, Z., Vicedo, B., Flors, V., Camañes, G., González-Bosch, C., and García-Agustín, P.
(2011). Priming for JA-dependent defenses using hexanoic acid is an effective

Appendix
187
mechanism to protect Arabidopsis against B. cinerea. Journal of Plant Physiology
168, 359–366.
Kreps, J. A., Wu, Y., Chang, H. S., Zhu, T., Wang, X., and Harper, J. F. (2002). Transcriptome
changes for Arabidopsis in response to salt, osmotic, and cold stress. Plant
Physiology 130, 2129–2141.
Kugler, A., Köhler, B., Palme, K., Wolff, P., and Dietrich, P. (2009). Salt-dependent
regulation of a CNG channel subfamily in Arabidopsis. BMC plant biology 9, 140.
Lafos, M., Kroll, P., Hohenstatt, M. L., Thorpe, F. L., Clarenz, O., and Schubert, D. (2011).
Dynamic regulation of H3K27 trimethylation during Arabidopsis differentiation. PLoS
genetics 7, e1002040.
Lallous, Nada; Ramón-Maiques, S. (2011). Chromatin Recognition Protein Modules : The
PHD. Encyclopedia of Life Sciences (ELS)J ohn Wiley & Sons, Ltd: Chichester, 1–14.
Langmead, B., Trapnell, C., Pop, M., and Salzberg, S. L. (2009). Ultrafast and memory-
efficient alignment of short DNA sequences to the human genome. Genome biology
10, R25.
Laohavisit, A., and Davies, J. M. (2011). Annexins. The New phytologist 189, 40–53.
Laohavisit, A., Shang, Z., Rubio, L., Cuin, T. a, Véry, A.-A., Wang, A., Mortimer, J. C.,
Macpherson, N., Coxon, K. M., Battey, N. H., et al. (2012). Arabidopsis annexin1
mediates the radical-activated plasma membrane Ca2+- and K+-permeable
conductance in root cells. The Plant cell 24, 1522–1533.
Li, B., Carey, M., and Workman, J. L. (2007a). The role of chromatin during transcription.
Cell 128, 707–719.
Li, F., Asami, T., Wu, X., Tsang, E. W. T., and Cutler, A. J. (2007b). A putative
hydroxysteroid dehydrogenase involved in regulating plant growth and
development. Plant physiology 145, 87–97.

Appendix
188
Lin, W.-D., Liao, Y.-Y., Yang, T. J. W., Pan, C.-Y., Buckhout, T. J., and Schmidt, W. (2011).
Coexpression-based clustering of Arabidopsis root genes predicts functional modules
in early phosphate deficiency signaling. Plant physiology 155, 1383–1402.
Liu, C., Lu, F., Cui, X., and Cao, X. (2010). Histone methylation in higher plants. Annual
review of plant biology 61, 395–420.
Liu, J., Ishitani, M., Halfter, U., Kim, C. S., and Zhu, J. K. (2000). The Arabidopsis thaliana
SOS2 gene encodes a protein kinase that is required for salt tolerance. Proceedings
of the National Academy of Sciences of the United States of America 97, 3730–3734.
Luo, M., Liu, X., Singh, P., Cui, Y., Zimmerli, L., and Wu, K. (2012a). Chromatin
modifications and remodeling in plant abiotic stress responses. Biochimica et
biophysica acta 1819, 129–136.
Luo, M., Wang, Y.-Y., Liu, X., Yang, S., Lu, Q., Cui, Y., and Wu, K. (2012b). HD2C interacts
with HDA6 and is involved in ABA and salt stress response in Arabidopsis. Journal of
experimental botany 3, 1–10.
Ma, S., Gong, Q., and Bohnert, H. J. (2006). Dissecting salt stress pathways. Journal of
experimental botany 57, 1097–1107.
Maathuis, F. (2001). Sodium uptake in Arabidopsis roots is regulated by cyclic nucleotides.
Plant Physiology 127, 1617–1625.
Mahajan, S., and Tuteja, N. (2005). Cold, salinity and drought stresses: an overview.
Archives of biochemistry and biophysics 444, 139–158.
Mao, X., Jia, D., Li, A., Zhang, H., Tian, S., Zhang, X., Jia, J., and Jing, R. (2011). Transgenic
expression of TaMYB2A confers enhanced tolerance to multiple abiotic stresses in
Arabidopsis. Functional & integrative genomics 11, 445–465.
Mittler, R. (2006). Abiotic stress, the field environment and stress combination. Trends in
plant science 11, 15–19.

Appendix
189
Morant, M., Jørgensen, K., Schaller, H., Pinot, F., Møller, B. L., Werck-Reichhart, D., and
Bak, S. (2007). CYP703 is an ancient cytochrome P450 in land plants catalyzing in-
chain hydroxylation of lauric acid to provide building blocks for sporopollenin
synthesis in pollen. The Plant cell 19, 1473–1487.
Mosher, R. A., Durrant, W. E., Wang, D., Song, J., and Dong, X. (2006). A Comprehensive
Structure – Function Analysis of Arabidopsis SNI1 Defines Essential Regions and
Transcriptional Repressor Activity. 18, 1750–1765.
Munns, R., and Tester, M. (2008). Mechanisms of salinity tolerance. Annual review of
plant biology 59, 651–681. Available at:
http://www.ncbi.nlm.nih.gov/pubmed/18444910 [Accessed June 13, 2011].
Nakajima, K., Furutani, I., Tachimoto, H., Matsubara, H., and Hashimoto, T. (2004).
SPIRAL1 Encodes a Plant-Specific Microtubule-Localized Protein Required for
Directional Control of Rapidly Expanding Arabidopsis Cells. 16, 1178–1190.
Nawaz, A., Amjad, M., Pervez, M. A., and Afzal, I. (2011). Effect of halopriming on
germination and seedling vigor of tomato. African Journal of Agricultural Research 6,
3551–3559.
Negi, J., Matsuda, O., Nagasawa, T., Oba, Y., Takahashi, H., Kawai-Yamada, M., Uchimiya,
H., Hashimoto, M., and Iba, K. (2008). CO2 regulator SLAC1 and its homologues are
essential for anion homeostasis in plant cells. Nature 452, 483–486.
Ng, D., Wang, T., and Chandrasekharan, M. (2007). Plant SET domain-containing proteins:
structure, function and regulation. (BBA)-Gene Structure 1769, 316–329.
Nicol, J. W., Helt, G. A., Blanchard, S. G., Raja, A., and Loraine, A. E. (2009). The Integrated
Genome Browser: free software for distribution and exploration of genome-scale
datasets. Bioinformatics (Oxford, England) 25, 2730–2731.
Nolan, T., Hands, R. E., and Bustin, S. a (2006). Quantification of mRNA using real-time RT-
PCR. Nature protocols 1, 1559–1582.

Appendix
190
Pandey, R., Müller, A., Napoli, C. A., Selinger, D. A., Pikaard, C. S., Richards, E. J., Bender,
J., Mount, D. W., and Jorgensen, R. A. (2002). Analysis of histone acetyltransferase
and histone deacetylase families of Arabidopsis thaliana suggests functional
diversification of chromatin modification among multicellular eukaryotes. Nucleic
Acids Research 30, 5036–5055.
Patade, V. Y., Bhargava, S., and Suprasanna, P. (2009). Halopriming imparts tolerance to
salt and PEG induced drought stress in sugarcane. Agriculture, Ecosystems &
Environment 134, 24–28.
Petruk, S., Sedkov, Y., Johnston, D. M., Hodgson, J. W., Black, K. L., Kovermann, S. K., Beck,
S., Canaani, E., Brock, H. W., and Mazo, A. (2012). TrxG and PcG proteins but not
methylated histones remain associated with DNA through replication. Cell 150, 922–
933.
Pfluger, J., and Wagner, D. (2007). Histone modifications and dynamic regulation of
genome accessibility in plants. Current opinion in plant biology 10, 645–652.
Pien, S., Fleury, D., Mylne, J. S., Crevillen, P., Inzé, D., Avramova, Z., Dean, C., and
Grossniklaus, U. (2008). ARABIDOPSIS TRITHORAX1 dynamically regulates
FLOWERING LOCUS C activation via histone 3 lysine 4 trimethylation. The Plant cell
20, 580–588.
Pontvianne, F., Blevins, T., and Pikaard, C. S. (2010). Arabidopsis Histone Lysine
Methyltransferases. Advances in botanical research 53, 1–22.
Qiu, Q.-S., Barkla, B. J., Vera-Estrella, R., Zhu, J.-K., and Schumaker, K. S. (2003). Na+/H+
Exchange Activity in the Plasma Membrane of Arabidopsis1. Plant Physiology 132,
1041–1052.
Qiu, Q.-S., Guo, Y., Dietrich, M. A., Schumaker, K. S., and Zhu, J.-K. (2002). Regulation of
SOS1, a plasma membrane Na+/H+ exchanger in Arabidopsis thaliana, by SOS2 and
SOS3. Proceedings of the National Academy of Sciences of the United States of
America 99, 8436–8441.

Appendix
191
Quintero, F. J., Blatt, M. R., and Pardo, J. M. (2000). Functional conservation between
yeast and plant endosomal Na(+)/H(+) antiporters. FEBS letters 471, 224–228.
Ringnér, M. (2008). What is principal component analysis ? Nature Biotechnology 26,
303–304.
Rodríguez-Rosales, M. P., Gálvez, F. J., Huertas, R., Aranda, M. N., Baghour, M., Cagnac,
O., and Venema, K. (2009). Plant NHX cation/proton antiporters. Plant signaling &
behavior 4, 265–276.
Rossi, V., Locatelli, S., Varotto, S., Donn, G., Pirona, R., Henderson, D. a, Hartings, H., and
Motto, M. (2007). Maize histone deacetylase hda101 is involved in plant
development, gene transcription, and sequence-specific modulation of histone
modification of genes and repeats. The Plant cell 19, 1145–1162.
Roudier, F., Teixeira, F. K., and Colot, V. (2009). Chromatin indexing in Arabidopsis: an
epigenomic tale of tails and more. Trends in genetics : TIG 25, 511–517.
Rubio, F., Gassmann, W., and Schroeder, J. I. (1995). Sodium-driven potassium uptake by
the plant potassium transporter HKT1 and mutations conferring salt tolerance.
Science (New York, N.Y.) 270, 1660–1663.
Rus, A., Yokoi, S., Sharkhuu, A., Reddy, M., Lee, B., Matsumoto, T. K., Koiwa, H., Zhu, J.-K.,
Bressan, R. A., and Hasegawa, P. M. (2001). AtHKT1 is a salt tolerance determinant
that controls Na(+) entry into plant roots. Proceedings of the National Academy of
Sciences of the United States of America 98, 14150–14155.
Saleh, A., Alvarez-Venegas, R., Yilmaz, M., Le, O., Hou, G., Sadder, M., Al-Abdallat, A., Xia,
Y., Lu, G., Ladunga, I., et al. (2008). The highly similar Arabidopsis homologs of
trithorax ATX1 and ATX2 encode proteins with divergent biochemical functions. The
Plant cell 20, 568–579.
Schachtman, D. P., and Schroeder, J. I. (1994). Structure and transport mechanism of a
high-affinity potassium uptake transporter from higher plants. Nature 370, 655–658.

Appendix
192
Schwember, A. R., and Bradford, K. J. (2010). A genetic locus and gene expression
patterns associated with the priming effect on lettuce seed germination at elevated
temperatures. Plant molecular biology 73, 105–118.
Sedbrook, J. C., Carroll, K. L., Hung, K. F., Masson, P. H., and Somerville, C. R. (2002). The
Arabidopsis SKU5 gene encodes an extracellular glycosyl phosphatidylinositol–
anchored glycoprotein involved in directional root growth. The Plant Cell Online 14,
1635–1648.
Sedghi, M., Nemati, A., and Esmaielpour, B. (2010). Effect of seed priming on germination
and seedling growth of two medicinal plants under salinity. Emirates Journal of Food
and Agriculture 22, 130–139.
Servet, C., Conde e Silva, N., and Zhou, D.-X. (2010). Histone acetyltransferase
AtGCN5/HAG1 is a versatile regulator of developmental and inducible gene
expression in Arabidopsis. Molecular plant 3, 670–677.
Sheldon, C. C., Finnegan, E. J., Dennis, E. S., and Peacock, W. J. (2006). Quantitative effects
of vernalization on FLC and SOC1 expression. The Plant Journal 45, 871–883.
Shi, H., Ishitani, M., Kim, C., and Zhu, J. K. (2000). The Arabidopsis thaliana salt tolerance
gene SOS1 encodes a putative Na+/H+ antiporter. Proceedings of the National
Academy of Sciences of the United States of America 97, 6896–6901.
Shi, H., Quintero, F. J., Pardo, J. M., and Zhu, J.-K. (2002). The putative plasma membrane
Na(+)/H(+) antiporter SOS1 controls long-distance Na(+) transport in plants. The
Plant Cell 14, 465–477.
Shi, H., and Zhu, J.-K. (2002). Regulation of expression of the vacuolar Na+/H+ antiporter
gene AtNHX1 by salt stress and abscisic acid. Plant molecular biology 50, 543–550.
Simon, S. a, and Meyers, B. C. (2011). Small RNA-mediated epigenetic modifications in
plants. Current opinion in plant biology 14, 148–155.
Skirycz, A., Claeys, H., De Bodt, S., Oikawa, A., Shinoda, S., Andriankaja, M., Maleux, K.,
Eloy, N. B., Coppens, F., Yoo, S.-D., et al. (2011). Pause-and-stop: the effects of

Appendix
193
osmotic stress on cell proliferation during early leaf development in Arabidopsis and
a role for ethylene signaling in cell cycle arrest. The Plant cell 23, 1876–1888.
Sokol, A., Kwiatkowska, A., Jerzmanowski, A., and Prymakowska-Bosak, M. (2007). Up-
regulation of stress-inducible genes in tobacco and Arabidopsis cells in response to
abiotic stresses and ABA treatment correlates with dynamic changes in histone H3
and H4 modifications. Planta 227, 245–254.
Steppuhn, H., and Raney, J. (2005). Emergence, height, and yield of canola and barley
grown in saline root zones. Canadian journal of plant science 85, 815–827.
Sunarpi, Horie, T., Motoda, J., Kubo, M., Yang, H., Yoda, K., Horie, R., Chan, W.-Y., Leung,
H.-Y., Hattori, K., et al. (2005). Enhanced salt tolerance mediated by AtHKT1
transporter-induced Na unloading from xylem vessels to xylem parenchyma cells.
The Plant journal : for cell and molecular biology 44, 928–938.
Tamada, Y., Yun, J.-Y., Woo, S. C., and Amasino, R. M. (2009). ARABIDOPSIS TRITHORAX-
RELATED7 Is Required for Methylation of Lysine 4 of Histone H3 and for
Transcriptional Activation of FLOWERING LOCUS C[C][W]. The Plant Cell 21, 3257–
3269.
Tanaka, M., Kikuchi, A., and Kamada, H. (2008). The Arabidopsis histone deacetylases
HDA6 and HDA19 contribute to the repression of embryonic properties after
germination. Plant physiology 146, 149–161.
Tian, L., and Chen, Z. J. (2001). Blocking histone deacetylation in Arabidopsis induces
pleiotropic effects on plant gene regulation and development. Proceedings of the
National Academy of Sciences of the United States of America 98, 200–205.
To, T. K., Nakaminami, K., Kim, J.-M., Morosawa, T., Ishida, J., Tanaka, M., Yokoyama, S.,
Shinozaki, K., and Seki, M. (2011). Arabidopsis HDA6 is required for freezing
tolerance. Biochemical and biophysical research communications 406, 414–419.
Ton, J., Ent, S. Van Der, Hulten, M. Van, and Pozo, M. (2009). Priming as a mechanism
behind induced resistance against pathogens, insects and abiotic stress. IOBC/wprs
Bull 44, 3–13.

Appendix
194
Tracy, F. E., Gilliham, M., Dodd, A. N., Webb, A. A. R., and Tester, M. (2008). NaCl-induced
changes in cytosolic free Ca2+ in Arabidopsis thaliana are heterogeneous and
modified by external ionic composition. Plant, cell & environment 31, 1063–1073.
Tsai, C.-H., Singh, P., Chen, C.-W., Thomas, J., Weber, J., Mauch-Mani, B., and Zimmerli, L.
(2011). Priming for enhanced defence responses by specific inhibition of the
Arabidopsis response to coronatine. The Plant Journal 65, 469–479.
Uozumi, N., Kim, E. J., Rubio, F., Yamaguchi, T., Muto, S., Tsuboi, a, Bakker, E. P.,
Nakamura, T., and Schroeder, J. I. (2000). The Arabidopsis HKT1 gene homolog
mediates inward Na(+) currents in xenopus laevis oocytes and Na(+) uptake in
Saccharomyces cerevisiae. Plant physiology 122, 1249–1259.
Vandesompele, J., De Preter, K., Pattyn, F., Poppe, B., Van Roy, N., De Paepe, A., and
Speleman, F. (2002). Accurate normalization of real-time quantitative RT-PCR data by
geometric averaging of multiple internal control genes. Genome Biology 3,
research0034.1–research0034.11.
Veiseth, S. V, Rahman, M. a, Yap, K. L., Fischer, A., Egge-Jacobsen, W., Reuter, G., Zhou,
M.-M., Aalen, R. B., and Thorstensen, T. (2011). The SUVR4 histone lysine
methyltransferase binds ubiquitin and converts H3K9me1 to H3K9me3 on
transposon chromatin in Arabidopsis. PLoS genetics 7, e1001325.
Vert, G., Grotz, N., Dédaldéchamp, F., Gaymard, F., Guerinot, M. Lou, Briat, J.-F., and
Curie, C. (2002). IRT1, an Arabidopsis transporter essential for iron uptake from the
soil and for plant growth. The Plant cell 14, 1223–1233.
Vicedo, B., Flors, V., and Leyva, M. de la O. (2009). Hexanoic acid-induced resistance
against Botrytis cinerea in tomato plants. Molecular plant- 22, 1455–1465.
Volkov, V., and Amtmann, A. (2006). Thellungiella halophila, a salt-tolerant relative of
Arabidopsis thaliana, has specific root ion-channel features supporting K+/Na+
homeostasis under salinity stress. The Plant journal : for cell and molecular biology
48, 342–353.

Appendix
195
Wang, B., Davenport, R. J., Volkov, V., and Amtmann, A. (2006). Low unidirectional
sodium influx into root cells restricts net sodium accumulation in Thellungiella
halophila, a salt-tolerant relative of Arabidopsis thaliana. Journal of experimental
botany 57, 1161–1170.
Wang, W., Vinocur, B., and Altman, A. (2003). Plant responses to drought, salinity and
extreme temperatures: towards genetic engineering for stress tolerance. Planta 218,
1–14.
Wierzbicki, A. T., Cocklin, R., Mayampurath, A., Lister, R., Rowley, M. J., Gregory, B. D.,
Ecker, J. R., Tang, H., and Pikaard, C. S. (2012). Spatial and functional relationships
among Pol V-associated loci, Pol IV-dependent siRNAs, and cytosine methylation in
the Arabidopsis epigenome. Genes & development 26, 1825–1836.
Winter, D., Vinegar, B., Nahal, H., Ammar, R., Wilson, G. V, and Provart, N. J. (2007). An
“Electronic Fluorescent Pictograph” browser for exploring and analyzing large-scale
biological data sets. PloS one 2, e718.
Wong, C. E., Li, Y., Labbe, A., Guevara, D., Nuin, P., Whitty, B., Diaz, C., Golding, G. B.,
Gray, G. R., Weretilnyk, E. A., et al. (2006). Transcriptional profiling implicates novel
interactions between abiotic stress and hormonal responses in Thellungiella, a close
relative of Arabidopsis. Plant physiology 140, 1437–1450.
Worrall, D., Holroyd, G. H., Moore, J. P., Glowacz, M., Croft, P., Taylor, J. E., Paul, N. D.,
and Roberts, M. R. (2012). Treating seeds with activators of plant defence generates
long-lasting priming of resistance to pests and pathogens. The New phytologist 193,
770–778.
Xu, H., Wei, C.-L., Lin, F., and Sung, W.-K. (2008a). An HMM approach to genome-wide
identification of differential histone modification sites from ChIP-seq data.
Bioinformatics (Oxford, England) 24, 2344–2349.
Xu, L., Zhao, Z., Dong, A., Soubigou-Taconnat, L., Renou, J.-P., Steinmetz, A., and Shen, W.-
H. (2008b). Di- and tri- but not monomethylation on histone H3 lysine 36 marks

Appendix
196
active transcription of genes involved in flowering time regulation and other
processes in Arabidopsis thaliana. Molecular and cellular biology 28, 1348–1360.
Yamaguchi-Shinozaki, K., and Shinozaki, K. (1993). Characterization of the expression of a
desiccation-responsive rd29 gene of Arabidopsis thaliana and analysis of its
promoter in transgenic plants. Molecular general genetics MGG 236, 331–340.
Yokoi, S., Bressan, R. A., and Hasegawa, P. M. (2002a). Salt Stress Tolerance of Plants.
Plant Cell, 25–33.
Yokoi, S., Quintero, F. J., Cubero, B., Ruiz, M. T., Bressan, R. a, Hasegawa, P. M., and
Pardo, J. M. (2002b). Differential expression and function of Arabidopsis thaliana
NHX Na+/H+ antiporters in the salt stress response. The Plant journal : for cell and
molecular biology 30, 529–539.
Yoshiba, Y., Nanjo, T., Miura, S., Yamaguchi-shinozaki, K., and Shinozaki, K. (1999). Stress-
Responsive and Developmental Regulation Gene Expression in Arabidopsis thaliana.
Biochemical and Biophysical Research Communications 772, 766–772.
Yu, C.-W., Liu, X., Luo, M., Chen, C., Lin, X., Tian, G., Lu, Q., Cui, Y., and Wu, K. (2011).
HISTONE DEACETYLASE6 interacts with FLOWERING LOCUS D and regulates
flowering in Arabidopsis. Plant physiology 156, 173–184.
Yuan, L., Loqué, D., Kojima, S., Rauch, S., Ishiyama, K., Inoue, E., Takahashi, H., and Von
Wirén, N. (2007). The organization of high-affinity ammonium uptake in Arabidopsis
roots depends on the spatial arrangement and biochemical properties of AMT1-type
transporters. The Plant cell 19, 2636–2652.
Zang, C., Schones, D. E., Zeng, C., Cui, K., Zhao, K., and Peng, W. (2009). A clustering
approach for identification of enriched domains from histone modification ChIP-Seq
data. Bioinformatics (Oxford, England) 25, 1952–1958.
Zar, J. H. (1999). Biostatistical Analysis 4th ed. Prentice-Hall, ed. (Upper Saddle River, NJ.).
Zeng, L., and Zhou, M. M. (2002). Bromodomain: an acetyl-lysine binding domain. FEBS
Letters 513, 124–128.

Appendix
197
Zhang, K., Sridhar, V. V, Zhu, J., Kapoor, A., and Zhu, J.-K. (2007a). Distinctive Core Histone
Post-Translational Modification Patterns in Arabidopsis thaliana. PLoS ONE 2, 11.
Zhang, X., Bernatavichute, Y. V, Cokus, S., Pellegrini, M., and Jacobsen, S. E. (2009).
Genome-wide analysis of mono-, di- and trimethylation of histone H3 lysine 4 in
Arabidopsis thaliana. Genome biology 10, R62.
Zhang, X., Clarenz, O., Cokus, S., Bernatavichute, Y. V, Pellegrini, M., Goodrich, J., and
Jacobsen, S. E. (2007b). Whole-genome analysis of histone H3 lysine 27
trimethylation in Arabidopsis. PLoS biology 5, e129.
Zhao, J., Barkla, B. J., Marshall, J., Pittman, J. K., and Hirschi, K. D. (2008). The Arabidopsis
cax3 mutants display altered salt tolerance, pH sensitivity and reduced plasma
membrane H+-ATPase activity. Planta 227, 659–669.
Zhou, C., Zhang, L., Duan, J., Miki, B., and Wu, K. (2005). HISTONE DEACETYLASE19 is
involved in jasmonic acid and ethylene signaling of pathogen response in
Arabidopsis. The Plant cell 17, 1196–1204.
Zhou, J., Wang, X., He, K., Charron, J.-B. F., Elling, A. a, and Deng, X. W. (2010). Genome-
wide profiling of histone H3 lysine 9 acetylation and dimethylation in Arabidopsis
reveals correlation between multiple histone marks and gene expression. Plant
molecular biology 72, 585–595.
Zhu, J., Jeong, J. C., Zhu, Y., Sokolchik, I., Miyazaki, S., Zhu, J.-K., Hasegawa, P. M., Bohnert,
H. J., Shi, H., Yun, D.-J., et al. (2008). Involvement of Arabidopsis HOS15 in histone
deacetylation and cold tolerance. Proceedings of the National Academy of Sciences
of the United States of America 105, 4945–4950.
Zhu, J.-K. (2002). Salt and drought stress signal transduction in plants. Annual review of
plant biology 53, 247–273.
Zimmerli, L., Métraux, J. P., and Mauch-Mani, B. (2001). beta-Aminobutyric acid-induced
protection of Arabidopsis against the necrotrophic fungus Botrytis cinerea. Plant
physiology 126, 517–523.

Appendix
198
Appendix I: Primers sequence
Sequence Primer name AGI Feature
GCGTTACTCGTATGCGAGTTG WRKY40-QPCR-F AT1G80840 Downregulated upon priming
Micro
array
AGGGCTGATTTGATCCCTCT WRKY40-QPCR-R
CCGCATCTCGTCGCTCAGAC NAC19-QPCR-F AT1G52890 Downregulated upon priming
CCGTGACTGCTCTCGACTTC NAC19-QPCR-R
GATGGTTGTTCTCCGGTTGT ERF1-QPCR-F AT3G23240 Downregulated upon priming
CTCAAGGTACTGTTCTCCCA ERF1-QPCR-R
CCTCGGTTGTGGTGGATAAT CYP715A1 -QPCR-F AT5G52400 Downregulated upon priming
CCTTCGACCATAACCAAACC CYP715A1 -QPCR-R
GCTGGACGATGGATTCAGTT WRKY30-QPCR-F AT5G24110 Downregulated upon priming
CGGCATTGTTGTACCGACA WRKY30-QPCR-R
GACGACGTTCTCGAGTCGTTG NAC55-QPCR-F AT3G15500 Downregulated upon priming
CCGTCACCGTAACGAATACTC NAC55-QPCR-R
CCTCGAACTTCATTCCCGTTG MYB108-QPCR-F AT3G06490 Downregulated upon priming
GGTTGTGATGCAAGATGACG MYB108-QPCR-R
GGCTCTATTGATGATGGTCACT WRKY46-QPCR-F AT2G46400 Downregulated upon priming
GTGAATCGATGCGTGCATCTG WRKY46-QPCR-R
TGAAGGTCGCTAATGAAGCA JAZ10-QPCR-F AT5G13220 Downregulated upon priming
CTCGAGAAAACGTTGCAGTG JAZ10-QPCR-R
TCCAGTTCATAAGGGGATGC RNA-HSD4-F AT5G50590 Upregulated upon priming
GACTGAGACATCACCGCGTA RNA-HSD4-R
GTTTGGCATTGGAGGTGACT RNA-PHT3-F AT5G43360 Upregulated upon priming
GCTTGAGGAGGCGTTGATAG RNA-PHT3-R
CTGACGTTGTCGCTACTGGA RNA-GMD1-F AT5G66280 Upregulated upon priming
ACCGTAGGCCTCTCGGTAAT RNA-GMD1-R
GTACGTTGAAGATCAAAGGC RNA-TOM7,2-F AT1G64220 Upregulated upon priming
AGGATCTGAGTTCATGCCGAT RNA-TOM7,2-R
TTGGCACATGGACGGTACTA RNA-SKS15-F AT4G37160 Upregulated upon priming
TCTCATCGTTCCAAACACGA RNA-SKS15-R
CTCCGTCCAATGGTTTCATC RNA-AMT1;1-F AT4G13510 Upregulated upon priming
TCAACTGACCAGAACCAGTGAG RNA-AMT1;1-R
TGTGAACCACTGGCCATAAA RNA-SLAH1-F AT1G62280 Upregulated upon priming
CCATCTATGGCGTTCCATCT RNA-SLAH1-R
TTCACCGTGTTCTGTTGGAA RNA-CHX16-F AT1G64170 Upregulated upon priming
GTGATGTTTCTTGCGCTTCA RNA-CHX16-R
TGGCAACTGTTGGTTATGGA RNA-SKOR-F AT3G02850 Upregulated upon priming
CACGGATGTTCCTACCGAGT RNA-SKOR-R
ATAGCTAGCTGATGGGTCAAGTC At4g35800-QPCR-F AT4G35800 Reference gene
qP
CR
refernces gen
es RN
A
GTTTTGAGTGTTTTGAAAAGGATT At4g35800-QPCR-R
TCGTAGTAGAGAGAAATACCAGTGGA At1g56070-QPCR-F AT1G56070 Reference gene
AAGTTTACAGCTGATGAGCTTCG At1g56070-QPCR-R
TCCAGCTAAGGGTGCC EF1-QPCR-F AT5G60390 Reference gene
GGTGGGTACTCGGAGA EF1-QPCR-R
ACTGACCTCTTAGCTCG elF4A-QPCR-F AT3G13920 Reference gene
CAGATCGGCCACGTTC elF4A-QPCR-R
AGTGTCCCTGAGCTAAC TUB9-QPCR-F AT4G20890 Reference gene

Appendix
199
AGTGGGAGCTATATCGC TUB9-QPCR-R
AGGAAGGGATTCCACC UBQ4-QPCR-F AT5G20620 Reference gene
AGTCCGACCATCCTCA UBQ4-QPCR-R
ATCACCCTTGAAGTGGA UBQ10-QPCR-F AT4G05320 Reference gene
GAAACCACCACGAAGAC UBQ10-QPCR-R
GGAGCTAATAGCGGAGCTTG ChipCont1-1F AT1G24560 Positive Control H3K4me3
qP
CR
Referen
ces genes C
hIP
TCCTTCAATGCTTCATCACG ChipCont1-1R
GCACAGAGTTTGGTGGAAGAG ChipCont1-2F AT1G24560 Positive Control H3K4me2
CACCATCCCTCAAACCATTC ChipCont1-2R
ACCAAGTCTAGCATGGGAGAGA ChipCont1-3F AT1G24560 Negative Control me2-3
TCGAGGGTTTGATTTACATGG ChipCont1-3R
TGGCTCTGTTTCACATCTCG ChipCont2-1F AT1G24560 Positive Control H3K4me3
AGATCATGCGAAGGAATGCT ChipCont2-1R
TGAGGCTGGGTAATGCTTCT ChipCont2-2F AT1G24560 Positive Control H3K4me2
AATCGGAATCATCTCCATCG ChipCont2-2R
TGTGAATCCTGGTGTGGAAA ChipCont2-3F AT1G24560 Negative Control me2-3
TGCAGAAGAACACCGCATTA ChipCont2-3R
CATCATCCGCGTCAATCAC H3K9me2 3-1F AT2G05920 Negative Control H3K9me2
GAAACTCAGGAGTACGCG H3K9me2 3-1R
AAGAGAGCTGGCAGAAGCAGTTGA H3K9me2 1-1F AT1G37110 Positive Control K9me2
ACGCCCTTTACCTTGACCTCCTTT H3K9me2 1-1R
TGTGTGGAAGGGTCTTGTGGACTT H3K9me2 2-2F AT4G03745 Positive Control K9me2
AACTTACATGTTTGCGGGCACGAG H3K9me2 2-2R
GGAATCAGAAATTCCAACAGG H3K27me3-1-1F AT5G56900 Negative Control H3K27me3
TTGATGCTCTTCGTGCACTT H3K27me3-1-1R
AAGCAATGCCGTATTGATCC H3K27me3-1-2F AT5G56920 Positive Control H3K27me3
GCTGCACTTCAACAGCTTCA H3K27me3-1-2R
GAGAAGCTAGCAATACGCAACG MYB75-F AT1G56650 24h H3K27me3
qP
CR
Ch
IP
TGCTATTAAAGGTTGTGCATGA MYB75-R
GAATTGTCTACTTATATTGTAC CYP71B14 -F AT5G25180 24h/10d H3K27me3
CCATCATAAATTGTCAACGA CYP71B14 -R
ACTGCTGGCCACCTGGTACT RLP43-F AT3G28890 24h/10d H3K27me3
CTTCATCAATGGGGAAGCTG RLP43-R
ATTCTGCACATCACCAGTGC GA1-F AT4G02780 24h/10d H3K27me3
CTATTCGTTAGGGTACTGTTCG GA1-R
GATGAGTTGTCACTAGGGATCC SHP1 -F AT3G58780 24h/10d H3K27me3
CAATGTTAGACAAAGTCATCCG SHP1 -R
CGATCTTCTAAGCTAGATTTGA AG8-F AT4G18960 24h/10d H3K27me3
CAAATATTCCCACTAATGTTAGTG AG8-R
CCATTTCTTCAGTGGCTAATG SOS5 RH3K4me3-F AT3G46550 ChIP-Seq H3K4me3 me2
TCCAGTCATTACCGGCGGAG SOS5 RH3K4me3-R
CGCCTGATTTCCACAGTCTTG LRP1 RH3K4me3-F AT5G12330 ChIP-Seq H3K4me3 me2
CCACGAAACGCAGTATCTTCAC LRP1 RH3K4me3-R
CCGACCCGTTTCAAGTTACC SCARECROW-LIKE RH3K4me3-F AT5G66770 ChIP-Seq H3K4me3 me2
TCCACCGCCGAAATCAGATA SCARECROW-LIKERH3K4me3-R
GAGAGACCCAAGAGTCCAAGAC MYB30-F AT3G28910 Time-course ChIP qP
CR
Time
cou
rse Ch
IP
CTACTTTAGGTGGTAATGAGTC MYB30-R
AGGCTTCACGAGGAGAATCA WRKY47-F AT4G01720 Time-course ChIP
AGCTAATCTCGGTGCCACAT WRKY47-R

Appendix
200
GCAGGATATGCGACACATGA HAK5-F AT4G13420 Time-course ChIP
TCGGAGGTGTTTTCCTCTGC HAK5-R
CACGGAAACTTGAAATATTTCAT MYB75-F AT1G56650 Time-course ChIP
GACGTTGATCAACTTTGGAGTC MYB75-R
CGGTTCTTGATCGTGTTCATT LOB-F AT2G42440 Time-course ChIP
ACTCTGAATTGGATCAGCACTTG LOB-R
GCTGAGATACGAGATCCTTGG ERF12-F AT1G28360 Time-course ChIP
GGTGGTTGAGGTCGAGAGAG ERF12-R
GTTTCGACCTCAGACGCATT PTAC16-F AT3G46780 Time-course ChIP
AGAGATAGTCAATGGCTGAGA PTAC16-R
GGAAGATCCGAGTTGCAGAG TEL1-F AT3G26120 Time-course ChIP
TATAGCACACGAATCCATGTG TEL1-R
CACTCCCATGGATTGAGGAA HKT1-K27me3-F AT4G10310 Time-course ChIP
TTGTGGAAAGTTTGACAAGCA HKT1-K27me3-R
CCAATACTGGGCTGCTTAGA RNA-MYB30-F AT3G28910 Time-course RNA
qP
CR
Time co
urse R
NA
GATGAGAATCTTGATTGACT RNA-MYB30-R
CAACATGAGGATGTACCTCA RNA-WRKY47-F AT4G01720 Time-course RNA
GCTCTAACGGAAACCCTAGC RNA-WRKY47-R
CTCCGGGATATAGACTTGTCCCT AtHAK5-F AT4G13420 Time-course RNA
GCAATGTTTGCTGATCTAGGTCA AtHAK5-R
GTCCAAGGCATGGAGGATTAACG MYB75-F AT1G56650 Time-course RNA
GGTCGGACCGCAAATGACGTC MYB75-R
CTGAGATACGAGATCCTTGGA ERF12-F AT1G28360 Time-course RNA
CGCAGCGAACCAGAGCTGTTG ERF12-R
GGAGTCACAGTGGACGGTTT PTAC16-F AT3G46780 Time-course RNA
CTTCGGACGTTCTTCTTTCG PTAC16-R
ACCATGGAAGATCCGAGTTG TEL1-F AT3G26120 Time-course RNA
ATCCATGGGGAGATACACGA TEL1-R
TTGGTTGGATCGTTGTTTCA AtHKT1-F AT4G10310 Time-course RNA
CTTTCGGTGATTGAAATGAG AtHKT1-R
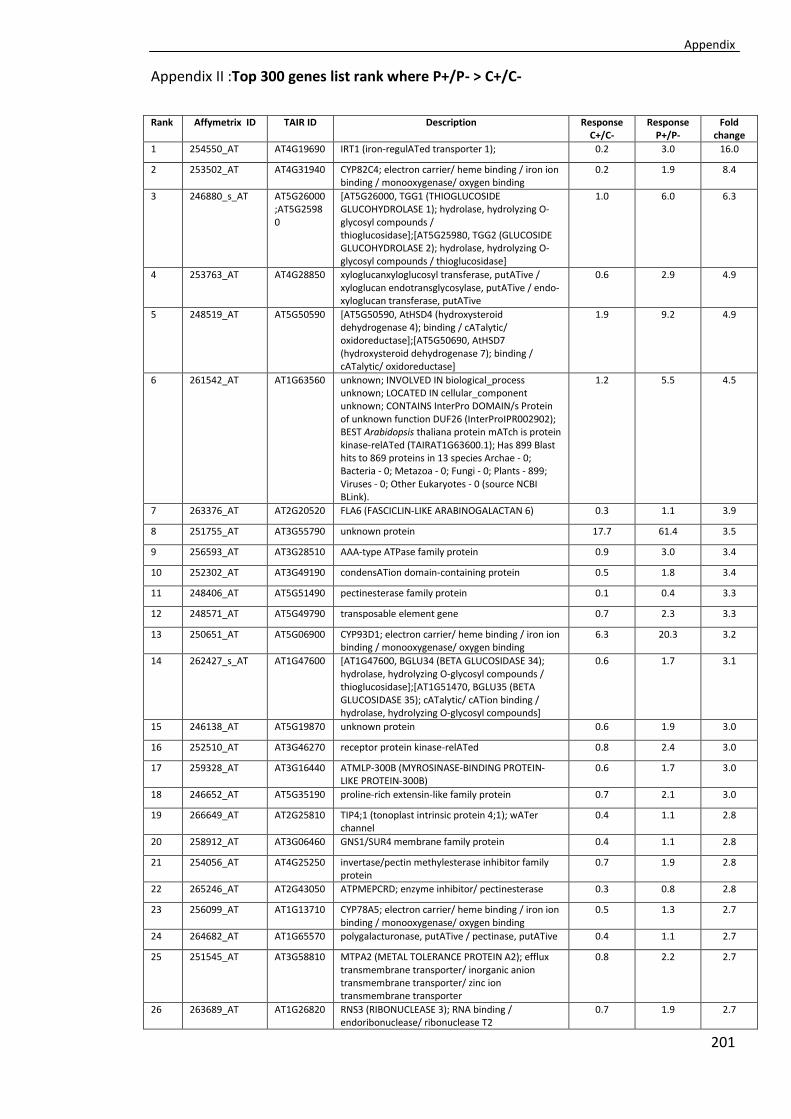
Appendix
201
Appendix II :Top 300 genes list rank where P+/P- > C+/C-
Rank Affymetrix ID TAIR ID Description Response C+/C-
Response P+/P-
Fold change
1 254550_AT AT4G19690 IRT1 (iron-regulATed transporter 1); 0.2 3.0 16.0
2 253502_AT AT4G31940 CYP82C4; electron carrier/ heme binding / iron ion binding / monooxygenase/ oxygen binding
0.2 1.9 8.4
3 246880_s_AT AT5G26000;AT5G25980
[AT5G26000, TGG1 (THIOGLUCOSIDE GLUCOHYDROLASE 1); hydrolase, hydrolyzing O-glycosyl compounds / thioglucosidase];[AT5G25980, TGG2 (GLUCOSIDE GLUCOHYDROLASE 2); hydrolase, hydrolyzing O-glycosyl compounds / thioglucosidase]
1.0 6.0 6.3
4 253763_AT AT4G28850 xyloglucanxyloglucosyl transferase, putATive / xyloglucan endotransglycosylase, putATive / endo-xyloglucan transferase, putATive
0.6 2.9 4.9
5 248519_AT AT5G50590 [AT5G50590, AtHSD4 (hydroxysteroid dehydrogenase 4); binding / cATalytic/ oxidoreductase];[AT5G50690, AtHSD7 (hydroxysteroid dehydrogenase 7); binding / cATalytic/ oxidoreductase]
1.9 9.2 4.9
6 261542_AT AT1G63560 unknown; INVOLVED IN biological_process unknown; LOCATED IN cellular_component unknown; CONTAINS InterPro DOMAIN/s Protein of unknown function DUF26 (InterProIPR002902); BEST Arabidopsis thaliana protein mATch is protein kinase-relATed (TAIRAT1G63600.1); Has 899 Blast hits to 869 proteins in 13 species Archae - 0; Bacteria - 0; Metazoa - 0; Fungi - 0; Plants - 899; Viruses - 0; Other Eukaryotes - 0 (source NCBI BLink).
1.2 5.5 4.5
7 263376_AT AT2G20520 FLA6 (FASCICLIN-LIKE ARABINOGALACTAN 6) 0.3 1.1 3.9
8 251755_AT AT3G55790 unknown protein 17.7 61.4 3.5
9 256593_AT AT3G28510 AAA-type ATPase family protein 0.9 3.0 3.4
10 252302_AT AT3G49190 condensATion domain-containing protein 0.5 1.8 3.4
11 248406_AT AT5G51490 pectinesterase family protein 0.1 0.4 3.3
12 248571_AT AT5G49790 transposable element gene 0.7 2.3 3.3
13 250651_AT AT5G06900 CYP93D1; electron carrier/ heme binding / iron ion binding / monooxygenase/ oxygen binding
6.3 20.3 3.2
14 262427_s_AT AT1G47600 [AT1G47600, BGLU34 (BETA GLUCOSIDASE 34); hydrolase, hydrolyzing O-glycosyl compounds / thioglucosidase];[AT1G51470, BGLU35 (BETA GLUCOSIDASE 35); cATalytic/ cATion binding / hydrolase, hydrolyzing O-glycosyl compounds]
0.6 1.7 3.1
15 246138_AT AT5G19870 unknown protein 0.6 1.9 3.0
16 252510_AT AT3G46270 receptor protein kinase-relATed 0.8 2.4 3.0
17 259328_AT AT3G16440 ATMLP-300B (MYROSINASE-BINDING PROTEIN-LIKE PROTEIN-300B)
0.6 1.7 3.0
18 246652_AT AT5G35190 proline-rich extensin-like family protein 0.7 2.1 3.0
19 266649_AT AT2G25810 TIP4;1 (tonoplast intrinsic protein 4;1); wATer channel
0.4 1.1 2.8
20 258912_AT AT3G06460 GNS1/SUR4 membrane family protein 0.4 1.1 2.8
21 254056_AT AT4G25250 invertase/pectin methylesterase inhibitor family protein
0.7 1.9 2.8
22 265246_AT AT2G43050 ATPMEPCRD; enzyme inhibitor/ pectinesterase 0.3 0.8 2.8
23 256099_AT AT1G13710 CYP78A5; electron carrier/ heme binding / iron ion binding / monooxygenase/ oxygen binding
0.5 1.3 2.7
24 264682_AT AT1G65570 polygalacturonase, putATive / pectinase, putATive 0.4 1.1 2.7
25 251545_AT AT3G58810 MTPA2 (METAL TOLERANCE PROTEIN A2); efflux transmembrane transporter/ inorganic anion transmembrane transporter/ zinc ion transmembrane transporter
0.8 2.2 2.7
26 263689_AT AT1G26820 RNS3 (RIBONUCLEASE 3); RNA binding / endoribonuclease/ ribonuclease T2
0.7 1.9 2.7

Appendix
202
27 251116_AT AT3G63470 scpl40 (serine carboxypeptidase-like 40); serine-type carboxypeptidase
0.2 0.5 2.6
28 254539_s_AT AT4G19750 [AT4G19750, glycosyl hydrolase family 18 protein];[AT4G19760, cATalytic/ cATion binding / chitinase/ hydrolase, hydrolyzing O-glycosyl compounds]
0.4 1.2 2.6
29 252238_AT AT3G49960 peroxidase, putATive 0.8 2.2 2.6
30 260091_AT AT1G73290 scpl5 (serine carboxypeptidase-like 5); serine-type carboxypeptidase
1.5 3.8 2.6
31 249474_s_AT AT5G39160 [AT5G39160, germin-like protein (GLP2a) (GLP5a)];[AT5G39130, germin-like protein, putATive];[AT5G39190, GER2 (GERMIN-LIKE PROTEIN 2); oxalATe oxidase]
1.2 3.1 2.6
32 245697_AT AT5G04200 AtMC9 (metacaspase 9); cysteine-type peptidase 0.8 2.1 2.6
33 265049_AT AT1G52060 FUNCTIONS IN molecular_function unknown; INVOLVED IN biological_process unknown; LOCATED IN endomembrane system; EXPRESSED IN root; CONTAINS InterPro DOMAIN/s Mannose-binding lectin (InterProIPR001229); BEST Arabidopsis thaliana protein mATch is jacalin lectin family protein (TAIRAT1G52070.1); Has 1057 Blast hits to 529 proteins in 40 species Archae - 0; Bacteria - 2; Metazoa - 4; Fungi - 0; Plants - 1048; Viruses - 0; Other Eukaryotes - 3 (source NCBI BLink).
0.5 1.2 2.6
34 267626_AT AT2G42250 CYP712A1; electron carrier/ heme binding / iron ion binding / monooxygenase/ oxygen binding
2.3 5.8 2.5
35 248048_AT AT5G56080 NAS2 (NICOTIANAMINE SYNTHASE 2); nicotianamine synthase
0.4 1.0 2.5
36 256929_AT no_mATch no_mATch 1.7 4.2 2.5
37 263229_s_AT AT1G05660 [AT1G05660, polygalacturonase, putATive / pectinase, putATive];[AT1G05650, polygalacturonase, putATive / pectinase, putATive]
0.9 2.3 2.5
38 258008_AT AT3G19430 lATe embryogenesis abundant protein-relATed / LEA protein-relATed
0.8 2.0 2.5
39 260950_s_AT AT1G06120 [AT1G06120, fATty acid desATurase family protein];[AT1G06090, fATty acid desATurase family protein]
0.6 1.4 2.5
40 245966_AT AT5G19790 RAP2.11 (relATed to AP2 11); DNA binding / transcription factor
0.4 1.0 2.5
41 255075_AT AT4G09110 zinc finger (C3HC4-type RING finger) family protein 0.8 1.8 2.5
42 261550_AT AT1G63450 cATalytic 0.2 0.5 2.5
43 249151_AT AT5G43360 PHT3 (PHOSPHATE TRANSPORTER 3); carbohydrATe transmembrane transporter/ inorganic phosphATe transmembrane transporter/ phosphATe transmembrane transporter/ sugarhydrogen symporter
1.0 2.6 2.5
44 265048_AT AT1G52050 jacalin lectin family protein 0.2 0.6 2.4
45 263941_AT no_mATch no_mATch 0.7 1.8 2.4
46 261562_AT AT1G01750 ADF11 (ACTIN DEPOLYMERIZING FACTOR 11); actin binding
0.4 0.9 2.4
47 257323_AT ATMG01200
hypothetical protein 0.7 1.6 2.4
48 248844_s_AT AT5G46900 [AT5G46900, protease inhibitor/seed storage/lipid transfer protein (LTP) family protein];[AT5G46890, protease inhibitor/seed storage/lipid transfer protein (LTP) family protein]
0.2 0.4 2.4
49 255632_AT AT4G00680 ADF8 (ACTIN DEPOLYMERIZING FACTOR 8); actin binding
0.4 1.0 2.4
50 265050_AT AT1G52070 jacalin lectin family protein 0.6 1.4 2.4
51 253968_AT AT4G26560 CBL7 (CALCINEURIN B-LIKE 7); calcium ion binding 0.9 2.1 2.4
52 250801_AT AT5G04960 pectinesterase family protein 0.4 1.0 2.3
53 247657_AT AT5G59845 gibberellin-regulATed family protein 0.6 1.5 2.3
54 248178_AT AT5G54370 lATe embryogenesis abundant protein-relATed / LEA protein-relATed
1.1 2.6 2.3
55 260758_AT AT1G48930 AtGH9C1 (Arabidopsis thaliana glycosyl hydrolase 0.6 1.4 2.3

Appendix
203
9C1); cATalytic/ hydrolase, hydrolyzing O-glycosyl compounds
56 245967_AT AT5G19800 hydroxyproline-rich glycoprotein family protein 0.3 0.6 2.3
57 253527_AT AT4G31470 pAThogenesis-relATed protein, putATive 0.5 1.1 2.3
58 250778_AT AT5G05500 pollen Ole e 1 allergen and extensin family protein 0.5 1.3 2.3
59 246912_AT AT5G25820 exostosin family protein 0.8 1.9 2.3
60 260970_AT AT1G53640 unknown protein 0.4 0.9 2.3
61 259581_AT AT1G28040 protein binding / zinc ion binding 0.5 1.1 2.3
62 260148_AT AT1G52800 oxidoreductase, 2OG-Fe(II) oxygenase family protein
0.6 1.3 2.3
63 257041_AT no_mATch no_mATch 0.5 1.0 2.3
64 258013_AT AT3G19320 leucine-rich repeAT family protein 1.9 4.3 2.3
65 266978_AT AT2G39430 disease resistance-responsive protein-relATed / dirigent protein-relATed
0.5 1.2 2.3
66 247094_AT AT5G66280 GMD1 (GDP-D-MANNOSE 4,6-DEHYDRATASE 1); GDP-mannose 4,6-dehydrATase/ binding / cATalytic/ coenzyme binding
0.5 1.2 2.3
67 267457_AT AT2G33790 AGP30 (ARABINOGALACTAN PROTEIN30) 0.9 1.9 2.3
68 260867_AT AT1G43790 TED6 (TRACHEARY ELEMENT DIFFERENTIATION-RELATED 6)
0.7 1.5 2.3
69 248904_AT AT5G46295 unknown protein 1.6 3.7 2.3
70 261691_AT AT1G50060 pAThogenesis-relATed protein, putATive 0.8 1.9 2.2
71 248652_AT AT5G49270 SHV2 (SHAVEN 2) 0.3 0.8 2.2
72 255138_AT AT4G08380 proline-rich extensin-like family protein 0.6 1.4 2.2
73 259462_AT AT1G18940 nodulin family protein 0.3 0.6 2.2
74 249934_AT AT5G22410 peroxidase, putATive 0.4 1.0 2.2
75 260957_AT AT1G06080 ADS1 (DELTA 9 DESATURASE 1); oxidoreductase 1.0 2.1 2.2
76 264404_AT AT2G25160 CYP82F1; electron carrier/ heme binding / iron ion binding / monooxygenase/ oxygen binding
0.3 0.7 2.2
77 246067_AT AT5G19410 ABC transporter family protein 3.3 7.3 2.2
78 257607_AT AT3G13880 pentATricopeptide (PPR) repeAT-containing protein
0.5 1.2 2.2
79 267024_s_AT AT2G34390 [AT2G34390, NIP2;1 (NOD26-LIKE INTRINSIC PROTEIN 2;1); lactATe transmembrane transporter/ wATer channel];[AT2G29870, major intrinsic family protein / MIP family protein]
1.1 2.4 2.2
80 258145_AT AT3G18200 nodulin MtN21 family protein 0.8 1.8 2.2
81 260067_AT AT1G73780 protease inhibitor/seed storage/lipid transfer protein (LTP) family protein
0.5 1.0 2.2
82 245677_AT AT1G56660 unknown protein 0.8 1.8 2.2
83 245172_AT AT2G47540 pollen Ole e 1 allergen and extensin family protein 0.6 1.3 2.2
84 263850_AT AT2G04480 unknown protein 0.3 0.7 2.2
85 253998_AT AT4G26010 peroxidase, putATive 0.5 1.1 2.2
86 256684_AT AT3G32040 geranylgeranyl pyrophosphATe synthase, putATive / GGPP synthetase, putATive / farnesyltranstransferase, putATive
0.6 1.4 2.2
87 259525_AT AT1G12560 ATEXPA7 (ARABIDOPSIS THALIANA EXPANSIN A7) 0.7 1.5 2.2
88 261543_AT AT1G63550 LOCATED IN anchored to membrane; EXPRESSED IN flower, root, carpel, leaf; EXPRESSED DURING 4 leaf senescence stage, petal differentiATion and expansion stage; CONTAINS InterPro DOMAIN/s Protein of unknown function DUF26 (InterProIPR002902); BEST Arabidopsis thaliana protein mATch is receptor-like protein kinase-relATed (TAIRAT1G63570.1); Has 4939 Blast hits to 2168 proteins in 204 species Archae - 8; Bacteria - 183; Metazoa - 580; Fungi - 134; Plants - 2707; Viruses - 661; Other Eukaryotes - 666 (source NCBI BLink).
0.6 1.3 2.1

Appendix
204
89 250832_AT AT5G04950 NAS1 (NICOTIANAMINE SYNTHASE 1); nicotianamine synthase
0.5 1.0 2.1
90 267287_AT AT2G23630 sks16 (SKU5 Similar 16); copper ion binding / pectinesterase
0.5 1.1 2.1
91 266191_AT AT2G39040 peroxidase, putATive 1.1 2.3 2.1
92 255432_AT AT4G03330 SYP123 (SYNTAXIN OF PLANTS 123); SNAP receptor 0.3 0.7 2.1
93 245412_AT AT4G17280 INVOLVED IN multicellular organismal development; LOCATED IN membrane; EXPRESSED IN 11 plant structures; EXPRESSED DURING 6 growth stages; CONTAINS InterPro DOMAIN/s Uncharacterised conserved protein UCP037471 (InterProIPR017214), Protein of unknown function DUF568, DOMON-like (InterProIPR007613), DOMON relATed (InterProIPR005018), Cytochrome b561/ferric reductase transmembrane (InterProIPR006593); BEST Arabidopsis thaliana protein mATch is auxin-responsive protein, putATive (TAIRAT5G47530.1); Has 203 Blast hits to 203 proteins in 14 species Archae - 0; Bacteria - 0; Metazoa - 0; Fungi - 0; Plants - 203; Viruses - 0; Other Eukaryotes - 0 (source NCBI BLink).
1.6 3.4 2.1
94 244960_AT ATCG01020 encodes a chloroplast ribosomal protein L32, a constituent of the large subunit of the ribosomal complex
0.6 1.2 2.1
95 248324_AT no_mATch no_mATch 0.3 0.7 2.1
96 250802_AT AT5G04970 pectinesterase, putATive 0.9 1.9 2.1
97 256970_AT AT3G21090 ABC transporter family protein 0.7 1.5 2.1
98 253696_AT AT4G29740 CKX4 (CYTOKININ OXIDASE 4); amine oxidase/ cytokinin dehydrogenase
0.8 1.7 2.1
99 265102_AT AT1G30870 cATionic peroxidase, putATive 0.7 1.4 2.1
100 264391_AT AT1G11920 pectATe lyase family protein 0.9 1.9 2.1
101 259291_AT AT3G11550 integral membrane family protein 0.5 1.0 2.1
102 251953_AT AT3G53668 [AT3G53668, CPuORF51 (Conserved peptide upstream open reading frame 51)];[AT3G53670, unknown protein]
0.3 0.6 2.1
103 256141_AT AT1G48640 lysine and histidine specific transporter, putATive 0.4 0.8 2.1
104 246302_AT AT3G51860 CAX3 (CATION EXCHANGER 3); calciumcATion antiporter/ calciumhydrogen antiporter/ cATioncATion antiporter
4.5 9.4 2.1
105 253870_AT AT4G27530 unknown protein 2.0 4.2 2.1
106 259222_AT AT3G03680 C2 domain-containing protein 0.4 0.9 2.1
107 261099_AT AT1G62980 ATEXPA18 (ARABIDOPSIS THALIANA EXPANSIN A18)
0.6 1.1 2.1
108 258080_AT AT3G25930 universal stress protein (USP) family protein 0.4 0.9 2.1
109 246403_AT AT1G57590 carboxylesterase 0.5 1.1 2.1
110 265111_AT AT1G62510 protease inhibitor/seed storage/lipid transfer protein (LTP) family protein
0.2 0.5 2.0
111 250717_AT AT5G06200 integral membrane family protein 0.6 1.1 2.0
112 251315_AT AT3G61410 FUNCTIONS IN molecular_function unknown; INVOLVED IN biological_process unknown; LOCATED IN cellular_component unknown; BEST Arabidopsis thaliana protein mATch is protein kinase family protein / U-box domain-containing protein (TAIRAT2G45910.1); Has 146 Blast hits to 144 proteins in 9 species Archae - 0; Bacteria - 0; Metazoa - 13; Fungi - 0; Plants - 132; Viruses - 0; Other Eukaryotes - 1 (source NCBI BLink).
0.8 1.5 2.0
113 264998_AT AT1G67330 unknown protein 0.4 0.7 2.0
114 249779_AT AT5G24230 LOCATED IN cellular_component unknown; EXPRESSED IN root; BEST Arabidopsis thaliana protein mATch is triacylglycerol lipase (TAIRAT5G24200.1); Has 125 Blast hits to 125 proteins in 14 species Archae - 0; Bacteria - 0;
0.7 1.3 2.0

Appendix
205
Metazoa - 3; Fungi - 7; Plants - 115; Viruses - 0; Other Eukaryotes - 0 (source NCBI BLink).
115 250205_AT AT5G14020 INVOLVED IN N-terminal protein myristoylATion; LOCATED IN vacuole; EXPRESSED IN root; CONTAINS InterPro DOMAIN/s BRO1 (InterProIPR004328); BEST Arabidopsis thaliana protein mATch is unknown protein (TAIRAT1G73390.3); Has 53 Blast hits to 53 proteins in 7 species Archae - 0; Bacteria - 0; Metazoa - 0; Fungi - 0; Plants - 53; Viruses - 0; Other Eukaryotes - 0 (source NCBI BLink).
0.1 0.3 2.0
116 248941_s_AT AT5G45460 [AT5G45460, unknown protein];[AT5G45470, unknown protein]
0.5 1.0 2.0
117 250958_AT AT5G03260 LAC11 (laccase 11); laccase 0.9 1.8 2.0
118 245262_AT AT4G16563 aspartyl protease family protein 0.2 0.4 2.0
119 262017_AT AT1G35550 elongATion factor Tu C-terminal domain-containing protein
0.6 1.3 2.0
120 255105_AT AT4G08620 SULTR1;1 (SULPHATE TRANSPORTER 1;1); sulfATe transmembrane transporter
0.3 0.5 2.0
121 259720_AT AT1G61080 proline-rich family protein 0.6 1.1 2.0
122 246530_AT AT5G15725 unknown protein 0.3 0.5 2.0
123 264287_AT AT1G61930 unknown protein 2.0 4.0 2.0
124 255005_AT AT4G09990 unknown protein 0.5 1.0 2.0
125 254404_AT AT4G21340 B70; transcription factor 1.3 2.5 2.0
126 249037_AT AT5G44130 FLA13 (FASCICLIN-LIKE ARABINOGALACTAN PROTEIN 13 PRECURSOR)
0.0 0.1 2.0
127 245875_AT AT1G26240 proline-rich extensin-like family protein 1.6 3.2 2.0
128 254324_AT AT4G22640 FUNCTIONS IN molecular_function unknown; INVOLVED IN biological_process unknown; LOCATED IN anchored to membrane; EXPRESSED IN male gametophyte, root; CONTAINS InterPro DOMAIN/s Bifunctional inhibitor/plant lipid transfer protein/seed storage (InterProIPR016140); BEST Arabidopsis thaliana protein mATch is unknown protein (TAIRAT4G22666.2); Has 19 Blast hits to 19 proteins in 1 species Archae - 0; Bacteria - 0; Metazoa - 0; Fungi - 0; Plants - 19; Viruses - 0; Other Eukaryotes - 0 (source NCBI BLink).
1.6 3.1 2.0
129 259120_AT AT3G02240 unknown protein 0.8 1.5 2.0
130 255814_AT AT1G19900 glyoxal oxidase-relATed 0.6 1.2 2.0
131 248898_AT AT5G46370 KCO2 (CA2+ ACTIVATED OUTWARD RECTIFYING K+ CHANNEL 2); calcium ion binding / outward rectifier potassium channel
0.6 1.2 2.0
132 253914_AT AT4G27400 lATe embryogenesis abundant protein-relATed / LEA protein-relATed
0.8 1.5 2.0
133 265764_AT AT2G48060 unknown protein 0.9 1.7 2.0
134 257473_AT AT1G33840 unknown protein 0.4 0.8 2.0
135 248636_AT no_mATch no_mATch 0.3 0.7 2.0
136 254977_s_AT AT4G10520 [AT4G10520, subtilase family protein];[AT4G10530, subtilase family protein]
1.5 3.0 2.0
137 256097_AT AT1G13670 unknown protein 0.5 1.0 2.0
138 247871_AT AT5G57530 xyloglucanxyloglucosyl transferase, putATive / xyloglucan endotransglycosylase, putATive / endo-xyloglucan transferase, putATive
1.1 2.1 2.0
139 267343_AT AT2G44260 unknown protein 0.6 1.3 1.9
140 254338_s_AT AT4G22080 [AT4G22080, pectATe lyase family protein];[AT4G22090, pectATe lyase family protein]
0.4 0.9 1.9
141 260558_AT AT2G43600 glycoside hydrolase family 19 protein 1.1 2.1 1.9
142 250855_AT AT5G04730 unknown protein 0.3 0.6 1.9
143 247091_AT AT5G66390 peroxidase 72 (PER72) (P72) (PRXR8) 2.6 5.0 1.9

Appendix
206
144 266941_AT AT2G18980 peroxidase, putATive 0.4 0.7 1.9
145 259345_s_AT AT3G03700 [AT3G03700, unknown protein];[AT3G04440, unknown protein]
1.0 1.9 1.9
146 248577_AT AT5G49870 jacalin lectin family protein 0.4 0.8 1.9
147 252152_AT no_mATch no_mATch 1.1 2.1 1.9
148 260754_AT AT1G49000 unknown protein 3.3 6.4 1.9
149 246969_AT AT5G24880 INVOLVED IN biological_process unknown; LOCATED IN cellular_component unknown; EXPRESSED IN 8 plant structures; EXPRESSED DURING L mATure pollen stage, M germinATed pollen stage, 4 anthesis, petal differentiATion and expansion stage; BEST Arabidopsis thaliana protein mATch is calmodulin-binding protein-relATed (TAIRAT5G10660.1); Has 195834 Blast hits to 92446 proteins in 2480 species Archae - 1007; Bacteria - 19200; Metazoa - 85171; Fungi - 18359; Plants - 7291; Viruses - 1072; Other Eukaryotes - 63734 (source NCBI BLink).
0.5 1.0 1.9
150 254587_AT no_mATch no_mATch 0.5 1.0 1.9
151 255528_AT AT4G02090 unknown protein 0.9 1.7 1.9
152 254013_AT AT4G26050 leucine-rich repeAT family protein 0.8 1.6 1.9
153 265645_AT AT2G27370 integral membrane family protein 0.6 1.1 1.9
154 251434_AT AT3G59850 polygalacturonase, putATive / pectinase, putATive 1.2 2.3 1.9
155 260122_AT AT1G33900 avirulence-responsive protein, putATive / avirulence induced gene protein, putATive / AIG protein, putATive
0.3 0.5 1.9
156 254093_AT AT4G25110 AtMC2 (metacaspase 2); cysteine-type endopeptidase
0.6 1.2 1.9
157 246229_AT AT4G37160 sks15 (SKU5 Similar 15); copper ion binding / oxidoreductase
1.2 2.4 1.9
158 252046_AT AT3G52460 hydroxyproline-rich glycoprotein family protein 0.3 0.6 1.9
159 255377_AT AT4G03500 ankyrin repeAT family protein 1.0 1.8 1.9
160 263316_s_AT AT2G24710 [AT2G24710, ATGLR2.3; intracellular ligand-gATed ion channel];[AT2G24720, ATGLR2.2; intracellular ligand-gATed ion channel]
0.3 0.5 1.9
161 254978_AT AT4G10540 subtilase family protein 2.3 4.4 1.9
162 254718_AT AT4G13580 disease resistance-responsive family protein 0.6 1.2 1.9
163 245553_AT AT4G15370 BARS1 (BARUOL SYNTHASE 1); baruol synthase/ cATalytic
0.5 0.9 1.9
164 262978_AT AT1G75780 TUB1; GTP binding / GTPase/ structural molecule 0.4 0.8 1.9
165 251677_AT AT3G56980 BHLH039; DNA binding / transcription factor 0.8 1.4 1.9
166 248408_AT AT5G51520 invertase/pectin methylesterase inhibitor family protein
1.7 3.3 1.9
167 253004_AT AT4G38280 [AT4G38280, unknown protein];[AT4G38330, FUNCTIONS IN molecular_function unknown; INVOLVED IN biological_process unknown; LOCATED IN integral to membrane; EXPRESSED IN male gametophyte, pollen tube; EXPRESSED DURING L mATure pollen stage, M germinATed pollen stage; CONTAINS InterPro DOMAIN/s Hly-III relATed (InterProIPR004254); BEST Arabidopsis thaliana protein mATch is unknown protein (TAIRAT4G38290.1); Has 8 Blast hits to 8 proteins in 1 species Archae - 0; Bacteria - 0; Metazoa - 0; Fungi - 0; Plants - 8; Viruses - 0; Other Eukaryotes - 0 (source NCBI BLink).];[AT2G45250, unknown protein]
0.6 1.1 1.9
168 263560_s_AT AT2G15350 [AT2G15350, FUT10 (FUCOSYLTRANSFERASE 10); fucosyltransferase/ transferase, transferring glycosyl groups];[AT2G15370, FUT5; fucosyltransferase/ transferase, transferring glycosyl groups]
0.6 1.1 1.9
169 247895_AT AT5G58010 basic helix-loop-helix (bHLH) family protein 0.9 1.7 1.9

Appendix
207
170 252098_AT AT3G51330 aspartyl protease family protein 0.7 1.4 1.9
171 250576_AT AT5G08250 cytochrome P450 family protein 4.6 8.6 1.9
172 253309_AT AT4G33790 CER4 (ECERIFERUM 4); fATty acyl-CoA reductase (alcohol-forming)/ oxidoreductase, acting on the CH-CH group of donors
0.5 1.0 1.9
173 254025_AT AT4G25790 allergen V5/Tpx-1-relATed family protein 0.3 0.6 1.9
174 264842_AT AT1G03700 FUNCTIONS IN molecular_function unknown; INVOLVED IN biological_process unknown; LOCATED IN endomembrane system; EXPRESSED IN hypocotyl, flower; EXPRESSED DURING petal differentiATion and expansion stage; CONTAINS InterPro DOMAIN/s Uncharacterised protein family UPF0497, trans-membrane plant (InterProIPR006702), Uncharacterised protein family UPF0497, trans-membrane plant subgroup (InterProIPR006459); BEST Arabidopsis thaliana protein mATch is integral membrane family protein (TAIRAT4G03540.1); Has 260 Blast hits to 260 proteins in 13 species Archae - 0; Bacteria - 0; Metazoa - 0; Fungi - 0; Plants - 260; Viruses - 0; Other Eukaryotes - 0 (source NCBI BLink).
3.9 7.3 1.9
175 257184_AT AT3G13090 ATMRP8; ATPase, coupled to transmembrane movement of substances
1.0 1.9 1.9
176 251143_AT AT5G01220 SQD2 (sulfoquinovosyldiacylglycerol 2); UDP-glycosyltransferase/ UDP-sulfoquinovoseDAG sulfoquinovosyltransferase/ transferase, transferring glycosyl groups
0.5 0.9 1.9
177 254092_AT AT4G25090 respirATory burst oxidase, putATive / NADPH oxidase, putATive
0.6 1.0 1.9
178 254743_AT AT4G13420 HAK5 (HIGH AFFINITY K+ TRANSPORTER 5); potassium ion transmembrane transporter/ potassiumsodium symporter
7.3 13.7 1.9
179 265852_AT AT2G42350 zinc finger (C3HC4-type RING finger) family protein 1.0 1.8 1.9
180 250683_x_AT AT5G06640 proline-rich extensin-like family protein 0.3 0.6 1.9
181 262168_AT AT1G74730 unknown protein 0.9 1.6 1.9
182 263338_AT AT2G05000 transposable element gene 1.1 2.1 1.9
183 249847_AT AT5G23210 SCPL34; serine-type carboxypeptidase 0.3 0.6 1.9
184 255127_AT AT4G08300 nodulin MtN21 family protein 0.1 0.2 1.9
185 258359_s_AT AT3G14415 [AT3G14415, (S)-2-hydroxy-acid oxidase, peroxisomal, putATive / glycolATe oxidase, putATive / short chain alpha-hydroxy acid oxidase, putATive];[AT3G14420, (S)-2-hydroxy-acid oxidase, peroxisomal, putATive / glycolATe oxidase, putATive / short chain alpha-hydroxy acid oxidase, putATive]
0.1 0.3 1.9
186 245036_AT AT2G26410 Iqd4 (IQ-domain 4); calmodulin binding 0.9 1.7 1.8
187 257720_AT AT3G18450 unknown protein 0.2 0.3 1.8
188 259351_AT AT3G05150 sugar transporter family protein 0.2 0.5 1.8
189 257405_AT AT1G24620 polcalcin, putATive / calcium-binding pollen allergen, putATive
0.5 1.0 1.8
190 245318_AT AT4G16980 arabinogalactan-protein family 0.7 1.4 1.8
191 261203_AT AT1G12845 unknown protein 1.7 3.0 1.8
192 255140_x_AT AT4G08410 proline-rich extensin-like family protein 0.4 0.8 1.8
193 263571_AT AT2G17050 disease resistance protein (TIR-NBS-LRR class), putATive
1.0 1.8 1.8
194 264988_AT AT1G27140 ATGSTU14 (ARABIDOPSIS THALIANA GLUTATHIONE S-TRANSFERASE TAU 14); glutAThione transferase
0.4 0.7 1.8
195 255659_AT AT4G00895 ATP synthase delta chain-relATed 0.8 1.5 1.8
196 246798_AT AT5G26930 zinc finger (GATA type) family protein 0.9 1.6 1.8
197 251857_AT AT3G54770 RNA recognition motif (RRM)-containing protein 0.5 0.8 1.8
198 263227_AT AT1G30750 unknown protein 0.7 1.3 1.8
199 257679_AT AT3G20470 GRP5 (GLYCINE-RICH PROTEIN 5); structural 0.5 0.9 1.8

Appendix
208
constituent of cell wall
200 262217_AT AT1G74770 protein binding / zinc ion binding 0.6 1.0 1.8
201 257143_AT AT3G20110 CYP705A20; electron carrier/ heme binding / iron ion binding / monooxygenase/ oxygen binding
0.3 0.6 1.8
202 252222_AT AT3G49845 FUNCTIONS IN molecular_function unknown; INVOLVED IN biological_process unknown; LOCATED IN cellular_component unknown; EXPRESSED IN root; CONTAINS InterPro DOMAIN/s XYPPX repeAT (InterProIPR006031); Has 14038 Blast hits to 7746 proteins in 541 species Archae - 8; Bacteria - 1083; Metazoa - 5225; Fungi - 1793; Plants - 3748; Viruses - 424; Other Eukaryotes - 1757 (source NCBI BLink).
0.8 1.4 1.8
203 252183_AT AT3G50740 UGT72E1 (UDP-glucosyl transferase 72E1); UDP-glycosyltransferase/ coniferyl-alcohol glucosyltransferase/ transferase, transferring glycosyl groups
1.1 1.9 1.8
204 245574_AT AT4G14750 IQD19 (IQ-domain 19); calmodulin binding 0.4 0.8 1.8
205 254774_AT AT4G13440 calcium-binding EF hand family protein 0.7 1.3 1.8
206 262212_AT AT1G74890 ARR15 (RESPONSE REGULATOR 15); transcription regulATor/ two-component response regulATor
0.6 1.1 1.8
207 245510_AT AT4G15740 C2 domain-containing protein 0.5 0.9 1.8
208 264884_AT AT1G61170 unknown protein 0.5 1.0 1.8
209 258955_s_AT AT3G18530 [AT3G18530, binding];[AT3G01450, binding] 0.7 1.3 1.8
210 255548_AT AT4G01930 DC1 domain-containing protein 0.7 1.2 1.8
211 245546_AT AT4G15290 ATCSLB05; cellulose synthase/ transferase/ transferase, transferring glycosyl groups
0.4 0.7 1.8
212 245012_AT ATCG00440 Encodes NADH dehydrogenase D3 subunit of the chloroplast NAD(P)H dehydrogenase complex
0.5 0.9 1.8
213 258920_AT AT3G10520 AHB2 (ARABIDOPSIS HAEMOGLOBIN 2); oxygen transporter
0.6 1.0 1.8
214 262097_AT AT1G55990 glycine-rich protein 1.8 3.2 1.8
215 260567_AT AT2G43820 UGT74F2 (UDP-GLUCOSYLTRANSFERASE 74F2); UDP-glucose4-aminobenzoATe acylglucosyltransferase/ UDP-glucosyltransferase/ UDP-glycosyltransferase/ transferase, transferring glycosyl groups / transferase, transferring hexosyl groups
0.7 1.2 1.8
216 260623_AT AT1G08090 ATNRT21 (NITRATE TRANSPORTER 21); nitrATe transmembrane transporter
1.0 1.7 1.8
217 244969_AT ATCG00650 chloroplast-encoded ribosomal protein S18 0.7 1.3 1.8
218 260298_AT AT1G80320 oxidoreductase, 2OG-Fe(II) oxygenase family protein
7.5 13.3 1.8
219 254313_AT AT4G22460 protease inhibitor/seed storage/lipid transfer protein (LTP) family protein
0.1 0.1 1.8
220 263437_AT AT2G28670 disease resistance-responsive family protein / fibroin-relATed
0.8 1.4 1.8
221 250173_AT AT5G14340 AtMYB40 (myb domain protein 40); DNA binding / transcription factor
0.3 0.5 1.8
222 264567_s_AT AT1G05250 [AT1G05250, peroxidase, putATive];[AT1G05240, peroxidase, putATive]
0.3 0.6 1.8
223 265031_AT AT1G61590 protein kinase, putATive 0.9 1.7 1.8
224 254648_AT AT4G18550 lipase class 3 family protein 0.6 1.1 1.8
225 259481_AT AT1G18970 GLP4 (GERMIN-LIKE PROTEIN 4); manganese ion binding / nutrient reservoir
2.7 4.8 1.8
226 254820_s_AT AT4G12510 [AT4G12510, protease inhibitor/seed storage/lipid transfer protein (LTP) family protein];[AT4G12520, protease inhibitor/seed storage/lipid transfer protein (LTP) family protein]
0.3 0.5 1.8
227 260733_AT AT1G17640 RNA recognition motif (RRM)-containing protein 0.7 1.2 1.8
228 253613_AT AT4G30320 allergen V5/Tpx-1-relATed family protein 0.3 0.6 1.8
229 255533_AT AT4G02180 DC1 domain-containing protein 0.3 0.6 1.8
230 262198_AT AT1G53830 ATPME2; pectinesterase 0.9 1.6 1.8

Appendix
209
231 257668_AT AT3G20460 sugar transporter, putATive 0.6 1.0 1.8
232 248971_AT AT5G45000 transmembrane receptor 1.0 1.7 1.8
233 249756_AT AT5G24313 unknown protein 0.5 0.9 1.8
234 260643_AT AT1G53270 ABC transporter family protein 2.6 4.5 1.8
235 255550_AT AT4G01970 AtSTS (Arabidopsis thaliana stachyose synthase); galactinol-raffinose galactosyltransferase/ hydrolase, hydrolyzing O-glycosyl compounds
0.1 0.2 1.8
236 251349_s_AT AT3G61020 [AT3G61020, pseudogene, similar to P0034A04.28, several hypothetical proteins - Arabidopsis thaliana; blastp mATch of 43% identity and 2.2e-46 P-value to GP|29837187|dbj|BAC75569.1||AP004333 P0034A04.28 {Oryza sATiva (japonica cultivar-group)}];[AT3G11030, unknown protein]
0.7 1.3 1.8
237 256738_AT AT3G29430 geranylgeranyl pyrophosphATe synthase, putATive / GGPP synthetase, putATive / farnesyltranstransferase, putATive
0.3 0.6 1.8
238 260941_AT AT1G44970 peroxidase, putATive 0.5 0.9 1.8
239 266356_AT AT2G32300 UCC1 (UCLACYANIN 1); copper ion binding / electron carrier
0.6 1.0 1.8
240 254125_AT AT4G24670 TAR2 (TRYPTOPHAN AMINOTRANSFERASE RELATED 2); L-tryptophan2-oxoglutarATe aminotransferase/ L-tryptophanpyruvATe aminotransferase/ carbon-sulfur lyase
0.4 0.7 1.8
241 250682_x_AT AT5G06630 proline-rich extensin-like family protein 0.4 0.7 1.8
242 264342_AT AT1G12080 unknown protein 0.4 0.6 1.7
243 263709_AT AT1G09310 unknown protein 3.1 5.4 1.7
244 254836_AT AT4G12330 CYP706A7; electron carrier/ heme binding / iron ion binding / monooxygenase/ oxygen binding
0.8 1.4 1.7
245 264014_AT AT2G21210 auxin-responsive protein, putATive 0.2 0.4 1.7
246 266571_AT AT2G23830 vesicle-associATed membrane protein, putATive / VAMP, putATive
0.9 1.5 1.7
247 262530_AT AT1G17240 AtRLP2 (Receptor Like Protein 2); protein binding / protein kinase
0.7 1.2 1.7
248 267037_AT AT2G38320 unknown protein 0.5 0.9 1.7
249 248980_AT AT5G45090 AtPP2-A7 (Phloem protein 2-A7); carbohydrATe binding
1.2 2.1 1.7
250 263284_AT AT2G36100 integral membrane family protein 0.6 1.0 1.7
251 264794_AT AT1G08670 epsin N-terminal homology (ENTH) domain-containing protein / clAThrin assembly protein-relATed
0.9 1.6 1.7
252 259493_AT AT1G15840 unknown protein 0.7 1.2 1.7
253 256352_AT AT1G54970 ATPRP1 (PROLINE-RICH PROTEIN 1); structural constituent of cell wall
9.2 15.9 1.7
254 265443_AT AT2G20750 ATEXPB1 (ARABIDOPSIS THALIANA EXPANSIN B1) 0.9 1.5 1.7
255 246839_AT AT5G26720 unknown protein 0.7 1.2 1.7
256 251231_AT AT3G62760 ATGSTF13; glutAThione transferase 0.2 0.4 1.7
257 252605_s_AT AT3G45070 [AT3G45070, sulfotransferase family protein];[AT3G45080, sulfotransferase family protein]
0.4 0.7 1.7
258 246807_AT AT5G27100 ATGLR2.1; intracellular ligand-gATed ion channel 0.8 1.4 1.7
259 259433_AT AT1G01570 fringe-relATed protein 3.1 5.3 1.7
260 255564_s_AT AT4G01770 [AT4G01770, RGXT1 (rhamnogalacturonan xylosyltransferase 1); UDP-xylosyltransferase];[AT4G01750, RGXT2 (rhamnogalacturonan xylosyltransferase 2); UDP-xylosyltransferase]
0.7 1.3 1.7
261 253416_AT AT4G33070 pyruvATe decarboxylase, putATive 1.3 2.2 1.7
262 254912_AT AT4G11230 respirATory burst oxidase, putATive / NADPH oxidase, putATive
0.8 1.4 1.7
263 249451_s_AT AT5G39490 [AT5G39490, F-box family protein];[AT5G39480, F-box family protein]
0.7 1.2 1.7
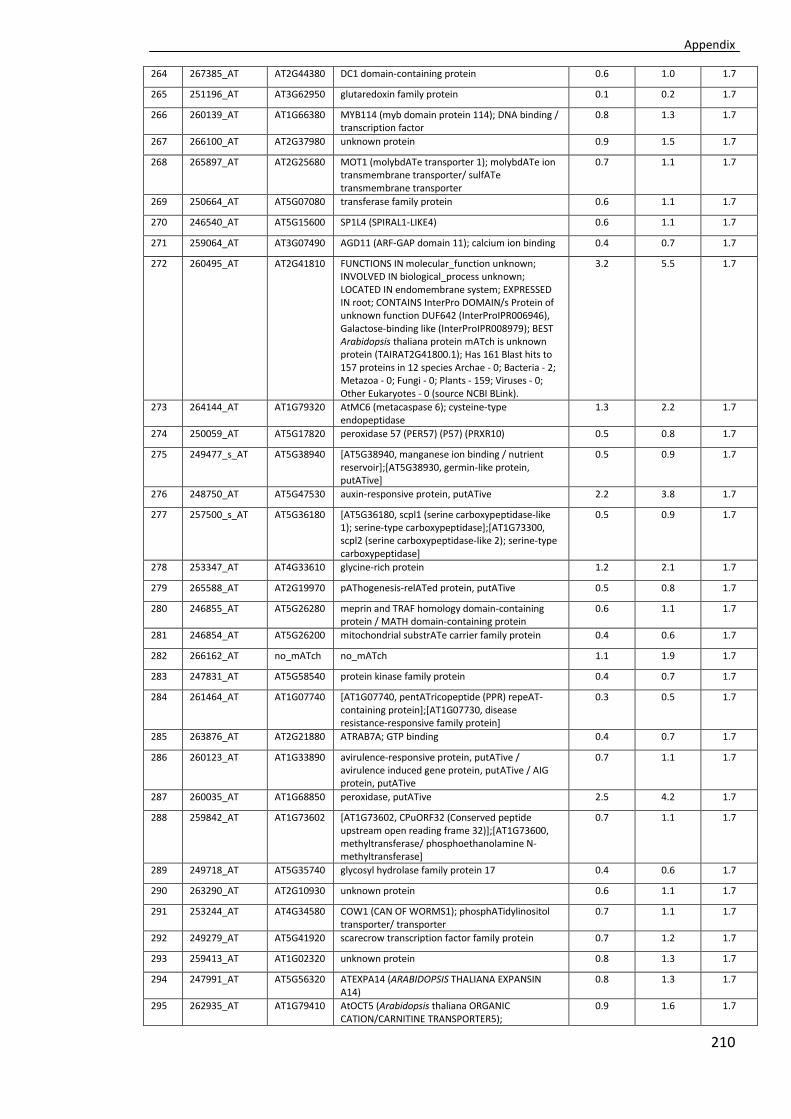
Appendix
210
264 267385_AT AT2G44380 DC1 domain-containing protein 0.6 1.0 1.7
265 251196_AT AT3G62950 glutaredoxin family protein 0.1 0.2 1.7
266 260139_AT AT1G66380 MYB114 (myb domain protein 114); DNA binding / transcription factor
0.8 1.3 1.7
267 266100_AT AT2G37980 unknown protein 0.9 1.5 1.7
268 265897_AT AT2G25680 MOT1 (molybdATe transporter 1); molybdATe ion transmembrane transporter/ sulfATe transmembrane transporter
0.7 1.1 1.7
269 250664_AT AT5G07080 transferase family protein 0.6 1.1 1.7
270 246540_AT AT5G15600 SP1L4 (SPIRAL1-LIKE4) 0.6 1.1 1.7
271 259064_AT AT3G07490 AGD11 (ARF-GAP domain 11); calcium ion binding 0.4 0.7 1.7
272 260495_AT AT2G41810 FUNCTIONS IN molecular_function unknown; INVOLVED IN biological_process unknown; LOCATED IN endomembrane system; EXPRESSED IN root; CONTAINS InterPro DOMAIN/s Protein of unknown function DUF642 (InterProIPR006946), Galactose-binding like (InterProIPR008979); BEST Arabidopsis thaliana protein mATch is unknown protein (TAIRAT2G41800.1); Has 161 Blast hits to 157 proteins in 12 species Archae - 0; Bacteria - 2; Metazoa - 0; Fungi - 0; Plants - 159; Viruses - 0; Other Eukaryotes - 0 (source NCBI BLink).
3.2 5.5 1.7
273 264144_AT AT1G79320 AtMC6 (metacaspase 6); cysteine-type endopeptidase
1.3 2.2 1.7
274 250059_AT AT5G17820 peroxidase 57 (PER57) (P57) (PRXR10) 0.5 0.8 1.7
275 249477_s_AT AT5G38940 [AT5G38940, manganese ion binding / nutrient reservoir];[AT5G38930, germin-like protein, putATive]
0.5 0.9 1.7
276 248750_AT AT5G47530 auxin-responsive protein, putATive 2.2 3.8 1.7
277 257500_s_AT AT5G36180 [AT5G36180, scpl1 (serine carboxypeptidase-like 1); serine-type carboxypeptidase];[AT1G73300, scpl2 (serine carboxypeptidase-like 2); serine-type carboxypeptidase]
0.5 0.9 1.7
278 253347_AT AT4G33610 glycine-rich protein 1.2 2.1 1.7
279 265588_AT AT2G19970 pAThogenesis-relATed protein, putATive 0.5 0.8 1.7
280 246855_AT AT5G26280 meprin and TRAF homology domain-containing protein / MATH domain-containing protein
0.6 1.1 1.7
281 246854_AT AT5G26200 mitochondrial substrATe carrier family protein 0.4 0.6 1.7
282 266162_AT no_mATch no_mATch 1.1 1.9 1.7
283 247831_AT AT5G58540 protein kinase family protein 0.4 0.7 1.7
284 261464_AT AT1G07740 [AT1G07740, pentATricopeptide (PPR) repeAT-containing protein];[AT1G07730, disease resistance-responsive family protein]
0.3 0.5 1.7
285 263876_AT AT2G21880 ATRAB7A; GTP binding 0.4 0.7 1.7
286 260123_AT AT1G33890 avirulence-responsive protein, putATive / avirulence induced gene protein, putATive / AIG protein, putATive
0.7 1.1 1.7
287 260035_AT AT1G68850 peroxidase, putATive 2.5 4.2 1.7
288 259842_AT AT1G73602 [AT1G73602, CPuORF32 (Conserved peptide upstream open reading frame 32)];[AT1G73600, methyltransferase/ phosphoethanolamine N-methyltransferase]
0.7 1.1 1.7
289 249718_AT AT5G35740 glycosyl hydrolase family protein 17 0.4 0.6 1.7
290 263290_AT AT2G10930 unknown protein 0.6 1.1 1.7
291 253244_AT AT4G34580 COW1 (CAN OF WORMS1); phosphATidylinositol transporter/ transporter
0.7 1.1 1.7
292 249279_AT AT5G41920 scarecrow transcription factor family protein 0.7 1.2 1.7
293 259413_AT AT1G02320 unknown protein 0.8 1.3 1.7
294 247991_AT AT5G56320 ATEXPA14 (ARABIDOPSIS THALIANA EXPANSIN A14)
0.8 1.3 1.7
295 262935_AT AT1G79410 AtOCT5 (Arabidopsis thaliana ORGANIC CATION/CARNITINE TRANSPORTER5);
0.9 1.6 1.7

Appendix
211
carbohydrATe transmembrane transporter/ sugarhydrogen symporter
296 258143_AT AT3G18170 transferase, transferring glycosyl groups 0.5 0.9 1.7
297 265483_AT AT2G15790 SQN (SQUINT); peptidyl-prolyl cis-trans isomerase 1.0 1.7 1.7
298 255903_AT AT1G17950 MYB52 (MYB DOMAIN PROTEIN 52); DNA binding / transcription factor
1.3 2.1 1.7
299 253432_AT AT4G32450 pentATricopeptide (PPR) repeAT-containing protein
0.6 1.0 1.7
300 250640_AT AT5G07150 leucine-rich repeAT family protein 0.5 0.8 1.7

Appendix
212
Appendix III: Top 300 genes list rank where C+/C- > P+/P-
Rank Affymetrix ID TAIR ID Description Response C+/C-
Response P+/P-
Fold change
1 250207_AT AT5G13930 TT4 (TRANSPARENT TESTA 4); naringenin-chalcone synthase
158.4 8.4 18.9
2 260706_AT AT1G32350 AOX1D (alternATive oxidase 1D); alternATive oxidase 25.2 1.5 17.3
3 250296_AT AT5G12020 HSP17.6II (17.6 KDA CLASS II HEAT SHOCK PROTEIN) 35.9 2.3 15.3
4 248062_AT AT5G55450 protease inhibitor/seed storage/lipid transfer protein (LTP) family protein
11.7 1.0 12.2
5 247492_AT AT5G61890 AP2 domain-containing transcription factor family protein
20.3 1.7 11.7
6 260978_AT AT1G53540 17.6 kDa class I small heAT shock protein (HSP17.6C-CI) (AA 1-156)
12.5 1.1 11.1
7 257917_AT AT3G23220 DNA binding / transcription factor 46.4 4.6 10.2
8 254283_s_AT AT4G22870 [AT4G22870, leucoanthocyanidin dioxygenase, putATive / anthocyanidin synthase, putATive
50.0 5.4 9.3
9 252739_AT AT3G43250 cell cycle control protein-relATed 10.1 1.1 9.1
10 251625_AT AT3G57260 BGL2 (BETA-1,3-GLUCANASE 2); cellulase/ glucan 1,3-beta-glucosidase/ hydrolase, hydrolyzing O-glycosyl
12.8 1.6 7.8
11 248676_AT AT5G48850 ATSDI1 (SULPHUR DEFICIENCY-INDUCED 1); binding 12.2 1.7 7.4
12 266455_AT AT2G22760 basic helix-loop-helix (bHLH) family protein 40.2 5.5 7.4
13 260581_AT AT2G47190 MYB2 (MYB DOMAIN PROTEIN 2); DNA binding / calmodulin binding / transcription activATor/
28.1 3.8 7.3
14 264718_AT AT1G70130 lectin protein kinase, putATive 78.5 11.0 7.1
15 260551_AT AT2G43510 ATTI1; serine-type endopeptidase inhibitor 6.0 0.9 7.0
16 245531_AT AT4G15100 scpl30 (serine carboxypeptidase-like 30); serine-type carboxypeptidase
77.3 11.1 7.0
17 247026_AT AT5G67080 MAPKKK19; ATP binding / kinase/ protein kinase/ protein serine/threonine kinase
15.0 2.2 6.8
18 261394_AT AT1G79680 wall-associATed kinase, putATive 8.7 1.3 6.8
19 262911_s_AT AT1G59860 [AT1G59860, 17.6 kDa class I heAT shock protein (HSP17.6A-CI)];[AT1G07400, 17.8 kDa class I heAT shock protein (HSP17.8-CI)]
12.6 1.9 6.7
20 259161_AT AT3G01500 CA1 (CARBONIC ANHYDRASE 1); carbonATe dehydrATase/ zinc ion binding
13.0 2.0 6.7
21 259743_AT AT1G71140 MATE efflux family protein 7.7 1.2 6.6
22 250083_AT AT5G17220 ATGSTF12 (ARABIDOPSIS THALIANA GLUTATHIONE S-TRANSFERASE PHI 12); glutAThione transferase
26.9 4.1 6.5
23 248896_AT AT5G46350 WRKY8; transcription factor 12.8 2.0 6.5
24 250445_AT AT5G10760 aspartyl protease family protein 9.9 1.6 6.3
25 252265_AT AT3G49620 DIN11 (DARK INDUCIBLE 11); iron ion binding / oxidoreductase
10.5 1.7 6.3
26 249312_AT AT5G41550 disease resistance protein (TIR-NBS-LRR class), putATive
18.1 2.9 6.2
27 249743_AT AT5G24540 BGLU31 (BETA GLUCOSIDASE 31); cATalytic/ cATion binding / hydrolase, hydrolyzing O-glycosyl compounds
13.1 2.2 6.0
28 261763_AT AT1G15520 PDR12 (PLEIOTROPIC DRUG RESISTANCE 12); ATPase, coupled to transmembrane movement of substances
4.6 0.8 5.9
29 254255_AT AT4G23220 kinase 12.5 2.1 5.9
30 258063_AT AT3G14620 CYP72A8; electron carrier/ heme binding / iron ion binding / monooxygenase/ oxygen binding
12.6 2.1 5.9
31 246293_AT AT3G56710 SIB1 (SIGMA FACTOR BINDING PROTEIN 1); binding / protein binding
19.6 3.4 5.8
32 260203_AT AT1G52890 ANAC019 (Arabidopsis NAC domain containing protein 19); transcription factor
66.9 11.9 5.6
33 251770_AT AT3G55970 oxidoreductase, 2OG-Fe(II) oxygenase family protein 45.2 8.1 5.6
34 259925_AT AT1G75040 PR5 (PATHOGENESIS-RELATED GENE 5) 5.0 0.9 5.5
35 252515_AT AT3G46230 ATHSP17.4 17.1 3.1 5.5
36 262092_AT AT1G56150 auxin-responsive family protein 7.2 1.4 5.3
37 254042_AT AT4G25810 XTR6 (XYLOGLUCAN ENDOTRANSGLYCOSYLASE 6); 3.5 0.7 5.2

Appendix
213
hydrolase, acting on glycosyl bonds / hydrolase, hydrolyzing O-glycosyl compounds / xyloglucanxyloglucosyl transferase
38 249333_AT AT5G40990 GLIP1 (GDSL LIPASE1); carboxylesterase/ lipase 9.0 1.8 5.1
39 260015_AT AT1G67980 CCoAMT; caffeoyl-CoA O-methyltransferase 35.7 7.0 5.1
40 261037_AT AT1G17420 LOX3; electron carrier/ iron ion binding / lipoxygenase/ metal ion binding / oxidoreductase, acting on single donors with incorporATion of molecular oxygen, incorporATion of two AToms of oxygen
40.8 8.0 5.1
41 252123_AT AT3G51240 F3H (FLAVANONE 3-HYDROXYLASE); naringenin 3-dioxygenase
74.7 15.2 4.9
42 249940_AT AT5G22380 anac090 (Arabidopsis NAC domain containing protein 90); transcription factor
5.3 1.1 4.9
43 251428_AT AT3G60140 DIN2 (DARK INDUCIBLE 2); cATalytic/ cATion binding / hydrolase, hydrolyzing O-glycosyl compounds
1.6 0.3 4.9
44 248317_AT AT5G52680 heavy-metal-associATed domain-containing protein 21.2 4.3 4.9
45 261033_AT AT1G17380 JAZ5 (JASMONATE-ZIM-DOMAIN PROTEIN 5) 21.3 4.5 4.7
46 266299_AT AT2G29450 ATGSTU5 (ARABIDOPSIS THALIANA GLUTATHIONE S-TRANSFERASE TAU 5); glutAThione binding / glutAThione transferase
28.2 6.0 4.7
47 263539_AT AT2G24850 TAT3 (TYROSINE AMINOTRANSFERASE 3); L-tyrosine2-oxoglutarATe aminotransferase/ transaminase
525.5 111.8 4.7
48 251166_AT AT3G63350 AT-HSFA7B; DNA binding / transcription factor 12.8 2.8 4.5
49 264646_AT AT1G08860 BON3 (BONZAI 3); calcium-dependent phospholipid binding
11.1 2.5 4.5
50 255937_AT AT1G12610 DDF1 (DWARF AND DELAYED FLOWERING 1); DNA binding / sequence-specific DNA binding / transcription factor
17.7 4.0 4.5
51 260278_AT AT1G80590 WRKY66; transcription factor 4.5 1.0 4.4
52 262211_AT AT1G74930 ORA47; DNA binding / transcription factor 45.9 10.4 4.4
53 247290_AT AT5G64450 unknown protein 7.2 1.6 4.4
54 249744_AT AT5G24550 BGLU32 (BETA GLUCOSIDASE 32); cATalytic/ cATion binding / hydrolase, hydrolyzing O-glycosyl compounds
37.3 8.7 4.3
55 246620_AT AT5G36220 CYP81D1 (CYTOCHROME P450 81D1); electron carrier/ heme binding / iron ion binding / monooxygenase/ oxygen binding
15.8 3.7 4.3
56 262126_AT AT1G59620 CW9; ATP binding 6.2 1.5 4.2
57 261922_AT AT1G65890 AAE12 (ACYL ACTIVATING ENZYME 12); cATalytic 4.5 1.1 4.2
58 266821_AT AT2G44840 ERF13 (ETHYLENE-RESPONSIVE ELEMENT BINDING FACTOR 13); DNA binding / transcription factor
287.0 70.5 4.1
59 260848_AT AT1G21850 sks8 (SKU5 Similar 8); copper ion binding / oxidoreductase
6.1 1.5 4.1
60 250558_AT AT5G07990 TT7 (TRANSPARENT TESTA 7); flavonoid 3'-monooxygenase/ oxygen binding
8.2 2.1 4.0
61 255298_AT AT4G04840 methionine sulfoxide reductase domain-containing protein / SeIR domain-containing protein
5.1 1.3 4.0
62 251482_s_AT AT3G59750 [AT3G59750, receptor lectin kinase, putATive];[AT3G59740, receptor lectin kinase 3 (lecRK3)]
8.9 2.2 4.0
63 254869_AT AT4G11890 protein kinase family protein 12.2 3.1 4.0
64 254062_AT AT4G25380 zinc finger (AN1-like) family protein 9.8 2.5 3.9
65 257641_s_AT AT3G25760 [AT3G25760, AOC1 (ALLENE OXIDE CYCLASE 1); allene-oxide cyclase];[AT3G25770, AOC2 (ALLENE OXIDE CYCLASE 2); allene-oxide cyclase]
22.7 5.8 3.9
66 253070_AT AT4G37850 basic helix-loop-helix (bHLH) family protein 13.2 3.4 3.9
67 250199_AT AT5G14180 MPL1 (MYZUS PERSICAE-INDUCED LIPASE 1); cATalytic
2.1 0.5 3.9
68 254158_AT AT4G24380 unknown protein 50.3 13.1 3.9
69 245528_AT AT4G15530 PPDK (pyruvATe orthophosphATe dikinase); kinase/ pyruvATe, phosphATe dikinase
2.6 0.7 3.8
70 245173_AT AT2G47520 AP2 domain-containing transcription factor, putATive
10.9 2.9 3.8

Appendix
214
71 248775_AT AT5G47850 CCR4 (ARABIDOPSIS THALIANA CRINKLY4 RELATED 4); kinase
7.1 1.9 3.8
72 249197_AT AT5G42380 CML37 (CALMODULIN LIKE 37); calcium ion binding 223.5 59.4 3.8
73 250351_AT AT5G12030 AT-HSP17.6A (ARABIDOPSIS THALIANA HEAT SHOCK PROTEIN 17.6A); unfolded protein binding
16.8 4.5 3.7
74 252136_AT AT3G50770 calmodulin-relATed protein, putATive 17.1 4.6 3.7
75 261215_AT AT1G32970 subtilase family protein 118.8 32.1 3.7
76 264217_AT AT1G60190 armadillo/beta-cATenin repeAT family protein / U-box domain-containing protein
42.3 11.5 3.7
77 261216_AT AT1G33030 O-methyltransferase family 2 protein 6.2 1.7 3.6
78 257918_AT AT3G23230 ethylene-responsive factor, putATive 99.7 27.7 3.6
79 248160_AT AT5G54470 zinc finger (B-box type) family protein 16.6 4.6 3.6
80 261443_AT AT1G28480 GRX480; electron carrier/ protein disulfide oxidoreductase
65.6 18.4 3.6
81 255599_AT AT4G01010 ATCNGC13; calmodulin binding / cyclic nucleotide binding / ion channel
9.8 2.7 3.6
82 252269_AT AT3G49580 LSU1 (RESPONSE TO LOW SULFUR 1) 4.2 1.2 3.6
83 256159_AT AT1G30135 JAZ8 (JASMONATE-ZIM-DOMAIN PROTEIN 8) 37.1 10.4 3.6
84 257927_AT AT3G23240 ERF1 (ETHYLENE RESPONSE FACTOR 1); DNA binding / transcription activATor/ transcription factor
93.4 26.3 3.5
85 267607_s_AT AT2G26740 [AT2G26740, ATSEH (Arabidopsis thaliana soluble epoxide hydrolase); epoxide hydrolase];[AT2G26750, epoxide hydrolase, putATive]
4.1 1.2 3.5
86 266658_AT AT2G25735 unknown protein 9.4 2.6 3.5
87 255879_AT AT1G67000 ATP binding / kinase/ protein kinase/ protein serine/threonine kinase
5.6 1.6 3.5
88 248794_AT AT5G47220 ERF2 (ETHYLENE RESPONSIVE ELEMENT BINDING FACTOR 2); DNA binding / transcription activATor/ transcription factor
44.0 12.5 3.5
89 253181_AT AT4G35180 LHT7 (Lys/His transporter 7); amino acid transmembrane transporter
8.0 2.3 3.5
90 266486_AT AT2G47950 unknown protein 3.0 0.9 3.5
91 245613_AT no_mATch no_mATch 24.4 7.0 3.5
92 245041_AT AT2G26530 AR781 43.0 12.5 3.4
93 265632_AT AT2G14290 F-box family protein 22.3 6.5 3.4
94 247754_AT AT5G59080 unknown protein 0.2 0.0 3.4
95 253259_AT AT4G34410 RRTF1 ({REDOX RESPONSIVE TRANSCRIPTION FACTOR 1); DNA binding / transcription factor
103.2 30.1 3.4
96 257540_AT AT3G21520 unknown protein 13.0 3.8 3.4
97 256009_AT AT1G19210 AP2 domain-containing transcription factor, putATive
9.0 2.7 3.4
98 250798_AT AT5G05340 peroxidase, putATive 7.6 2.3 3.4
99 251603_AT AT3G57760 protein kinase family protein 5.0 1.5 3.4
100 261242_AT AT1G32960 SBT3.3; identical protein binding / serine-type endopeptidase
3.3 1.0 3.4
101 247360_AT AT5G63450 CYP94B1; electron carrier/ heme binding / iron ion binding / monooxygenase/ oxygen binding
18.1 5.4 3.4
102 247925_AT AT5G57560 TCH4 (Touch 4); hydrolase, acting on glycosyl bonds / xyloglucanxyloglucosyl transferase
15.0 4.5 3.4
103 250292_AT AT5G13220 JAZ10 (JASMONATE-ZIM-DOMAIN PROTEIN 10) 112.5 33.7 3.3
104 247431_AT AT5G62520 SRO5 (SIMILAR TO RCD ONE 5); NAD+ ADP-ribosyltransferase
5.0 1.5 3.3
105 259640_AT AT1G52400 BGLU18 (BETA GLUCOSIDASE 18); cATalytic/ cATion binding / hydrolase, hydrolyzing O-glycosyl compounds
6.1 1.8 3.3
106 266270_AT AT2G29470 ATGSTU3 (ARABIDOPSIS THALIANA GLUTATHIONE S-TRANSFERASE TAU 3); glutAThione transferase
3.5 1.0 3.3
107 256991_AT AT3G28600 ATP binding / ATPase/ nucleoside-triphosphATase/ nucleotide binding
20.8 6.3 3.3
108 247789_AT AT5G58680 armadillo/beta-cATenin repeAT family protein 10.3 3.1 3.3
109 253060_AT AT4G37710 VQ motif-containing protein 286.5 87.8 3.3

Appendix
215
110 258975_AT AT3G01970 WRKY45; transcription factor 2.9 0.9 3.3
111 265091_s_AT AT1G03940 [AT1G03940, transferase family protein];[AT1G03495, transferase/ transferase, transferring acyl groups other than amino-acyl groups]
28.2 8.7 3.3
112 257919_AT AT3G23250 MYB15 (MYB DOMAIN PROTEIN 15); DNA binding / transcription factor
19.2 5.9 3.3
113 264758_AT AT1G61340 F-box family protein 27.2 8.4 3.2
114 248185_AT AT5G54060 UF3GT (udp-glucoseflavonoid 3-O-glucosyltransferase); transferase, transferring glycosyl groups
19.2 6.0 3.2
115 251456_AT AT3G60120 BGLU27 (BETA GLUCOSIDASE 27); cATalytic/ cATion binding / hydrolase, hydrolyzing O-glycosyl compounds
34.6 10.8 3.2
116 262325_AT AT1G64160 disease resistance-responsive family protein / dirigent family protein
10.5 3.3 3.2
117 252648_AT AT3G44630 disease resistance protein RPP1-WsB-like (TIR-NBS-LRR class), putATive
14.5 4.6 3.2
118 256526_AT AT1G66090 disease resistance protein (TIR-NBS class), putATive 56.5 17.8 3.2
119 247655_AT AT5G59820 RHL41 (RESPONSIVE TO HIGH LIGHT 41); nucleic acid binding / transcription factor/ zinc ion binding
20.1 6.3 3.2
120 252679_AT AT3G44260 CCR4-NOT transcription complex protein, putATive 15.5 4.9 3.2
121 247848_AT AT5G58120 disease resistance protein (TIR-NBS-LRR class), putATive
8.2 2.6 3.2
122 246406_AT AT1G57650 INVOLVED IN defense response; LOCATED IN cellular_component unknown; EXPRESSED IN stamen;
8.4 2.7 3.1
123 253859_AT AT4G27657 unknown protein 4.6 1.5 3.1
124 249747_AT AT5G24600 unknown protein 28.3 9.1 3.1
125 251774_AT AT3G55840 FUNCTIONS IN molecular_function unknown; INVOLVED IN biological_process unknown; LOCATED IN cellular_component unknown; EXPRESSED IN 10 plant structures
14.0 4.5 3.1
126 251827_AT AT3G55120 TT5 (TRANSPARENT TESTA 5); chalcone isomerase 10.1 3.3 3.1
127 253066_AT AT4G37770 ACS8; 1-aminocyclopropane-1-carboxylATe synthase 17.1 5.5 3.1
128 256430_AT AT3G11020 DREB2B (DRE/CRT-BINDING PROTEIN 2B); DNA binding / transcription activATor/ transcription factor
5.5 1.8 3.1
129 249971_AT AT5G19110 extracellular dermal glycoprotein-relATed / EDGP-relATed
14.3 4.6 3.1
130 245033_AT AT2G26380 disease resistance protein-relATed / LRR protein-relATed
132.1 43.0 3.1
131 249889_AT AT5G22540 unknown protein 6.3 2.1 3.1
132 263783_AT AT2G46400 WRKY46; transcription factor 47.5 15.6 3.1
133 261558_AT AT1G01770 unknown protein 1.0 0.3 3.0
134 253724_AT AT4G29285 LCR24 (Low-molecular-weight cysteine-rich 24) 5.3 1.7 3.0
135 255900_AT AT1G17830 unknown protein 9.0 3.0 3.0
136 259866_AT AT1G76640 calmodulin-relATed protein, putATive 37.6 12.5 3.0
137 245624_AT AT4G14090 UDP-glucoronosyl/UDP-glucosyl transferase family protein
24.5 8.2 3.0
138 267140_AT AT2G38250 DNA-binding protein-relATed 3.7 1.2 3.0
139 265030_AT AT1G61610 S-locus lectin protein kinase family protein 3.9 1.3 3.0
140 267147_AT AT2G38240 oxidoreductase, 2OG-Fe(II) oxygenase family protein 43.1 14.5 3.0
141 258606_AT AT3G02840 immediATe-early fungal elicitor family protein 45.0 15.2 3.0
142 262229_AT AT1G68620 hydrolase 16.4 5.5 3.0
143 245953_AT AT5G28520 unknown 13.8 4.7 2.9
144 257386_AT AT2G42440 unknown; BEST Arabidopsis thaliana protein mATch is LBD29 (LATERAL ORGAN BOUNDARIES-DOMAIN 29) (TAIRAT3G58190.1);
4.2 1.4 2.9
145 250415_AT AT5G11210 ATGLR2.5; intracellular ligand-gATed ion channel 10.6 3.6 2.9
146 257840_AT AT3G25250 AGC2-1 (OXIDATIVE SIGNAL-INDUCIBLE1); kinase 76.9 26.2 2.9

Appendix
216
147 260541_AT AT2G43530 trypsin inhibitor, putATive 2.7 0.9 2.9
148 257206_AT AT3G16530 legume lectin family protein 3.4 1.2 2.9
149 266878_AT no_mATch no_mATch 15.2 5.2 2.9
150 253643_AT AT4G29780 unknown protein 34.5 11.9 2.9
151 252989_AT AT4G38420 sks9 (SKU5 Similar 9); copper ion binding / oxidoreductase
10.8 3.7 2.9
152 265569_AT AT2G05620 PGR5 (proton gradient regulATion 5); electron carrier 3.0 1.0 2.9
153 266267_AT AT2G29460 ATGSTU4 (ARABIDOPSIS THALIANA GLUTATHIONE S-TRANSFERASE TAU 4); glutAThione transferase
24.0 8.3 2.9
154 261892_AT AT1G80840 WRKY40; transcription factor 52.1 18.1 2.9
155 265327_AT AT2G18210 unknown protein 11.2 3.9 2.9
156 254265_s_AT AT4G23140 [AT4G23140, CRK6 (CYSTEINE-RICH RLK 6); kinase];[AT4G23160, protein kinase family protein]
3.0 1.0 2.9
157 248618_AT AT5G49620 AtMYB78 (myb domain protein 78); DNA binding / transcription factor
2.6 0.9 2.9
158 253477_AT AT4G32320 APX6; L-ascorbATe peroxidase/ heme binding / peroxidase
2.3 0.8 2.9
159 247543_AT AT5G61600 ethylene-responsive element-binding family protein 2.7 0.9 2.9
160 263378_AT AT2G40180 ATHPP2C5; cATalytic/ protein serine/threonine phosphATase
9.7 3.4 2.8
161 250455_AT AT5G09980 PROPEP4 (Elicitor peptide 4 precursor) 13.2 4.7 2.8
162 261957_AT AT1G64660 ATMGL (ARABIDOPSIS THALIANA METHIONINE GAMMA-LYASE); cATalytic/ methionine gamma-lyase
1.6 0.6 2.8
163 250781_AT AT5G05410 DREB2A; DNA binding / transcription activATor/ transcription factor
7.4 2.6 2.8
164 248789_AT AT5G47440 phosphoinositide binding 16.3 5.8 2.8
165 266971_AT AT2G39580 unknown protein 1.3 0.5 2.8
166 247691_AT AT5G59720 HSP18.2 (heAT shock protein 18.2) 2.4 0.9 2.8
167 265674_AT no_mATch no_mATch 40.4 14.5 2.8
168 252070_AT AT3G51680 short-chain dehydrogenase/reductase (SDR) family protein
17.5 6.3 2.8
169 250794_AT AT5G05270 chalcone-flavanone isomerase family protein 4.2 1.5 2.8
170 262047_AT AT1G80160 lactoylglutAThione lyase family protein / glyoxalase I family protein
1.3 0.5 2.8
171 247070_AT AT5G66815 unknown protein 2.2 0.8 2.7
172 246099_AT AT5G20230 ATBCB (ARABIDOPSIS BLUE-COPPER-BINDING PROTEIN); copper ion binding / electron carrier
37.4 13.6 2.7
173 266294_AT AT2G29500 17.6 kDa class I small heAT shock protein (HSP17.6B-CI)
10.2 3.7 2.7
174 253044_AT AT4G37290 unknown protein 18.4 6.7 2.7
175 261785_AT AT1G08230 amino acid transporter family protein 2.4 0.9 2.7
176 258377_AT AT3G17690 ATCNGC19; calmodulin binding / cyclic nucleotide binding / ion channel
36.0 13.2 2.7
177 266097_AT AT2G37970 SOUL-1; binding 3.4 1.3 2.7
178 245755_AT AT1G35210 unknown protein 45.8 16.8 2.7
179 262213_AT AT1G74870 protein binding / zinc ion binding 9.4 3.4 2.7
180 264659_AT AT1G09930 ATOPT2; oligopeptide transporter 21.1 7.8 2.7
181 262580_AT AT1G15330 CBS domain-containing protein 1.7 0.6 2.7
182 260856_AT AT1G21910 AP2 domain-containing transcription factor family protein
9.6 3.6 2.7
183 258516_AT AT3G06490 MYB108 (myb domain protein 108); DNA binding / transcription factor
82.7 30.5 2.7
184 248625_AT AT5G48880 PKT2 (PEROXISOMAL 3-KETO-ACYL-COA THIOLASE 2); acetyl-CoA C-acyltransferase/ cATalytic
4.7 1.7 2.7
185 248606_AT AT5G49450 [AT5G49450, AtbZIP1 (Arabidopsis thaliana basic leucine-zipper 1); DNA binding / protein heterodimerizATion/ transcription factor];[AT5G49448, CPuORF4 (Conserved peptide upstream open reading frame 4)]
3.6 1.3 2.7

Appendix
217
186 259694_AT AT1G63180 UGE3 (UDP-D-glucose/UDP-D-galactose 4-epimerase 3); UDP-glucose 4-epimerase/ protein dimerizATion
1.4 0.5 2.7
187 247327_AT AT5G64120 peroxidase, putATive 8.2 3.1 2.7
188 246349_AT AT1G51915 cryptdin protein-relATed 6.8 2.5 2.7
189 265482_AT AT2G15780 glycine-rich protein 19.7 7.4 2.7
190 252131_AT AT3G50930 BCS1 (CYTOCHROME BC1 SYNTHESIS); ATP binding / ATPase/ nucleoside-triphosphATase/ nucleotide binding
37.8 14.2 2.7
191 255884_AT AT1G20310 unknown protein 53.5 20.1 2.7
192 253316_s_AT AT4G34300 [AT4G34300, glycine-rich protein];[AT4G33930, glycine-rich protein]
4.6 1.7 2.7
193 256589_AT AT3G28740 CYP81D1; electron carrier/ heme binding / iron ion binding / monooxygenase/ oxygen binding
13.6 5.2 2.6
194 257763_s_AT AT3G23120 [AT3G23120, AtRLP38 (Receptor Like Protein 38); kinase/ protein binding];[AT3G23110, AtRLP37 (Receptor Like Protein 37); kinase/ protein binding]
4.2 1.6 2.6
195 254074_AT AT4G25490 CBF1 (C-REPEAT/DRE BINDING FACTOR 1); DNA binding / transcription activATor/ transcription factor
10.3 3.9 2.6
196 266800_AT AT2G22880 VQ motif-containing protein 27.8 10.5 2.6
197 250187_AT AT5G14370 LOCATED IN chloroplast; EXPRESSED IN 21 plant structures; EXPRESSED DURING 13 growth stages; CONTAINS InterPro DOMAIN/s CCT domain (InterProIPR010402); BEST Arabidopsis thaliana protein mATch is CIL (TAIRAT4G25990.1);
2.2 0.8 2.6
198 261053_AT AT1G01320 tetrATricopeptide repeAT (TPR)-containing protein 1.3 0.5 2.6
199 248358_AT AT5G52400 CYP715A1; electron carrier/ heme binding / iron ion binding / monooxygenase/ oxygen binding
110.2 42.0 2.6
200 248448_AT AT5G51190 AP2 domain-containing transcription factor, putATive
9.1 3.5 2.6
201 256093_AT AT1G20823 zinc finger (C3HC4-type RING finger) family protein 9.3 3.5 2.6
202 264202_AT AT1G22810 AP2 domain-containing transcription factor, putATive
100.8 38.4 2.6
203 265983_AT AT2G18550 HB-2 (HOMEOBOX-2); DNA binding / transcription factor
6.4 2.5 2.6
204 266720_s_AT AT2G46790 [AT2G46790, APRR9 (ARABIDOPSIS PSEUDO-RESPONSE REGULATOR 9); protein binding / transcription regulATor/ two-component response regulATor];[AT2G46670, pseudo-response regulATor, putATive / timing of CAB expression 1-like protein, putATive]
7.9 3.0 2.6
205 250670_AT AT5G06860 PGIP1 (POLYGALACTURONASE INHIBITING PROTEIN 1); protein binding
18.4 7.0 2.6
206 256128_AT AT1G18140 LAC1 (Laccase 1); laccase 7.5 2.9 2.6
207 254905_AT AT4G11170 disease resistance protein (TIR-NBS-LRR class), putATive
20.3 7.8 2.6
208 262383_AT AT1G72940 disease resistance protein (TIR-NBS class), putATive 10.2 3.9 2.6
209 264761_AT AT1G61280 FUNCTIONS IN molecular_function unknown; INVOLVED IN biological_process unknown; LOCATED IN cellular_component unknown; EXPRESSED IN 17 plant structures; EXPRESSED DURING 9 growth stages; CONTAINS InterPro DOMAIN/s PIG-P (InterProIPR013717), PhosphATidylinositol N-acetylglucosaminyltransferase, GPI19/PIG-P subunit (InterProIPR016542); BEST Arabidopsis thaliana protein mATch is unknown protein (TAIRAT2G39445.1);
3.1 1.2 2.6
210 247913_AT AT5G57510 unknown protein 57.3 22.1 2.6
211 264929_AT AT1G60730 aldo/keto reductase family protein 4.2 1.6 2.6
212 247052_AT AT5G66700 HB53; DNA binding / transcription factor 6.1 2.4 2.6
213 249773_AT AT5G24140 SQP2; FAD binding / oxidoreductase/ squalene monooxygenase
3.9 1.5 2.6
214 256994_s_AT AT3G25830 [AT3G25830, ATTPS-CIN (terpene synthase-like sequence-1,8-cineole); (E)-beta-ocimene synthase/ myrcene synthase];[AT3G25820, ATTPS-CIN (terpene synthase-like sequence-1,8-cineole); (E)-beta-ocimene synthase/ myrcene synthase]
3.2 1.2 2.6

Appendix
218
215 254926_AT AT4G11280 ACS6 (1-AMINOCYCLOPROPANE-1-CARBOXYLIC ACID (ACC) SYNTHASE 6); 1-aminocyclopropane-1-carboxylATe synthase
17.7 6.9 2.6
216 251023_AT AT5G02170 amino acid transporter family protein 13.2 5.1 2.6
217 264618_AT AT2G17680 unknown protein 11.5 4.5 2.6
218 254014_AT AT4G26120 ankyrin repeAT family protein / BTB/POZ domain-containing protein
6.1 2.4 2.6
219 248286_AT AT5G52870 unknown protein 4.4 1.7 2.6
220 249215_AT AT5G42800 DFR (DIHYDROFLAVONOL 4-REDUCTASE); dihydrokaempferol 4-reductase
18.8 7.3 2.6
221 245540_AT AT4G15230 PDR2 (PLEIOTROPIC DRUG RESISTANCE 2); ATPase, coupled to transmembrane movement of substances
5.1 2.0 2.6
222 254396_AT AT4G21680 proton-dependent oligopeptide transport (POT) family protein
3.5 1.4 2.5
223 250435_AT AT5G10380 RING1; protein binding / ubiquitin-protein ligase/ zinc ion binding
7.1 2.8 2.5
224 249558_AT AT5G38310 unknown protein 4.1 1.6 2.5
225 253666_AT AT4G30270 MERI5B (meristem-5); hydrolase, acting on glycosyl bonds / xyloglucanxyloglucosyl transferase
0.6 0.3 2.5
226 259293_AT AT3G11580 DNA-binding protein, putATive 6.7 2.6 2.5
227 245627_AT AT1G56600 AtGolS2 (Arabidopsis thaliana galactinol synthase 2); transferase, transferring glycosyl groups / transferase, transferring hexosyl groups
32.1 12.8 2.5
228 255340_AT AT4G04490 protein kinase family protein 3.1 1.2 2.5
229 249752_AT AT5G24660 LSU2 (RESPONSE TO LOW SULFUR 2) 5.8 2.3 2.5
230 265501_AT AT2G15490 UGT73B4 (UDP-GLYCOSYLTRANSFERASE 73B4); UDP-glucosyltransferase/ UDP-glycosyltransferase/ quercetin 3-O-glucosyltransferase/ quercetin 7-O-glucosyltransferase/ transferase, transferring glycosyl groups
6.1 2.4 2.5
231 263150_AT AT1G54050 17.4 kDa class III heAT shock protein (HSP17.4-CIII) 3.3 1.3 2.5
232 265723_AT AT2G32140 transmembrane receptor 64.4 25.8 2.5
233 265204_AT AT2G36650 FUNCTIONS IN molecular_function unknown; INVOLVED IN biological_process unknown; EXPRESSED IN sperm cell, hypocotyl, flower, root; EXPRESSED DURING petal differentiATion and expansion stage; BEST Arabidopsis thaliana protein mATch is CHUP1 (CHLOROPLAST UNUSUAL POSITIONING 1) (TAIRAT3G25690.1
6.3 2.5 2.5
234 260405_AT AT1G69930 ATGSTU11 (GLUTATHIONE S-TRANSFERASE TAU 11); glutAThione transferase
33.0 13.3 2.5
235 260205_AT AT1G70700 TIFY7 6.5 2.6 2.5
236 255250_AT AT4G05100 AtMYB74 (myb domain protein 74); DNA binding / transcription factor
7.3 3.0 2.5
237 259410_AT AT1G13340 unknown protein 3.8 1.5 2.5
238 252408_AT AT3G47600 ATMYB94 (MYB DOMAIN PROTEIN 94); DNA binding / transcription factor
3.3 1.3 2.5
239 262259_s_AT AT1G53890 [AT1G53890, unknown protein];[AT1G53870, unknown protein]
3.9 1.6 2.5
240 253046_AT AT4G37370 CYP81D8; electron carrier/ heme binding / iron ion binding / monooxygenase/ oxygen binding
32.0 13.0 2.5
241 256356_s_AT AT5G43620 [AT5G43620, S-locus protein-relATed];[AT1G66500, zinc finger (C2H2-type) family protein]
10.0 4.1 2.5
242 260408_AT AT1G69880 ATH8 (thioredoxin H-type 8) 0.5 0.2 2.4
243 263584_AT AT2G17040 anac036 (Arabidopsis NAC domain containing protein 36); transcription factor
19.5 8.0 2.4
244 262012_s_AT AT1G35625 [AT1G35625, peptidase/ protein binding / zinc ion binding];[AT1G35630, protease-associATed zinc finger (C3HC4-type RING finger) family protein]
2.2 0.9 2.4
245 250622_AT AT5G07310 AP2 domain-containing transcription factor, putATive
2.9 1.2 2.4
246 260399_AT AT1G72520 lipoxygenase, putATive 184.1 75.7 2.4
247 255543_AT AT4G01870 tolB protein-relATed 12.8 5.3 2.4
248 257536_AT AT3G02800 phosphATase/ phosphoprotein phosphATase/ protein tyrosine phosphATase
11.4 4.7 2.4
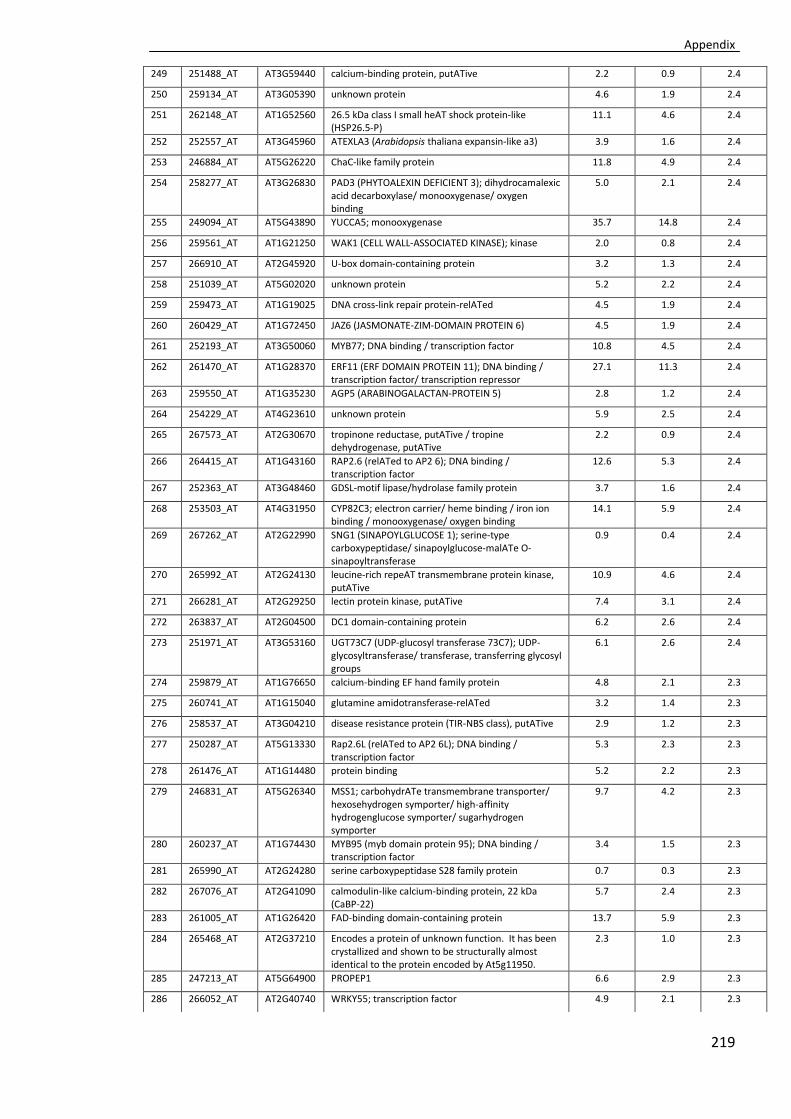
Appendix
219
249 251488_AT AT3G59440 calcium-binding protein, putATive 2.2 0.9 2.4
250 259134_AT AT3G05390 unknown protein 4.6 1.9 2.4
251 262148_AT AT1G52560 26.5 kDa class I small heAT shock protein-like (HSP26.5-P)
11.1 4.6 2.4
252 252557_AT AT3G45960 ATEXLA3 (Arabidopsis thaliana expansin-like a3) 3.9 1.6 2.4
253 246884_AT AT5G26220 ChaC-like family protein 11.8 4.9 2.4
254 258277_AT AT3G26830 PAD3 (PHYTOALEXIN DEFICIENT 3); dihydrocamalexic acid decarboxylase/ monooxygenase/ oxygen binding
5.0 2.1 2.4
255 249094_AT AT5G43890 YUCCA5; monooxygenase 35.7 14.8 2.4
256 259561_AT AT1G21250 WAK1 (CELL WALL-ASSOCIATED KINASE); kinase 2.0 0.8 2.4
257 266910_AT AT2G45920 U-box domain-containing protein 3.2 1.3 2.4
258 251039_AT AT5G02020 unknown protein 5.2 2.2 2.4
259 259473_AT AT1G19025 DNA cross-link repair protein-relATed 4.5 1.9 2.4
260 260429_AT AT1G72450 JAZ6 (JASMONATE-ZIM-DOMAIN PROTEIN 6) 4.5 1.9 2.4
261 252193_AT AT3G50060 MYB77; DNA binding / transcription factor 10.8 4.5 2.4
262 261470_AT AT1G28370 ERF11 (ERF DOMAIN PROTEIN 11); DNA binding / transcription factor/ transcription repressor
27.1 11.3 2.4
263 259550_AT AT1G35230 AGP5 (ARABINOGALACTAN-PROTEIN 5) 2.8 1.2 2.4
264 254229_AT AT4G23610 unknown protein 5.9 2.5 2.4
265 267573_AT AT2G30670 tropinone reductase, putATive / tropine dehydrogenase, putATive
2.2 0.9 2.4
266 264415_AT AT1G43160 RAP2.6 (relATed to AP2 6); DNA binding / transcription factor
12.6 5.3 2.4
267 252363_AT AT3G48460 GDSL-motif lipase/hydrolase family protein 3.7 1.6 2.4
268 253503_AT AT4G31950 CYP82C3; electron carrier/ heme binding / iron ion binding / monooxygenase/ oxygen binding
14.1 5.9 2.4
269 267262_AT AT2G22990 SNG1 (SINAPOYLGLUCOSE 1); serine-type carboxypeptidase/ sinapoylglucose-malATe O-sinapoyltransferase
0.9 0.4 2.4
270 265992_AT AT2G24130 leucine-rich repeAT transmembrane protein kinase, putATive
10.9 4.6 2.4
271 266281_AT AT2G29250 lectin protein kinase, putATive 7.4 3.1 2.4
272 263837_AT AT2G04500 DC1 domain-containing protein 6.2 2.6 2.4
273 251971_AT AT3G53160 UGT73C7 (UDP-glucosyl transferase 73C7); UDP-glycosyltransferase/ transferase, transferring glycosyl groups
6.1 2.6 2.4
274 259879_AT AT1G76650 calcium-binding EF hand family protein 4.8 2.1 2.3
275 260741_AT AT1G15040 glutamine amidotransferase-relATed 3.2 1.4 2.3
276 258537_AT AT3G04210 disease resistance protein (TIR-NBS class), putATive 2.9 1.2 2.3
277 250287_AT AT5G13330 Rap2.6L (relATed to AP2 6L); DNA binding / transcription factor
5.3 2.3 2.3
278 261476_AT AT1G14480 protein binding 5.2 2.2 2.3
279 246831_AT AT5G26340 MSS1; carbohydrATe transmembrane transporter/ hexosehydrogen symporter/ high-affinity hydrogenglucose symporter/ sugarhydrogen symporter
9.7 4.2 2.3
280 260237_AT AT1G74430 MYB95 (myb domain protein 95); DNA binding / transcription factor
3.4 1.5 2.3
281 265990_AT AT2G24280 serine carboxypeptidase S28 family protein 0.7 0.3 2.3
282 267076_AT AT2G41090 calmodulin-like calcium-binding protein, 22 kDa (CaBP-22)
5.7 2.4 2.3
283 261005_AT AT1G26420 FAD-binding domain-containing protein 13.7 5.9 2.3
284 265468_AT AT2G37210 Encodes a protein of unknown function. It has been crystallized and shown to be structurally almost identical to the protein encoded by At5g11950.
2.3 1.0 2.3
285 247213_AT AT5G64900 PROPEP1 6.6 2.9 2.3
286 266052_AT AT2G40740 WRKY55; transcription factor 4.9 2.1 2.3

Appendix
220
287 261564_AT AT1G01720 ATAF1; transcription activATor/ transcription factor 10.1 4.4 2.3
288 251705_AT AT3G56400 WRKY70; transcription factor/ transcription repressor
12.8 5.6 2.3
289 254215_AT AT4G23700 ATCHX17 (CATION/H+ EXCHANGER 17); monovalent cATionproton antiporter/ sodiumhydrogen antiporter
6.3 2.8 2.3
290 261648_AT AT1G27730 STZ (salt tolerance zinc finger); nucleic acid binding / transcription factor/ transcription repressor/ zinc ion binding
15.3 6.7 2.3
291 261135_AT AT1G19610 PDF1.4 1.2 0.5 2.3
292 264815_AT AT1G03620 phagocytosis and cell motility protein ELMO1-relATed
1.0 0.4 2.3
293 249890_AT AT5G22570 WRKY38; transcription factor 36.9 16.3 2.3
294 252888_AT AT4G39210 APL3; glucose-1-phosphATe adenylyltransferase 3.7 1.6 2.3
295 259033_AT AT3G09405 FUNCTIONS IN molecular_function unknown; INVOLVED IN biological_process unknown; LOCATED IN cellular_component unknown; CONTAINS InterPro DOMAIN/s Pectinacetylesterase (InterProIPR004963); BEST Arabidopsis thaliana protein mATch is pectinacetylesterase family protein (TAIRAT3G09410.1).
8.3 3.7 2.3
296 260239_AT AT1G74360 leucine-rich repeAT transmembrane protein kinase, putATive
8.2 3.6 2.3
297 259439_AT AT1G01480 ACS2; 1-aminocyclopropane-1-carboxylATe synthase 31.8 14.1 2.2
298 249021_AT AT5G44820 unknown protein 3.7 1.6 2.2
299 267627_AT AT2G42270 U5 small nuclear ribonucleoprotein helicase, putATive
1.6 0.7 2.2
300 263866_AT AT2G36950 heavy-metal-associATed domain-containing protein 1.1 0.4 2.2

Appendix
221
Appendix IV: Enriched GO categories for genes showing higher response to salt in primed plants compared to control plants in the selected background (FRD≤0.05). The top 300 genes from the list Primed>Control are compared against A) genes salt specific background and B) roots specific background.
A) Primed> Control on salt specific background
Cluster1 Enrichment Score 4.4 Count % P-Value Affymetrix ID FDR
GOTERM_MF_FAT
GO0005199~structural constituent of cell wall
9 3.1 9.48E-08 256352_AT, 255140_X_AT, 245875_AT, 257679_AT, 258008_AT, 257041_AT, 246652_AT, 250683_X_AT, 250682_X_AT
1.22E-04
GOTERM_BP_FAT
GO0009664~plant-type cell wall organizATion
9 3.1 9.51E-06 259525_AT, 255140_X_AT, 245875_AT, 265443_AT, 261099_AT, 257041_AT, 246652_AT, 250683_X_AT, 250682_X_AT
1.32E-02
Cluster2 Enrichment Score 3.8 Count % P-Value Affymetrix ID FDR
GOTERM_BP_FAT
GO0042744~hydrogen peroxide cATabolic process
11 3.7 8.29E-07 249934_AT, 266191_AT, 247091_AT, 252238_AT, 260941_AT, 265102_AT, 260035_AT, 250059_AT, 266941_AT, 253998_AT, 264567_S_AT
1.15E-03
GOTERM_BP_FAT
GO0070301~cellular response to hydrogen peroxide
11 3.7 8.29E-07 249934_AT, 266191_AT, 247091_AT, 252238_AT, 260941_AT, 265102_AT, 260035_AT, 250059_AT, 266941_AT, 253998_AT, 264567_S_AT
1.15E-03
GOTERM_BP_FAT
GO0042743~hydrogen peroxide metabolic process
11 3.7 1.32E-06 249934_AT, 266191_AT, 247091_AT, 252238_AT, 260941_AT, 265102_AT, 260035_AT, 250059_AT, 266941_AT, 253998_AT, 264567_S_AT
1.84E-03
GOTERM_BP_FAT
GO0034614~cellular response to reactive oxygen species
11 3.7 2.04E-06 249934_AT, 266191_AT, 247091_AT, 252238_AT, 260941_AT, 265102_AT, 260035_AT, 250059_AT, 266941_AT, 253998_AT, 264567_S_AT
2.85E-03
GOTERM_BP_FAT
GO0034599~cellular response to oxidATive stress
11 3.7 2.52E-06 249934_AT, 266191_AT, 247091_AT, 252238_AT, 260941_AT, 265102_AT, 260035_AT, 250059_AT, 266941_AT, 253998_AT, 264567_S_AT
3.51E-03
GOTERM_MF_FAT
GO0005509~calcium ion binding
20 6.8 5.97E-06 254338_S_AT, 249934_AT, 247091_AT, 257405_AT, 252238_AT, 260941_AT, 260035_AT, 266941_AT, 253998_AT, 253968_AT, 264567_S_AT, 264391_AT, 266191_AT, 254092_AT, 246302_AT, 248898_AT, 265102_AT, 259064_AT, 250059_AT, 254774_AT
7.70E-03
GOTERM_MF_FAT
GO0020037~heme binding 19 6.4 7.73E-06 249934_AT, 247091_AT, 252238_AT, 260941_AT, 260035_AT, 266941_AT, 250576_AT, 253998_AT, 264567_S_AT, 264404_AT, 258920_AT, 266191_AT, 250651_AT, 267626_AT, 257143_AT, 253502_AT, 265102_AT, 256099_AT, 250059_AT
9.96E-03
GOTERM_BP_FAT
GO0006800~oxygen and reactive oxygen species metabolic process
11 3.7 9.52E-06 249934_AT, 266191_AT, 247091_AT, 252238_AT, 260941_AT, 265102_AT, 260035_AT, 250059_AT, 266941_AT, 253998_AT, 264567_S_AT
1.33E-02
GOTERM_MF_FAT
GO0004601~peroxidase activity
12 4.1 1.48E-05 249934_AT, 266191_AT, 254092_AT, 247091_AT, 252238_AT, 260941_AT, 265102_AT, 260035_AT, 250059_AT, 266941_AT, 253998_AT, 264567_S_AT
1.91E-02
GOTERM_MF_FAT
GO0016684~oxidoreductase activity, acting on peroxide as acceptor
12 4.1 1.48E-05 249934_AT, 266191_AT, 254092_AT, 247091_AT, 252238_AT, 260941_AT, 265102_AT, 260035_AT, 250059_AT, 266941_AT, 253998_AT, 264567_S_AT
1.91E-02
GOTERM_MF_FAT
GO0046906~tetrapyrrole binding
19 6.4 1.61E-05 249934_AT, 247091_AT, 252238_AT, 260941_AT, 260035_AT, 266941_AT, 250576_AT, 253998_AT, 264567_S_AT, 264404_AT, 258920_AT, 266191_AT,
2.07E-02

Appendix
222
250651_AT, 267626_AT, 257143_AT, 253502_AT, 265102_AT, 256099_AT, 250059_AT
GOTERM_BP_FAT
GO0042542~response to hydrogen peroxide
11 3.7 2.93E-05 249934_AT, 266191_AT, 247091_AT, 252238_AT, 260941_AT, 265102_AT, 260035_AT, 250059_AT, 266941_AT, 253998_AT, 264567_S_AT
4.08E-02
Cluster3 Enrichment Score 2.9 Count % P-Value Affymetrix ID FDR
GOTERM_BP_FAT
GO0007047~cell wall organizATion
15 5.1 7.82E-06 259525_AT, 260758_AT, 265443_AT, 263229_S_AT, 261099_AT, 251434_AT, 253763_AT, 263560_S_AT, 247871_AT, 262198_AT, 250802_AT, 245546_AT, 265246_AT, 264682_AT, 248406_AT
1.09E-02
GOTERM_BP_FAT
GO0045229~external encapsulATing structure organizATion
15 5.1 9.81E-06 259525_AT, 260758_AT, 265443_AT, 263229_S_AT, 261099_AT, 251434_AT, 253763_AT, 263560_S_AT, 247871_AT, 262198_AT, 250802_AT, 245546_AT, 265246_AT, 264682_AT, 248406_AT
1.37E-02
B) Primed>Control on roots background
Cluster 1 Enrichment Score 5.1 Affymetrix ID Count % P-Value FDR
GOTERM_MF_FAT
GO0020037~heme binding
249934_AT, 247091_AT, 252238_AT, 260941_AT, 260035_AT, 266941_AT, 253998_AT, 250576_AT, 264567_S_AT, 264404_AT, 258920_AT, 266191_AT, 250651_AT, 267626_AT, 254836_AT, 257143_AT, 253502_AT, 265102_AT, 256099_AT, 250059_AT
20 6.8 1.09E-08 1.40E-05
GOTERM_MF_FAT
GO0046906~tetrapyrrole binding
249934_AT, 247091_AT, 252238_AT, 260941_AT, 260035_AT, 266941_AT, 253998_AT, 250576_AT, 264567_S_AT, 264404_AT, 258920_AT, 266191_AT, 250651_AT, 267626_AT, 254836_AT, 257143_AT, 253502_AT, 265102_AT, 256099_AT, 250059_AT
20 6.8 3.22E-08 4.16E-05
GOTERM_BP_FAT
GO0042744~hydrogen peroxide cATabolic process
249934_AT, 266191_AT, 247091_AT, 252238_AT, 260941_AT, 265102_AT, 260035_AT, 250059_AT, 266941_AT, 253998_AT, 264567_S_AT
11 3.7 5.65E-08 7.89E-05
GOTERM_BP_FAT
GO0070301~cellular response to hydrogen peroxide
249934_AT, 266191_AT, 247091_AT, 252238_AT, 260941_AT, 265102_AT, 260035_AT, 250059_AT, 266941_AT, 253998_AT, 264567_S_AT
11 3.7 5.65E-08 7.89E-05
GOTERM_MF_FAT
GO0004601~peroxidase activity
249934_AT, 247091_AT, 252238_AT, 260941_AT, 260035_AT, 266941_AT, 253998_AT, 254912_AT, 264567_S_AT, 266191_AT, 254092_AT, 265102_AT, 250059_AT
13 4.4 6.07E-08 7.83E-05
GOTERM_MF_FAT
GO0016684~oxidoreductase activity, acting on peroxide as acceptor
249934_AT, 247091_AT, 252238_AT, 260941_AT, 260035_AT, 266941_AT, 253998_AT, 254912_AT, 264567_S_AT, 266191_AT, 254092_AT, 265102_AT, 250059_AT
13 4.4 6.07E-08 7.83E-05
GOTERM_BP_FAT
GO0042743~hydrogen peroxide metabolic process
249934_AT, 266191_AT, 247091_AT, 252238_AT, 260941_AT, 265102_AT, 260035_AT, 250059_AT, 266941_AT, 253998_AT, 264567_S_AT
11 3.7 9.10E-08 1.27E-04
GOTERM_MF_FAT
GO0005506~iron ion binding
260298_AT, 260941_AT, 260035_AT, 254912_AT, 250576_AT, 266941_AT, 253998_AT, 264567_S_AT, 264404_AT, 250651_AT, 254092_AT, 267626_AT, 254550_AT, 260148_AT, 265102_AT, 256099_AT, 250059_AT, 249934_AT, 247091_AT, 252238_AT, 260950_S_AT, 258920_AT, 266191_AT, 254836_AT, 260957_AT, 257143_AT, 253502_AT
27 9.2 1.43E-07 1.84E-04
GOTERM_BP_FAT
GO0034614~cellular response to reactive oxygen species
249934_AT, 266191_AT, 247091_AT, 252238_AT, 260941_AT, 265102_AT, 260035_AT, 250059_AT, 266941_AT, 253998_AT, 264567_S_AT
11 3.7 1.90E-07 2.65E-04
GOTERM_BP_FAT
GO0034599~cellular response to oxidATive stress
249934_AT, 266191_AT, 247091_AT, 252238_AT, 260941_AT, 265102_AT, 260035_AT, 250059_AT, 266941_AT, 253998_AT, 264567_S_AT
11 3.7 2.19E-07 3.05E-04
GOTERM_MF_FAT
GO0005509~calcium ion binding
254338_S_AT, 249934_AT, 247091_AT, 257405_AT, 252238_AT, 260941_AT, 260035_AT, 254912_AT, 266941_AT, 253998_AT, 253968_AT, 264567_S_AT, 264391_AT, 266191_AT, 254092_AT, 246302_AT, 248898_AT, 265102_AT, 259064_AT, 250059_AT,
21 7.1 3.43E-07 4.42E-04

Appendix
223
254774_AT
GOTERM_MF_FAT
GO0016209~antioxidant activity
249934_AT, 247091_AT, 252238_AT, 260941_AT, 260035_AT, 266941_AT, 253998_AT, 254912_AT, 264567_S_AT, 266191_AT, 254092_AT, 265102_AT, 250059_AT
13 4.4 4.22E-07 5.45E-04
GOTERM_MF_FAT
GO0009055~electron carrier activity
251196_AT, 249934_AT, 247091_AT, 252238_AT, 258359_S_AT, 260941_AT, 260035_AT, 254912_AT, 266941_AT, 253998_AT, 250576_AT, 264567_S_AT, 264404_AT, 266191_AT, 250651_AT, 266356_AT, 254092_AT, 267626_AT, 254836_AT, 257143_AT, 253502_AT, 265102_AT, 256099_AT, 250059_AT
24 8.1 4.52E-07 5.83E-04
GOTERM_BP_FAT
GO0006800~oxygen and reactive oxygen species metabolic process
249934_AT, 266191_AT, 247091_AT, 252238_AT, 260941_AT, 265102_AT, 260035_AT, 250059_AT, 266941_AT, 253998_AT, 264567_S_AT
11 3.7 1.11E-06 1.55E-03
GOTERM_BP_FAT
GO0042542~response to hydrogen peroxide
249934_AT, 266191_AT, 247091_AT, 252238_AT, 260941_AT, 265102_AT, 260035_AT, 250059_AT, 266941_AT, 253998_AT, 264567_S_AT
11 3.7 2.62E-06 3.66E-03
GOTERM_BP_FAT
GO0000302~response to reactive oxygen species
249934_AT, 266191_AT, 247091_AT, 252238_AT, 260941_AT, 265102_AT, 260035_AT, 250059_AT, 266941_AT, 253998_AT, 264567_S_AT
11 3.7 1.58E-05 2.20E-02
GOTERM_BP_FAT
GO0055114~oxidATion reduction
251196_AT, 260298_AT, 260941_AT, 260035_AT, 254912_AT, 253998_AT, 266941_AT, 250576_AT, 264567_S_AT, 264404_AT, 250651_AT, 254092_AT, 267626_AT, 260148_AT, 265102_AT, 256099_AT, 250059_AT, 249934_AT, 248519_AT, 247091_AT, 252238_AT, 260950_S_AT, 258359_S_AT, 253696_AT, 266191_AT, 254836_AT, 260957_AT, 257143_AT, 253309_AT, 253502_AT, 250958_AT
31 10.5 1.76E-05 2.46E-02
Cluster 2 Enrichment Score 4.8 Affymetrix ID Count % P-Value FDR
GOTERM_MF_FAT
GO0005199~structural constituent of cell wall
256352_AT, 255140_X_AT, 245875_AT, 257679_AT, 258008_AT, 257041_AT, 246652_AT, 250683_X_AT, 250682_X_AT
9 3.1 5.01E-08 6.47E-05
GOTERM_BP_FAT
GO0009664~plant-type cell wall organizATion
259525_AT, 255140_X_AT, 245875_AT, 265443_AT, 261099_AT, 257041_AT, 246652_AT, 247991_AT, 250683_X_AT, 250682_X_AT
10 3.4 3.20E-07 4.46E-04
Cluster 3 Enrichment Score 4.1 Affymetrix ID Count % P-Value FDR
GOTERM_BP_FAT
GO0007047~cell wall organizATion
259525_AT, 260758_AT, 265443_AT, 263229_S_AT, 261099_AT, 253763_AT, 251434_AT, 263560_S_AT, 247871_AT, 262198_AT, 250802_AT, 245546_AT, 265246_AT, 264682_AT, 248406_AT, 247991_AT
16 5.4 5.43E-08 7.57E-05
GOTERM_BP_FAT
GO0045229~external encapsulATing structure organizATion
259525_AT, 260758_AT, 265443_AT, 263229_S_AT, 261099_AT, 253763_AT, 251434_AT, 263560_S_AT, 247871_AT, 262198_AT, 250802_AT, 245546_AT, 265246_AT, 264682_AT, 248406_AT, 247991_AT
16 5.4 7.59E-08 1.06E-04
Cluster 4 Enrichment Score 3.6 Affymetrix ID Count % P-Value FDR
GOTERM_MF_FAT
GO0030599~pectinesterase activity
250802_AT, 265246_AT, 250801_AT, 267287_AT, 248408_AT, 254056_AT, 248406_AT, 246229_AT, 262198_AT
9 3.1 4.66E-06 6.01E-03
Cluster 5 Enrichment Score 1.8 Genes Count % P-Value FDR
GOTERM_BP_FAT
GO0009664~plant-type cell wall organizATion
259525_AT, 255140_X_AT, 245875_AT, 265443_AT, 261099_AT, 257041_AT, 246652_AT, 247991_AT, 250683_X_AT, 250682_X_AT
10 3.4 3.20E-07 4.46E-04
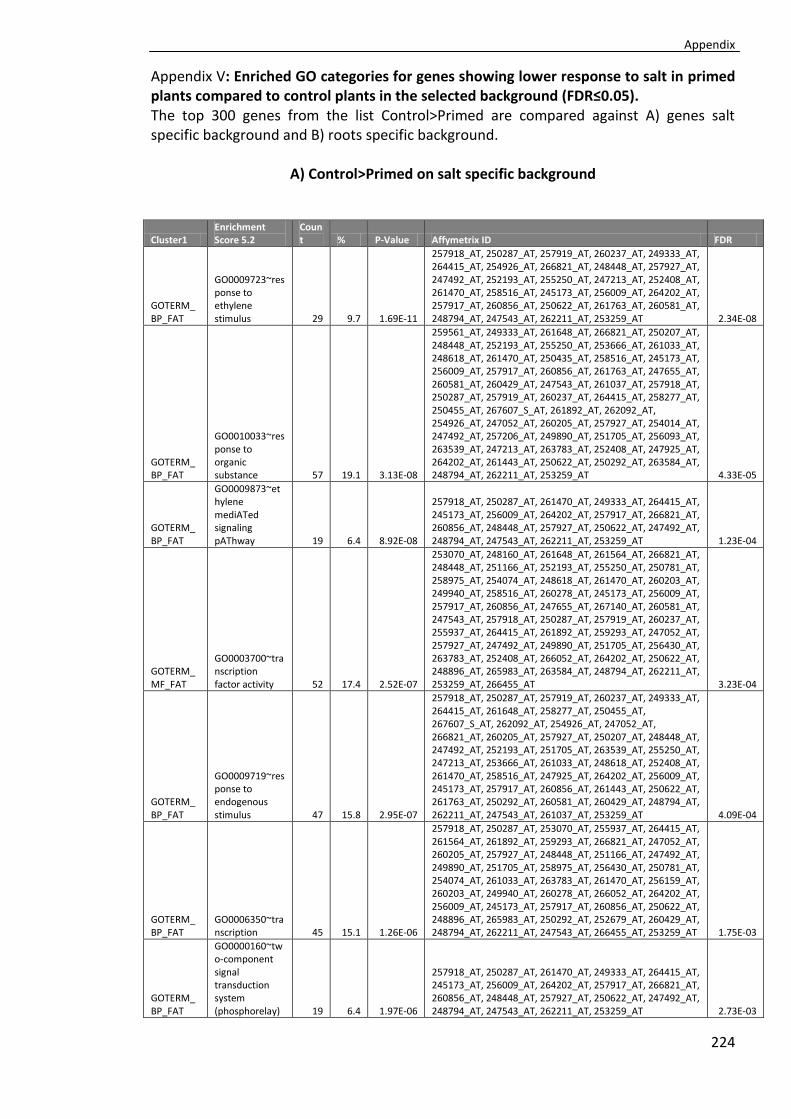
Appendix
224
Appendix V: Enriched GO categories for genes showing lower response to salt in primed plants compared to control plants in the selected background (FDR≤0.05). The top 300 genes from the list Control>Primed are compared against A) genes salt specific background and B) roots specific background.
A) Control>Primed on salt specific background
Cluster1 Enrichment Score 5.2
Count % P-Value Affymetrix ID FDR
GOTERM_BP_FAT
GO0009723~response to ethylene stimulus 29 9.7 1.69E-11
257918_AT, 250287_AT, 257919_AT, 260237_AT, 249333_AT, 264415_AT, 254926_AT, 266821_AT, 248448_AT, 257927_AT, 247492_AT, 252193_AT, 255250_AT, 247213_AT, 252408_AT, 261470_AT, 258516_AT, 245173_AT, 256009_AT, 264202_AT, 257917_AT, 260856_AT, 250622_AT, 261763_AT, 260581_AT, 248794_AT, 247543_AT, 262211_AT, 253259_AT 2.34E-08
GOTERM_BP_FAT
GO0010033~response to organic substance 57 19.1 3.13E-08
259561_AT, 249333_AT, 261648_AT, 266821_AT, 250207_AT, 248448_AT, 252193_AT, 255250_AT, 253666_AT, 261033_AT, 248618_AT, 261470_AT, 250435_AT, 258516_AT, 245173_AT, 256009_AT, 257917_AT, 260856_AT, 261763_AT, 247655_AT, 260581_AT, 260429_AT, 247543_AT, 261037_AT, 257918_AT, 250287_AT, 257919_AT, 260237_AT, 264415_AT, 258277_AT, 250455_AT, 267607_S_AT, 261892_AT, 262092_AT, 254926_AT, 247052_AT, 260205_AT, 257927_AT, 254014_AT, 247492_AT, 257206_AT, 249890_AT, 251705_AT, 256093_AT, 263539_AT, 247213_AT, 263783_AT, 252408_AT, 247925_AT, 264202_AT, 261443_AT, 250622_AT, 250292_AT, 263584_AT, 248794_AT, 262211_AT, 253259_AT 4.33E-05
GOTERM_BP_FAT
GO0009873~ethylene mediATed signaling pAThway 19 6.4 8.92E-08
257918_AT, 250287_AT, 261470_AT, 249333_AT, 264415_AT, 245173_AT, 256009_AT, 264202_AT, 257917_AT, 266821_AT, 260856_AT, 248448_AT, 257927_AT, 250622_AT, 247492_AT, 248794_AT, 247543_AT, 262211_AT, 253259_AT 1.23E-04
GOTERM_MF_FAT
GO0003700~transcription factor activity 52 17.4 2.52E-07
253070_AT, 248160_AT, 261648_AT, 261564_AT, 266821_AT, 248448_AT, 251166_AT, 252193_AT, 255250_AT, 250781_AT, 258975_AT, 254074_AT, 248618_AT, 261470_AT, 260203_AT, 249940_AT, 258516_AT, 260278_AT, 245173_AT, 256009_AT, 257917_AT, 260856_AT, 247655_AT, 267140_AT, 260581_AT, 247543_AT, 257918_AT, 250287_AT, 257919_AT, 260237_AT, 255937_AT, 264415_AT, 261892_AT, 259293_AT, 247052_AT, 257927_AT, 247492_AT, 249890_AT, 251705_AT, 256430_AT, 263783_AT, 252408_AT, 266052_AT, 264202_AT, 250622_AT, 248896_AT, 265983_AT, 263584_AT, 248794_AT, 262211_AT, 253259_AT, 266455_AT 3.23E-04
GOTERM_BP_FAT
GO0009719~response to endogenous stimulus 47 15.8 2.95E-07
257918_AT, 250287_AT, 257919_AT, 260237_AT, 249333_AT, 264415_AT, 261648_AT, 258277_AT, 250455_AT, 267607_S_AT, 262092_AT, 254926_AT, 247052_AT, 266821_AT, 260205_AT, 257927_AT, 250207_AT, 248448_AT, 247492_AT, 252193_AT, 251705_AT, 263539_AT, 255250_AT, 247213_AT, 253666_AT, 261033_AT, 248618_AT, 252408_AT, 261470_AT, 258516_AT, 247925_AT, 264202_AT, 256009_AT, 245173_AT, 257917_AT, 260856_AT, 261443_AT, 250622_AT, 261763_AT, 250292_AT, 260581_AT, 260429_AT, 248794_AT, 262211_AT, 247543_AT, 261037_AT, 253259_AT 4.09E-04
GOTERM_BP_FAT
GO0006350~transcription 45 15.1 1.26E-06
257918_AT, 250287_AT, 253070_AT, 255937_AT, 264415_AT, 261564_AT, 261892_AT, 259293_AT, 266821_AT, 247052_AT, 260205_AT, 257927_AT, 248448_AT, 251166_AT, 247492_AT, 249890_AT, 251705_AT, 258975_AT, 256430_AT, 250781_AT, 254074_AT, 261033_AT, 263783_AT, 261470_AT, 256159_AT, 260203_AT, 249940_AT, 260278_AT, 266052_AT, 264202_AT, 256009_AT, 245173_AT, 257917_AT, 260856_AT, 250622_AT, 248896_AT, 265983_AT, 250292_AT, 252679_AT, 260429_AT, 248794_AT, 262211_AT, 247543_AT, 266455_AT, 253259_AT 1.75E-03
GOTERM_BP_FAT
GO0000160~two-component signal transduction system (phosphorelay) 19 6.4 1.97E-06
257918_AT, 250287_AT, 261470_AT, 249333_AT, 264415_AT, 245173_AT, 256009_AT, 264202_AT, 257917_AT, 266821_AT, 260856_AT, 248448_AT, 257927_AT, 250622_AT, 247492_AT, 248794_AT, 247543_AT, 262211_AT, 253259_AT 2.73E-03

Appendix
225
GOTERM_MF_FAT
GO0030528~transcription regulATor activity 52 17.4 4.67E-06
253070_AT, 248160_AT, 261648_AT, 261564_AT, 266821_AT, 248448_AT, 251166_AT, 252193_AT, 255250_AT, 250781_AT, 258975_AT, 254074_AT, 248618_AT, 261470_AT, 260203_AT, 249940_AT, 258516_AT, 260278_AT, 245173_AT, 256009_AT, 257917_AT, 260856_AT, 247655_AT, 267140_AT, 260581_AT, 247543_AT, 257918_AT, 250287_AT, 257919_AT, 260237_AT, 255937_AT, 264415_AT, 261892_AT, 259293_AT, 247052_AT, 257927_AT, 247492_AT, 249890_AT, 251705_AT, 256430_AT, 263783_AT, 252408_AT, 266052_AT, 264202_AT, 250622_AT, 248896_AT, 265983_AT, 263584_AT, 248794_AT, 262211_AT, 253259_AT, 266455_AT 5.99E-03
GOTERM_BP_FAT
GO0006355~regulATion of transcription, DNA-dependent 40 13.4 5.72E-06
257918_AT, 250287_AT, 257919_AT, 260237_AT, 255937_AT, 264415_AT, 261892_AT, 259293_AT, 247052_AT, 266821_AT, 257927_AT, 248448_AT, 251166_AT, 247492_AT, 252193_AT, 249890_AT, 251705_AT, 255250_AT, 258975_AT, 256430_AT, 250781_AT, 254074_AT, 263783_AT, 248618_AT, 261470_AT, 258516_AT, 260278_AT, 266052_AT, 264202_AT, 256009_AT, 245173_AT, 257917_AT, 260856_AT, 250622_AT, 248896_AT, 265983_AT, 248794_AT, 262211_AT, 247543_AT, 253259_AT 7.91E-03
GOTERM_BP_FAT
GO0051252~regulATion of RNA metabolic process 40 13.4 6.53E-06
257918_AT, 250287_AT, 257919_AT, 260237_AT, 255937_AT, 264415_AT, 261892_AT, 259293_AT, 247052_AT, 266821_AT, 257927_AT, 248448_AT, 251166_AT, 247492_AT, 252193_AT, 249890_AT, 251705_AT, 255250_AT, 258975_AT, 256430_AT, 250781_AT, 254074_AT, 263783_AT, 248618_AT, 261470_AT, 258516_AT, 260278_AT, 266052_AT, 264202_AT, 256009_AT, 245173_AT, 257917_AT, 260856_AT, 250622_AT, 248896_AT, 265983_AT, 248794_AT, 262211_AT, 247543_AT, 253259_AT 9.03E-03
GOTERM_BP_FAT
GO0045449~regulATion of transcription 55 18.5 6.83E-05
253070_AT, 248160_AT, 261564_AT, 266821_AT, 248448_AT, 251166_AT, 252193_AT, 255250_AT, 250781_AT, 258975_AT, 254074_AT, 261033_AT, 248618_AT, 261470_AT, 256159_AT, 260203_AT, 249940_AT, 258516_AT, 260278_AT, 245173_AT, 256009_AT, 257917_AT, 260856_AT, 267140_AT, 260581_AT, 260429_AT, 247543_AT, 257918_AT, 250287_AT, 257919_AT, 260237_AT, 255937_AT, 264415_AT, 261892_AT, 259293_AT, 247052_AT, 260205_AT, 257927_AT, 247492_AT, 249890_AT, 251705_AT, 256430_AT, 263783_AT, 252408_AT, 266052_AT, 264202_AT, 250622_AT, 248896_AT, 250292_AT, 265983_AT, 252679_AT, 248794_AT, 262211_AT, 266455_AT, 253259_AT 9.45E-02
Cluster2 Enrichment Score 3.6
Count % P-Value Affymetrix ID FDR
GOTERM_BP_FAT
GO0009642~response to light intensity 11 3.7 1.18E-05
262148_AT, 250351_AT, 263150_AT, 246099_AT, 251166_AT, 247655_AT, 261648_AT, 247691_AT, 266294_AT, 261037_AT, 265569_AT 1.64E-02
GOTERM_BP_FAT
GO0009644~response to high light intensity 9 3.0 1.90E-05
262148_AT, 250351_AT, 263150_AT, 251166_AT, 261648_AT, 247691_AT, 266294_AT, 261037_AT, 265569_AT 2.62E-02
Cluster3 Enrichment Score 3.0
Count % P-Value Affymetrix ID FDR
GOTERM_BP_FAT
GO0009408~response to heAT 14 4.7 8.81E-06
262148_AT, 263150_AT, 260978_AT, 250296_AT, 262911_S_AT, 247925_AT, 250351_AT, 252515_AT, 251166_AT, 247655_AT, 247691_AT, 266294_AT, 250781_AT, 256430_AT 1.22E-02
GOTERM_BP_FAT
GO0009642~response to light intensity 11 3.7 1.18E-05
262148_AT, 250351_AT, 263150_AT, 246099_AT, 251166_AT, 247655_AT, 261648_AT, 247691_AT, 266294_AT, 261037_AT, 265569_AT 1.64E-02
GOTERM_BP_FAT
GO0009644~response to high light intensity 9 3.0 1.90E-05
262148_AT, 250351_AT, 263150_AT, 251166_AT, 261648_AT, 247691_AT, 266294_AT, 261037_AT, 265569_AT 2.62E-02

Appendix
226
B) Control> Primed on roots background
Cluster1 Enrichment
Score 7.3 Count % P-Value Affymetrix ID FDR
GOTERM_BP_FAT
GO0009723~response to ethylene stimulus 29 9.7 1.18E-14
257918_AT, 250287_AT, 257919_AT, 260237_AT, 249333_AT, 264415_AT, 254926_AT, 266821_AT, 248448_AT, 257927_AT, 247492_AT, 252193_AT, 255250_AT, 247213_AT, 252408_AT, 261470_AT, 258516_AT, 245173_AT, 256009_AT, 264202_AT, 257917_AT, 260856_AT, 250622_AT, 261763_AT, 260581_AT, 248794_AT, 247543_AT, 262211_AT, 253259_AT 1.64E-11
GOTERM_BP_FAT
GO0010033~response to organic substance 57 19.1 1.18E-12
259561_AT, 249333_AT, 261648_AT, 266821_AT, 250207_AT, 248448_AT, 252193_AT, 255250_AT, 253666_AT, 261033_AT, 248618_AT, 261470_AT, 250435_AT, 258516_AT, 245173_AT, 256009_AT, 257917_AT, 260856_AT, 261763_AT, 247655_AT, 260581_AT, 260429_AT, 247543_AT, 261037_AT, 257918_AT, 250287_AT, 257919_AT, 260237_AT, 264415_AT, 258277_AT, 250455_AT, 267607_S_AT, 261892_AT, 262092_AT, 254926_AT, 247052_AT, 260205_AT, 257927_AT, 254014_AT, 247492_AT, 257206_AT, 249890_AT, 251705_AT, 256093_AT, 263539_AT, 247213_AT, 263783_AT, 252408_AT, 247925_AT, 264202_AT, 261443_AT, 250622_AT, 250292_AT, 263584_AT, 248794_AT, 262211_AT, 253259_AT 1.63E-09
GOTERM_BP_FAT
GO0009719~response to endogenous stimulus 47 15.8 1.59E-10
257918_AT, 250287_AT, 257919_AT, 260237_AT, 249333_AT, 264415_AT, 261648_AT, 258277_AT, 250455_AT, 267607_S_AT, 262092_AT, 254926_AT, 247052_AT, 266821_AT, 260205_AT, 257927_AT, 250207_AT, 248448_AT, 247492_AT, 252193_AT, 251705_AT, 263539_AT, 255250_AT, 247213_AT, 253666_AT, 261033_AT, 248618_AT, 252408_AT, 261470_AT, 258516_AT, 247925_AT, 264202_AT, 256009_AT, 245173_AT, 257917_AT, 260856_AT, 261443_AT, 250622_AT, 261763_AT, 250292_AT, 260581_AT, 260429_AT, 248794_AT, 262211_AT, 247543_AT, 261037_AT, 253259_AT 2.20E-07
GOTERM_MF_FAT
GO0003700~transcription factor activity 52 17.4 1.80E-10
253070_AT, 248160_AT, 261648_AT, 261564_AT, 266821_AT, 248448_AT, 251166_AT, 252193_AT, 255250_AT, 250781_AT, 258975_AT, 254074_AT, 248618_AT, 261470_AT, 260203_AT, 249940_AT, 258516_AT, 260278_AT, 245173_AT, 256009_AT, 257917_AT, 260856_AT, 247655_AT, 267140_AT, 260581_AT, 247543_AT, 257918_AT, 250287_AT, 257919_AT, 260237_AT, 255937_AT, 264415_AT, 261892_AT, 259293_AT, 247052_AT, 257927_AT, 247492_AT, 249890_AT, 251705_AT, 256430_AT, 263783_AT, 252408_AT, 266052_AT, 264202_AT, 250622_AT, 248896_AT, 265983_AT, 263584_AT, 248794_AT, 262211_AT, 253259_AT, 266455_AT 2.31E-07
GOTERM_BP_FAT
GO0009873~ethylene mediATed signaling pAThway 19 6.4 3.78E-10
257918_AT, 250287_AT, 261470_AT, 249333_AT, 264415_AT, 245173_AT, 256009_AT, 264202_AT, 257917_AT, 266821_AT, 260856_AT, 248448_AT, 257927_AT, 250622_AT, 247492_AT, 248794_AT, 247543_AT, 262211_AT, 253259_AT 5.23E-07
GOTERM_BP_FAT
GO0000160~two-component signal transduction system (phosphorelay) 19 6.4 1.88E-08
257918_AT, 250287_AT, 261470_AT, 249333_AT, 264415_AT, 245173_AT, 256009_AT, 264202_AT, 257917_AT, 266821_AT, 260856_AT, 248448_AT, 257927_AT, 250622_AT, 247492_AT, 248794_AT, 247543_AT, 262211_AT, 253259_AT 2.60E-05
GOTERM_MF_FAT
GO0030528~transcription regulATor activity 52 17.4 3.32E-08
253070_AT, 248160_AT, 261648_AT, 261564_AT, 266821_AT, 248448_AT, 251166_AT, 252193_AT, 255250_AT, 250781_AT, 258975_AT, 254074_AT, 248618_AT, 261470_AT, 260203_AT, 249940_AT, 258516_AT, 260278_AT, 245173_AT, 256009_AT, 257917_AT, 260856_AT, 247655_AT, 267140_AT, 260581_AT, 247543_AT, 257918_AT, 250287_AT, 257919_AT, 260237_AT, 255937_AT, 264415_AT, 261892_AT, 259293_AT, 247052_AT, 257927_AT, 247492_AT, 249890_AT, 251705_AT, 256430_AT, 263783_AT, 252408_AT, 266052_AT, 264202_AT, 250622_AT, 248896_AT, 265983_AT, 263584_AT, 248794_AT, 262211_AT, 253259_AT, 266455_AT 4.26E-05
GOTERM_BP_FAT
GO0006350~transcription 45 15.1 4.34E-08
257918_AT, 250287_AT, 253070_AT, 255937_AT, 264415_AT, 261564_AT, 261892_AT, 259293_AT, 266821_AT, 247052_AT, 260205_AT, 257927_AT, 248448_AT, 251166_AT, 247492_AT, 249890_AT, 251705_AT, 258975_AT, 256430_AT, 250781_AT, 254074_AT, 261033_AT, 263783_AT, 261470_AT, 256159_AT, 260203_AT, 249940_AT, 260278_AT, 266052_AT, 264202_AT, 6.00E-05
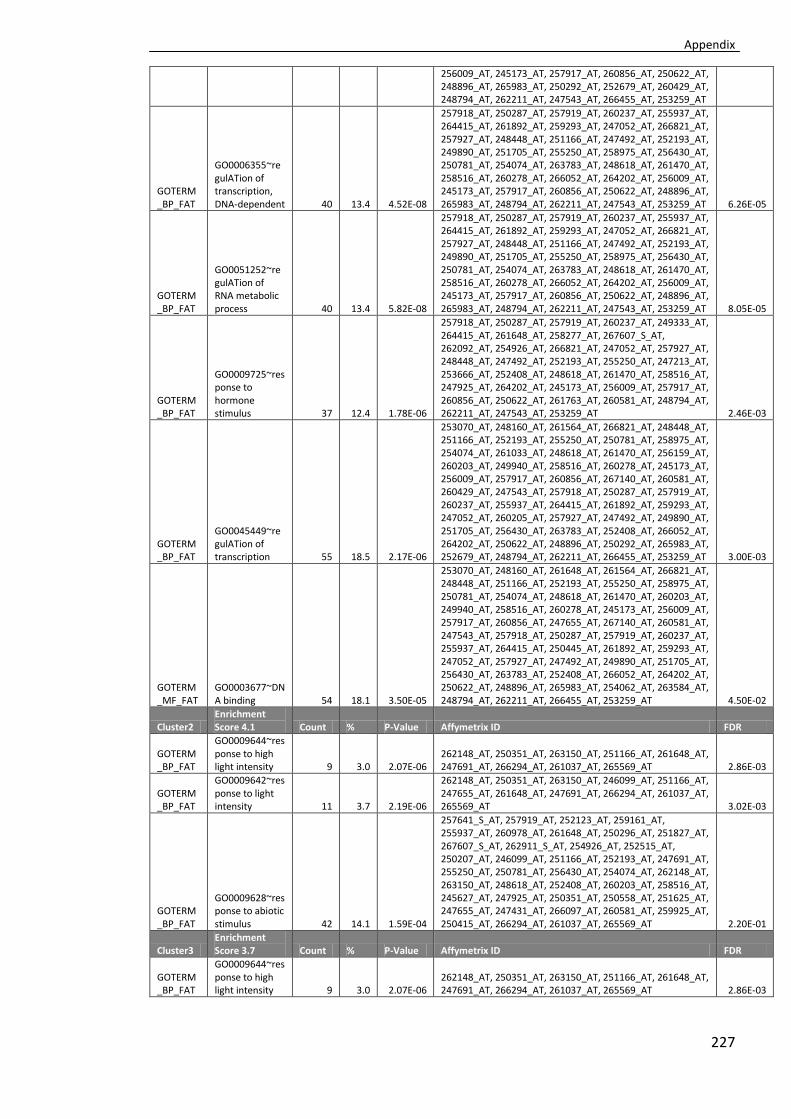
Appendix
227
256009_AT, 245173_AT, 257917_AT, 260856_AT, 250622_AT, 248896_AT, 265983_AT, 250292_AT, 252679_AT, 260429_AT, 248794_AT, 262211_AT, 247543_AT, 266455_AT, 253259_AT
GOTERM_BP_FAT
GO0006355~regulATion of transcription, DNA-dependent 40 13.4 4.52E-08
257918_AT, 250287_AT, 257919_AT, 260237_AT, 255937_AT, 264415_AT, 261892_AT, 259293_AT, 247052_AT, 266821_AT, 257927_AT, 248448_AT, 251166_AT, 247492_AT, 252193_AT, 249890_AT, 251705_AT, 255250_AT, 258975_AT, 256430_AT, 250781_AT, 254074_AT, 263783_AT, 248618_AT, 261470_AT, 258516_AT, 260278_AT, 266052_AT, 264202_AT, 256009_AT, 245173_AT, 257917_AT, 260856_AT, 250622_AT, 248896_AT, 265983_AT, 248794_AT, 262211_AT, 247543_AT, 253259_AT 6.26E-05
GOTERM_BP_FAT
GO0051252~regulATion of RNA metabolic process 40 13.4 5.82E-08
257918_AT, 250287_AT, 257919_AT, 260237_AT, 255937_AT, 264415_AT, 261892_AT, 259293_AT, 247052_AT, 266821_AT, 257927_AT, 248448_AT, 251166_AT, 247492_AT, 252193_AT, 249890_AT, 251705_AT, 255250_AT, 258975_AT, 256430_AT, 250781_AT, 254074_AT, 263783_AT, 248618_AT, 261470_AT, 258516_AT, 260278_AT, 266052_AT, 264202_AT, 256009_AT, 245173_AT, 257917_AT, 260856_AT, 250622_AT, 248896_AT, 265983_AT, 248794_AT, 262211_AT, 247543_AT, 253259_AT 8.05E-05
GOTERM_BP_FAT
GO0009725~response to hormone stimulus 37 12.4 1.78E-06
257918_AT, 250287_AT, 257919_AT, 260237_AT, 249333_AT, 264415_AT, 261648_AT, 258277_AT, 267607_S_AT, 262092_AT, 254926_AT, 266821_AT, 247052_AT, 257927_AT, 248448_AT, 247492_AT, 252193_AT, 255250_AT, 247213_AT, 253666_AT, 252408_AT, 248618_AT, 261470_AT, 258516_AT, 247925_AT, 264202_AT, 245173_AT, 256009_AT, 257917_AT, 260856_AT, 250622_AT, 261763_AT, 260581_AT, 248794_AT, 262211_AT, 247543_AT, 253259_AT 2.46E-03
GOTERM_BP_FAT
GO0045449~regulATion of transcription 55 18.5 2.17E-06
253070_AT, 248160_AT, 261564_AT, 266821_AT, 248448_AT, 251166_AT, 252193_AT, 255250_AT, 250781_AT, 258975_AT, 254074_AT, 261033_AT, 248618_AT, 261470_AT, 256159_AT, 260203_AT, 249940_AT, 258516_AT, 260278_AT, 245173_AT, 256009_AT, 257917_AT, 260856_AT, 267140_AT, 260581_AT, 260429_AT, 247543_AT, 257918_AT, 250287_AT, 257919_AT, 260237_AT, 255937_AT, 264415_AT, 261892_AT, 259293_AT, 247052_AT, 260205_AT, 257927_AT, 247492_AT, 249890_AT, 251705_AT, 256430_AT, 263783_AT, 252408_AT, 266052_AT, 264202_AT, 250622_AT, 248896_AT, 250292_AT, 265983_AT, 252679_AT, 248794_AT, 262211_AT, 266455_AT, 253259_AT 3.00E-03
GOTERM_MF_FAT
GO0003677~DNA binding 54 18.1 3.50E-05
253070_AT, 248160_AT, 261648_AT, 261564_AT, 266821_AT, 248448_AT, 251166_AT, 252193_AT, 255250_AT, 258975_AT, 250781_AT, 254074_AT, 248618_AT, 261470_AT, 260203_AT, 249940_AT, 258516_AT, 260278_AT, 245173_AT, 256009_AT, 257917_AT, 260856_AT, 247655_AT, 267140_AT, 260581_AT, 247543_AT, 257918_AT, 250287_AT, 257919_AT, 260237_AT, 255937_AT, 264415_AT, 250445_AT, 261892_AT, 259293_AT, 247052_AT, 257927_AT, 247492_AT, 249890_AT, 251705_AT, 256430_AT, 263783_AT, 252408_AT, 266052_AT, 264202_AT, 250622_AT, 248896_AT, 265983_AT, 254062_AT, 263584_AT, 248794_AT, 262211_AT, 266455_AT, 253259_AT 4.50E-02
Cluster2 Enrichment Score 4.1 Count % P-Value Affymetrix ID FDR
GOTERM_BP_FAT
GO0009644~response to high light intensity 9 3.0 2.07E-06
262148_AT, 250351_AT, 263150_AT, 251166_AT, 261648_AT, 247691_AT, 266294_AT, 261037_AT, 265569_AT 2.86E-03
GOTERM_BP_FAT
GO0009642~response to light intensity 11 3.7 2.19E-06
262148_AT, 250351_AT, 263150_AT, 246099_AT, 251166_AT, 247655_AT, 261648_AT, 247691_AT, 266294_AT, 261037_AT, 265569_AT 3.02E-03
GOTERM_BP_FAT
GO0009628~response to abiotic stimulus 42 14.1 1.59E-04
257641_S_AT, 257919_AT, 252123_AT, 259161_AT, 255937_AT, 260978_AT, 261648_AT, 250296_AT, 251827_AT, 267607_S_AT, 262911_S_AT, 254926_AT, 252515_AT, 250207_AT, 246099_AT, 251166_AT, 252193_AT, 247691_AT, 255250_AT, 250781_AT, 256430_AT, 254074_AT, 262148_AT, 263150_AT, 248618_AT, 252408_AT, 260203_AT, 258516_AT, 245627_AT, 247925_AT, 250351_AT, 250558_AT, 251625_AT, 247655_AT, 247431_AT, 266097_AT, 260581_AT, 259925_AT, 250415_AT, 266294_AT, 261037_AT, 265569_AT 2.20E-01
Cluster3 Enrichment Score 3.7 Count % P-Value Affymetrix ID FDR
GOTERM_BP_FAT
GO0009644~response to high light intensity 9 3.0 2.07E-06
262148_AT, 250351_AT, 263150_AT, 251166_AT, 261648_AT, 247691_AT, 266294_AT, 261037_AT, 265569_AT 2.86E-03

Appendix
228
GOTERM_BP_FAT
GO0009642~response to light intensity 11 3.7 2.19E-06
262148_AT, 250351_AT, 263150_AT, 246099_AT, 251166_AT, 247655_AT, 261648_AT, 247691_AT, 266294_AT, 261037_AT, 265569_AT 3.02E-03
GOTERM_BP_FAT
GO0009408~response to heAT 14 4.7 2.33E-06
262148_AT, 263150_AT, 260978_AT, 250296_AT, 262911_S_AT, 247925_AT, 250351_AT, 252515_AT, 251166_AT, 247655_AT, 247691_AT, 266294_AT, 250781_AT, 256430_AT 3.22E-03

Appendix
229
Appendix VI complete list of genes with differences between control and priming detected by ChIP-Diff for H3K27me3overlapping between 24h and 10 days roots samples.
Gene ID Description Direction 24h
CoordinATes 24h
Length 24h
Direction 10d
CoordinATes 10d
Length 10d
AT1G05291 unknown protein down Chr11541600-1541800
200 down Chr11541000-1541200
200
AT1G09380 integral membrane family protein / nodulin MtN21-relATed
down Chr13028400-3028600
200 down Chr13029400-3029600
200
AT1G12190 F-box family protein down Chr14134000-4134800
800 down Chr14134200-4134600
400
AT1G12260 ANAC007 (ARABIDOPSIS NAC 007); transcription factor
down Chr14162200-4162800
600 down Chr14162600-4163000
400
AT1G18710 AtMYB47 (myb domain protein 47); DNA binding / transcription factor
down Chr16449800-6450400
600 down Chr16450200-6450400
200
AT1G19800 TGD1 (TRIGALACTOSYLDIACYLGLYCEROL 1); lipid transporter
down Chr16845400-6845600
200 down Chr16845400-6845600
200
AT1G30795 hydroxyproline-rich glycoprotein family protein
down Chr110935400-10935600
200 down Chr110935400-10935600
200
AT1G31875 unknown protein down Chr111442400-11443000
600 down Chr111442600-11442800
200
AT1G47370 Toll-Interleukin-Resistance (TIR) domain-containing protein
down Chr117367400-17368000
600 down Chr117367800-17368000
200
AT1G47786 acyl-protein thioesterase-relATed down Chr117598000-17598400
400 down Chr117598600-17598800
200
AT1G51460 ABC transporter family protein down Chr119080000-19080600
600 down Chr119080000-19080200
200
AT1G51490 BGLU36 (BETA GLUCOSIDASE 36); cATalytic/ cATion binding / hydrolase, hydrolyzing O-glycosyl compounds
down Chr119095200-19095400
200 down Chr119095000-19095400
400
AT1G52070 jacalin lectin family protein down Chr119364800-19365000
200 down Chr119364800-19365000
200
AT1G52140 unknown protein down Chr119405600-19407400
1800 down Chr119406800-19407000
200
AT1G52410 TSA1 (TSK-ASSOCIATING PROTEIN 1); calcium ion binding / protein binding
down Chr119519800-19520600
800 down Chr119520000-19520200
200
AT1G56650 PAP1 (PRODUCTION OF ANTHOCYANIN PIGMENT 1); DNA binding / transcription factor
down Chr121232400-21233000
600 down Chr121232800-21233000
200
AT1G57830 Toll-Interleukin-Resistance (TIR) domain-containing protein
down Chr121420800-21421200
400 down Chr121420800-21421200
400
AT1G59722 unknown protein down Chr121945600-21946600
1000 down Chr121944000-21944200
200
AT1G61630 equilibrATive nucleoside transporter, putATive (ENT7)
down Chr122743400-22744200
800 down Chr122743600-22744200
600
AT1G61750 unknown protein down Chr122805000-22805200
200 down Chr122805000-22805200
200
AT1G62030 DC1 domain-containing protein up Chr122925000-22925200
200 up Chr122924800-22925200
400
AT1G65342 unknown protein down Chr124270800-24271000
200 down Chr124270600-24270800
200
AT1G67710 ARR11 (RESPONSE REGULATOR 11); transcription factor/ two-component response regulATor
down Chr125379600-25380000
400 down Chr125379600-25379800
200
AT1G69090 F-box family protein down Chr125976600-25977400
800 down Chr125977000-25977200
200
AT1G69120 AP1 (APETALA1); DNA binding / protein binding / protein
down Chr125984600-25985400
800 down Chr125984600-25984800
200

Appendix
230
heterodimerizATion/ transcription activATor/ transcription factor
AT1G75920 family II extracellular lipase 5 (EXL5)
down Chr128505200-28505600
400 down Chr128505200-28505400
200
AT2G14710 F-box family protein down Chr26298400-6298600
200 down Chr26298400-6298600
200
AT2G14960 GH3.1 up Chr26452000-6452400
400 up Chr26451800-6452000
200
AT2G16220 F-box family protein down Chr27031600-7032200
600 down Chr27031800-7032000
200
AT2G21890 CAD3 (CINNAMYL ALCOHOL DEHYDROGENASE HOMOLOG 3); binding / cATalytic/ oxidoreductase/ zinc ion binding
down Chr29330400-9330800
400 down Chr29330400-9330800
400
AT2G22180 hydroxyproline-rich glycoprotein family protein
down Chr29430000-9430400
400 down Chr29430200-9430400
200
AT2G23170 GH3.3; indole-3-acetic acid amido synthetase
up Chr29864200-9864600
400 up Chr29864400-9864600
200
AT2G23171 unknown protein down Chr29867000-9867200
200 down Chr29867400-9867600
200
AT2G24205 Encodes a ECA1 gametogenesis relATed family protein
down Chr210292000-10292200
200 down Chr210291600-10291800
200
AT2G25697 unknown protein down Chr210946200-10946800
600 down Chr210946600-10946800
200
AT2G25700 ASK3 (ARABIDOPSIS SKP1-LIKE 3); protein binding / ubiquitin-protein ligase
down Chr210949600-10950200
600 down Chr210950000-10950200
200
AT2G26580 YAB5 (YABBY5); transcription factor
down Chr211305000-11305600
600 down Chr211302800-11303800
1000
AT2G30300 nodulin-relATed down Chr212921400-12921600
200 down Chr212921800-12922000
200
AT2G30760 unknown protein down Chr213107200-13107400
200 down Chr213107400-13107600
200
AT2G31083 CLE5 (CLAVATA3/ESR-RELATED 5); protein binding / receptor binding
down Chr213250400-13251600
1200 down Chr213253000-13253200
200
AT2G32870 meprin and TRAF homology domain-containing protein / MATH domain-containing protein
down Chr213944400-13944600
200 down Chr213944400-13944600
200
AT2G34790 MEE23 (MATERNAL EFFECT EMBRYO ARREST 23); FAD binding / cATalytic/ electron carrier/ oxidoreductase
down Chr214675400-14676200
800 down Chr214676000-14676200
200
AT2G39010 PIP2E (PLASMA MEMBRANE INTRINSIC PROTEIN 2E); wATer channel
down Chr216290600-16291200
600 down Chr216290800-16291200
400
AT3G03200 anac045 (Arabidopsis NAC domain containing protein 45); transcription factor
down Chr3737800-738200
400 down Chr3738000-738200
200
AT3G09390 MT2A (METALLOTHIONEIN 2A); copper ion binding
down Chr32888600-2889000
400 down Chr32888400-2888800
400
AT3G16360 AHP4 (HPT PHOSPHOTRANSMITTER 4); histidine phosphotransfer kinase/ transferase, transferring phosphorus-containing groups
down Chr35553400-5553600
200 down Chr35553800-5554000
200
AT3G18010 WOX1 (WUSCHEL relATed homeobox 1); transcription factor
down Chr36159800-6160400
600 down Chr36160200-6160400
200
AT3G18550 BRC1 (BRANCHED 1); transcription factor
down Chr36381400-6383200
1800 down Chr36382600-6382800
200

Appendix
231
AT3G20160 geranylgeranyl pyrophosphATe synthase, putATive / GGPP synthetase, putATive / farnesyltranstransferase, putATive
up Chr37039200-7039800
600 up Chr37039800-7040000
200
AT3G21840 ASK7 (ARABIDOPSIS SKP1-LIKE 7); protein binding / ubiquitin-protein ligase
down Chr37694800-7695200
400 down Chr37694800-7695200
400
AT3G21850 ASK9 (ARABIDOPSIS SKP1-LIKE 9); protein binding / ubiquitin-protein ligase
down Chr37697800-7698200
400 down Chr37696400-7696600
200
AT3G22080 meprin and TRAF homology domain-containing protein / MATH domain-containing protein
down Chr37779800-7780000
200 down Chr37779800-7780000
200
AT3G25710 BHLH32 (BASIC HELIX-LOOP-HELIX 32); DNA binding / transcription factor
down Chr39368800-9369400
600 down Chr39369200-9369400
200
AT3G29260 short-chain dehydrogenase/reductase (SDR) family protein
down Chr311217200-11218000
800 down Chr311217800-11218000
200
AT3G29970 germinATion protein-relATed down Chr311745200-11746000
800 down Chr311745800-11746200
400
AT3G44780 unknown protein down Chr316320600-16321600
1000 down Chr316321000-16321200
200
AT3G45560 zinc finger (C3HC4-type RING finger) family protein
down Chr316722800-16723400
600 down Chr316723200-16723400
200
AT3G50480 HR4 (HOMOLOG OF RPW8 4) down Chr318732200-18732800
600 down Chr318732400-18732600
200
AT3G51200 auxin-responsive family protein down Chr319019400-19019800
400 down Chr319019400-19019600
200
AT3G55700 UDP-glucoronosyl/UDP-glucosyl transferase family protein
down Chr320672000-20672200
200 down Chr320671800-20672200
400
AT4G00300 fringe-relATed protein up Chr4126800-127200
400 up Chr4126400-126600
200
AT4G01420 CBL5 (CALCINEURIN B-LIKE PROTEIN 5); calcium ion binding
down Chr4579800-580200
400 down Chr4579800-580000
200
AT4G01520 anac067 (Arabidopsis NAC domain containing protein 67); transcription factor
down Chr4657200-657400
200 down Chr4657600-657800
200
AT4G04840 methionine sulfoxide reductase domain-containing protein / SeIR domain-containing protein
down Chr42450000-2451000
1000 down Chr42450200-2450400
200
AT4G04890 PDF2 (PROTODERMAL FACTOR 2); DNA binding / transcription factor
down Chr42480200-2481000
800 down Chr42480200-2480400
200
AT4G10220 unknown protein down Chr46362200-6363200
1000 down Chr46363400-6363600
200
AT4G10350 ANAC070 (Arabidopsis NAC domain containing protein 70); transcription factor
down Chr46414400-6414800
400 up Chr46414200-6414400
200
AT4G11170 disease resistance protein (TIR-NBS-LRR class), putATive
down Chr46811800-6813000
1200 down Chr46812400-6812600
200
AT4G12510 protease inhibitor/seed storage/lipid transfer protein (LTP) family protein
down Chr47416600-7417200
600 down Chr47416600-7417000
400
AT4G12520 protease inhibitor/seed storage/lipid transfer protein (LTP) family protein
down Chr47420600-7421000
400 down Chr47420800-7421000
200
AT4G13420 HAK5 (HIGH AFFINITY K+ TRANSPORTER 5); potassium ion transmembrane transporter/
up Chr47797800-7798200
400 up Chr47797600-7797800
200

Appendix
232
potassium sodium symporter
AT4G19730 glycosyl hydrolase family 18 protein
down Chr410732800-10733400
600 down Chr410733000-10733400
400
AT4G19740 cATalytic/ cATion binding / chitinase/ hydrolase, hydrolyzing O-glycosyl compounds
down Chr410737600-10739200
1600 down Chr410738400-10738600
200
AT4G22030 F-box family protein down Chr411674000-11674200
200 down Chr411674000-11674200
200
AT4G22070 WRKY31; transcription factor down Chr411691000-11691200
200 down Chr411691000-11691200
200
AT4G28840 unknown protein down Chr414240000-14240800
800 down Chr414240200-14240400
200
AT4G29033 Encodes a defensin-like (DEFL) family protein.
down Chr414308600-14309400
800 down Chr414308600-14308800
200
AT4G30590 plastocyanin-like domain-containing protein
down Chr414935400-14935600
200 down Chr414935400-14935600
200
AT5G01310 unknown protein up Chr5125400-125600
200 down Chr5124200-124400
200
AT5G11520 ASP3 (ASPARTATE AMINOTRANSFERASE 3); L-aspartATe2-oxoglutarATe aminotransferase
down Chr53688000-3688400
400 down Chr53688000-3688400
400
AT5G15160 bHLH family protein down Chr54920800-4921400
600 down Chr54921000-4921200
200
AT5G15210 ATHB30 (ARABIDOPSIS THALIANA HOMEOBOX PROTEIN 30); transcription factor
up Chr54938000-4938200
200 up Chr54937800-4938200
400
AT5G15800 SEP1 (SEPALLATA1); DNA binding / transcription factor
down Chr55152800-5153400
600 down Chr55153000-5153200
200
AT5G17100 unknown protein down Chr55625200-5625600
400 down Chr55625200-5625600
400
AT5G17810 WOX12 (WUSCHEL relATed homeobox 12); DNA binding / transcription factor
down Chr55880200-5881800
1600 down Chr55881200-5881800
600
AT5G17960 DC1 domain-containing protein up Chr55946200-5947200
1000 down Chr55945200-5945400
200
AT5G24070 peroxidase family protein down Chr58134800-8135000
200 down Chr58134800-8135000
200
AT5G24820 aspartyl protease family protein up Chr58523800-8524000
200 up Chr58523400-8523800
400
AT5G24910 CYP714A1; electron carrier/ heme binding / iron ion binding / monooxygenase/ oxygen binding
down Chr58570800-8571000
200 down Chr58570800-8571200
400
AT5G25390 SHN2 (shine2); DNA binding / transcription factor
down Chr58819000-8820000
1000 down Chr58819800-8820000
200
AT5G25620 YUC6 (YUCCA6); FAD binding / NADP or NADPH binding / flavin-containing monooxygenase/ monooxygenase/ oxidoreductase
down Chr58937200-8937600
400 down Chr58939000-8939400
400
AT5G25990 unknown protein down Chr59076400-9076600
200 down Chr59075800-9076000
200
AT5G35770 SAP (STERILE APETALA); transcription factor/ transcription regulATor
down Chr513938800-13939800
1000 down Chr513939400-13939800
400
AT5G39560 unknown protein up Chr515842200-15842800
600 up Chr515842400-15842600
200
AT5G40040 60S acidic ribosomal protein P2 (RPP2E)
up Chr516029800-16030200
400 up Chr516029600-16029800
200
AT5G40790 unknown protein down Chr516329200-16330000
800 down Chr516329600-16329800
200
AT5G42590 CYP71A16; electron carrier/ heme binding / iron ion binding /
down Chr517032600-17033200
600 down Chr517032800-17033000
200

Appendix
233
monooxygenase/ oxygen binding
AT5G43120 tetrATricopeptide repeAT (TPR)-containing protein
up Chr517312800-17313200
400 up Chr517313000-17313400
400
AT5G45200 disease resistance protein (TIR-NBS-LRR class), putATive
down Chr518287800-18288800
1000 down Chr518289000-18289200
200
AT5G46350 WRKY8; transcription factor down Chr518801000-18801400
400 down Chr518800400-18800800
400
AT5G57785 unknown protein down Chr523407600-23408400
800 down Chr523408200-23408600
400
AT5G60010 FAD binding / calcium ion binding / electron carrier/ iron ion binding / oxidoreductase/ oxidoreductase, acting on NADH or NADPH, with oxygen as acceptor / peroxidase/ superoxide-generATing NADPH oxidase
down Chr524164600-24165400
800 down Chr524164600-24164800
200
AT5G60970 TCP5 (TEOSINTE BRANCHED1, CYCLOIDEA AND PCF TRANSCRIPTION FACTOR 5); transcription factor
down Chr524534400-24535000
600 down Chr524534600-24534800
200