Docility EPD: A Tool for Temperament Devori W. Beckman Iowa State University.
24
Docility EPD: A Tool for Temperament Devori W. Beckman Iowa State University 2007 NBCEC Brown Bagger Series October 24, 2007
-
Upload
clifton-cannon -
Category
Documents
-
view
216 -
download
0
Transcript of Docility EPD: A Tool for Temperament Devori W. Beckman Iowa State University.

Docility EPD: A Tool for Temperament
Devori W. Beckman
Iowa State University
2007 NBCEC Brown Bagger SeriesOctober 24, 2007

What is Docility?
Temperament – reaction of beef cattle to handling by humans (Burrow, 1997)
Why Measure Docility? Ease of Handling ADG Carcass Quality RFI

Measuring Docility Flight Speed/Time, Exit Velocity Pen Score, Docility Test, Separation Test Chute/Crush Score

Docile Aggressive
Scoring System
1 2 3 4 5 6
BIF Guidelines (2002)
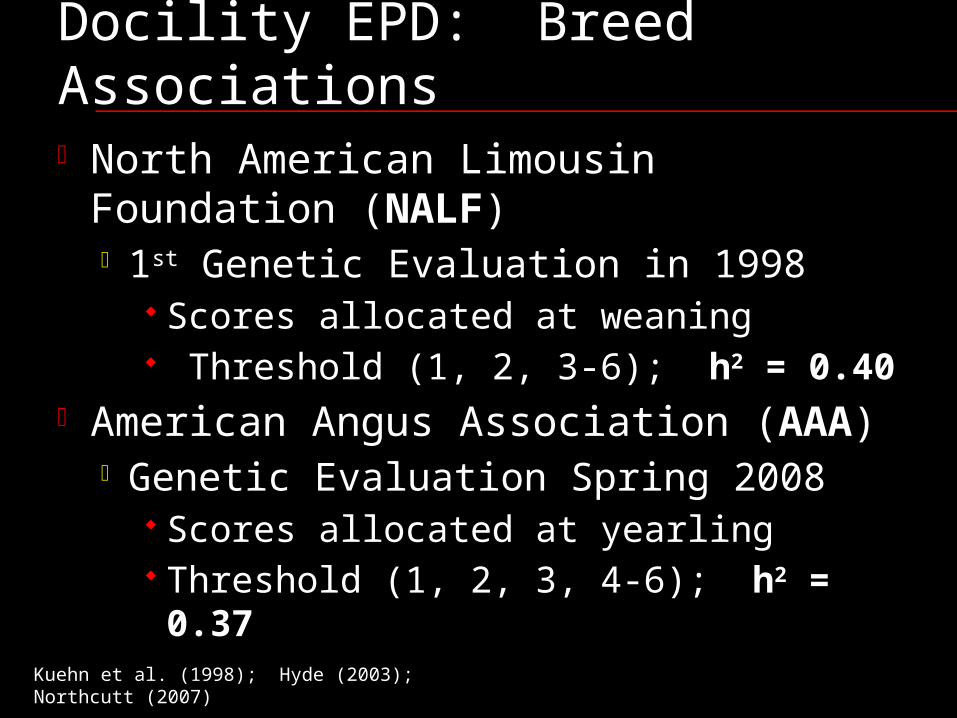
Docility EPD: Breed Associations North American Limousin Foundation (NALF)
1st Genetic Evaluation in 1998 Scores allocated at weaning Threshold (1, 2, 3-6); h2 = 0.40
American Angus Association (AAA) Genetic Evaluation Spring 2008
Scores allocated at yearling Threshold (1, 2, 3, 4-6); h2 = 0.37
Kuehn et al. (1998); Hyde (2003); Northcutt (2007)

Docility EPD: Sire Comparison Example
Bull Docility EPD
Odie + 20
Rowdy - 15
Difference = 35 Docility EPD measured on a percent basis.

Genetic Parameter Estimates For Docility In Limousin
Cattle
1. Maternal (M) Effects on Docility2. Sire by Herd (SH) Effects3. Further Investigation of M and SH Effects

Recent Work: Maternal Effects
Models logL h2D h2
M rDM C2
D -2569 .34 ± .01
DM -2559 .37 ± .03 .05 ± .02 -.41 ± .09
DM-Zero -2564 .31 ± .02 .02 ± .01
DC -2564 .31 ± .02 .03 ± .01
DMC -2554 .38 ± .03 .04 ± .03 -.55 ± .09 .04 ± .01
DMC-Zero -2562 .29 ± .02 .01 ± .01 .02 ± .01
Beckman et al. (2007)

Recent Work: Sire × Herd
Models logL h2D h2
M rDM C2 SH2
DMC -2554 .38 ± .03 .04 ± .03 -.55 ± .09 .04 ± .01
DMSH -2523 .16 ± .03 .02 ± .01 .35 ± .29 .06 ± .01
Notter et al. (1992); CSU - Unpublished Data

Objective
Do Maternal or SH effects appropriately describe docility, or are they artifacts of the nature of this data.

Previous Models Assumed Homogeneity
1 2 3 4 5 60%
5%
10%
15%
20%
25%
30%
35%
40%Docility Score Distribution
Tota
l Obs
erva
tions
, %
Beckman et al. (2007)

Additional Data Filtration
83%
17%
Distribution of Sires Across HerdsSingle Herd Multiple Herds

Additional Data Filtration
63%
37%
Distribution of ProgenySingle Herd Multiple Herds

Assessment of Heterogeneity
Fixed Effects
• WCG• AOD
Random Effects
• Direct• Maternal• SH• Residual
Step 1: Mixed Model (BASE) Analysis

Assessment of Heterogeneity Step 2: Fixed Model

Results: Fixed Model
Source df MS F-value P-value
Sire 262 0.251 2.68 < 0.0001
Herd 185 0.433 4.62 < 0.0001
SH 1160 0.102 1.09 0.027
Beckman and Garrick (2007)

Variance Component Estimation
Mixed Model (RESID) Analysis
|ê| = Xb + ZDuD + ZMuM + ZSHuSH + e

Results: Variance Components
Analysis h2D h2
M rDM SH2
BASE .18 ± .05 .03 ± .02 .13 ± .36 .04 ± .01
RESID .00 ± .00 .00 ± .00 .00 ± .00 .02 ± .01
Beckman and Garrick (2007)

Results: Variance Due to Herd

Conclusions
1. Maternal and SH Interaction Effects were Artifacts of the Data
2. Most of Heterogeneity Due to Herd Effects

Implications
Accuracy of Genetic Evaluation Total Herd Reporting
Garrick and Van Vleck (1987)

What’s Next?
Further Investigation of Heterogeneity
Clustering of Herds

Acknowledgements
North American Limousin Foundation American Angus Association Colorado State University Iowa State University
Thank you!

Image from schooldiscovery.com