. Diversification With Perennials: How Does it Affect Cropping System Performance? Matt Liebman Iowa...
37
. Diversification With Perennials: How Does it Affect Cropping System Performance? Matt Liebman Iowa State University
-
Upload
ursula-cole -
Category
Documents
-
view
214 -
download
0
Transcript of . Diversification With Perennials: How Does it Affect Cropping System Performance? Matt Liebman Iowa...

.
Diversification With Perennials: How Does it Affect Cropping System Performance?
Matt LiebmanIowa State University
A massive loss of perennial cover in
Iowa farmland
•
••

SIMPLIFICATION and HOMOGENEITY of LANDSCAPESCorn and soybean in Iowa: 63% of total land area, 82% of cropland
Wright County, 2011583 sq. miles
(1,509 sq. km.)
Yellow = cornGreen = soybean
USDA-NASS Cropland Data Layer

Iowa, 2011: A remarkable record of production2.4 billion bushels of corn harvested466 million bushels of soybean harvested2.4 million cattle, 38.7 million hogs, and 14.4 billion eggs marketed$30.5 billion of farm income from crops and livestock
http://www.nass.usda.gov/Statistics_by_State/Iowa/Publications/Annual_Statistical_Bulletin/2012/index.asp

Environmental impacts of simple, conventional cropping systems
• Substantial nutrient emissions to water. Nitrogen concentrations in drainage and surface waters are proportional to fertilizer rates and the amount of land used for row crops (Schilling & Libra, 2000; Randall, 2006).
• Frequent detection of herbicides in surface water. Concentrations are proportional to the amounts applied in surrounding areas (Sullivan et al., 2009).
• Herbicide resistance in weeds. More species are evolving resistance and stacked resistances to multiple modes of action are apparent (Beckie, 2006; Heap, 2012).
• Continuing problems with soil erosion. Erosion problems will likely be exacerbated by a greater frequency of high intensity storms (Angel et al., 2005; EWG, 2011; Heathcote et al., 2012).
Can diversifying corn and soybean systems with small grain and forage crops :
• reduce requirements for purchased inputs?• maintain or improve productivity, profitability, and
weed suppression?• reduce susceptibility to certain diseases?• improve environmental performance characteristics?
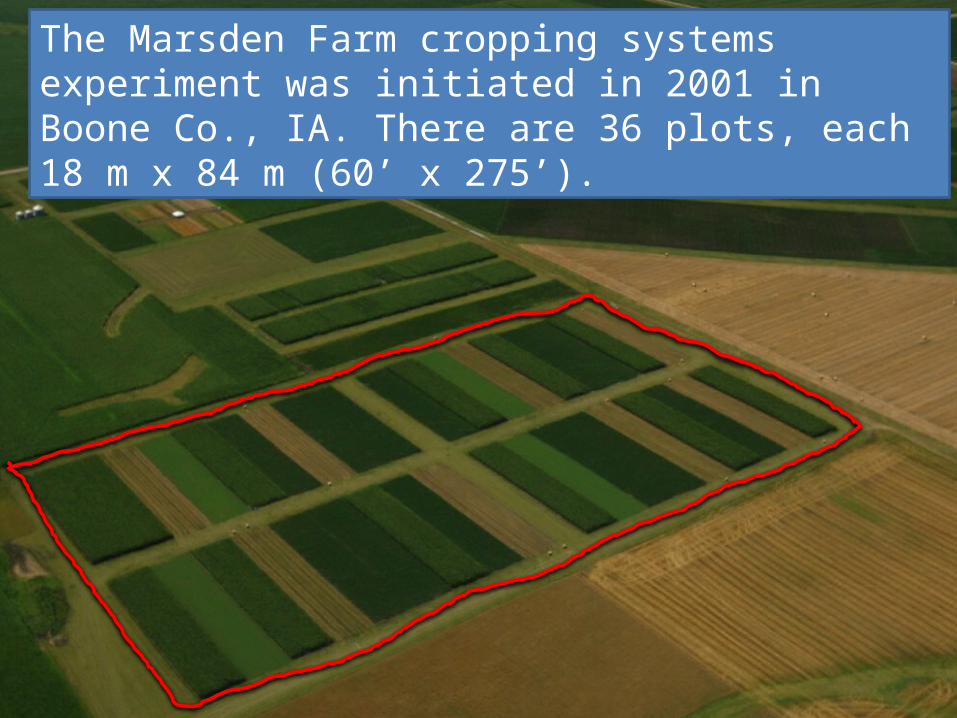
The Marsden Farm cropping systems experiment was initiated in 2001 in Boone Co., IA. There are 36 plots, each 18 m x 84 m (60’ x 275’).

S3 S4 C2 A4 C3 O3 C4 O4 S2 S4 C4 S3 C2 O3 C3 S2 O4 A4
S3S4 C2A4 C3O3 C4O4S2 S4C4 S3C2O3 C3S2 O4 A4
Three rotation systems in four replicate blocks, with each phase of each rotation present each year. June 2012 view.
2-year rotation: corn-soybean (cash grain)3-year rotation: corn-soybean-oat/red clover (green manure)4-year rotation: corn-soybean-oat/alfalfa-alfalfa (hay)

2-year rotation 3-year rotation 4-year rotation
Changes in crop location indifferent rotation systems over time
Year 1
Year 2

Integration of crop and livestock systems:composted beef manure applied to red clover and alfalfa, before corn, in the 3-year and 4-year rotations.

Nitrogen Fertility Management in Contrasting Rotation Systems
Rotation Corn
2-year 100 lb N/acre applied at planting with additional N side-dressed according to test results
3-year and 4-year
(Legume residues + manure)No fertilizer N applied at plantingN side-dressed according to test results

‘Technology packages’ used for corn and soybean
Rotation Corn Soybean
2-year Agrigold 6395 Yield Guard Plus (transgenic)
Broadcast herbicides: Dual II Magnum (S-metolachlor) and Balance Pro (isoxaflutole), or Zidua (pyroxasulfone) and Balance Pro
Kruger 287RR (transgenic)
Broadcast herbicide: Glystar Plus, Roundup PowerMax, or Cornerstone Plus (glyphosate)
3-year and 4-year
Agrigold 6395 (non-transgenic)
Banded herbicides: Callisto (mesotrione) and Steadfast (nicosulfuron + rimsulfuron) or Laudis (tembotrione)
Kruger 2918 (non-transgenic)
Banded herbicides: Select (clethodim), Cobra (lactofen) and Resource (flumiclorac pentyl ester), or Select and Cadet (fluthiacet-methyl)

Reducing herbicide use with multiple tactics in diversified cropping systems
Asynchronous harvests
Bandedherbicides
Stubble clipping &hay removal
Cultivation

Mean annual synthetic N fertilizer and herbicide use, 2006-2013
N fertilizer HerbicidesRotation 2-year 3-year 4-year 2-year 3-year 4-year
kg N/ha kg a.i./haCorn 164 24 21 1.76 0.07 0.07Soybean 2 2 2 1.67 0.14 0.14Oat -- 2 2 -- 0 0Alfalfa -- -- 2 -- -- 0Rotation av. 83 10 7 1.71 0.07 0.05Reduction -88% -91% -96% -97%
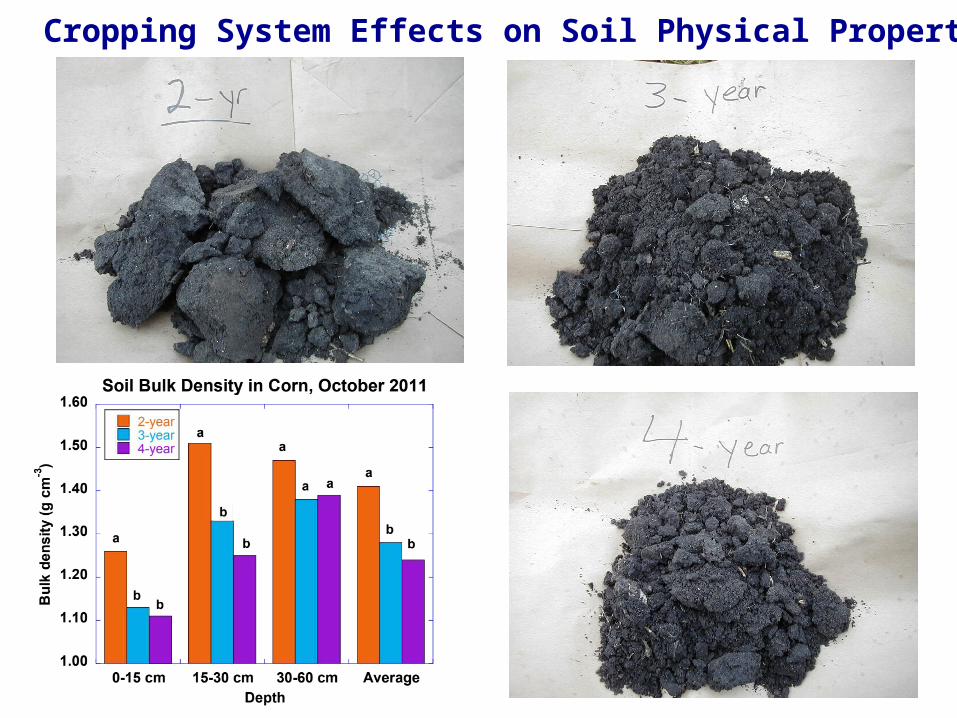
Cropping System Effects on Soil Physical Properties

Soil Quality Indicators in Corn(0-20 cm; average of spring, summer, and fall 2009
and spring 2010 sampling dates)
Rotation Particulate organic matter carbon
Potentially mineralizable nitrogen
mg POM-C cm-3 soil mg PMN cm-3 soil
2-year 1.86 b 30.8 b
3-year 2.44 a 42.1 a
4-year 2.38 a 38.3 a
Source: P. Lazicki & M. Wander, unpublished dataNote: Measurements made in Agrigold 6395BtRW-PRE sub-plots in all rotations.
Soil managed with longer rotations has more POM-C and PMN.

Estimated Soil Erosion (RUSLE2)
Tons per acre per year2-year rotation: 1.363-year rotation: 1.084-year rotation: 0.88

Weeds: three assessment approaches
• Weed biomass in “bulk areas”• Weed seed densities in “bulk areas”
• Weed seed densities in manipulated (“pulse-chase”) subplots
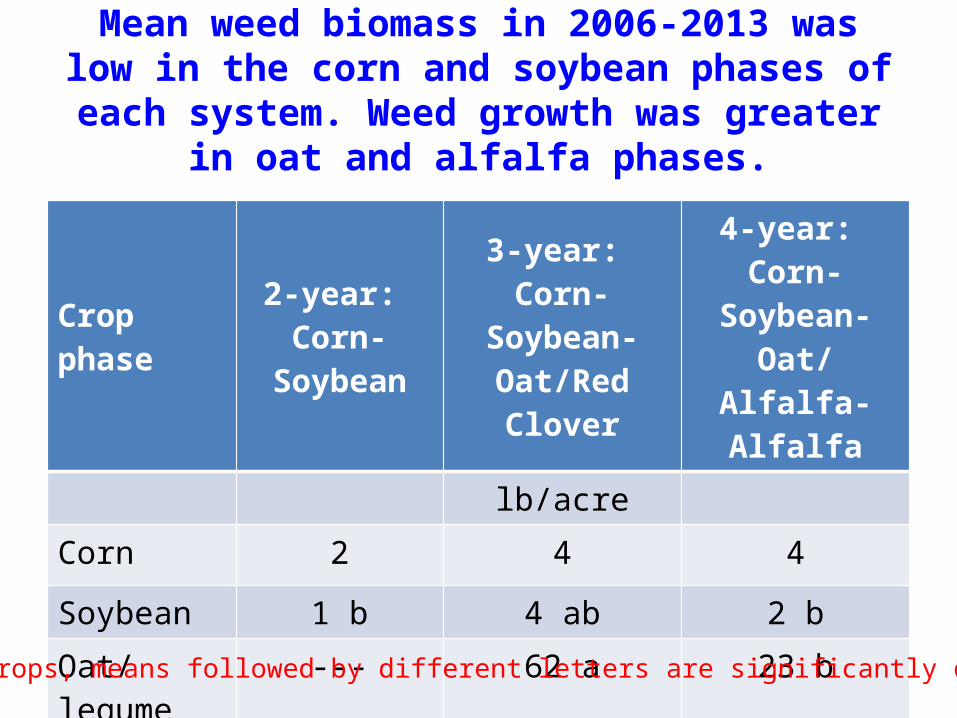
Mean weed biomass in 2006-2013 was low in the corn and soybean phases of each system. Weed growth
was greater in oat and alfalfa phases.
Crop phase 2-year: Corn-Soybean
3-year: Corn-Soybean-Oat/Red Clover
4-year: Corn-Soybean-
Oat/Alfalfa-Alfalfa
lb/acreCorn 2 4 4
Soybean 1 b 4 ab 2 b
Oat/legume --- 62 a 23 b
Alfalfa --- --- 44
Within crops, means followed by different letters are significantly different.

Seedbank sampling
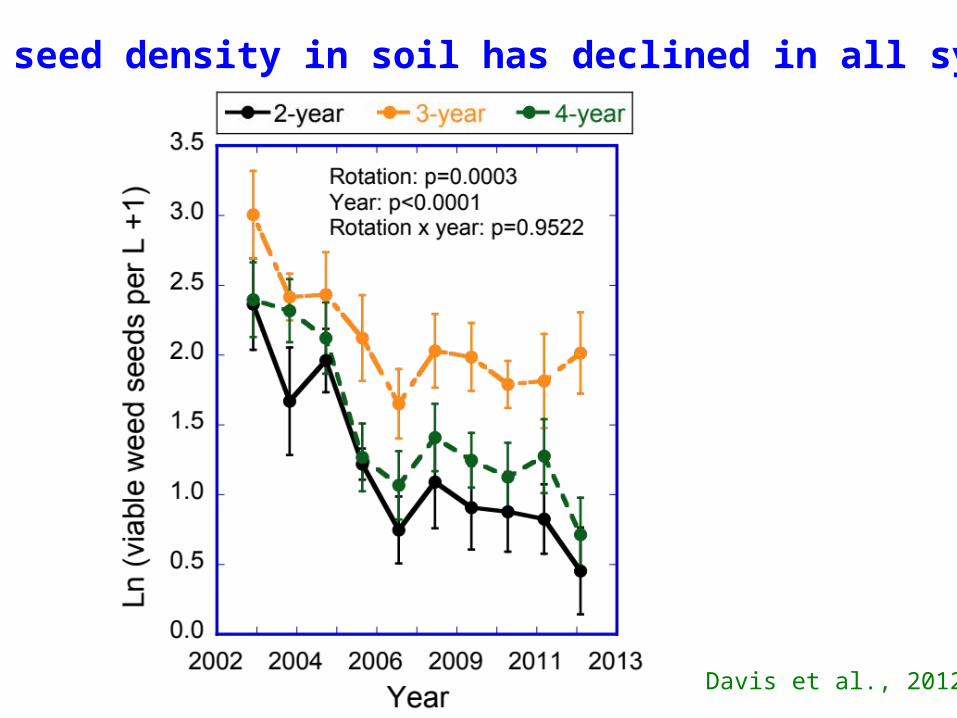
Weed seed density in soil has declined in all systems.
Davis et al., 2012

Assessing weed demography: a pulse-chase approach
7m
7m
18 m
84 m
Background seed bank densities determined in 2002
Weed seeds applied in Nov. 2002:2000 giant foxtail m-2 +
500 velvetleaf m-2
Resulting seed and plant densities measured for four years
Velvetleaf Giant foxtail

Liebman et al., 2008
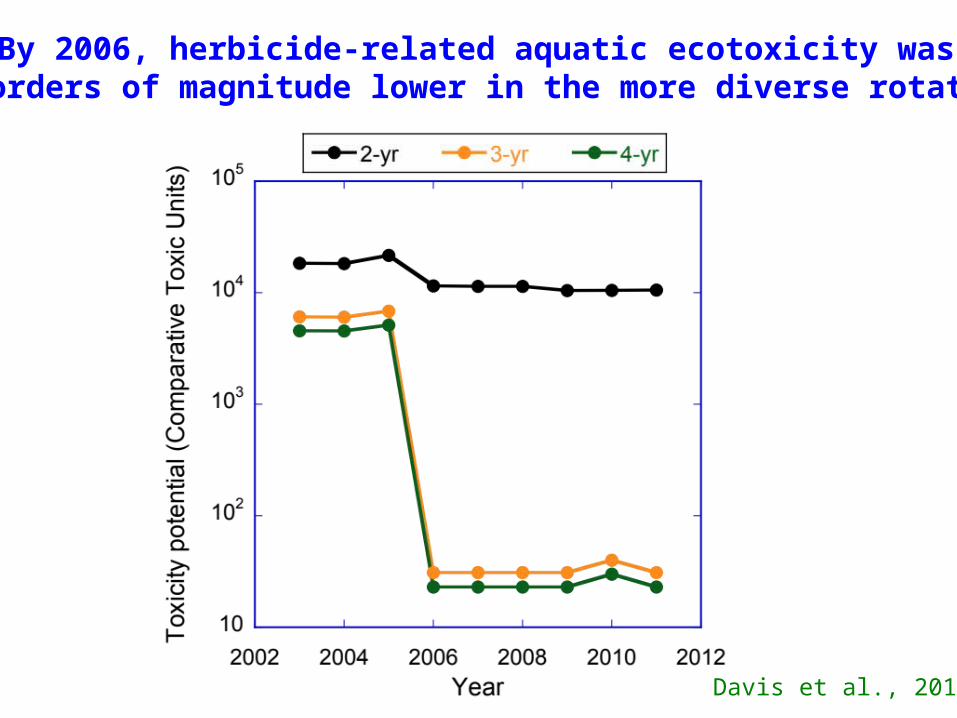
By 2006, herbicide-related aquatic ecotoxicity was two orders of magnitude lower in the more diverse rotations.
Davis et al., 2012

• Caused by a soilborne fungus - Fusarium virguliforme
• Root infection causes root rot and poor root vigor
• Leaf symptoms caused by fungal toxins moved from roots to leaves
• Disease favored by cool, wet weather• Yield losses can be severe
Sudden Death Syndrome
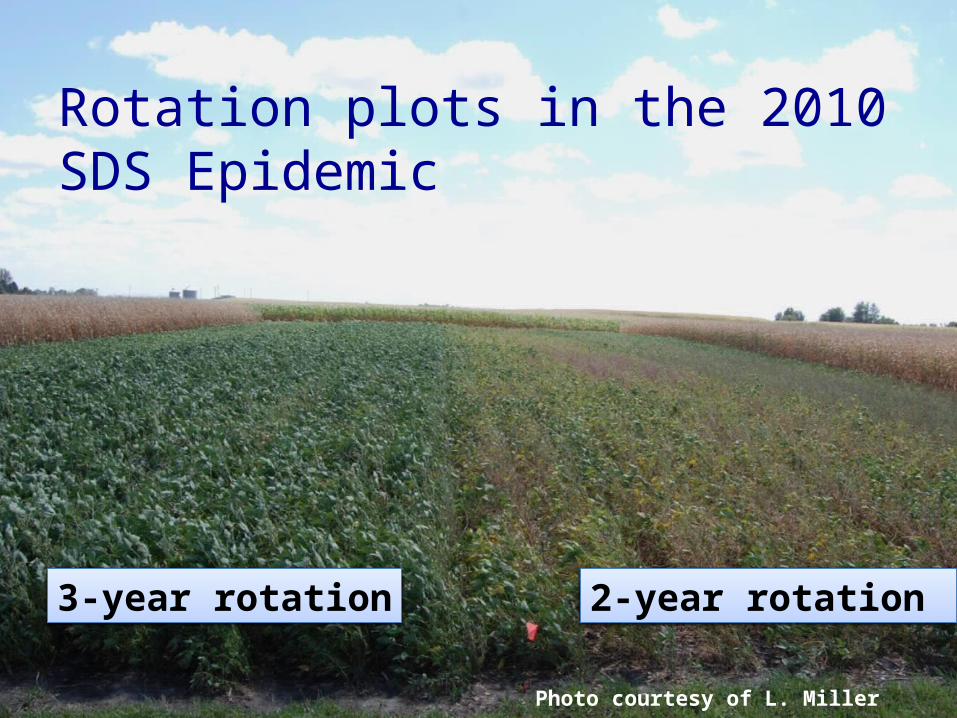
Photo courtesy of L. Miller
3-year rotation
Rotation plots in the 2010 SDS Epidemic
2-year rotation

SDS in 2010: severe disease
2-year 3-year 4-year0
102030405060708090
100
K2918
K287RR
SDS
Inci
denc
e (%
)A
C CC C
B
2-year 3-year 4-year0
102030405060708090
100
K2918
K287RR
SDS
Seve
rity
(%)
A
C
B
D D
CRotation: p=0.0001Variety: p<0.0001Interaction: p=0.1837
Rotation: p<0.0001Variety: p<0.0001Interaction: p<0.0001

SDS in 2011-2013: low disease
2-year 3-year 4-year0
10
20
30
40
50
K2918 K287RR
SDS
Inci
dece
(%)
2-year 3-year 4-year0
10
20
30
40
50
K2918K287RR
SDS
Seve
rity
(%)
A
BB
BB
A
B BB
BB
B
Rotation: p=0.0001Variety: p<0.0001Interaction: p=0.0440
Rotation: p=0.0005Variety: p=0.0017Interaction: p=0.0452
Crop 2-year rotation
3-year rotation
4-year rotation
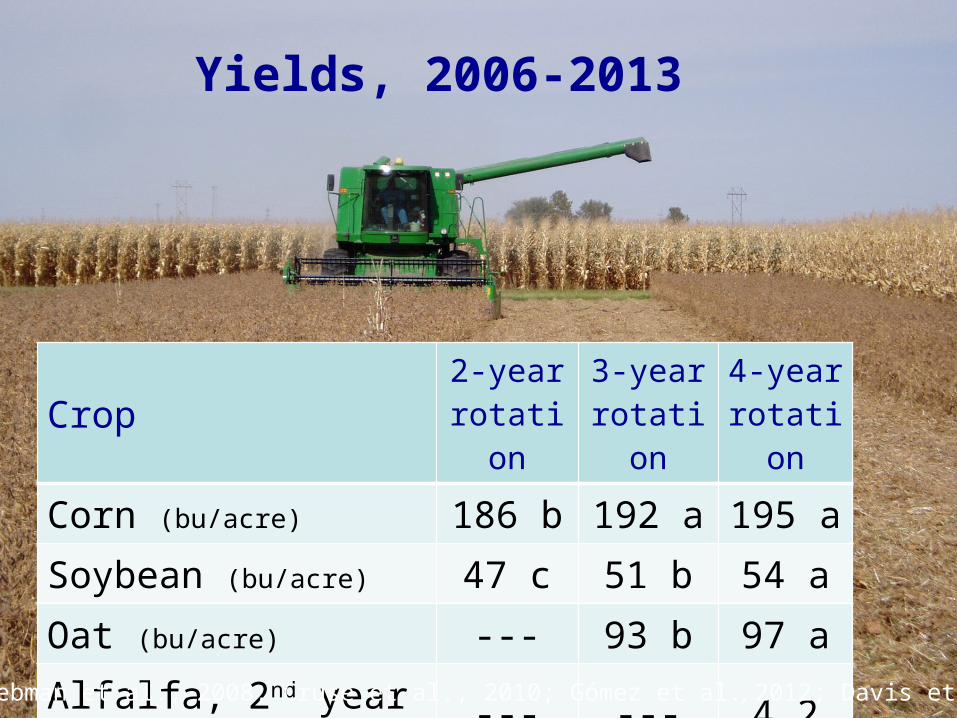
Corn (bu/acre) 186 b 192 a 195 aSoybean (bu/acre) 47 c 51 b 54 aOat (bu/acre) --- 93 b 97 aAlfalfa, 2nd year (tons/acre) --- --- 4.2
Yields, 2006-2013
Sources: Liebman et al., 2008; Cruse et al., 2010; Gómez et al., 2012; Davis et al., 2012.
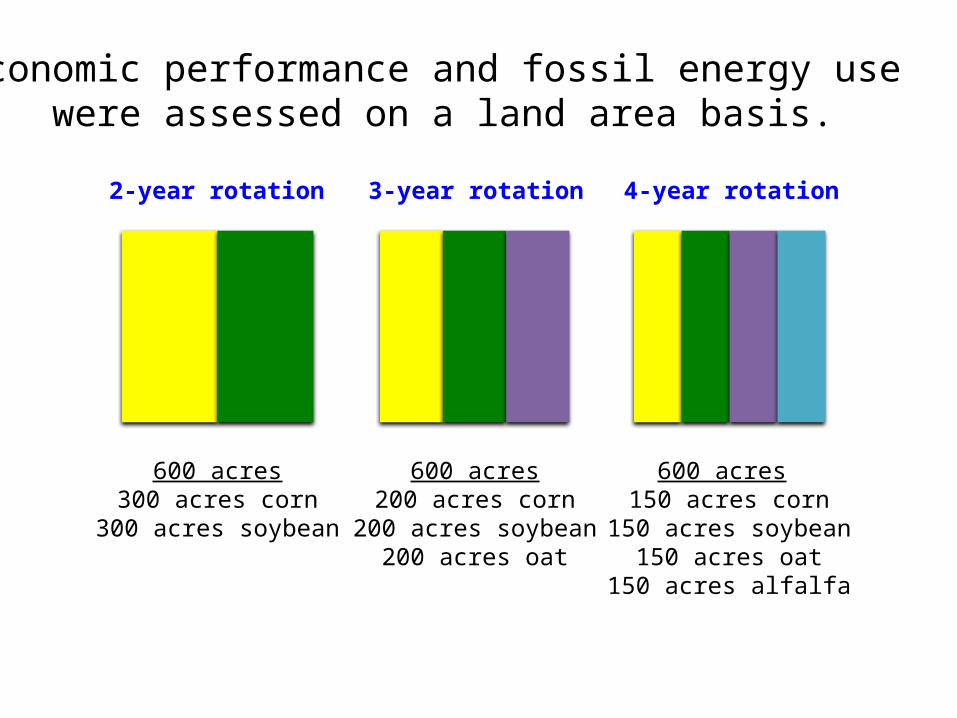
600 acres300 acres corn
300 acres soybean
600 acres200 acres corn
200 acres soybean200 acres oat
600 acres 150 acres corn
150 acres soybean150 acres oat
150 acres alfalfa
2-year rotation 3-year rotation 4-year rotation
Economic performance and fossil energy use were assessed on a land area basis.

Input costs were taken from ISU Extension and Outreach’s annual report “Costs of Crop Production in Iowa,” and from local businesses. Machinery operation costs and labor were based on field notes and ISU E&O’s “Estimating field capacity of farm machines.” Manure was assumed to be generated by on-farm or local livestock and therefore without cost for the material, but with labor and machinery costs for spreading.
Grain and hay prices were taken from marketing year average crop prices as reported annually by the Iowa office of the USDA National Agricultural Statistics Services. Subsidy payments were not included.
Cost and Price Assumptions
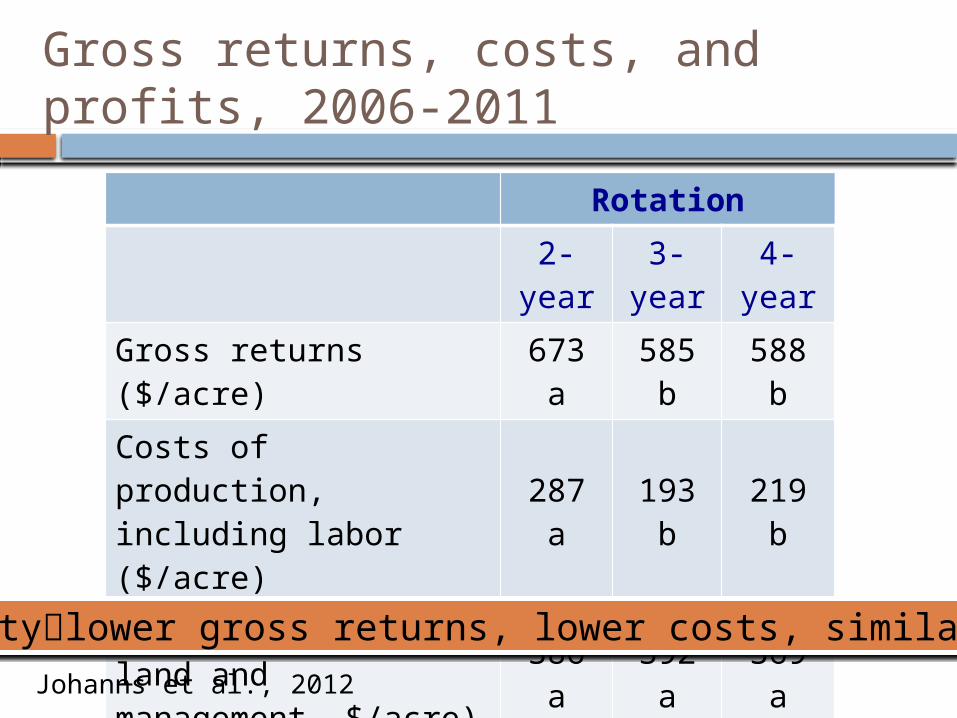
Gross returns, costs, and profits, 2006-2011
Rotation
2-year 3-year 4-year
Gross returns ($/acre) 673 a 585 b 588 b
Costs of production, including labor ($/acre) 287 a 193 b 219 b
Profits (returns to land and management, $/acre) 386 a 392 a 369 a
Diversitylower gross returns, lower costs, similar profitsJohanns et al., 2012

Energy, labor, and profits, 2006-2011
Rotation
2-year 3-year 4-year
Fossil energy inputs (barrels of oil equivalent/acre) 0.61 a 0.24 b 0.26 b p<0.0001
Labor inputs (hr/acre) 0.7 c 1.1 b 1.5 a p<0.0001
Profits (returns to land and management, $/acre) 386 a 392 a 369 a p=0.59
Diversityless energy, more labor, similar profitsDavis et al., 2012
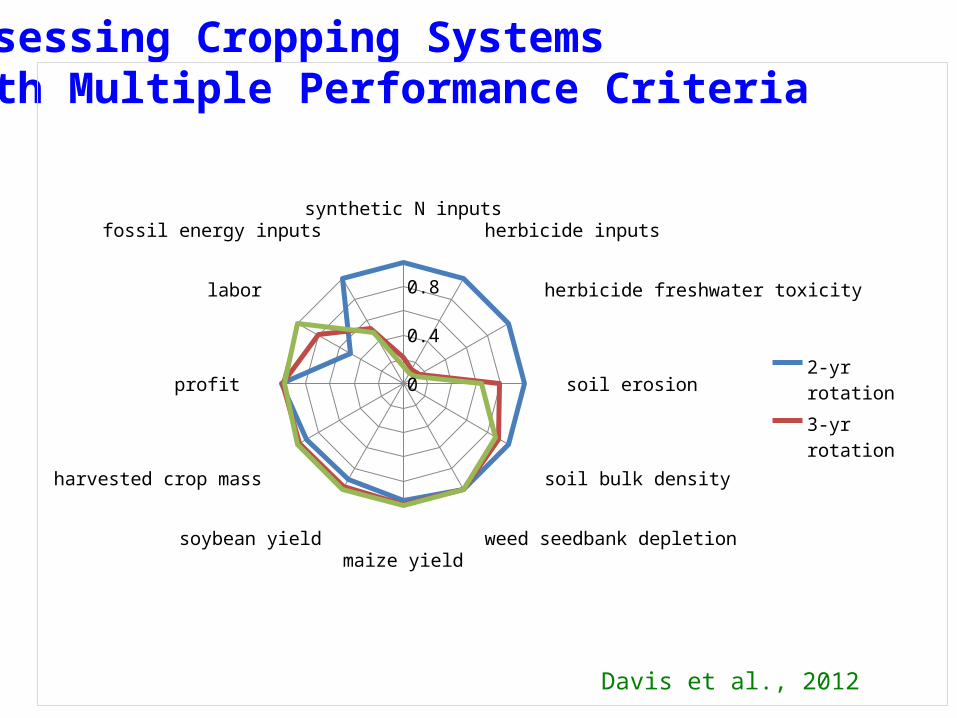
Assessing Cropping Systems with Multiple Performance Criteria
Davis et al., 2012
synthetic N inputsherbicide inputs
herbicide freshwater toxicity
soil erosion
soil bulk density
weed seedbank depletionmaize yield
soybean yield
harvested crop mass
profit
labor
fossil energy inputs
0
0.2
0.4
0.6
0.8
1
2-yr rotation
3-yr rotation
4-yr rotation

Increasing cropping system diversity balances productivity, profitability, and environmental healthDavis et al. 2012. PLoS ONE
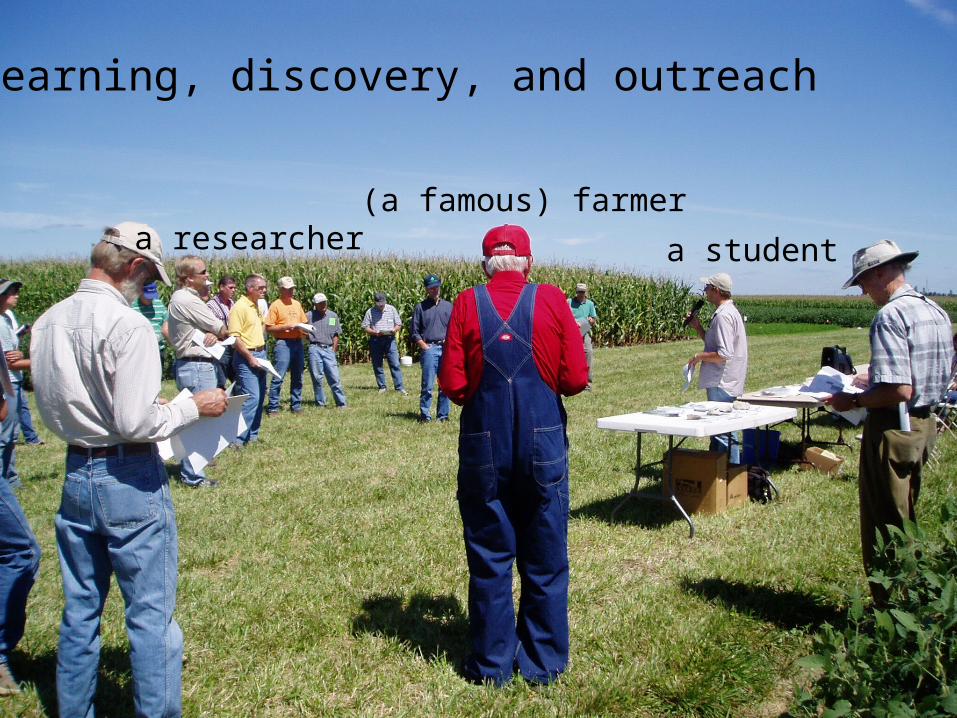
a student
(a famous) farmera researcher
Learning, discovery, and outreach

Special thanks to:• C. Chase• A. Davis• R. Gómez• A. Heggenstaller• J. Hill• D. James
• A. Johanns• L. Leandro• F. Menalled• D. Sundberg• P. Westerman• C. Williams