---------------------------------------------------------- · Determination of enthalpy and entropy...
17
-------------------- Journal of Sebha University-(Pure and Applied Sciences)-Vol.12 No.2 (2013) ------------- 76 ----------------------------------------------------------------------------- Determination of enthalpy and entropy of micellization for Brij-35 and the Effect of salts on critical micellar concentration SALEM MANSOUR MOUSA Sebha university, faculty of science, department of chemistry ------------------------------------------------------------------------------------------------------- Abstract: In this study the thermodynamic parameters of micelle formation for Brij-35 (the nonionic polyoxyethylene ether surfactants Brij 35 (C 12 E 23 i.e. CH 3 (CH 2 ) 11 (OCH 2 CH 2 ) 23 OH) will be determined from kinetics data. The reaction used is the reduction of m-chloroperbenzoic acid by iodide. The initial concentrations of peracid and iodide were 4 x 10 -6 M and 1.5 x 10 -3 M respectively. Reactions were carried out in 0.003 M nitric acid and in presence of sodium sulphate and sodium perchlorate. .The results show that, the Hydrophilic ―salting out‖ sulphate ions increase the rate constant of the reaction in the micelle and reduce the critical micellar concentration (CMC); whereas hydrophobic ―salting in‖ ions perchlorate decrease the rate constant and have much less effect on the CMC. In all different conditions investigated the temperature seems to increase the rate and decrease the critical micelle concentrations. ------------------------------------------------------------------------------------------------------- Introduction When surfactant molecules adsorb at an interface they provide an expanding force and cause the interfacial tension to decrease (at least up to the CMC). This is illustrated by the general Gibbs adsorption equation, from which the surface excess concentration of a surfactant in a monolayer and the area per adsorbed molecule can be calculated. Numerous examples are given by Rosen 1 . The micelle formation thermodynamics are based on the Gibss equation ΔG = ΔH - TΔS. The process of micelle formation at room temperature is assumed to be characterized by small positive values
Transcript of ---------------------------------------------------------- · Determination of enthalpy and entropy...
---------------------------------------- JJoouurrnnaall ooff SSeebbhhaa UUnniivveerrssiittyy--((PPuurree aanndd AApppplliieedd SScciieenncceess))--VVooll..1122 NNoo..22 ((22001133)) --------------------------
76
-----------------------------------------------------------------------------
Determination of enthalpy and entropy of micellization for
Brij-35 and the Effect of salts on critical micellar
concentration
SALEM MANSOUR MOUSA
Sebha university, faculty of science, department of chemistry
-------------------------------------------------------------------------------------------------------
Abstract:
In this study the thermodynamic parameters of micelle formation for Brij-35 (the
nonionic polyoxyethylene ether surfactants Brij 35 (C12E23 i.e.
CH3(CH2)11(OCH2CH2)23OH) will be determined from kinetics data. The reaction
used is the reduction of m-chloroperbenzoic acid by iodide. The initial concentrations
of peracid and iodide were 4 x 10⁻⁶
M and 1.5 x 10⁻³
M respectively. Reactions were
carried out in 0.003 M nitric acid and in presence of sodium sulphate and sodium
perchlorate. .The results show that, the Hydrophilic ―salting out‖ sulphate ions
increase the rate constant of the reaction in the micelle and reduce the critical micellar
concentration (CMC); whereas hydrophobic ―salting in‖ ions perchlorate decrease the
rate constant and have much less effect on the CMC. In all different conditions
investigated the temperature seems to increase the rate and decrease the critical
micelle concentrations.
-------------------------------------------------------------------------------------------------------
Introduction
When surfactant molecules adsorb at
an interface they provide an expanding
force and cause the interfacial tension
to decrease (at least up to the CMC).
This is illustrated by the general Gibbs
adsorption equation, from which the
surface excess concentration of a
surfactant in a monolayer and the area
per adsorbed molecule can be
calculated. Numerous examples are
given by Rosen1. The micelle
formation thermodynamics are based
on the Gibss equation ΔG = ΔH - TΔS.
The process of micelle formation at
room temperature is assumed to be
characterized by small positive values

Determination of enthalpy and entropy of micellization for-----------------------------------------
---------------------------------------- JJoouurrnnaall ooff SSeebbhhaa UUnniivveerrssiittyy--((PPuurree aanndd AApppplliieedd SScciieenncceess))--VVooll..1122 NNoo..22 ((22001133)) --------------------------
76
of enthalpy, and high positive values of
entropy, which is considered to be the
main driving force for the process.
This high positive value of ΔS is in
contrast to the aggregation process in
which the system become more
ordered as one single entity (micelle) is
formed from many monomers, and
should result in negative contribution
to entropy as the formation of micelle
leads to order of surfactant monomer.
Also, ΔH should be larger since
hydrocarbon groups have very little
solubility in water and hence a high
enthalpy of solution.
The larger entropy increase of
micellization in aqueous medium has
been explained in two ways2, 3
. The
first is based on the structure of water
during the formation of micelle, and as
the hydrophobic residues aggregate the
highly structured water around each
chain collapses back to bulk water,
which accounts for the large gain in
entropy of micellization. The second
factor is the increased movement of
hydrocarbon chains in the non-polar
interior of the micelle compared to the
aqueous phase 2, 3
.
The surface tension of an aqueous
solution shows little change when the
concentration of surfactant exceeds the
CMC. This well-known behavior
suggests that micelles can be
approximated as a phase since the
chemical potential is kept nearly
constant, irrespective of the amount of
the material 1.
There are two models which are used
to describe the micelle formation: one
is called the mass action model in
which the micelle and monomers are in
equilibrium, and the other is the phase
separation model in which the micelle
is considered to constitute a new phase
in the system at and above the CMC.
These two models are well
documented in literature and have been
explained by Engberts 4.
The process of micelle formation can
be described as equilibrium between
surfactant monomer and micelles,
which in the case of non-ionic
surfactants can be expressed by
Equation 1 below5:
nS Sn 1
Where n is the number of molecules of
surfactants S, associating with micelle
Sn, and the equilibrium between
micelle and monomers is assumed with
corresponding equilibrium constant
Km:

-------------------------------------------------------------------------------- SALEM MANSOUR MOUSA
---------------------------------------- JJoouurrnnaall ooff SSeebbhhaa UUnniivveerrssiittyy--((PPuurree aanndd AApppplliieedd SScciieenncceess))--VVooll..1122 NNoo..22 ((22001133)) --------------------------
76
[ ]
[ ]
The brackets indicate the concentration
and n, the number of monomers in the
micelle, aggregation number.
From Equation 2, the standard free
energy of micellization per mole of
micelle is given by:
The standard free energy change per
mole of monomer can be obtained by
dividing the pervious equation by n
(aggregation number) which is
assumed to be about 100 times larger
for many micellar systems. It is also
assumed that S is approximately equal
to Sn at the CMC. Thus, the first term
in the right hand of the equation can be
ignored and the free energy of
micellization per mole of surfactant
becomes as shown in Equation 4,
assuming S is approximately equal to
Sn at the CMC 5, 6
.
2. Experimental section
2.1 Materials
Meta-chloroperbenzoic acid
(MCPBA, it is molecular formula C7H5
Cl O3) was purchased from Sigma
Chemical Company with purity of
80%, the main impurity is the parent
acid, metachlorobenzoic acid.
Potassium iodide ( Analar reagent,
99.5%), sulphuric acid with minimum
assay of (95%), were obtained from
Aldrich. Sodium thiosulphate and
perchlorate (99%) were purchased
from Fisher Chemical Company and
nitric acid which obtained from
Aldrich. The reactants and reagents
were prepared in distilled water.
2.2. Methods:
2.2.1. Solutions preparation
Solutions of meta-chloroprerbenzoic
acid were prepared normally by adding
the required amount to distilled water
and stirring for about an hour using a
magnetic stirrer. The solution was
filtered with a Duran Buchner funnel,
75 ml, with sintered disc 45 mm and
pore diameter 16-40 micrometer. The
concentration of MCPBA was
determined iodometrically as described
below. The required concentration for
the working solution was obtained by
further dilution in distilled water. The
stock solutions of the MCPBA
Determination of enthalpy and entropy of micellization for-----------------------------------------
---------------------------------------- JJoouurrnnaall ooff SSeebbhhaa UUnniivveerrssiittyy--((PPuurree aanndd AApppplliieedd SScciieenncceess))--VVooll..1122 NNoo..22 ((22001133)) --------------------------
67
required regular standardisation due to
their decomposition.
2.2.2. Metachloroperbenzoic acid
determination
The general method is as follows.
About 5 ml of 0.03 M potassium
iodide and 10 ml of 2 M sulphuric acid
were mixed in a 250 ml conical flask
and 5.0 ml of the peracid was added by
pipette and the mixture mixed
thoroughly. The liberated iodine was
titrated with the standard solution of
sodium thiosulphate, 0.01 M, a small
amount of iodine indicator was added
toward the end of the titration. The end
point is determined by the change of
colour from pale blue to colourless.
RCO3H + 2 I-
+ 2 H+
RCO2H + H2O + I2
2 S2O32-
+ I2 S4O62-
+
2 I-
It can be seen from the equations
above that
2I-≡ 2S2O3
-2 ≡ RCO3H
Therefore the strength of
metachloroperbenzoic acid can be
calculated by the following equation.
[MCPBA] = V of Na2S2O3 × .01 M / 2
× volume of MCPBA
[MCPBA] = 0.01 × titre / 10
So the measured volume of Na2S2O3
in cm3
is directly equal to the
concentration of MCPBA in 10-3
mol
dm-3
2.3. Stopped flow method
A SX-17MV Stopped Flow Reaction
Analyser from Applied Photophysics
was used to measure the rate of the
reaction between iodide and meta-
chloroperbenzoic acid, this reaction is
known to be very fast so a stopped-
flow is required.
Calibration of the stopped flow is
carried out before every experiment
using distilled water in both syringes.
Following that, the syringes are filled
with the relevant solutions. Air bubbles
are removed before the runs by
flushing backward and forward
between the drive syringes and the
reservoir syringes many times.
The kinetic run and the depression of
the two reactants from syringes into
the reactor chamber is done
automatically, this forces the unreacted
solution into the flow cell and also
forces the reacted solution out of the
-------------------------------------------------------------------------------- SALEM MANSOUR MOUSA
---------------------------------------- JJoouurrnnaall ooff SSeebbhhaa UUnniivveerrssiittyy--((PPuurree aanndd AApppplliieedd SScciieenncceess))--VVooll..1122 NNoo..22 ((22001133)) --------------------------
67
cell. The concentration of triiodide
formed is measured by mean of its
absorption of ultra violet light.
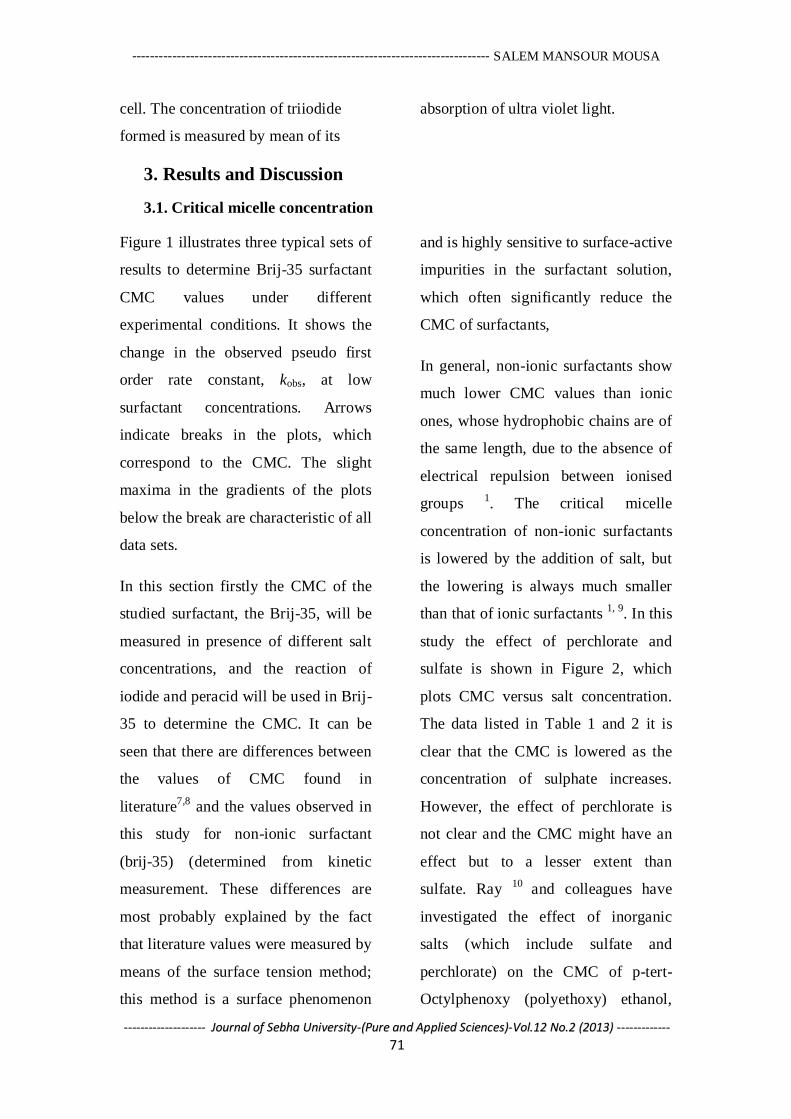
3. Results and Discussion
3.1. Critical micelle concentration
Figure 1 illustrates three typical sets of
results to determine Brij-35 surfactant
CMC values under different
experimental conditions. It shows the
change in the observed pseudo first
order rate constant, kobs, at low
surfactant concentrations. Arrows
indicate breaks in the plots, which
correspond to the CMC. The slight
maxima in the gradients of the plots
below the break are characteristic of all
data sets.
In this section firstly the CMC of the
studied surfactant, the Brij-35, will be
measured in presence of different salt
concentrations, and the reaction of
iodide and peracid will be used in Brij-
35 to determine the CMC. It can be
seen that there are differences between
the values of CMC found in
literature7,8
and the values observed in
this study for non-ionic surfactant
(brij-35) (determined from kinetic
measurement. These differences are
most probably explained by the fact
that literature values were measured by
means of the surface tension method;
this method is a surface phenomenon
and is highly sensitive to surface-active
impurities in the surfactant solution,
which often significantly reduce the
CMC of surfactants,
In general, non-ionic surfactants show
much lower CMC values than ionic
ones, whose hydrophobic chains are of
the same length, due to the absence of
electrical repulsion between ionised
groups 1. The critical micelle
concentration of non-ionic surfactants
is lowered by the addition of salt, but
the lowering is always much smaller
than that of ionic surfactants 1, 9
. In this
study the effect of perchlorate and
sulfate is shown in Figure 2, which
plots CMC versus salt concentration.
The data listed in Table 1 and 2 it is
clear that the CMC is lowered as the
concentration of sulphate increases.
However, the effect of perchlorate is
not clear and the CMC might have an
effect but to a lesser extent than
sulfate. Ray 10
and colleagues have
investigated the effect of inorganic
salts (which include sulfate and
perchlorate) on the CMC of p-tert-
Octylphenoxy (polyethoxy) ethanol,
Determination of enthalpy and entropy of micellization for-----------------------------------------
---------------------------------------- JJoouurrnnaall ooff SSeebbhhaa UUnniivveerrssiittyy--((PPuurree aanndd AApppplliieedd SScciieenncceess))--VVooll..1122 NNoo..22 ((22001133)) --------------------------
67
OPE30 and OPE9-10 in aqueous solution
at 25oC. Their findings show that the
CMC is lowered by all salts except
Lithium iodide, which increases the
CMC. By plotting CMC versus salt
concentration it was found that the
sulphate is the ion most effective at
lowering the CMC and has the steepest
slope, while the perchlorate has less of
an effect that the sulphate. Ray 10
concluded that the reduction in the
CMC was due to the salting out or in
of the hydrocarbon moiety of the
detergent.
The CMC is essentially independent of
sodium perchlorate concentration,
whereas for sodium sulfate it drops
linearly, as shown in Figure 2.
However, in general the CMC values
in the presence of perchlorate is higher
than in its absence, while the opposite
is true for sulphate. This indicates the
salting in and out effect of perchlorate
and sulfate respectively.

-------------------------------------------------------------------------------- SALEM MANSOUR MOUSA
---------------------------------------- JJoouurrnnaall ooff SSeebbhhaa UUnniivveerrssiittyy--((PPuurree aanndd AApppplliieedd SScciieenncceess))--VVooll..1122 NNoo..22 ((22001133)) --------------------------
67
Figure 1: Observed rate constant versus logarithm of Brij-35 concentration for the
reaction in water (a), 0.35 M sulfate (b), and 1 M perchlorate (c) at 25oC.
c
0 0.010.0010.00011e-005
25
20
15
10
5
log[Brij-35]
k obs
/ s-1
0 0.010.0010.00011e-005
28
24
20
16
12
8
log[Brij-35]
k obs / s
-1
0 0.010.0010.0001
9
8
7
6
log[Brij-35]
k obs/s
-1
a
b

Determination of enthalpy and entropy of micellization for-----------------------------------------
---------------------------------------- JJoouurrnnaall ooff SSeebbhhaa UUnniivveerrssiittyy--((PPuurree aanndd AApppplliieedd SScciieenncceess))--VVooll..1122 NNoo..22 ((22001133)) --------------------------
67
Figure 2: Critical micellar concentrations at different added salt concentrations.
Squares represent perchlorate and diamonds represent sulfate.
Table 1: Effect of sodium sulfate on the CMC for the reaction of ca. 4 x 10⁻⁶
M
MCPBA and 1.5 x 10⁻³
M iodide in 3.0 x 10⁻³
M nitric acid at 25oC.
[Na2SO4], M (kobs)o, s-1
CMC,
10-4
M
0.07 8.7 3.6
0.13 8.4 3.2
0.20 8.4 2.8
0.25 8.3 2.5
0.30 8.7 2.0
0.35 8.3 2.0
0.40 8.8 1.6
0.50 8.9 1.0
Table 2: Effect of sodium perchlorate on the CMC for the reaction of ca. 4 x 10⁻⁶
M
MCPBA and 1.5 x 10⁻³
M iodide in 3.0 x 10⁻³
M nitric acid at 25oC.
[NaClO4], M (kobs)o, s-1
CMC,
10-4
M
0.05 8.5 5.0
0.26 8.2 5.0
0.40 7.9 5.0
0.50 8.0 4.5
0.60 8. 1 4.5
0.80 8.1 4.0
1.00 7.8 4.0
CM
C
[Salts]/M
-------------------------------------------------------------------------------- SALEM MANSOUR MOUSA
---------------------------------------- JJoouurrnnaall ooff SSeebbhhaa UUnniivveerrssiittyy--((PPuurree aanndd AApppplliieedd SScciieenncceess))--VVooll..1122 NNoo..22 ((22001133)) --------------------------
67
3.2. Effect of temperature on the micelle formation
It has been observed that for non-ionic
surfactants, CMC decreases with an
increase in temperature due to an
increase in hydrophobicity caused by
the destruction of hydrogen bonds
between water molecules and
hydrophilic groups. The plot of log
cmc against 1/T is almost linear, and as
the process of micellization is one of
the most important characteristics of a
surfactant solution 4, this plot is used to
derive the thermodynamics of micelle
formation, which can help us to
understand the nature of
thermodynamics and the driving force
behind micelle formation.
From Table 3to 5 it is clear that
temperature induces micellization in
the absence and presence of sulphate
salt. Also, the data show that the CMC
is lowered by increasing the
temperature, which is a well
documented finding 1. Megure
11 has
extensively reviewed the effect of
temperature on the CMC of non-ionic
surfactants and has compiled CMC
dependent temperatures for several
non-ionic surfactants of the type (Cn
Em), in which n is the number of
carbon in the alkyl chain and m is the
number of oxyethylene groups in the
surfactant. All the CMC temperature
data (with temperature ranging from
15oC
to 40
oC) in his review show that
CMC is decreased as temperature is
raised, which is a similar finding to
what we have observed.
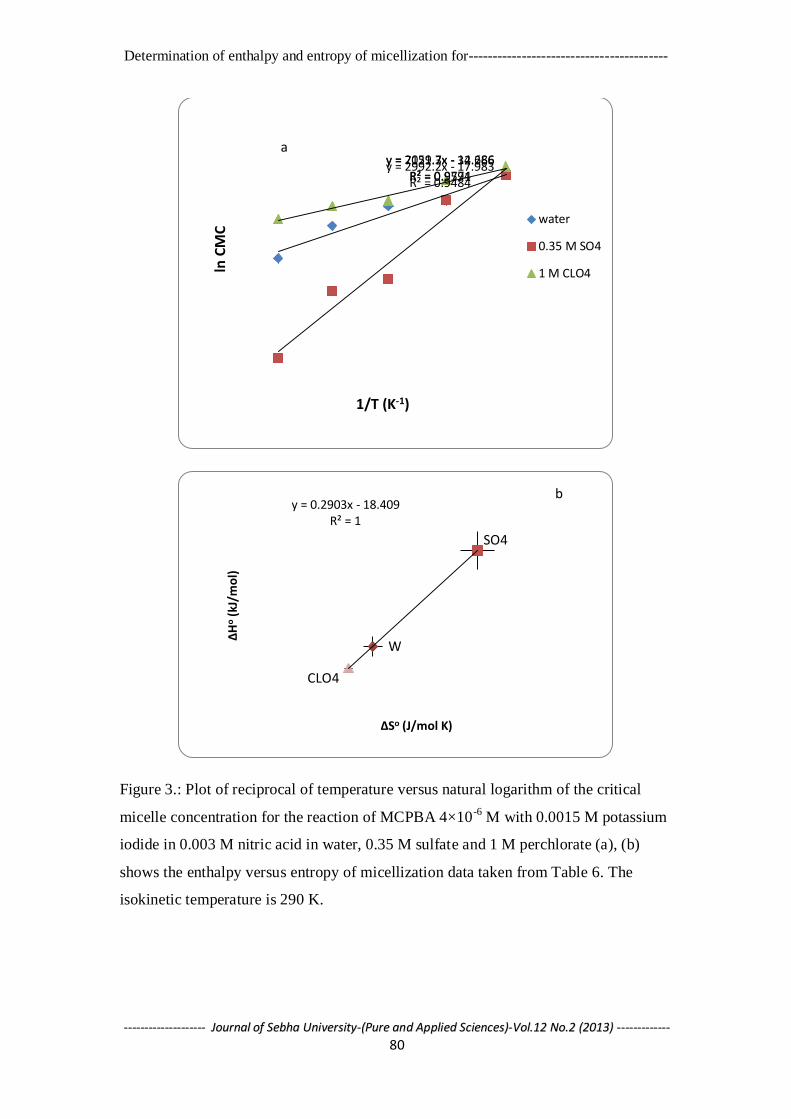
The variation of CMC with
temperature can be used to calculate
the enthalpy and entropy of
micellization, as shown in Figure 3a
which plots the natural logarithm of
CMC as a function 1/T for the reaction
in water, 0.35 M sulfate and 1 M
perchlorate respectively. From the
slope and intercept of this plot the
enthalpy and entropy of micellization
was calculated. The entropy of
micellization, ΔSm0
, versus the
enthalpy of micellization, ΔHm0
, is
shown in Figure 3b. This plot shows
that the micellization process exhibits
compensation phenomena, as stated in
12,13 in which an increase in the entropy
ΔSm0
is compensated by a decrease in
enthalpy, the reaction in presence of
sulphate which has the highest entropy
of micellization due to an increase in
the disorder of the system. On the
other hand, perchlorate decreases the
entropy of micellization even it break
structure of water. From Figure 3b it
Determination of enthalpy and entropy of micellization for-----------------------------------------
---------------------------------------- JJoouurrnnaall ooff SSeebbhhaa UUnniivveerrssiittyy--((PPuurree aanndd AApppplliieedd SScciieenncceess))--VVooll..1122 NNoo..22 ((22001133)) --------------------------
67
can seen that the micellization
associated with enthalpy-entropy
compensation is a universal
phenomenon that can be seen in most
chemical and biological processes 12,13
.
Plots of enthalpy against entropy, or
vice versa, are a common approach to
displaying thermodynamic data
obtained for rate and equilibria
processes where structural or solvent
effects are being investigated
The calculated thermodynamic
parameters of standard free energy and
the enthalpy and entropy of
micellization in three conditions (in
water, 0.35 M sulfate and 1 M
perchlorate) are shown in Table 6 with
other thermodynamic parameters.
These will be discussed in the
following sections. The value of
standard free energy for Brij-35 in
water and sulphate and perchlorate
shows that micellization is more
spontaneous for all the investigated
systems and are similar while the
enthalpy and entropy are different.
The significance of these standard
values (enthalpy, entropy and free
energy of micellization) is that they
give an insight into the force driving
the micelle formation. From Table 6 it
can be seen that the free energy is large
and negative, while enthalpy of
micellization is positive, indicating that
the micelle formation is an
endothermic process. In addition,
entropy is large and positive, which
suggests that the micellization process
results in an increase in entropy. Also,
Table 6 shows that the value of free
energy for the three studied systems is
about -20 kJ/mol-1
which accounts for
the compensation effect illustrated in
Figure 3b.
The large positive entropy ΔSm0
is
considered to be primarily due to the
disruption of the iceberg structure of
water during the course of
micellization, and the larger positive
ΔSm0
in sulphate can be due to the
contribution of sulphate to dehydration
of polyoxyethylene head group of Brij-
35. The addition of perchlorate reduces
the entropy and this may be due to the
fact that perchlorate increase the
hydration of hydrophobic group of
Brij-35 and thus reduce the number of
available water in solution, and this
lead to weaken of hydrophobic
interaction, which are the important
driving force for micelle formation.
These ions prefer to bind to the
zwitterionic micelle sulfabetaine,
which may actually be happening here;
thus, repellence of the monomer causes

-------------------------------------------------------------------------------- SALEM MANSOUR MOUSA
---------------------------------------- JJoouurrnnaall ooff SSeebbhhaa UUnniivveerrssiittyy--((PPuurree aanndd AApppplliieedd SScciieenncceess))--VVooll..1122 NNoo..22 ((22001133)) --------------------------
66
an increase in the CMC, compared to
that which occurs in the absence and
presence of sulfate.
Rakshit and co-worker 14
conducted a
thermodynamic study into the pure
aqueous solution of Brij-35 and also in
the presence of different
concentrations of polyethylene glycol
solvents. Their general conclusion was
that CMC is decreased by increasing
the temperature from 35 o
C to 50
o C in
an aqueous system and in the presence
of the additive PEG. The calculated
thermodynamic parameters for the
process of micellization show that
micelle formation was exothermic in
the presence of the additive but
endothermic in the pure aqueous
solution. Also, the entropy of
micellization was positive in all cases.
They attributed this high entropy
change to phase change, and also to the
breakdown of water structure on
micellization.
In general, the results obtained in this
study are similar to those of Rakshit
and co-worker 14
, in which the CMC is
lowered by increasing the temperature
and the entropy and enthalpy of
micellization are positive in all
conditions. Tadros 6
has shown that the
thermodynamic of non-ionic micelle
formation can be calculated from a plot
of log CMC versus 1/T. The results in
this study show the same behavior and
the micellization process is associated
with positive standard enthalpy and
large positive standard entropy (see
Table 6). These positive values were
attributed to an increase in the disorder
of the system: even though the
aggregation leads to entropy loss, the
main reason behind the positive
entropy is the desolvation of the
ethylene oxide chain and a release of
more water molecules. Another factor
contributing to the large positive
entropy upon micellization is the
increase in flexibility of the
hydrocarbon chain upon its transfer
from the aqueous phase to hydrocarbon
medium in the micelle core; thus the
orientation of the organic chain is more
restricted in the aqueous phase than in
the organic phase 6. Also, in a non-
ionic micelle increasing the
polyoxyethylene chain causes an
increase in the CMC and decreases the
micelle size 1. This gives the monomer
more hydrophilic character and thus
higher CMC.
The process of micelle formation has
been described as an example of
entropy that is driven by the

Determination of enthalpy and entropy of micellization for-----------------------------------------
---------------------------------------- JJoouurrnnaall ooff SSeebbhhaa UUnniivveerrssiittyy--((PPuurree aanndd AApppplliieedd SScciieenncceess))--VVooll..1122 NNoo..22 ((22001133)) --------------------------
66
hydrophobic bond; when the micelle is
formed the surfactant monomers come
close to each other and produce one
cavity (before, each monomer has it is
own cavity), which is smaller than the
sum of the two separated cavities
accommodating each monomer. This
contraction in the cavity is entropy
driven and ΔSm0become more positive
as a result of the release of water and
distribution of the solute –solute or
solute-solvent interaction 15
.
Table 3: Effect of temperature in the absence of added salt: for the reaction of ca. 4 x
10-6
M MCPBA and 1.5 x 10⁻³
M iodide in 3.0 x 10⁻³
M nitric acid.
T, oC (kobs)o, s
-1 CMC,
10-4
M
15 5.1 5.0
20 6.5 4.3
25 8.4 4
30 10.3 3
35 12.9 2.0
Table 4: Effect of temperature in the presence of 0.35 M sodium sulfate: for the
reaction of ca. 4 x 10⁻⁶
M MCPBA and 1.5 x 10⁻³
M iodide in 3.0 x 10⁻³
M nitric acid.
T, oC (kobs)o, s
-1 CMC,
10-4
M
15 5.3 4.5
20 6.8 4.0
25 8.3 2.0
30 10.8 1.6
35 13.1 1.0
Table 5: Effect of temperature in the presence of 1.0 M sodium perchlorate:, for the
reaction of ca. 4 x 10⁻⁶
M MCPBA and 1.5 x 10⁻³
M iodide in 3.0 x 10⁻³
M nitric acid.
T, oC (kobs)o, s
-1 CMC,
10-4
M
15 4.77 5.4
20 6.2 4.8
25 7.9 4.0
30 9.9 3.8
35 12.4 3.4
-------------------------------------------------------------------------------- SALEM MANSOUR MOUSA
---------------------------------------- JJoouurrnnaall ooff SSeebbhhaa UUnniivveerrssiittyy--((PPuurree aanndd AApppplliieedd SScciieenncceess))--VVooll..1122 NNoo..22 ((22001133)) --------------------------
66
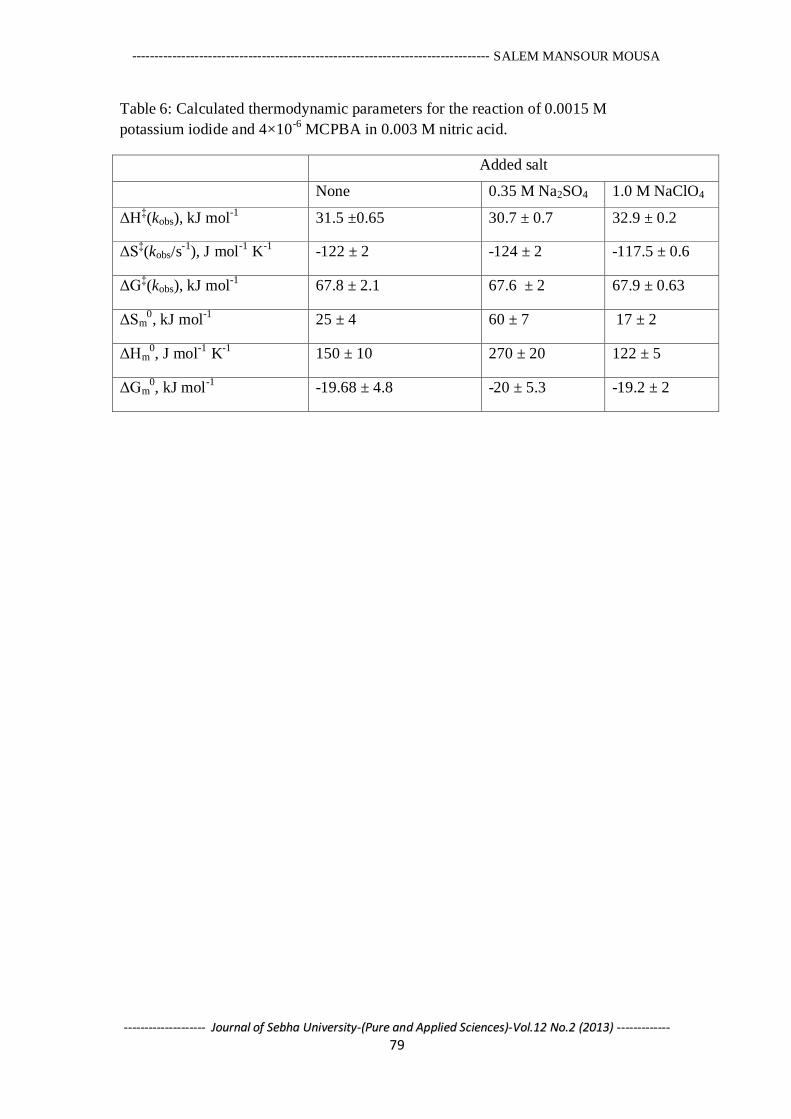
Table 6: Calculated thermodynamic parameters for the reaction of 0.0015 M
potassium iodide and 4×10⁻⁶
MCPBA in 0.003 M nitric acid.
Added salt
None 0.35 M Na2SO4 1.0 M NaClO4
ΔH‡(kobs), kJ mol
-1 31.5 ±0.65 30.7 ± 0.7 32.9 ± 0.2
ΔS‡(kobs/s
-1), J mol
-1 K
-1 -122 ± 2 -124 ± 2 -117.5 ± 0.6
ΔG‡(kobs), kJ mol
-1 67.8 ± 2.1 67.6 ± 2 67.9 ± 0.63
ΔSm0, kJ mol
-1 25 ± 4 60 ± 7 17 ± 2
ΔHm0, J mol
-1 K
-1 150 ± 10 270 ± 20 122 ± 5
ΔGm0, kJ mol
-1 -19.68 ± 4.8 -20 ± 5.3 -19.2 ± 2
Determination of enthalpy and entropy of micellization for-----------------------------------------
---------------------------------------- JJoouurrnnaall ooff SSeebbhhaa UUnniivveerrssiittyy--((PPuurree aanndd AApppplliieedd SScciieenncceess))--VVooll..1122 NNoo..22 ((22001133)) --------------------------
67
Figure 3.: Plot of reciprocal of temperature versus natural logarithm of the critical
micelle concentration for the reaction of MCPBA 4×10⁻⁶
M with 0.0015 M potassium
iodide in 0.003 M nitric acid in water, 0.35 M sulfate and 1 M perchlorate (a), (b)
shows the enthalpy versus entropy of micellization data taken from Table 6. The
isokinetic temperature is 290 K.
y = 2992.2x - 17.983 R² = 0.9484
y = 7121.3x - 32.266 R² = 0.9591
y = 2059.7x - 14.686 R² = 0.9774
ln C
MC
1/T (K-1)
water
0.35 M SO4
1 M CLO4
a
y = 0.2903x - 18.409 R² = 1
ΔH
o (
kJ/m
ol)
ΔSo (J/mol K)
SO4
W
CLO4
b
-------------------------------------------------------------------------------- SALEM MANSOUR MOUSA
---------------------------------------- JJoouurrnnaall ooff SSeebbhhaa UUnniivveerrssiittyy--((PPuurree aanndd AApppplliieedd SScciieenncceess))--VVooll..1122 NNoo..22 ((22001133)) --------------------------
67
Conclusion
The critical micelle concentration
(CMC) was determined kinetically
under several different conditions.
Increasing the temperature was found
to cause a decrease in the CMC for the
MCPBA-iodide reaction; an increase
in the sulfate concentration was also
found to decrease the CMC, though the
presence of perchlorate has limited
affect on the CMC. Plots of enthalpy
against entropy, or vice versa, are
common approaches to displaying
thermodynamic data obtained for rate
and equilibria processes where
structural or solvent effects are being
investigated
It was found that there was a very
good linear relationship between
entropy and enthalpy micellization
process (enthalpy-entropy
compensation). This can be attributed
to that the enthalpic gain is offset,
either partly or wholly by an entropic
penalty, and vice versa, resulting in a
smaller than expected, or negligible
change to the overall free energy and
this is illustrated by the nearly constant
value of free energy as seen in Table 6.
Finally, enthalpy-entropy
compensation plots when applied to
individual reaction, determined under
the different conditions by the same
method, enthalpy-entropy
compensation plots are a useful tool
for visualsing thermodynamic data and
showing differences between different
systems and its occurrence may be
indication of the presence of the same
mechanism
.
---------------------------------------------------------------------------------------------------
Brij-35( للمركب micelleالوتروبيا لتكويه البوليمر)اتقدير المحتوى الحرار و
علي التركيز الحرج لتكون البوليمر األمالح تأثيرودراسة -
سالم مىصور موسي
كهت انعهو خايعت سبا قسى انكاء
ف ذ انذراست تى تحذذ انحت انحزار االتزبا نتك انبنز انغز قطب )بن اكس اثه االثز,
Brij-35 .ي انزكباث انفعانت سطحا ) (C12E23 i.e. CH3(CH2)11(OCH2CH2)23OH) ي
باند.حذث انتفاعم ف سط m-Chloroperbenzoic acidانبااث انحزكت انتفاعم انستخذو اختزال

Determination of enthalpy and entropy of micellization for-----------------------------------------
---------------------------------------- JJoouurrnnaall ooff SSeebbhhaa UUnniivveerrssiittyy--((PPuurree aanndd AApppplliieedd SScciieenncceess))--VVooll..1122 NNoo..22 ((22001133)) --------------------------
67
ف غاب ف خد كال ي كبزتاث انصدو بزكهراث انصدو 0.003Mبتزكز HClحض ي
x 10 1.5. ك انتزكز االبتذائ نهد انحض عذ درخاث حزارة يختهفت-3
M 4 x 10⁻⁶
M عه
انتان. اظزث انتائح ا ا انكبزتاث ) ذرفهك ا تبعا نسهسهت فسز( زذ ي يعذل انتفاعم
تبعا نسهسهت , با بزكهراث ) ذرفبك ا ((CMCعم عه خفض انتزكز انحزج نهبنز
(. كذنك اظزث انتائح ا انزادة (CMCفسز( عم عه تقهم يعذل سىزعت انتفاعم ن تاثز قهم عه
.نهبنز CMCف درخت انحزارة صاحبا خفض ف قت
-------------------------------------------------------------------------------------------------------
References
1. Rosen M. J, (2004),
Surfactants and interfacial
phenomena, Wiley-
Interscience, Hoboken, U.S.A,
3rd ed.P, 107,108,138
2. Stainsby. G. and Alexander. A.
E., (1950), Studies of soap
solutions. Part II.—Factors
influencing aggregation in soap
solutions, Trans. Faraday Soc,
46, 587-597.
3. Holmberg. K, Jonsson. B,
Kronberg. B, Lindman B,
(2002), Surfactants and
Polymers in Aqueous Solution,
John Wiley, UK, 2ed, 39-52.
4. Blandamer. M. J., Cullis. P. M.,
Soldi. L. G., J. Engberts B. F.
N., Kacperska A., Vanos N. M.
and Subha. M. C. S., (1995),
Thermodynamics of micellar
systems: : Comparison of mass
action and phase equilibrium
models for the calculation of
standard Gibbs energies of
micelle formation, Advances in
colloid and interface science,
58, 171-209.
5. Myers D., (1999), Surfaces,
Interfaces, and Colloids:
Principles and Applications,
Wiley – VCH, New York, 2th
ed. 369-373
6. Tadros. T. F., (2005), Applied
surfactants : principles and
applications, Wiley-VCH,
Weinheim, UK. 21-28
7. Berthod. A., Tomer. S. and
Dorsey. J. G., (2001),
Polyoxyethylene alkyl ether
nonionic surfactants:
physicochemical properties and
use for cholesterol
determination in food, Talanta,
55, 69-83.
8. Suradkar. R. and Bhagwat. S.
S., (2006), CMC
Determination of an Odd
Carbon Chain Surfactant

-------------------------------------------------------------------------------- SALEM MANSOUR MOUSA
---------------------------------------- JJoouurrnnaall ooff SSeebbhhaa UUnniivveerrssiittyy--((PPuurree aanndd AApppplliieedd SScciieenncceess))--VVooll..1122 NNoo..22 ((22001133)) --------------------------
67
(C13E20) Mixed with Other
Surfactants Using a
Spectrophotometric Technique,
Journal of Chemical and
Engineering Data, 51, 2026-
2031
9. Miyagishi. S., Okada. K. and
Asakawa. T., (2001), Salt
Effect on Critical Micelle
Concentrations of Nonionic
Surfactants, N-Acyl-N-
methylglucamides (MEGA-n),
Journal of Colloid and
Interface Science, 238, 91-95.
10. Ray. A. and Nemethy. G.,
(1971), Effects of ionic protein
denaturants on micelle
formation by nonionic
detergents, Journal of the
American Chemical Society,
93, 6787-6793.
11. Megure. K., Ueno. M. and
Esumi. K., (1987), in non-ionic
surfactants: physical chemistry
(Surfactant science) ed. M. J.
Schick, Marcel Dekker, New
York, Editon edn, p. 133.
12. Liu. L. and Guo. Q. X., (2001),
Isokinetic Relationship,
Isoequilibrium Relationship,
and Enthalpy−Entropy
Compensation, Chemical
Reviews, 101, 673-695.
13. Liu, L., Yang, C., Guo, Q.X,
(2001), Enthalpy-entropy
compensation of cyclodextrin
complexation with different
classes of substrates. Bull.
Chem. Soc. Jpn. 74 (12), 2311-
2314.
14. Rakshit. A. K., Koshy. L.,
(1991), Thermodynamic Study
of Brij 35 in Aquo-
Polyethylene Glycol Solvents,
Bulletin of the Chemical
Society of Japan, 64, 2610-
2612.
15. Rekharsky. M. V, and Inoue.
Y, (1998), Complexation
thermodynamics of
cyclodextrins. Chem.Rev.
98(5), 1875-1917.