CW cNES for surface water...
68
www.aquanes.eu Deliverable 3.2 Combining constructed wetlands and engineered treatment for surface water protection
Transcript of CW cNES for surface water...

www.aquanes.eu
Deliverable 3.2
Combining constructed wetlands and engineered treatment for surface water protection


The AquaNES project has received funding from the European Union’s Horizon 2020 research and innovation programme under grant agreement no. 689450
Project Title: AquaNES
Demonstrating synergies in combined natural and engineered processes for water treatment systems
Call identifier: Topic: Funding scheme:
H2020-WATER-2015-two-stage; WATER-1B-2015 Demonstration/pilot activities Innovation Action (IA)
Start date: Duration:
01.06.2016 36 months
Document information Deliverable no. : D3.2
Work package: WP3: Constructed wetlands and other natural systems for im-proved wastewater treatment
Title: Combining constructed wetlands and engineered treatment for surface water protection The demonstration activities in the field of surface water pro-tection (Sites: Task 3.1, 3.2, 3.4) are summarized and the bene-fits of the combined treatment are highlighted. Key outputs are transferable numbers on e.g. load reduction of nutrients or pharmaceuticals into surface water bodies in relation to the Water Framework Directive
Lead Beneficiary: UCRAN
Authors: Andrea Brunsch (EV), Katharina Knorz (EV) Marc Pidou (UCRAN), Daniel Sauter (BWB)
Contact for queries:
Marc Pidou, Cranfield University, Cranfield, MK430AL, UK, E [email protected]
Dissemination level:
This report is PU: Public
Due date: 01.12.2018 (M30)
Final version: 21.05.2019 (M36)
Disclaimer: This publication reflects only the authors' views and the Executive Agency for Small and Medium-sized Enterprises (EASME) is not liable for any use that may be made of the information contained therein.

i
Table of contents
List of figures ..................................................................................................................................... ii
List of tables ....................................................................................................................................... v
List of abbreviations .......................................................................................................................... vi
Executive Summary ........................................................................................................................... ix
1 About this document .................................................................................................................. 1
2 Introduction ................................................................................................................................ 2
3 Sites description.......................................................................................................................... 4
3.1 Site 11: Rheinbach .............................................................................................................. 4
3.1.1 Full-scale site ............................................................................................................... 4
3.1.2 Pilot scale RSFs ...........................................................................................................6
3.2 Site 12: Schönerlinde .......................................................................................................... 7
3.3 Site 13: Packington .............................................................................................................9
4 Results ...................................................................................................................................... 11
4.1 Sites performance ............................................................................................................ 11
4.1.1 Site 11: Rheinbach ..................................................................................................... 11
4.1.2 Site 12: Schönerlinde ................................................................................................ 20
4.1.3 Site 13: Packington .................................................................................................... 31
4.2 Comparative analysis ...................................................................................................... 44
4.2.1 Organics .................................................................................................................... 44
4.2.2 Solids ........................................................................................................................ 49
4.2.3 Nutrients................................................................................................................... 49
4.2.4 Microbial indicators ................................................................................................. 50
4.2.5 Metals ........................................................................................................................ 51
5 Concluding remarks .................................................................................................................. 53
6 Bibliography.............................................................................................................................. 54

ii
List of figures Figure 1 Schematic view of the RSFplus system for flexible treatment of CSO and WWTP
effluent. ............................................................................................................................ 4
Figure 2 Schematic view of the setup of the full-scale demonstration RSF. .................................. 5
Figure 3 Schematic view of the pilot system at demonstration Site 11. ..........................................6
Figure 4 Schematic view of the setup of one exemplary filter within the pilot plant. .................... 7
Figure 5 Simplified flow-scheme of pilot-plants at demonstration Site 12. ................................... 7
Figure 6 Overview of operational phases and parameters applied for ozonation, deep-bed filters and constructed wetlands. .............................................................................................. 8
Figure 7 Process flow diagram at demonstration Site 13. ..............................................................9
Figure 8 Reactive media constructed wetland demonstration plant. ........................................... 10
Figure 9 Organic matter, silt and clay as well as content (weight percent) in the individual layers of the three pilot filters. No samples were taken from the GAC of filter 3. .................... 11
Figure 10 Mass balance of the theoretical accumulated concentrations and actual measured concentrations of 1-H benzotriazole and metoprolol in Filter 1 and 2. .......................... 12
Figure 11 Behaviour of OMP concentrations in RSFs shown for the example of 1-H benzotriazole and diclofenac. ............................................................................................................... 13
Figure 12 Removal efficiency in conventional RSF for exemplary compounds. ............................ 13
Figure 13 Reduction rates of metoprolol and galaxolide in Filter 1 over time. .............................. 14
Figure 14 Reduction rate of 1H-benzotriazole in filter 1. ............................................................... 14
Figure 15 Reduction rates of RSF 1 in relation to LogD values (ocatonal/water distribution coefficient) and charges of the compounds at pH7. ....................................................... 15
Figure 16 Removal rates vs. contact time and removal rates vs. organic matter content for 1-H benzotriazole in laboratory batch tests with pilot RSF Filter 2 material. ...................... 15
Figure 17 Mean concentrations of Coliform Bacteria and E. coli in the inflow and outflow of the pilot RSFs. ...................................................................................................................... 16
Figure 18 DOC removal in conventional and GAC RSF per treated bed volumina (left) and OMP removal per treated bed volumina of the GAc layer in the GAC RSF (right). ................ 17
Figure 19 Combined treatment of CSO and WWTP effluent feeding scenarios ............................. 18
Figure 20 Nitrogen balance for the artificial CSO event, scenario 1 (WWTP I) and 2 (WWTP II). 18
Figure 21 Mean reduction rates of selected OMPs for scenario 1 and 2 (error bar show standard deviation). ...................................................................................................................... 19
Figure 22 Mean E.coli concentration in the in- and outflow of the CSO event, scenario1 (WWTP I) and 2 (WWTP II) (error bar show standard deviation). ................................................ 19
Figure 23 Operational data from the ozone unit for UVA254,influent, UVA254,effluent and ΔUVA254 (calculated) while closed-loop control was active. ....................................... 20
Figure 24 Boxplots of DOC (left, n=22-24) and COD (right, n=22-24) concentrations at different sampling points. ............................................................................................................. 21

iii
Figure 25 Mean DOC removal with standard deviation at different HLR in CW (left, n=5-10) and deep-bed filters (right). ..................................................................................................22
Figure 26 Influent concentration dependence of DOC removal in CW1 (left) and CW2 (right). ...22
Figure 27 Mean removals of monitored OMP during ozonation calculated with conservative approach regarding LOQ (when effluent concentration was <LOQ the value of LOQ was used for calculation). ............................................................................................... 23
Figure 28 Mean removals with standard deviations (n=8-25) of OMP during post-treatment in CW calculated with conservative approach regarding LOQ. ..........................................24
Figure 29 Breakthrough curve over run time for OXI, MET and BET in CW2 (left) and BTA breakthrough curve over bed volumes for CW2 and S/BAC filter (right). ..................... 25
Figure 30 Bromate formation at different ozone doses. .................................................................26
Figure 31 NDMA formation at 4 different days during 1 week (left) and average NDMA concentrations (n=3) at different sampling points (right). ............................................26
Figure 32 Concentrations of E. coli (left, n=10-13) and Enterococci (right, n=10-13) at different sampling points; ............................................................................................................. 27
Figure 33 Concentrations of Clostridium perfringens (left, n=9-11) and somatic coliphages (right, n=11-13) at different sampling points; columns: median, error bars: 25th / 75th percentile. ...................................................................................................................... 28
Figure 34 Median concentrations of viable and dead cells at different sampling points measured by flow cytometry. ..........................................................................................................29
Figure 35 Mean DOC concentrations in CW influent and effluents with (left) and without (right) ozone dosing. ................................................................................................................. 30
Figure 36 Median concentrations (n=3) of E. coli, Enterococci, Clostridium perfringens and somatic coliphages in CW influent and effluents without ozone dosing. ...................... 30
Figure 37 Evolution in time of the P concentration and pH in the effluent of the CW. ................. 32
Figure 38 Impact of pH on the effluent P concentration. ............................................................... 33
Figure 39 Calcium and magnesium ions release in the effluent of the constructed wetland for the initial 750 days of operation. ..........................................................................................34
Figure 40 Evolution of the effluent P concentration and air temperature over time for the initial 700 days of operation. ....................................................................................................34
Figure 41 Vanadium release from the steel slag media over time for the initial 750 days of operation. ....................................................................................................................... 35
Figure 42 Removal of Nickel, Zinc and Iron in the CW over time for the initial 750 days of operation. .......................................................................................................................36
Figure 43 Evolution of the COD concentrations in the influent and effluent of the CW over time for the initial 750 days of operation. .............................................................................. 37
Figure 44 Evolution of the suspended solids concentrations in the influent and effluent of the CW over time for the initial 750 days of operation. .............................................................. 37
Figure 45 Tracer tests in the reactive media CW. .......................................................................... 38
Figure 46 Locations of each of the hydraulic conductivity tests across the surface of the CW. .....39

iv
Figure 47 Hydraulic conductivity tests results for the points located in the direction of the flow on the (a) left, (b) middle and (c) right of the bed. ............................................................ 40
Figure 48 P sequential extraction from fresh media unwashed (FU) and washed (FW – rinsed with clean water to remove any loose deposits), and used media from four locations in the direction of the flow in the middle of the bed, with E1 closer to the inlet and E4 closer to the outlet. ......................................................................................................... 41
Figure 49 Pictures of the plants at the inlet, middle and outlet of the CW in June 2016. ..............42
Figure 50 Impact of dilution factor for pH control by blending. ....................................................43
Figure 51 COD concentrations in the influent and effluent from all systems trialled on the 3 demonstration sites. ...................................................................................................... 44
Figure 52 4’-Hydroxydiclofenac concentrations in the influent and effluent from all systems trialled on the Rheinbach and Schönerlinde sites. ......................................................... 45
Figure 53 Benzotriazole concentrations in the influent and effluent from all systems trialled on the Rheinbach and Schönerlinde sites. ......................................................................... 46
Figure 54 Metoprolol concentrations in the influent and effluent from all systems trialled on the Rheinbach and Schönerlinde sites. ............................................................................... 46
Figure 55 TCPP concentrations in the influent and effluent from all systems trialled on the Rheinbach and Schönerlinde sites. ................................................................................ 47
Figure 56 Amidotrizoate concentrations in the influent and effluent from all systems trialled on the Rheinbach and Schönerlinde sites. ......................................................................... 48
Figure 57 Candesartan concentrations in the influent and effluent from all systems trialled on the Rheinbach and Schönerlinde sites. ............................................................................... 48
Figure 58 Solids concentrations in the influent and effluent from all systems trialled on all 3 sites. .............................................................................................................................. 49
Figure 59 P concentrations in the influent and effluent from all systems trialled on all 3 sites. .. 50
Figure 60 E. Coli concentrations in the influent and effluent from all systems trialled on the Rheinbach and Schönerlinde sites. ................................................................................ 51
Figure 61 Iron, nickel and zinc concentrations in the influent and effluent from all systems trialled on the Rheinbach and Packington sites. ............................................................ 52

v
List of tables Table 1 Regulations and concentrations of the Rheinbach WWTP effluent based on the
Wastewater Charges Act (AbwAG). .................................................................................. 4
Table 2 Composition of the BOF steel slag media....................................................................... 10
Table 3 Characteristics of the outflow of the Rheinbach WWTP. ............................................... 12
Table 4 Sampling plan for different hydraulic retention times. ................................................. 16
Table 5 Reduction rates of some exemplary parameters for different feeding rates. ................ 17
Table 6 Overview of results for OMP removal during ozone treatment. ....................................24
Table 7 WWTP effluent quality. .................................................................................................. 31

vi
List of abbreviations 4-OH-DCF 4-OH-diclofenac
AbwAG Wastewater charges Act, Abwasserabgaben-Gesetz
ACE Acesulfame
ATS Amidotrizoate
BAC Biologically activated carbon
BEZ Bezafibrate
BioF Biofiltration
BOD5 5-day Biochemical Oxygen Demand
BTA Benzotriazole
BWD Bathing water directive
CAN Candesartan
CBZ Carbamazepine
CEC Contaminant of emerging concern
CFU Colony forming unit
CLA Clarithromycin
cNES Combined natural and engineered treatment system
COD Chemical oxygen demand
CSO Combined sewer overflow
CW Constructed wetland
DCF Diclofenac
DOC Dissolved organic carbon
DWD Drinking water directive
EBPR Enhanced Biological Phosphorus Removal
EC Electrical Conductivity
EDC Endocrine disrupting compounds
FAA Formylaminoantipyrine
FAT Full advanced treatment
GAB Gabapentin
GAB-LA Gabapentin lactam
GAC Granular activated carbon
IOP Iopamidole
LC-Q-TOF Liquid chromatography - Quadrupole time-of-flight mass spectrometry
LOD Limit of detection

vii
LOQ Limit of quantification
LRV Log reduction value
MEC Mecoprop
MEF Metformin
MET Metoprolol
MPN Most probable number
MS Milestone
NDMA N-Nitrosodimethylamine
NF Nanofiltration
NTU Nephelometric Turbidity Unit
OLM Olmesartan
OM Organic Matter
OMP Organic Micropollutants
OXI Oxipurinol
P Phosphorus
PFOS Perfluorooctanesulfonic acid
PPCPs Pharmaceutical and personal care products
PRI Primidone
RO Reverse Osmosis
RSF Retention soil filter
SF Sand filter
SOL Solatolol
SMD Subsurface monitoring device
SMX Sulfamethoxazole
TCPP Tris-(chloroisopropyl)-phosphate
TER Tertbutryn
TMP Trans membrane pressure
TN Total nitrogen
TOC Total organic carbon
TP Total phosphorus
TRL Technology readiness levels
TrOCs Trace organic Compounds
TSS Total suspended solids
UF Ultrafiltration
UV Ultraviolet

viii
UVA Ultraviolet absorption
UVA254 Ultraviolet absorption at 254 nm
UWWTD Urban wastewater treatment directive
VAL Valsartan
VALA Valsartan acid
WFD Water Framework Directive
WP Work package
WWTP Wastewater treatment plant

D3.2: Combining constructed wetlands and engineered treatment for surface water protection ix
Executive Summary As one of the key priorities from the European Commission, water protection has been the focus of new regulations in recent years with in particular the implementation of the Water Framework Di-rective. As part of this directive, a range of pollutants of concern have been identified which have to be dealt with if in excess in water to control and maintain high quality standards in natural waters. The aim of this work was then to demonstrate the potential of combined natural and engineered systems with the implementation of constructed wetlands (CWs) as polishing step for conventional engineered wastewater treatment plants (WWTPs) for the removal of the pollutants such as nutrients, microbial indicators and organic micro-pollutants (OMPs) from wastewater before discharge into the environ-ment on three sites located in Germany and the UK.
On the first site (AquaNES site 11: Rheinbach), three pilot scale retention soil filters (RSFs) with dif-ferent media were demonstrated for the treatment of combined sewer overflows (CSOs) during storm events and as a polishing step for the WWTP effluent during dry weather. The trials at the Rheinbach WWTP delivered a long term (> 3.5 years) study of the RSF systems for the treatment of CSOs and the WWTP effluent with an exhaustive study specifically on the removal OMPs by the natural systems. The results demonstrated the variability in removal depending on the nature of the OMPs but crucially highlighted the benefit of the addition of an adsorbent, GAC, into the filter material which improve removal for all compounds tested. The work showed that removal not only occurred through adsorp-tion but also through a biological degradation pathway, highlighting the importance of the extended retention time in these systems and emphasising the benefit of combining the natural system with the conventional WWTP. The trials with the RSFs also demonstrated their efficiency to remove microbial indicators with 1-2 log-units removal for Coliforms and E. coli, bringing the effluent concentrations below the limit required for bathing water quality.
The second site (AquaNES site 12: Schönerlinde) investigated a new approach combining ozonation with two types of vertical flow CW for removal of OMPs and microbial indicators in conventionally treated effluent. Pilot deep-bed filter systems were also operated in parallel to the CWs and were used as a benchmark for performance comparison. Results from the trial at Schönerlinde, show that ozo-nation and CW treatment is a suitable combination to remove organic and microbial contamination. Synergy of the process combination could be clearly shown for removal of organic matter, comparing ozone and subsequent CW treatment with CW as a stand-alone solution. OMP were mainly reduced by the ozonation step. However, for selected OMP with insufficient reaction rates during ozonation, removal could be complemented by CW. Biochar addition to the substrate was demonstrated to tem-porarily retain well adsorbing OMP. Overall adsorption capacity of biochar is limited though and ex-change is not possible without a complete renewal of the filter bed including vegetation. Similarly to the work with the RSF, disinfection was improved by CW post-treatment. After ~2 log-units reduction of E. coli and Enterococci during ozonation they further decreased below limit of quantification (LOQ) in CW treatment. C. perfringens and somatic coliphages were insufficiently inactivated by ozone. CW post-treatment effectively retained both organisms and hence, compensated the short-comings of the ozone treatment. This highlights that the process combination of ozone and CW works for a wider range of microorganisms and therefore provides higher disinfection safety.
The third site (AquaNES site 13: Packington) demonstrated a reactive media constructed wetland fol-lowing conventional biological treatment for the removal of phosphorus (P) from wastewater to low levels. This trial with the reactive media CW at Packington has shown the potential of a simple and sustainable technology to remove P to very low levels in a single step, while maintaining its expected

D3.2: Combining constructed wetlands and engineered treatment for surface water protection x
performance for the removal of solids and organics. The long term trials (> 3 years) have highlighted some of the limitations with the current media, steel slag, including high pH levels in the effluent and breakthrough of P in the effluent after 1-2 years (depending on P target) of operation. However, the diagnostic work carried throughout the trial on the system has provided invaluable learning on the process and its mechanisms. Although, this trial has shown that the technology is not yet ready for full-scale application, it has undeniably provided the tools to deliver a much needed technology (through modification of the media or use of alternative media) for small WWTPs.
A comparative analysis of all three demonstration sites has generally highlighted the added value of combining natural systems such as the CWs with conventional WWTPs to deliver high quality water for discharge into the environment with lower effluent concentrations for organics, nutrients, solids, microbial indicators and metals across all sites.
D3.2: Combining constructed wetlands and engineered treatment for surface water protection 1
1 About this document This deliverable reports on some of the work delivered as part of the work package 3 (WP 3) from the AquaNES project. The overall WP3 aimed to demonstrate the combination of constructed wetlands (CWs) with different technical post- or pre-treatment options such as ozonation, bioreactor systems or disinfection in pilot and full-scale sizes in different European climates (UK, Germany, Greece) for innovative and resource-efficient treatment of wastewater and combined sewer overflows. Specifically, the work reported in this document addressed the tasks 3.1 - Constructed wetlands as post-treatment after ozonation, 3.2 - Retention soil filters for flexible treatment of WWTP effluent and combined sewer overflows and 3.4 - Natural systems for P-removal at small WWTP in rural areas.
This reports includes an introduction providing background to the work and highlighting the key driv-ers for the different demonstration sites, a description of the sites and systems evaluated, the detailed results obtained from each demonstration site individually followed by a comparative analysis to draw conclusion across all sites, and finally a summary of the key findings in concluding remarks.
The work reported here is directly linked to the Milestones 1, 2, 3, 4, 5, 6 and 26 of the AquaNES project as well as the deliverables 3.1 - Combining constructed wetlands and engineered treatment for water reuse and 3.3 - Design recommendations for combining CW with engineered pre- or post-treatments including case studies of demonstration sites. The data generated on the three demonstration sites reported here were also used as part of other WPs such as WP4 - Risk Assessment and Water Quality Control, WP5 - Interfaces with the Environment & Society, WP6 - Decision Support and System Design in support for the development of novel water quality assessment tools, life cycle assessment and eco-system services analysis and the decision support system.

D3.2: Combining constructed wetlands and engineered treatment for surface water protection 2
2 Introduction With growing awareness and engagement for the protection of the environment by citizens in Europe, and in particular increasing demands for cleaner natural waters, the European Commission has made water protection one of its key priorities and developed legislation accordingly over the past 50 years ranging from standards for water resources used for drinking water abstraction, quality targets for drinking water, regulations for fish, shellfish and bathing waters and groundwater as well as directives addressing pollution by urban wastewater discharge and nitrates from agriculture, for example. More recently, the Water Framework Directive (WFD) aiming to expand the scope of water protection to all waters, surface waters and groundwater, and achieve “good status” for all waters was implemented (EC, 2019). In order to deliver its ultimate aim “to achieve the elimination of priority hazardous sub-stances and contribute to achieving concentrations in the marine environment near background values for naturally occurring substances”, WFD delivers a combined approach to pollution control with the implementation of controls at source and the development of quality objectives for the receiving envi-ronment. In the WFD, substances of concern including nutrients such as nitrate and phosphate, met-als and organic micro-pollutants (OMPs) are listed and have to be addressed as part of any pollution control strategies (WFD, 2000). Because these pollutants are known to all be present in municipal wastewater, in order to meet the standards required by the WFD, the water industry has to re-evaluate its approach to wastewater treatment before discharge into the environment for the control of the pol-lution at source through the optimisation of existing technologies or the implementation of novel tech-nologies specifically targeting these substances of concern.
In this context, the current project, AquaNES, aims to demonstrate the synergistic benefits of com-bined natural and engineered systems in delivering water services and more specifically the work re-ported in this document focuses on the combination of constructed wetlands (CW) with engineered systems for sustainable removal of pollutants such as OMPs, metals, phosphate and microbial indica-tors from wastewater before discharge into surface waters with the demonstration of the technologies at pilot to full-scale on three sites in Germany and the United Kingdom (UK).
As already mentioned, municipal wastewater treatment plants (WWTP) are a major pathway for the emission of OMPs and microbiological contamination into surface waters (Luo et al., 2014). In order to avoid adverse effects of WWTP discharge on surface water quality, advanced treatment technologies will be required for further effluent polishing. Several pilot and full-scale studies have proven that ozonation followed by deep-bed filtration with sand or activated carbon filters is an efficient barrier for organic and microbiological contaminations (Knopp et al., 2016; Zimmermann et al., 2011). The main purpose of the filtration step is to remove organic transformation products formed in the oxida-tion process. Additionally filtration can contribute to the disinfection capacity of the combined system. Constructed wetlands are known to efficiently remove both organic pollutants (Carranza Díaz, 2015) and microbial contamination (Rühmland and Barjenbruch, 2013). Therefore, they could be a promis-ing natural alternative to technical filter systems that are conventionally applied as post-treatment after ozonation. The present study (AquaNES site 12: Schönerlinde) then investigated a new approach combining ozonation with two types of vertical flow CW for removal of OMPs and microbial indicators in conventionally secondary treated effluent. Technical deep-bed filter systems were also operated in parallel to the CWs and were used as a benchmark for performance comparison.
In areas with combined sewers which are designed to collect not only municipal wastewater but also rain water run-offs, it is common practice that, in the event of a major storm when the flow generated exceeds the storage capacity of the dedicated WWTP, the combined sewer overflows (CSO) are dis-charged directly to receiving waters with limited to no treatment which has been identified as another

D3.2: Combining constructed wetlands and engineered treatment for surface water protection 3
major pathway of pollution (MUNLV, 2010; Tondera et al., 2013; Bester and Schäfer, 2009). In recent years, retention soil filters (RSFs) have been shown to be an effective tool in reducing not only the hydraulic load of CSOs by offering retention space but also the pollutant load due to amongst others filtration, adsorption and microbiological degradation processes (Mertens et al., 2012). Total sus-pended solids (TSS) are reduced by more than 90 %, nutrients like ammonium and phosphorus (P) are reduced by 90 % and 50 %, respectively and heavy metals such as zinc show reduction rates of more than 70 %. Moreover, good removal (25 – 95 %) have been determined for several OMPs (Chris-toffels et al., 2014; Mertens et al., 2012). However, RSFs are often on-site of WWTP but are only used for the treatment of CSOs during heavy rain events and left idle during dry weather. As part of novel approach and the implementation of a new RSF configuration (i.e. RSFplus) comprising additional ad-sorptive materials, the technology can be employed as a polishing step during dry weather by treating the WWTP effluent specifically focusing on the reduction of OMPs. For this project (AquaNES site 11: Rheinbach), three pilot scale RSF filters with different media were demonstrated for the treatment of both the effluent from the Rheinbach WWTP during dry weather and CSOs during rain events to re-duce the pollutant load especially in terms of TSS, nutrients, OMPs and heavy metals to the receiving water course, the Wallbach creek.
Finally, as stated above, nutrients and in particular P are compounds of concern because their accu-mulation in surface waters has been shown to lead to eutrophication which has a significant detri-mental impact on aquatic life (Paerl et al., 2001). In the past, according to the Urban Wastewater Treatment Directive (UWTD, 91/271/EEC), medium to large WWTPs have had to meet P concentra-tions of 1-2 mg/L before discharge into the environment but with the implementation of the WFD, P concentrations in final effluents can be required to be below 1 mg/L and potentially as low as 0.1 mg/L. Also, small WWTPs for which P removal was often limited or not required at all will now potentially face strict P consents. However, the conventional processes for P removal, enhanced biological phos-phorus removal (EBPR) and metal salts dosing, are not adapted for small WWTPs where water utilities generally chose to implement simple, low cost systems and try, as much as possible, not to use chem-icals due to the associated environmental risk and cost with transport and storage. For these reasons, alternative options are then required for P removal on small WWTPs. Interestingly, CWs are com-monly used as tertiary treatment steps (Butterworth et al., 2016), especially in these small WWTPs, as they provide the passive, low energy/low technological solution for polishing wastewater effluents be-fore discharge (mainly targeting solids and organics removal), and adapting CWs for P removal be-comes an attractive option. For this, the media used in CWs, usually sand and/or gravel, can be re-placed with a reactive media for the removal of P by a combination of mechanisms including precipi-tation and adsorption (Barca et al., 2012). The work reported here focused on the demonstration at large pilot scale (AquaNES site 13: Packington) of a reactive media constructed wetland following con-ventional biological treatment for the removal of P from wastewater to low levels.
The current report provides a summary of the demonstration activities combining CWs and engi-neered treatment systems carried out on the three sites of Schönerlinde, Rheinbach and Packington as part of the AquaNES project and highlights the benefits of the combined treatment in particular for load reductions of nutrients, OMPs and/or microbial indicators into receiving surface waters.

D3.2: Combining constructed wetlands and engineered treatment for surface water protection 4
3 Sites description
3.1 Site 11: Rheinbach
3.1.1 Full-scale site
The Rheinbach WWTP treats the combined sewage of the city of Rheinbach. It is designed for a popu-lation equivalent of 27,000. This corresponds to an annual quantity of 1,919,000 m3/year of sewage and an average dry weather flow of 103 L/s. The effluent of the WWTP is discharged into the Wallbach creek. During dry weather conditions the wastewater load of the Wallbach creek is 100 %. Thus, the WWTP effluent has to meet high water quality standards. To fulfil that, the Rheinbach WWTP is equipped with a nitrification/denitrification stage and a phosphorous elimination as well as an addi-tional filtration basin downstream of the secondary clarifier. The outflow concentrations as well as the threshold concentrations set by the German Wastewater Charges Act are shown in Table 1.
Table 1 Regulations and concentrations of the Rheinbach WWTP effluent based on the Wastewater Charges Act (AbwAG).
Parameter Unit Threshold outflow according to AbwAG
Average measured concentration
COD mg/L 25 24 TN mg/L 18/14/14/18* 11.8 TP mg/L 0.4 0.13 *Quarter 1./2./3./4.
A rain retention tank with a volume of 2650 m3 is installed at the Rheinbach WWTP. To date, during heavy rain events the combined sewer is buffered in the rain retention tank before it is treated in the WWTP. In case of an overload of the WWTP the combined sewer was discharged directly into the Wallbach creek which led to high hydraulic and pollutant loads in the receiving stream. With the im-plantation of the full-scale RSF on the site, during dry weather periods the WWTP effluent will now pass through the full-scale RSF before being discharged into the receiving Wallbach creek. The RSF is separated into three segments which are fed alternately to guarantee aerobic conditions. During rain-fall events the CSO is discharged onto the entire surface of the RSF. During this period the effluent of the Rheinbach WWTP is discharged directly into the receiving Wallbach creek (Figure 1). This type of innovative RSF is called RSFplus.
Figure 1 Schematic view of the RSFplus system for flexible treatment of CSO and WWTP effluent.

D3.2: Combining constructed wetlands and engineered treatment for surface water protection 5
The full-scale RSF covers an area of 10,300 m2 and has an effective filter area of 5,000 m2 with an effective filter volume of 5,000 m3. The filter depth amounts to 1 m, while the ponding depth is 2 m. The basic components of the full-scale RSFplus for flexible treatment of CSO and WWTP effluent cor-respond to those of conventional RSFs. However, in contrast to conventional filters, the demonstra-tion site (Figure 2) is separated into three segments of the same size which are fed alternately. Segment 1 is fed for 24 hours while segment 2 and 3 are dry. After 24 hours, segment 2 is fed for 24 hours while segment 1 and 3 are dry and so on. That way each segment has a dry period of 48 hours which is important to maintain aerobic conditions within the filter medium. The feeding is regulated by distri-bution channels which are arranged radially. There are two channels per segment to guarantee com-prehensive feeding. The average inflow during dry weather periods is 50 L/s. Reeds (Phragmites aus-tralis) are planted on the RSF surface. Sand is used as filter medium to which various additives are added to improve microbiological and sorption processes. For this reason the filter consists of three layers:
– Layer 1 corresponds to the upper 10 cm, to which 20 vol.-% of granular activated carbon (GAC) and 30 vol.-% of CaCO3 are added for segment 2 and 3.
– Layer 2 with a depth of 60 cm comprises 30 vol.-% of CaCO3. – Layer 3 has a depth of 30 cm and contains besides CaCO3 various amounts of GAC. While there
is no GAC added in segment 1, segments 2 and 3 contain 30 vol.-% and 40 vol.-% GAC, respectively.
– The bottom layer consisting of 30 cm of gravel is used for drainage.
A schematic view of the full-scale demonstration site including a vertical profile of the filter and the sampling points are shown in Figure 2.
Auto-samplers are installed at the inflow and outflow of the demonstration site to take water samples for analysis. Additionally, sensors are installed to measure operational parameters including pH, tem-perature, conductivity and water level. Sampling tubes are installed along the distribution channels. Each sampling point has three tubes of different length according to the depth of the three layers of the filter (0.1, 0.3 and 0.75 m depth). There are two sampling points for each segment, one located close to the point of inflow and one located at a distance to the inflow (Figure 2).
Figure 2 Schematic view of the setup of the full-scale demonstration RSF.

D3.2: Combining constructed wetlands and engineered treatment for surface water protection 6
3.1.2 Pilot scale RSFs
At all times small amounts of the WWTP effluent (135 mL/s) are used to feed the pilot plant which discharges into the Wallbach creek after filtration (Figure 3). The pilot plant system does not separate between dry weather flow and rainfall events. It is not fed by CSO.
Figure 3 Schematic view of the pilot system at demonstration Site 11.
The pilot plant consists of three individual pilot scale RSFs, each with a volume of 1.39 m3. They are fed by the effluent of the Rheinbach WWTP at a rate of 30 mL/(s*m²). The pilot plant has a feeding period of 28 h and a dry period of 56 h. The filter material is sand to which different amounts of CaCO3
and GAC are added. This way the influences of additives on the filter performance can be tested. All three filters have a height of 130 cm, of which the lowest 30 cm consist of gravel acting as drainage layer. Just like conventional RSFs, reeds are planted on the surface of the pilot system.
Filter material of Filter 1 and 2 was taken from existing full-scale RSFs in Altendorf and Kaster, re-spectively. Both are used for the treatment of combined sewer overflow and are in use since 2005. Due to different loading rates, Kaster RSF has a higher level of organic matter than Altendorf RSF. This organic matter is self-grown during the operational period.
Filter 1 consists of 100 cm of sandy filter material with 30 vol.-% of CaCO3 in addition. Organic sub-stances of max 4 vol.-% accumulate in the upper 10 cm. Filter 2 consists of 100 cm of sandy filter material with only 20 vol.-% of CaCO3 addition. The amount of organic material in the upper 10 cm does not exceed 14 vol.-%. Filter 3 consists of new filter sand and 13 vol.-% of biochar in the upper 10 cm. These are followed by 60 cm of sandy filter material to which max. 26 vol.-% of CaCO3 are added. The lowest 30 cm of the filter contain 40 vol.-% of GAC.
Three sampling tubes are installed on each pilot scale RSF which enable sampling of each layer sepa-rately (at 0.1, 0.3, 0.75 m depth for Filter 1 and 2; 0.2, 0.5, 0.8 m depth for Filter 3). A separate outlet for each filter system allows a direct connection to the drainage layer and hence to the outflow of each filter (Figure 4).

D3.2: Combining constructed wetlands and engineered treatment for surface water protection 7
Figure 4 Schematic view of the setup of one exemplary filter within the pilot plant.
3.2 Site 12: Schönerlinde
As shown in Figure 5, secondary effluent is further treated with ozone, followed by two vertical-flow CW and different deep-bed filter systems.
Figure 5 Simplified flow-scheme of pilot-plants at demonstration Site 12.

D3.2: Combining constructed wetlands and engineered treatment for surface water protection 8
The ozonation unit was operated with a target value for the applied ozone dose of 0.7 mg O3/mg DOC. During the first months of operation a constant ozone dose of 7.7 mg O3/L was applied assuming a constant DOC of 11 mg/L in the WWTP effluent. Later a closed-loop control for ozone dosing was implemented based on the online monitoring of the UVA254 elimination (ΔUVA254). The ΔUVA254 target value corresponding to the desired applied ozone dose of 0.7 mg O3/mg DOC was determined to 47 %. Hydraulic retention time in the ozone reactors was >15 min in order to guarantee a complete reaction of ozone with wastewater constituents and that no residual ozone occurs in the effluent.
Both CWs have a surface area of 11 m² each and were planted with Phragmites australis and Carex acutiformis in equal parts. In CW1, technical sand is used as filter material (bed depth = 0.55 m, d = 0.2-2 mm). In CW2, coarser filter material (bed depth = 0.8 m) consisting of a homogeneous mix of lava gravel (d = 4-8 mm) and biochar (d = 8-20 mm) is tested. As displayed in Figure 6, they were operated under saturated conditions with filtration rates of approximately 200 mm/d, 400 mm/d and 1000 mm/d during different phases of testing.
All deep-bed filter columns are constructed identically with a diameter of 0.3 m but differ in their filter media. The 3 filters BAC, S/BAC and S/A which are operated in parallel contain activated carbon (d = 1.4-2.4 mm), sand (d = 0.7-1.25 mm) / activated carbon (d = 1.4-2.4 mm) and sand (d = 0.7-1.25 mm) / anthracite (d = 1.4-2.5 mm), respectively. The post-GAC filter is operated with activated carbon (d = 0.6-2.4 mm) subsequent to the S/A. The dual-media filters S/A and S/BAC are additionally equipped with coagulant dosing for phosphorus removal. After commissioning, the filters were operated at fil-tration rates of 10 m/h which were later reduced to 5 m/h and in the case of the BAC filter even further to 2.5 m/h (Figure 6). The post-GAC filter was run at 3.6 m/h which corresponds to 30 min empty bed contact time (EBCT).
In total the pilot plant was operated from May 2017 until December 2018 in the framework of the AquaNES project.
Figure 6 Overview of operational phases and parameters applied for ozonation, deep-bed filters and con-
structed wetlands.
Ozonation O3
1 BAC
2 S/BAC
3 S/A
4 post-GAC
1 CW 1
2 CW 2
2018
Dez
vF ≈ 2.5 m/h (EBCT ≈ 30 min)
vF ≈ 5 m/h (EBCT ≈ 15 min)+ coagulant dosing
vF ≈ 5 m/h (EBCT ≈ 15 min)+ coagulant dosing
vF ≈ 3.6 m/h(EBCT ≈ 30 min)
vF ≈ 1000 mm/d(HRT ≈ 10 h)
vF ≈ 1000 mm/d(HRT ≈ 10 h)
Constructed wetlands
Start-up phasevF ≈ 100 mm/d
vF ≈ 200 mm/d(HRT ≈ 48 h)
vF ≈ 400 mm/d(HRT ≈ 24 h)
Start-up phasevF ≈ 300 mm/d
vF ≈ 200 mm/d(HRT ≈ 48 h)
vF ≈ 400 mm/d(HRT ≈ 24 h)
Okt Nov
Specific ozone dose = 0.7 mg O3/mg DOCor ΔUVA254 = 47 %
Deep-bed filters
vF ≈ 10 m/h (EBCT ≈ 7.5 min) vF ≈ 5 m/h (EBCT ≈ 15 min)
vF ≈ 10 m/h (EBCT ≈ 7.5 min)+ coagulant dosing
vF ≈ 10 m/h (EBCT ≈ 7.5 min)+ coagulant dosing
Apr May Jun Jul Aug SepOkt Nov Dec Jan Feb MarProcess Nr. Abbre-
viation
2017
May Jun Jul Aug Sep

D3.2: Combining constructed wetlands and engineered treatment for surface water protection 9
3.3 Site 13: Packington
The Severn Trent Water owned Packington WWTP treats the domestic sewage from residents as well as effluents from industries in the area with a dry weather flow of 57 l/s. The current treatment scheme of the full-scale site comprises screening and grit removal in the inlet works, biological treatment in 2 oxidation ditches in parallel followed by clarification and tertiary filtration in a deep bed sand filter. The final effluent from the WWTP is discharged in the Gilwiskaw Brook which flows into the River Mease. The River Mease catchment is designated as Special Area of Conservation (SAC) under the EC Habitats Directive (92/43/EEC) and a Site of Special Scientific Interest (SSSI). The current consent of the Packington WWTP for P discharge is 1 mgP/L but to meet the objective set by the WFD, the consent will be reduced to at least 0.3 mgP/L and could be as low as 0.1 mgP/L in the near future. As such, the site provides the perfect setting to trial novel P removal technologies.
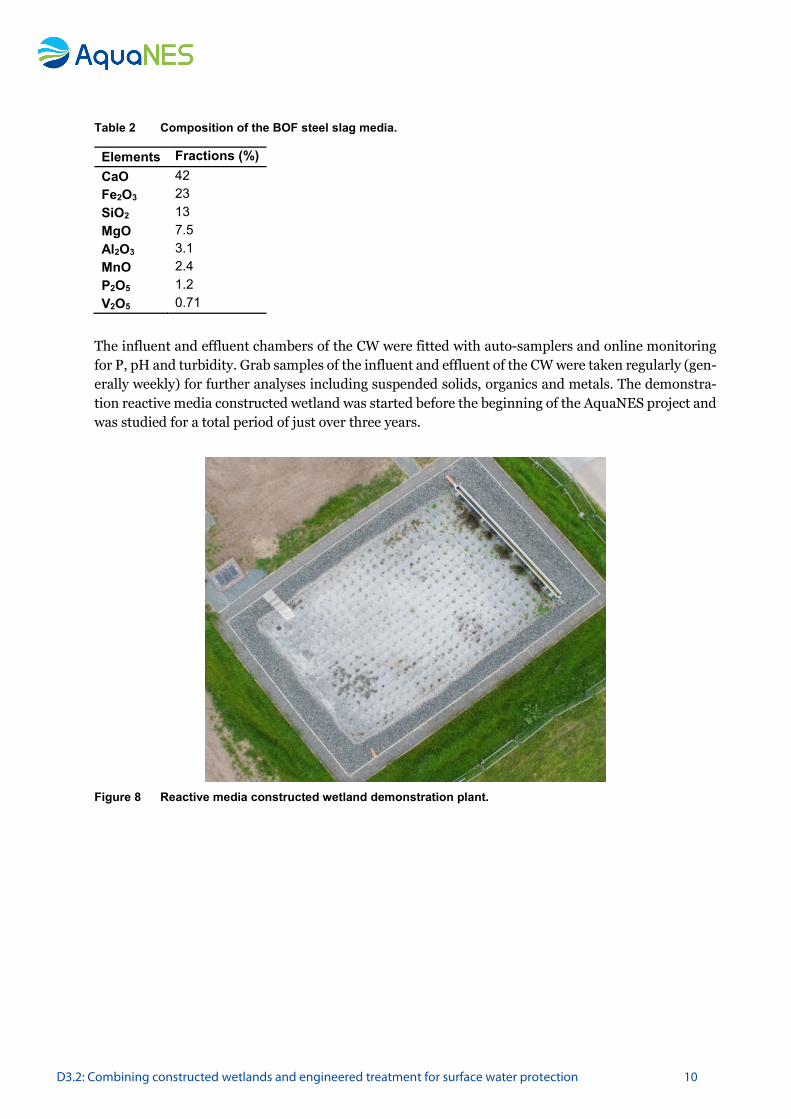
The demonstration scale reactive media constructed wetland installed on the Packington WWTP was fed with secondary treated effluent (Figure 7). The effluent from the full-scale oxidation ditches was taken after clarification but before the sand filter, to simulate a typical combination of engineered bi-ological system followed by constructed wetland, and fed to a flash mixing tank, in which the P con-centration (dosing of acid phosphoric) can be adjusted for the purpose of the trial, before being fed to the demonstration CW. The reactive media CW is a standard horizontal subsurface flow design with a surface area of 100 m2 and a depth of 0.6 m. The reactive media used is blast oxygen furnace (BOF) steel slag with particle size ranging between 8 and 14 mm. Steel slag, a waste product from the steel industry, is mainly made of calcium oxide and other metal oxides such as iron, magnesium and alu-minium (Table 2), all known to react well with P to form precipitates or act as adsorbents. The bed was planted with Phragmites australis reeds at 4 plants/m2 (Figure 8). The CW was fed at a flow rate of 0.35 L/s, corresponding to an EBCT of 48 hours.
Figure 7 Process flow diagram at demonstration Site 13.
D3.2: Combining constructed wetlands and engineered treatment for surface water protection 10
Table 2 Composition of the BOF steel slag media.
Elements Fractions (%) CaO 42 Fe2O3 23 SiO2 13 MgO 7.5 Al2O3 3.1 MnO 2.4 P2O5 1.2 V2O5 0.71
The influent and effluent chambers of the CW were fitted with auto-samplers and online monitoring for P, pH and turbidity. Grab samples of the influent and effluent of the CW were taken regularly (gen-erally weekly) for further analyses including suspended solids, organics and metals. The demonstra-tion reactive media constructed wetland was started before the beginning of the AquaNES project and was studied for a total period of just over three years.
Figure 8 Reactive media constructed wetland demonstration plant.

D3.2: Combining constructed wetlands and engineered treatment for surface water protection 11
4 Results
4.1 Sites performance
4.1.1 Site 11: Rheinbach
4.1.1.1 Filter material
The pilot scale RSF 1 and 2 respectively contain material from two different full-scale RSFs which both have been in operation since 2005 to treat combined sewer overflows. The advantage of these materi-als is the already established microbial community as well as self-grown organic matter. In contrast, RSF 3 contains new filter material with the addition of biochar to the filter sand in the upper layer and granular activated carbon (GAC) in the bottom later, both materials providing sorption of pollutants. The upper 70 cm layer of filter material protected the GAC layer from fast loading.
The filter material properties as a result of a sampling campaign in December 2016 are presented in Figure 9. The results clearly show the accumulation of organic matter in the upper layer. This also leads to higher amounts of silt and clay in this layer. Due to different operational conditions for the original RSFs from which the media were used in Filter 1 and 2, Filter 2 contains higher amounts of organic matter. CaCO3 is used to stabilize the pH during nitrification processes to prevent the remo-bilization of sorbed heavy metals. As a result, CaCO3 concentrations reduce with time and can be used as an indicator to determine the operational lifetime of the systems. As expected CaCO3 concentrations are lower in the upper layer with the highest pollutant load. At that stage of operation, the CaCO3 concentrations do not indicate a near-term breakthrough.
Figure 9 Organic matter, silt and clay as well as content (weight percent) in the individual layers of the three
pilot filters. No samples were taken from the GAC of filter 3.
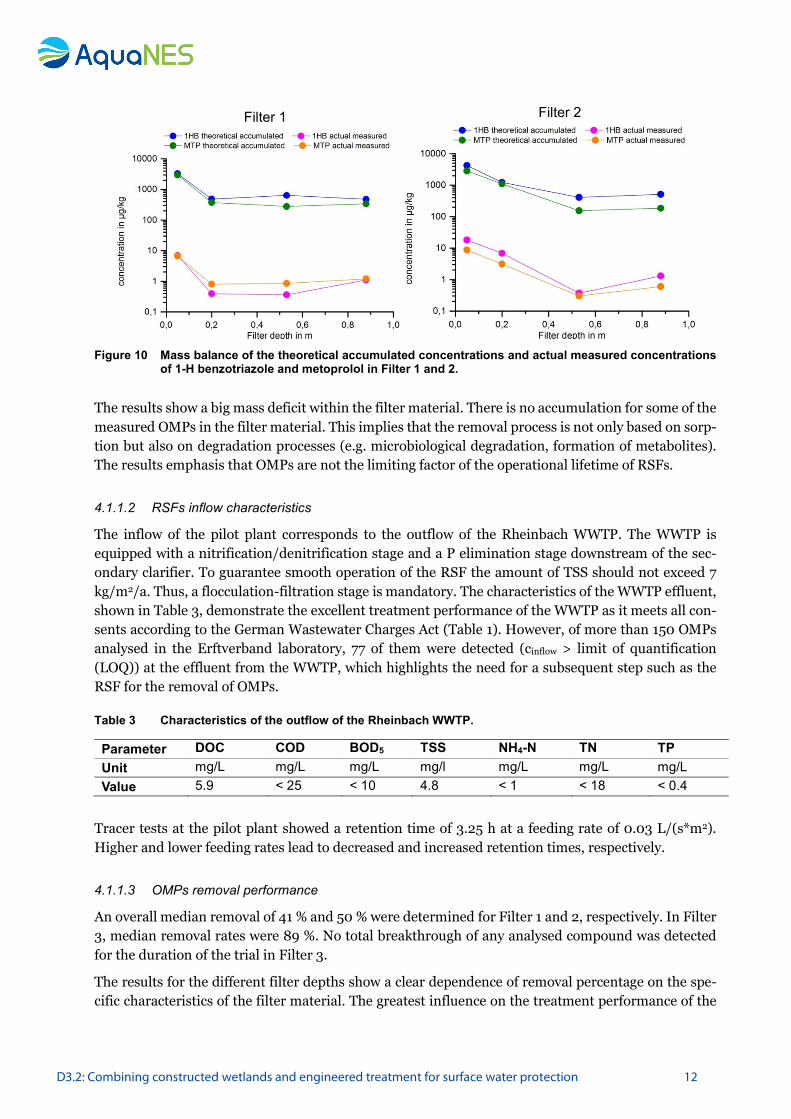
The filter material was also analysed for OMPs concentrations. Theoretical accumulated concentra-tions were calculated based on the reduction rates measured. The basis for this is the assumption that the retained substance is completely sorbed onto the filter material. Figure 10 compares the theoreti-cally accumulated concentrations in the filter material for 27 months of operation and the actual meas-ured concentrations in November 2016 based on the example of 1-H benzotriazole and metoprolol for Filter 1 and 2.
D3.2: Combining constructed wetlands and engineered treatment for surface water protection 12
Figure 10 Mass balance of the theoretical accumulated concentrations and actual measured concentrations
of 1-H benzotriazole and metoprolol in Filter 1 and 2.
The results show a big mass deficit within the filter material. There is no accumulation for some of the measured OMPs in the filter material. This implies that the removal process is not only based on sorp-tion but also on degradation processes (e.g. microbiological degradation, formation of metabolites). The results emphasis that OMPs are not the limiting factor of the operational lifetime of RSFs.
4.1.1.2 RSFs inflow characteristics
The inflow of the pilot plant corresponds to the outflow of the Rheinbach WWTP. The WWTP is equipped with a nitrification/denitrification stage and a P elimination stage downstream of the sec-ondary clarifier. To guarantee smooth operation of the RSF the amount of TSS should not exceed 7 kg/m2/a. Thus, a flocculation-filtration stage is mandatory. The characteristics of the WWTP effluent, shown in Table 3, demonstrate the excellent treatment performance of the WWTP as it meets all con-sents according to the German Wastewater Charges Act (Table 1). However, of more than 150 OMPs analysed in the Erftverband laboratory, 77 of them were detected (cinflow > limit of quantification (LOQ)) at the effluent from the WWTP, which highlights the need for a subsequent step such as the RSF for the removal of OMPs.
Table 3 Characteristics of the outflow of the Rheinbach WWTP.
Parameter DOC COD BOD5 TSS NH4-N TN TP Unit mg/L mg/L mg/L mg/l mg/L mg/L mg/L Value 5.9 < 25 < 10 4.8 < 1 < 18 < 0.4
Tracer tests at the pilot plant showed a retention time of 3.25 h at a feeding rate of 0.03 L/(s*m2). Higher and lower feeding rates lead to decreased and increased retention times, respectively.
4.1.1.3 OMPs removal performance
An overall median removal of 41 % and 50 % were determined for Filter 1 and 2, respectively. In Filter 3, median removal rates were 89 %. No total breakthrough of any analysed compound was detected for the duration of the trial in Filter 3.
The results for the different filter depths show a clear dependence of removal percentage on the spe-cific characteristics of the filter material. The greatest influence on the treatment performance of the
Filter 1 Filter 2

D3.2: Combining constructed wetlands and engineered treatment for surface water protection 13
conventional filters (Filter 1 and 2) was the amount of organic matter in the uppermost filter layer as Filter 2 shows better results than Filter 1 (Figure 11). Similar results were observed in lab-scale bio-degradation experiments on 1 H-benzotriazole (Figure 16). This shows that removal efficiency in-creases with greater amounts of organic matter.
The removal efficiency in the optimised RSF (Filter 3) is positively influenced by the addition of bio-char in the top and GAC in the bottom filter layers. Both materials increase the sorption capacity of the filter. The middle part of the RSFs (ca. 10 – 60 cm) with no substrate additive have only very little influence on the reduction rates. Figure 11 shows exemplarily the concentration of 1-H benzotriazole and diclofenac for all three pilot RSFs at the different filter depths.
Figure 11 Behaviour of OMP concentrations in RSFs shown for the example of 1-H benzotriazole and diclo-
fenac.
The removal efficiency of the RSFs for OMPs varies widely. Very good reduction rates are obtained by Filter 3 for most compounds due to the increased sorption capacity of the GAC and the biochar. Re-duction rates in Filter 1 and 2 show greater variations. Metoprolol, galaxolide and gabapentin for ex-ample are removed very well; carbamazepine, sulfamethoxazole and amidotrizoate were not removed within the conventional RSFs (Figure 12).
Figure 12 Removal efficiency in conventional RSF for exemplary compounds.

D3.2: Combining constructed wetlands and engineered treatment for surface water protection 14
4.1.1.4 Seasonal and long-term development
Seasonal variations can be observed for some compounds. Figure 13 shows the reduction rates for metroprolol and galaxolide in Filter 1 for summer and winter time. Both compounds show better re-duction rates in spring/summer when the average temperature is highest.
Figure 13 Reduction rates of metoprolol and galaxolide in Filter 1 over time.
1H-benzotriazole does not show any seasonal trend but it clearly shows that reduction rates improve over time. The filter needs a start-up phase of about 0.5 year to reach optimal removal (Figure 14). This might be the result from the accumulation of organic matter with longer operational lifetime.
Figure 14 Reduction rate of 1H-benzotriazole in filter 1.
4.1.1.5 Removal processes
It was tested whether removal rates are related to the hydrophobicity of the pollutants. For hydropho-bic compounds, sorption would be expected as a reduction process. As shown in Figure 15, the removal

D3.2: Combining constructed wetlands and engineered treatment for surface water protection 15
rates cannot be directly related to their octanol/water distribution coefficient (LogD values). There-fore, electrostatic sorption of charged compounds and biodegradation are most likely occurring.
Figure 15 Reduction rates of RSF 1 in relation to LogD values (ocatonal/water distribution coefficient) and
charges of the compounds at pH7.
Biodegradation was evaluated in laboratory batch tests with filter material from the pilot RSF 2 on the example of 1-H benzotriazole. Removal rates for different contact times and filter layers were deter-mined. The results showed that the removal of 1-H benzotriazole increases with increasing contact time. A positive correlation between the amount of organic matter in the filter material and the reduc-tion efficiency can be observed (Figure 16). The results also suggest that, besides sorption, microbio-logical degradation contributes to the removal process.
Figure 16 Removal rates vs. contact time and removal rates vs. organic matter content for 1-H benzotriazole
in laboratory batch tests with pilot RSF Filter 2 material.

D3.2: Combining constructed wetlands and engineered treatment for surface water protection 16
4.1.1.6 Microbial indicator removal
The monitoring of microbial indicators started in February 2017. The concentration of Coliform bac-teria in the WWTP effluent amounts to a mean concentration of 104 MPN/100 mL. They are reduced by 1-2 log-units in the pilot RSFs (Figure 17). E.coli concentrations in the WWTP effluent were meas-ured at a mean concentration of more than 103 MPN/100 mL. They are reduced by 1 log-units in the pilot RSFs (Figure 17). The threshold for bathing water quality is set at 103 MPN/100 mL E. coli for the 95th percentile. The outflow of the Rheinbach WWTP exceeds this threshold but additional treat-ment of the WWTP effluent by the RSFs allows for the threshold of the bathing water quality to be met.
Figure 17 Mean concentrations of Coliform Bacteria and E. coli in the inflow and outflow of the pilot RSFs.
4.1.1.7 Hydraulic retention time
In a test conducted between July and September 2017 to evalute the impact of the feeding rate on the performance, the influent loading rate to Filter 2 and 3 was lowered to 0.01 L/s/m2 and then raised to 0.06 L/s/m2 for one month each (Table 4). Filter 1 remained unchanged as a reference filter. The increase of the feeding rate to 0.06 L/(s*m2) leads to shorter retention times of down to 1.5 hours. Lower feeding rates of 0.01 L/(s*m2) result in longer retention times of up to 9.5 hours.
This test on the pilot system shows the same results as the lab tests on biodegradation (Figure 16). Indeed, lower feeding rates lead to higher reduction rates for several compounds due to a longer contact time. Higher feeding rates and hence shorter contact times lead to lower reduction rates (Table 5). Similar tests on the influences of longer contact times on the purification efficiency were done in September 2016. The water was impounded in the pilot filter for up to 6 hours. Here again the remval efficiency improved with longer contact times.
Table 4 Sampling plan for different hydraulic retention times.
Period Number Samples Flow rate Filter 1 (L/(s*m2))
Flow rate Filter 2 (L/(s*m2))
Flow rate Filter 3 (L/(s*m2)) Inflow/
outflow Filter layers
1 month (July) 4 1 0.03 0.01 0.01 1 month (August) 4 - 0.03 0.03 0.03 1 month (September) 4 1 0.03 0.06 0.06

D3.2: Combining constructed wetlands and engineered treatment for surface water protection 17
Table 5 Reduction rates of some exemplary parameters for different feeding rates.
Flow rate (L/ (s*m2))
DOC [%]
DCF [%]
CBZ [%]
MET [%]
SOL [%]
BZA [%]
n
Filter 1 0.03 21.39 33.88 1.15 73.86 18.03 36.84 22
Filter 2 0.03 23.89 44.87 4.0 84.09 30.06 45.05 22
Filter 3 0.03 94.33 99,27 91.22 98.26 97.12 99.34 22
Filter 2 0.01 31.20 92.77 -0.98 94.08 73.19 79.31 4
Filter 2 0.06 22.71 48.86 -9.66 66.94 33.59 57.73 4
Filter 3 0.01 70.08 98.94 83.60 96.14 95.12 99.12 4
Filter 3 0.06 60.13 99.43 84.08 97.29 94.91 99.29 4
4.1.1.8 Lifetime of GAC
While DOC removal in conventional RSFs remains stable throughout the years, special focus is set on the GAC. 200 L of GAC were mixed into the filter sand of Filter 3. At a feeding rate of 0.03 L/(s*m2), Filter 3 treated 45.5 bed volumes (BV) per week which corresponds to about 2400 treated bed volumes per year. Below 2500 BV the median DOC removal exceeded 88 %. After 2500 BV the removal slightly decreased (Figure 18). Similar values for different kinds of GAC filters can be found in literature. A partial breakthrough is also seen for Metformin and Amidotrizoic acid in Filter 3. However, all of the other micro-pollutants investigated are still removed by more than 80 % (Figure 18).
Figure 18 DOC removal in conventional and GAC RSF per treated bed volumina (left) and OMP removal per treated bed volumina of the GAc layer in the GAC RSF (right).
4.1.1.9 Combined treatment of CSO and WWTP effluent
To analyse potential influences of the combined treatment of CSO and WWTP effluent on the removal efficiency, CSO events prior to WWTP effluent feeding were simulated on the conventional Filter 2. Two scenarios were designed in which Filter 2 was fed with artificial CSO in addition to the existing

D3.2: Combining constructed wetlands and engineered treatment for surface water protection 18
WWTP effluent feeding cycle (Figure 19). In scenario 1, a dry period of 18 hours follows the CSO feed-ing before WWTP effluent feeding takes place. In scenario 2, no dry phase occurs. The conventional Filter 1 remained unchanged and acted as a reference.
Figure 19 Combined treatment of CSO and WWTP effluent feeding scenarios
As expected, the RSF is able to transform NH4-N almost completely into NO3-N during the CSO event due to denitrification. Only little influences were detected in Scenario 1 in which low levels of ammonia remained in the test filter. In scenario 2 with no dry period, no influences were detected (Figure 20).
Figure 20 Nitrogen balance for the artificial CSO event, scenario 1 (WWTP I) and 2 (WWTP II).
Figure 21 shows the results for 10 OMPs which were detected in more than 80 % of the inflow samples. Due to the higher inflow concentrations during the CSO event, reduction rates were higher than for the WWTP effluent polishing. In both scenarios, the reduction rates in the test filter remained the same. The dry period does not seem to influence the purification efficiency. Also, the flexible use of CSO and WWTP effluent treatment does not seem to influence the removal efficiency for most of the OMPs. Only in the case of Metformin resolution takes place in the test filter after CSO feeding.
in in in0
4
8
12
16
20
24
28
conc
entra
tion
[mg/
l]
org.-N NO2-N NO3-N NH4-N
CSO WWTP I WWTP II
out te
st
out te
st
out te
st0
4
8
12
16
20
24
28
out c
ontro
l
out c
ontro
l0
4
8
12
16
20
24
28
Scenario 1
Scenario 2

D3.2: Combining constructed wetlands and engineered treatment for surface water protection 19
Figure 21 Mean reduction rates of selected OMPs for scenario 1 and 2 (error bar show standard deviation).
Greater influences can be seen for E.coli removal (Figure 22). During the CSO feeding phase, a reduc-tion of almost 2-log steps was detected. During WWTP effluent feeding with lower inflow concentra-tions of E.coli, a reduction of at least 1-log step is shown in the reference filter but no decrease and even an increase of E.coli concentration was seen in the test filter. Interestingly, the concentrations still remained at the threshold for EU Bathing Water quality of 103 MPN/100 mL of the 95th percentile.
Figure 22 Mean E.coli concentration in the in- and outflow of the CSO event, scenario1 (WWTP I) and 2 (WWTP II) (error bar show standard deviation).
0,01
0,1
1
10
0,01
0,1
1
10
0,01
0,1
1
10 cso test-filter
c(ou
t) / c
(in)
wwtp test-filter
1H-be
nzotr
iazole
carba
mazep
ine
diatriz
oate
diclof
enac
gaba
penti
n
HHCB
metform
in
metopro
lol
sotal
olTCPP
Removal efficiency during scenario 1
wwtp control-filter
0,001
0,01
0,1
1
10
0,001
0,01
0,1
1
10
0,001
0,01
0,1
1
10cso test-filter
c(ou
t) / c
(in)
1H-be
nzotr
iazole
carba
mazep
ine
diatriz
oate
diclof
enac
gaba
penti
n
HHCB
metform
in
metopro
lol
sotal
olTCPP
Removal efficiency during scenario 2
wwtp test-filterwwtp control-filter

D3.2: Combining constructed wetlands and engineered treatment for surface water protection 20
4.1.2 Site 12: Schönerlinde
4.1.2.1 Closed-loop control of ozone dose
The ozone unit was aimed to be operated at an applied ozone dose of 0.7 mg O3/mg DOC. Since reliable and cost-efficient online DOC analysers are not available a closed-loop control based on surrogate parameter UVA254 was applied. UVA254 is monitored online in the influent and effluent of the ozone treatment with 2 separate probes and the reduction of UVA254 in percent (ΔUVA254) is calculated as follows:
ΔUVA254 = (1 − UVA254,effluent/UVA254,influent) ∙ 100 %
The closed-loop control system was successfully implemented in the ozone unit and guarantees that the applied ozone dose always covers the current demand, independent of influent water quality vari-ations. The target value of ΔUVA254 that corresponds to the desired ozone dose of 0.7 mg O3/mg DOC was determined to be 47 %. Figure 23 shows operational data for a period of approximately 6 days during which influent UVA254 varied from below 20 1/m up to almost 30 1/m. It was demonstrated that despite influent quality fluctuations ΔUVA254 remained rather constant at the desired level. Alt-mann et al. (2016 a) showed a clear correlation between OMPs and UVA254 reduction. Thus, it can be assumed that OMPs removal performance is satisfying as long as the desired ΔUVA254 is reached.
Figure 23 Operational data from the ozone unit for UVA254,influent, UVA254,effluent and ΔUVA254 (calcu-lated) while closed-loop control was active.
A critical component in the influent of an ozonation is nitrite. It is oxidised very quickly by ozone and has a stoichiometric consumption of 3,43 mg O3/mg NO2-N. Therefore nitrite peaks substantially lower the effective ozone dose available for OMPs removal or disinfection. A major advantage of the ΔUVA254 control system is that nitrite peaks can be compensated (Stapf et al., 2016). Reduced OMP removal due to nitrite would also result in a decrease of ΔUVA254 which leads to an immediate response of the control system to adapt the ozone dose.
Overall, operation with the ΔUVA254 control system is more economic (no overdosing), more reliable with respect to OMPs removal and disinfection and more robust against peaks of ozone consuming compounds like nitrite.

D3.2: Combining constructed wetlands and engineered treatment for surface water protection 21
4.1.2.2 Organic bulk parameters
Organic bulk parameters DOC and COD are a simple way to assess the behaviour of organic com-pounds in the different treatment steps. As shown in Figure 24, almost no removal for DOC was ob-served during ozonation whereas COD was reduced by 14 % on average. This is in line with the knowledge that ozone treatment does not lead to mineralization but to partial oxidation of organic matter. The oxidation products usually have an increased biodegradability which could be demon-strated with additional BOD5 analyses. In a total of 9 grab samplings, the influent BOD5 of <3-5 mg/L was raised by ~50 % on average during the ozonation process (data not shown).
All post-treatment steps showed substantial reduction for the organic bulk parameters. Average re-moval for DOC and COD was very similar in CW1 (21.9 % and 32.4 %, respectively) and CW2 (21.4 % and 32.6 %, respectively). Both CWs performed better than the deep-bed filters that were operated in parallel. The S/A filter only achieved mean reductions of 14.8 % for DOC and 23.1 % for COD even though it had additional coagulant dosing in the influent which is known to have beneficial effects on the removal of organics. It is likely that the extended HRT in the CWs is responsible for the improved removal of organic matter compared to the deep-bed filters, since it provides more time for microbio-logical degradation processes. Dissolved oxygen (DO) measurements support that hypothesis. Indeed the oxygen oversaturated ozonation effluent is reduced to a DO of 4.6 mg/L (CW1) and 2.4 mg/L (CW2) on average while the S/A filter still had a mean effluent concentration of 18.6 mg/L.
Figure 24 Boxplots of DOC (left, n=22-24) and COD (right, n=22-24) concentrations at different sampling points.
Both CWs were operated at different hydraulic loading rates (HRL) and hence different HRT. As shown in Figure 25 (left) average DOC removal in the CWs stayed constant during all three operational phases (200, 400 and 1000 mm/d). A reduction of HRT did not result in decreased DOC removal. In contrast, DOC abatement in deep-bed filters did show sensitivity to filtration rates. After changing the hydraulic loading conditions from ~10 m/h to ~5 m/h all filters (BAC, S/BAC and S/A) exhibited an improved DOC reduction (Figure 25, right). While the HRTs in CWs ranged from multiple hours to days it was only several minutes in the deep-bed filters. Most likely the readily biodegradable fraction of DOC could already be removed completely at the lowest HRT tested in the CWs. Therefore an in-crease in HRT did not promote removal of organic matter. With HRT of only several minutes in the deep-bed filters biodegradation processes are incomplete and thus, they can be enhanced by a pro-longed contact time. The improvement of DOC removal is more pronounced for BAC and S/BAC com-pared to the S/A filter. Results indicate that biodegradation processes are more intense in the BAC layer than in the anthracite layer. The DOC reduction in the S/A filter always stayed below the S/BAC

D3.2: Combining constructed wetlands and engineered treatment for surface water protection 22
although both filters are identically constructed and operated (also same amount of coagulant dosing). Accordingly, oxygen consumption in the S/BAC was also higher than in the S/A (by ~1 mg/L) which further supports the assumption. An enhanced bioactivity on BAC compared to anthracite explains why BAC filters were more sensitive to changes in HRT.
Figure 25 Mean DOC removal with standard deviation at different HLR in CW (left, n=5-10) and deep-bed fil-
ters (right).
Additional potential impacting factors on DOC removal were investigated. No correlation was found for water temperature. In contrast, influent DOC concentration could have an impact on the removal, as depicted in Figure 26. Since the pilot-plant was fed with WWTP effluent it is likely that higher DOC concentrations were caused by incomplete degradation of organic matter in the activated sludge pro-cess. As a consequence the biodegradable fraction was higher when increased DOC influent concen-trations occurred. Considering the previous assumption that readily biodegradable organic matter is fully removed in the CWs, a higher biodegradable fraction directly results in an enhanced removal.
Figure 26 Influent concentration dependence of DOC removal in CW1 (left) and CW2 (right).
4.1.2.3 Organic micropollutants
A set of 25 OMPs was monitored during the study period. They are listed below according to their source:
– pharmaceuticals and metabolites: 4-formylaminoantipyrine (FAA), bezafibrate (BEZ), candesartan (CAN), carbamazepine (CBZ), clarithromycin (CLA), diclofenac (DCF), 4-OH-diclofenac (4OH-DCF), gabapentin (GAB), gabapentin lactam (GAB-LA), metformin (MEF), metoprolol (MET), oxipurinol (OXI), primidone (PRI), olmesartan (OLM), sulfomethoxazole (SMX), valsartan (VAL), valsartan acid (VALA)
– x-ray contrast media: amidotrizoate (ATS), iopamidole (IOP)

D3.2: Combining constructed wetlands and engineered treatment for surface water protection 23
– industrial chemicals: benzotriazole (BTA), tris-(chloroisopropyl)-phosphate (TCPP), perfluorooctanesulfonic acid (PFOS)
– pesticides: mecoprop (MEC), tertbutryn (TER) – artificial sweetener: acesulfame (ACE)
The behaviour of the investigated compounds during ozone treatment varied significantly. As shown in Figure 27, average removal ranged from 99 % for 4-formylaminoantipyrine (FAA) to ~0 % for met-formin (MEF) and amidotrizoate (ATS). These big differences in removal efficiency demonstrate the substance specificity of the ozone reaction in water. Especially compounds that contain carbon double bonds, aromatic systems and non-protonated amines are prone for oxidation by ozone (von Gunten, 2003). Many compounds were reduced below the level of quantification (LOQ) which can lead to un-certainties in the calculated removal if influent concentrations are not sufficiently high. Removals de-picted in Figure 27 were determined by a conservative approach (if value < LOQ it was replaced by LOQ) and it has to be considered that actual removal efficiency might be higher for certain compounds.
Figure 27 Mean removals of monitored OMP during ozonation calculated with conservative approach regard-ing LOQ (when effluent concentration was <LOQ the value of LOQ was used for calculation).
In order to assess the effectiveness of ozone treatment the different OMPs were grouped in 3 catego-ries: good (removal ≥ 80 %), moderate (50 % ≤ removal < 80 %) and poor (removal < 50 %), as shown in Table 6. Only 7 substances were removed by ≥ 80 %. This result would drastically change if an op-timistic approach (if value < LOQ it is replaced by “0”) was chosen for calculation of removals. Good removal would be achieved additionally for CLA, TER, SMX, BEZ, ACE and MEC. Reaction rate con-stants from literature can help to clarify uncertainties. SMX and CLA are described as well removable by ozone due to their high reaction rate constants >104 M-1s-1, while ACE, MEC and BEZ have moderate reaction rate constants between 10 and 104 M-1s-1 (Jekel et al., 2015).

D3.2: Combining constructed wetlands and engineered treatment for surface water protection 24
Table 6 Overview of results for OMP removal during ozone treatment.
Category Criteria Substance Number of substances
Good removal removal ≥ 80 % FAA, DCF, CBZ, OLM, 4-OH-DCF, MET, CAN 7
Moderate removal 50 % ≤ removal < 80 % BTA, VAL, VALA, CLA, GAB-LA, PRI, TER, SMX, GAB 9
Poor removal removal < 50 % BEZ, OXI, ACE, IOP, MEC, MEF, ATS, TCPP 8
The substance PFOS was never detected in the ozonation influent. Flame retardant TCPP was con-stantly measured at higher concentrations in the ozonation effluent than in the influent, which could not be clarified during the project.
Since several compounds are not fully removed during ozonation the question arises whether post-treatment in CW can also contribute to OMPs removal. Due to either low concentrations or recalcitrant nature only 11 suitable substances remain for the assessment of post-treatment. Figure 28 displays the average removal of these compounds in the CWs.
In CW1 significant reductions were only observed for TCPP (66 %) and VAL (61 %). Since no relevant adsorption can be expected in CW1 (only sand as filter media) the removal is likely to be dominated by biological transformation. These results are supported by other studies where biodegradation of TCPP (Brunsch et al., 2018) and Valsartan (Altmann et al., 2016 b) were observed in tertiary wastewater treatment. In spite of the biochar added to filter material of CW2 no additional removal could be observed for TCPP and VAL compared to CW1. With reductions of 50 % for both compounds they were even slightly lower. Therefore it is assumed that biological processes play the dominant role like in CW1. In the S/A filter operated in parallel, neither TCPP nor VAL were removed. This outcome indicates that sufficient retention time is crucial for OMPs removal by biological transformation pro-cesses.
Figure 28 Mean removals with standard deviations (n=8-25) of OMP during post-treatment in CW calculated
with conservative approach regarding LOQ.

D3.2: Combining constructed wetlands and engineered treatment for surface water protection 25
Additional removal in CW2 that was not observed in CW1 did occur for BTA (90 %), MET (44 %) and OXI (20 %). Since all three compounds are known to be well adsorbable, removal can be explained by adsorption onto biochar. It has to be considered that removal efficiency for these substances will de-crease with advancing breakthrough.
The results for average removals of the 3 compounds are reflected by the slopes of their breakthrough curves, as depicted in Figure 29 (left). The substance with the highest average removal, ΒTA, exhibited the slowest breakthrough that reached only ~30 % by the end of the study period. OXI showed the fastest breakthrough corresponding to the lowest mean removal of the 3 substances. Full breakthrough for OXI was observed after ~300 d of run time, while for MET it was reached after ~400 d. These results demonstrate that biochar addition to the filter material can be beneficial for removal of well adsorbing compounds. However, when comparing the breakthrough of BTA (plotted over normalised throughput [carbon bed volumes]) in CW2 with the activated carbon filter S/BAC adsorption capacity of biochar was revealed to be very limited. As shown in Figure 29 (right), ~30 % BTA breakthrough in CW2 was reached after ~650 bed volumes whereas it was still below 25 % after more than 40000 bed volumes in the S/BAC filter. Since exchange of biochar is not possible without renewing the entire filter bed including plants it is questionable whether the use of biochar makes sense for long time operation.
Figure 29 Breakthrough curve over run time for OXI, MET and BET in CW2 (left) and BTA breakthrough curve
over bed volumes for CW2 and S/BAC filter (right).
4.1.2.4 Transformation products
Bromate is a critical inorganic transformation product that is formed by ozone treatment from bro-mide. Due to its potential carcino-genic and mutagenic effect WHO defined a threshold of 10 µg/L in their Drinking Water Guideline. Once formed during ozonation it cannot be removed under oxic con-ditions. Thus, it is important to prevent the formation of relevant concentrations. Typical bromide effluent concentrations at the Schönerlinde WWTP range from 100 to 200 µg/L. Four sampling events with different ozone doses were carried out for ozonation influent and effluent and bromate formation was quantified. As shown in Figure 30, even with the highest ozone dose (9.9 mg O3/L) only ~5 µg/L bromate were formed which corresponds to half of the WHO Drinking Water Guideline (WHO, 2011). Since target ozone dose is 7-8 mg O3/L (approximately as in sampling 2 and 3) even lower bromate concentrations of around 2 µg/L are expected and are not considered a risk

D3.2: Combining constructed wetlands and engineered treatment for surface water protection 26
Figure 30 Bromate formation at different ozone doses.
A relevant group of potential organic transformation products from ozonation are nitrosamines. The most important representative is N-Nitrosodimethylamine (NDMA). Due to its toxicological rele-vance, WHO Drinking Water Guideline suggests a concentration of 100 ng/L. NDMA formation is not as sensitive to ozone dose as bromate formation. The presence of potential precursors of NDMA in the ozonation influent is much more relevant. Hence, 4 sampling events were carried out over one week (Monday, Wednesday, Friday, Sunday) in order to take potential changes of precursor concentrations into account. NDMA formation was relatively stable between 22 and 33 ng/L, as displayed in Figure 31 (left). During post-treatment NDMA was removed efficiently below LOQ in CW1 as well as in deep-bed filters (Figure 31, right). These results demonstrate that the CW fulfil the main function of the post-treatment: the removal of biodegradable organic transformation products formed by ozonation.
Figure 31 NDMA formation at 4 different days during 1 week (left) and average NDMA concentrations (n=3) at
different sampling points (right).

D3.2: Combining constructed wetlands and engineered treatment for surface water protection 27
4.1.2.5 Disinfection
Pathogen indicator organisms E. coli and Enterococci were found in the secondary effluent at median concentrations of 2.0*104 MPN/100 mL and 5.7*103 MPN/100 mL, respectively. As depicted in Figure 32, both parameters were reduced to low levels during ozonation, mostly below 102 MPN/100 mL. These results demonstrate that ozone is an efficient chemical disinfection agent that reaches E. coli and Enterococci removals ≥2 log-units at applied target ozone doses of 0.7 mg O3/mg DOC. The red lines in Figure 32 mark the criteria for excellent quality according EU Bathing Water Directive which apply to the 95th percentile of the samples (500/100 mL for E. coli, 200/100 mL for Enterococci). Ozone treatment without any post-treatment was already able to comply with these quality criteria.
All post-treatment steps further improved microbial effluent quality, except for E. coli in the BAC filter which will be discussed separately. A reliable quantitative assessment of the disinfection performance in post-treatments is not possible because concentrations of E. coli and Enterococci were frequently below LOQ in the filter effluents. The 95th percentiles also decreased after post-treatments. Safety for microbiological water quality with respect to EU Bathing Water Directive can therefore be considered higher for the combined treatment systems than for ozonation as a stand-alone solution.
Median E. coli concentrations remained constant during BAC filtration and the 95th percentile even increased. In contrast to the S/BAC and S/A filters the BAC filter neither has coagulant dosing in the influent nor an additional sand layer. These two impacting factors were not investigated separately. However, it is likely that both of them are beneficial for disinfection. Grain size distribution also showed to have a slight impact on microbial indicator removal in the CWs. Indeed, CW1 with sand (0.2-2 mm) removed both E. coli and Enterococci more robustly (lower 95th percentiles) than CW2 with the coarser mix of gravel (4-8 mm) and biochar (8-20 mm).
Figure 32 Concentrations of E. coli (left, n=10-13) and Enterococci (right, n=10-13) at different sampling points; columns: median, error bars: 25th / 75th percentile, crosses: 95th percentile. (*criteria for excellent quality according to EU Bathing Water Directive).
In addition to EU Bathing Water Directive parameters, microbiological analysis was also carried out for Clostridium perfringens and somatic coliphages which are utilized as indicator parameters for spore-forming bacteria and viruses, respectively. Both are known to be more resistant to disinfection processes and allow for a more holistic assessment of the disinfection capacity. Figure 33 shows the median, 25th and 75th percentile concentrations of the 2 parameters at the different sampling points. C. perfringens and somatic coliphages were present in the WWTP effluent at similar median concen-trations of 6.3*103/100 mL and 5.3*103/100 mL, respectively. As expected ozonation did not reduce

D3.2: Combining constructed wetlands and engineered treatment for surface water protection 28
C. perfringens and coliphages to an extent comparable with E. Coli or Enterococci. Removal was less than 1 log-unit for both parameters which exhibits the short-comings of chemical disinfectant ozone for certain microorganisms.
Interestingly, C. perfringens and coliphages after ozonation were efficiently reduced in post-treat-ments down to median concentrations mostly in the range of 1-10/100 mL which correspond to a re-moval by 2-3 log-units. These results highlight that the combination of ozone and subsequent filtration is effective for a wider range of microorganisms than stand-alone solutions due to different disinfec-tion mechanisms (chemical and physical).
Again, the BAC filter performed worse than all other post-treatment steps reaching only ~1 log-unit reduction for C. perfringens and <2 log-units for somatic coliphages. The poor performance can be explained by the lack of a fine filter material layer and possibly because there is no flocculation step before filtration. Except the BAC filter all deep-bed filters achieved comparable effluent concentra-tions. Hence, there is no clear preference for S/BAC, S/A or S/A+post-GAC with respect to disinfection efficiency. Both CWs performed slightly better than the deep-bed filters indicating that HRT might also be an important factor for disinfection processes during filtration. CW1 showed the best removal performance among all post-treatments with median effluent concentrations for C. perfringens and coliphages below LOQ (1/100 mL). Once again, this demonstrates the relevance of grain size for effi-cient microbial indicator or pathogen removal in the filter bed.
Figure 33 Concentrations of Clostridium perfringens (left, n=9-11) and somatic coliphages (right, n=11-13) at
different sampling points; columns: median, error bars: 25th / 75th percentile.
Additional flow cytometry analyses were conducted and revealed a distinct behaviour of Total Cell Count (TCC) compared to previously discussed microbial parameters. Viable/dead discrimination al-lowed for a better understanding of the processes. As shown in Figure 34, median TCC concentrations of almost 107/mL were observed in secondary WWTP effluent of which approximately 2/3 were viable and 1/3 were dead. TCC reduction during ozonation was low (median: 0.4 log-units) while viable cells were reduced by 1.6 log-units. The concentration of dead cells increased accordingly. These observa-tions can be explained based on working principles of the analytical method and ozone disinfection. Viable/dead distinction is realised by adding a dye agent that enters damaged cells and stains internal cell components. The marked cells are considered dead. Ozone mainly inactivates microorganisms by oxidising and thereby damaging their cell membrane. Since cells are usually not fully destroyed they are still detected by flow cytometry but identified as dead by the staining method. A stronger decrease in viable cells compared to TCC is the consequence.

D3.2: Combining constructed wetlands and engineered treatment for surface water protection 29
Figure 34 Median concentrations of viable and dead cells at different sampling points measured by flow cy-tometry.
The different post-treatment systems only showed minor additional removal for TCC. Viable/dead discrimination revealed that the reduction only took place among the dead cells while viable cells ap-peared at higher concentrations in the post-treatment effluents than in the ozonation effluent. This clearly points at regrowth of cells in the filter beds that are washed out with the effluent. Since this effect did not occur for the above discussed faecal contamination indicators it might be concluded that non-pathogenic microbes were dominant in the re-grown population. Further investigations are nec-essary to verify this assumption.
4.1.2.6 CWs operation without ozone dosing
For a period of approximately 1 month the CWs were operated without previous ozonation in order to compare the performance with the combined ozone and CW treatment.
Since partial oxidation of organic matter by ozone leads to an enhanced biodegradability lower re-moval of organic compounds was expected in the CWs without ozone. Figure 35 shows the comparison of average DOC concentrations in the influents and effluents of the CWs with and without ozone dos-ing. DOC removals of 4 % in CW1 and 9 % in CW2 without ozone confirmed a decreased efficiency compared to the combined treatment (both CW: 21-22 %). This outcome highlights the synergy of the process combination since neither ozone nor CW treatment alone remove considerable amounts of DOC, but combined they do.

D3.2: Combining constructed wetlands and engineered treatment for surface water protection 30
Figure 35 Mean DOC concentrations in CW influent and effluents with (left) and without (right) ozone dosing.
Disinfection was also studied without previous ozone dosing. As displayed in Figure 36, the EU Bath-ing Water Directive indicators E. coli and Enterococci were effectively removed by the CWs as a stand-alone solution. However, median concentrations of both parameters were slightly higher than after the combined treatment (both < LOQ). CW1 performed better than CW2 achieving low levels only slightly above LOQ for E. coli and Enterococci. As postulated before, the finer filter material and hence smaller pores in CW1 are probably responsible for the better results.
CW1 reduced both C. perfringens and somatic coliphages below LOQ like the combined treatment also did. Since ozone was not effective for these parameters it is not surprising that ozone combined with CW1 and CW1 alone achieved the same results. Again CW2 did not perform as efficiently as CW1 for C. perfringens and somatic coliphages with median effluent concentrations of 10-10²/100 mL. With previous ozone dosing median effluent concentrations in CW2 stayed below 10/100 mL.
Figure 36 Median concentrations (n=3) of E. coli, Enterococci, Clostridium perfringens and somatic
coliphages in CW influent and effluents without ozone dosing.
D3.2: Combining constructed wetlands and engineered treatment for surface water protection 31
4.1.3 Site 13: Packington
4.1.3.1 WWTP effluent quality
The full-scale WWTP at Packington already delivers a good quality effluent with low levels of organics, suspended solids and nutrients in its effluent (Table 7). To illustrate, the average COD concentration was 21 mg/L and the BOD5 was always below detection (<2 mg/L) demonstrating that all biodegrada-ble organics were degraded. The very low concentration of ammonia at an average of 0.1 mg/L further confirmed the excellent performance of the oxidation ditches for nitrification. P, which was removed both biologically (EBPR) in the oxidation ditches and chemically (coagulant dosing) up-front of the secondary clarifiers, was reduced down to 1.2 mg/L. As previously stated, the focus of the work at the Packington WWTP was on P removal and because the main aim of the study was to demonstrate the application of the reactive media CW as an sustainable alternative solution to the conventional pro-cesses used for P removal (EBPR and coagulation), the treated effluent from the full-scale WWTP was spiked with P to provide a typical raw wastewater P concentration (7.6 mg/L) before being fed to the demonstration scale CW. This then allowed to assess the full potential of the CW as single step for P removal to low levels, which is particularly relevant for small WWTPs where the conventional pro-cesses can’t be implemented (EBPR) or are not desired (chemical dosing).
Table 7 WWTP effluent quality.
Parameter COD BOD5 TSS TP PO4-
P NH4-N
Total Fe
Calcium pH Alkalini
ty EC
Unit mg/L mg/L mg/L mg/L mg/L mg/L mg/L mg/L - mg/L as
CaCO3 µS/cm
Average 21 < 2 7 1.2 1.1 0.1 0.7 61 7.4 178 831 Standard deviation 3 3 0.4 0.4 0.2 0.3 12 0.2 16 82
4.1.3.2 P removal
The reactive media CW was operated for about 1200 days (a total of 3.3 years with just over 2 years of which as part of the AquaNES project), mostly in continuous steady-state conditions with a feed flow of 1.25 m3/h, corresponding to an empty bed contact time (EBCT) of 48 hours and with a P influent concentration of about 7.6 mg/L (Figure 37), providing a long term assessment of the treatment train. The CW achieved excellent P removal with ortho-P effluent concentrations of below 0.1 mg/L for over 200 days of operation (Figure 37). From this point, the effluent P concentration gradually increased to reach a maximum of 2.8 mg/L at about 430 days of operation. This was followed by a period of 150 days during which the effluent P concentration decreased to a minimum of 1.2 mg/L. According to other studies using this media, this behaviour was expected (Fonseca, 2018) and the effluent P con-centration was then expected to remain low (< 1 mg/L) for the subsequent months of operation. In this trial, the effluent P concentration was however found to increase rapidly again to reach a maxi-mum of 7.3 mg/L after 720 days of operation, at which point no removal of P was then recorded sug-gesting that the media had reached it capacity. However, the effluent P concentration decreased back down to 3.9 mg/L after another 70 days of operation. In order to better understand the variations in effluent P concentrations observed over time, it was then decided to stop the spiking of P to reduce the influent concentration and evaluate if P removal still occurred. As the influent P concentration was reduced down to an average of 0.8 mg/L, the effluent P concentration slowly decreased down to 0.5

D3.2: Combining constructed wetlands and engineered treatment for surface water protection 32
mg/L at about 900 days of operation confirming that the CW was still removing P but also highlighting that the mechanisms were slow. The influent P concentration was subsequently re-increased to 7.6 mg/L for the remainder of the trial during which the effluent P concentration increased up to a maxi-mum of about 7 mg/L after 1100 days of operation and then decreased down to 3.4 mg/L over the next 100 days, again demonstrating significant variations in performance over time.
Figure 37 Evolution in time of the P concentration and pH in the effluent of the CW.
Overall, the trial demonstrated that the reactive media CW could remove P down to very low levels (<0.1 mg/L) and meet some of the very strict consents to be enforced as part of the WFD for just over 200 days of operation. Such strict consents are in fact rare for small WWTPs, the target for this tech-nology, and aiming for effluent concentrations of below 1-2 mg/L is probably more realistic, which the system achieved for the first year of operation. However, the implementation of reactive media CW would only be sustainable if the system could sustain this level of performance for several years. It is then critical to better understand the causes for the significant variations in effluent P concentrations observed in the subsequent years of operation to possibly improve the design and operation of the system and deliver long term sustainable performance.
4.1.3.3 Effluent P variations diagnostic
From this point onward, the data analysis mainly focuses on the initial 750 days of operation as they encompass the main phases of variations. The pH in the effluent was found to be initially very high with values between 11 and 12 for the first 200 days (Figure 37). It gradually decreased to about 8.7 after 350 days of operation and then remained relatively stable for the rest of the trial with values between 9.3 and 8.2. The increase in the effluent pH can be explained by a partial dissolution of the media mainly composed of calcium oxide (Table 2) which leads to increased concentrations of calcium (Figure 39) and more importantly hydroxide ions in the effluent. Interestingly, the P removal perfor-mance of the media was found to be directly linked to the pH in the effluent (Figure 38). Indeed, the best treatment performance leading to effluent P concentrations between 0.05 and 0.3 mg/L were
0
2
4
6
8
10
12
14
0 200 400 600 800 1000 1200
orth
o-P
[mg
P/L]
and
pH
Time (day)
Effluent pH
Influent P = 7.59 ± 1.75 mgP/L
Influent P = 0.8 ± 0.45
mgP/L Influent P = 7.61 ± 1.59 mgP/L
Feed pump failure

D3.2: Combining constructed wetlands and engineered treatment for surface water protection 33
observed for pHs between 12 and 9.8, respectively. As the pH reached lower values (8.2-9.8), the ef-fluent P concentrations significantly increased and were a lot more variable. To illustrate, for a pH value of 8.5 observed at different points in time, effluent P concentrations of 2.1, 4.7 and 6.3 mg/L were measured. These results demonstrate that the variations in pH had a key role in the variations in P removal observed but also were not the only factor.
Figure 38 Impact of pH on the effluent P concentration.
The variations observed suggest a change in behaviour in the media bed and can potentially be ex-plained by changes in the removal mechanism. Previous studies of the steel slag as a reactive media have suggested that a range of P removal mechanisms, including precipitation with the calcium dis-solved in the water and adsorption on the media itself, can occur (Barca et al., 2012). As mentioned above, the comparison of the calcium concentrations in the influent and effluent of the CW demon-strates an initial net release of calcium from the media into the effluent (Figure 39) which, combined with the high pH, will lead to rapid precipitation of the phosphate and most likely carbonates present in the water with the calcium to form calcium phosphate and calcium carbonate as well as some pre-cipitation/adsorption on the surface of the media itself. The net release of calcium was found to de-crease over the first 150 days of operation (Figure 39) suggesting that as the precipitates formed, they coated the surface of the media and less compounds were leached out from the media into the water also explaining the general decrease in pH over time. Interestingly, between 150 and about 350 days of operation, a net removal of calcium was observed. This suggests that although there was less and less calcium released from the media into the water, the conditions were still adequate for the precip-itation mechanism to occur then using the calcium initially present in the feed water (average 61 mg/L, Table 7). This is also supported by the net removal of magnesium observed over the initial 350 days of operation, again suggesting that magnesium was used as part of the precipitation mechanism (Figure 39). Passed 350 days of operation, a net release of calcium was observed but also the pH stabilised to lower values and P removal decreased, all suggesting that the conditions, with in particular the pH, were not suitable anymore for the rapid precipitation mechanism and the system essentially relied on adsorption for P to be removed.
0
1
2
3
4
5
6
7
8
6 7 8 9 10 11 12 13 14
Phos
phor
us [m
g /L
]
pH

D3.2: Combining constructed wetlands and engineered treatment for surface water protection 34
Figure 39 Calcium and magnesium ions release in the effluent of the constructed wetland for the initial 750
days of operation.
The results described above demonstrate a change in P removal mechanisms over time which would need to be controlled to ensure the effluent quality wanted is met but it should also be noted that the variations in treatment performance can also be attributed to seasonal changes. Indeed, the increases and decreases observed for the effluent P concentration were found to be directly linked to the seasonal increase and decrease in temperature (Figure 40). This further highlights the complexity of the system and the need to better understand the mechanism occurring inside the CW bed in order to achieve steady and sustainable operation of the system.
Figure 40 Evolution of the effluent P concentration and air temperature over time for the initial 700 days of
operation.
-30000
-20000
-10000
0
10000
20000
30000
40000
0 100 200 300 400 500 600 700 800Conc
entr
atio
n [µ
g/L]
Time [d]
Ca MgIon release = effluent - influent
0
5
10
15
20
25
30
35
40
0
1
2
3
4
5
6
7
8
0 100 200 300 400 500 600 700 800
Tem
pera
ture
(ᵒC)
Phos
phor
us [m
g /L
]
Time [d]
Effluent P Temperature (air)

D3.2: Combining constructed wetlands and engineered treatment for surface water protection 35
4.1.3.4 Metals
As reported above, the steel slag media used in the CW is mainly composed of calcium oxide but it also contains other compounds (Table 2) such as iron and aluminium as well as vanadium, a chemical toxic (possibly carcinogenic) in most its forms. It was therefore important to verify if, as observed for cal-cium, other compounds were leached out of the media during trial, which could affect the quality of the treated effluent. Similarly to what was observed for calcium and hydroxide ions (pH), vanadium was found to be initially released at concentrations of up to 734 µg/L which then gradually decreased to about 80 µg/L after 300 days of operation and then remained stable with values mostly between 50 and 90 µg/L (Figure 41). Although vanadium is not currently regulated for effluent discharges as it is usually not present in typical wastewater, it is anticipated that the values measured during the start-up phase are too high and would cause a risk. It should first be noted that the CW tested here only treated a very small fraction of the overall flow at the Packington WWTP and after consultation with the Environment Agency, it was agreed that the dilution obtained by mixing the wetland effluent with the flow of the main treatment plant, the residual levels were extremely low and would not cause an environmental or a health risk. However, if considering a full-scale application, more work is needed to better understand how to control this release mechanism which will, as stated above, also be bene-ficial to control the P removal mechanism.
Figure 41 Vanadium release from the steel slag media over time for the initial 750 days of operation.
As part of the monitoring of the system, a range of other metals (i.e. Fe, Al, Si, Ti, Cr, Ni, Cu, Zn, Se, Ag, Cd, Pd, Hg, Mn) were also measured. Although most were in relatively low concentrations in the influent (all < 10 µg/L except iron ~ 30-40 µg/L) and were not affected by the CW, it is interesting to note that some of them such as Fe, Ni and Zn were actually removed in the CW (Figure 42). To illus-trate, on average Fe, Ni and Zn were removed at rates of 61%, 17% and 32%, respectively. These results highlight a potential added value of the system for the removal of some metals.
0
100
200
300
400
500
600
700
800
0 100 200 300 400 500 600 700 800
Vana
dium
conc
entr
atio
n [u
g/L]
Time [d]

D3.2: Combining constructed wetlands and engineered treatment for surface water protection 36
Figure 42 Removal of Nickel, Zinc and Iron in the CW over time for the initial 750 days of operation.
4.1.3.5 Bulk organics and suspended solids
The focus of this trial was very much on using the CW for the removal of P on small sites but the results obtained also demonstrated that the system removes some of the organics (Figure 43) and suspended solids (Figure 44), as typically expected by a CW system. As highlighted before, because of the very low BOD in the influent of the CW we can assume that most of the readily biodegradable organics have been removed in the main WWTP so the additional COD removal observed here is most likely due to removal of particulate organics rather than through biological process. This is supported by the re-moval of solids also monitored. It is particularly interesting to observe a removal of solids, because as explained above the process will form precipitate which could ultimately be washed out in the effluent then impact the effluent quality for both P and suspended solids. The results obtained here then clearly demonstrate that all precipitates formed are captured in the bed.
-40
-20
0
20
40
60
80
100
0 100 200 300 400 500 600 700 800
Rem
oval
[%]
Time [d]
Ni Zn Fe

D3.2: Combining constructed wetlands and engineered treatment for surface water protection 37
Figure 43 Evolution of the COD concentrations in the influent and effluent of the CW over time for the initial
750 days of operation.
Figure 44 Evolution of the suspended solids concentrations in the influent and effluent of the CW over time
for the initial 750 days of operation.
0
5
10
15
20
25
30
0 100 200 300 400 500 600 700 800
COD
[mg/
L]
Time [d]
Influent Effluent
0
2
4
6
8
10
12
14
16
18
20
0 100 200 300 400 500 600 700 800
Susp
ende
d so
lids [
mg/
L]
Time [d]
Influent Effluent

D3.2: Combining constructed wetlands and engineered treatment for surface water protection 38
4.1.3.6 CW bed and media analysis
The formation and accumulation of precipitates in the bed of the constructed wetland could have an impact on flow distribution in the bed and potentially explain some of the variations in performance. However, the tracer tests carried out annually in the constructed wetland (with rhodamine as the tracer) demonstrated that although the true hydraulic retention time in the system is shorter than the calculated one (18 h against 24 h), no significant change was observed over the first two years of oper-ation confirming that the changes in performance observed were not due to possible clogging of the bed and short-cutting of the water flow (Figure 45).
Figure 45 Tracer tests in the reactive media CW.
In order to further evaluate potential clogging of the bed and/or cementing of the media in the bed over time, hydraulic conductivity tests were carried out four times over the first 2 years of operation. For this test, holes were dug in 12 locations across the bed surface (Figure 46) to insert a perforated stainless steel tube in which water is poured and the time it takes for the water to diffuse from the tube into the bed is measured. As a bed becomes blocked in time, the water would flow more slowly and consequently the hydraulic conductivity reduces. The results obtained does not show any specific trends of change in hydraulic conductivity based on the location in the bed (Figure 47). However, the hydraulic conductivity was generally found to first increase between 100 and 300 days of operation, which can’t be explained so far and then to decrease after about 500 and 700 days of operation, sug-gesting that the bed is becoming clogged. These results are in contradiction with the tracer tests results presented above but it should be noted that while digging the top 10 cm of media for these tests at later stages of the trial we could clearly observe aggregation of the media grains in places. This demonstrates that through precipitation and adsorption on their surfaces, some of the media grains become attached to each other and may have a more significant impact at longer term.

D3.2: Combining constructed wetlands and engineered treatment for surface water protection 39
Figure 46 Locations of each of the hydraulic conductivity tests across the surface of the CW.

D3.2: Combining constructed wetlands and engineered treatment for surface water protection 40
(a)
(b)
(c)
Figure 47 Hydraulic conductivity tests results for the points located in the direction of the flow on the (a) left, (b) middle and (c) right of the bed.

D3.2: Combining constructed wetlands and engineered treatment for surface water protection 41
Used media from the bed was collected several times throughout the trial to be analysed and compared to fresh media in order to assess any chances over time. The imaging and surface analysis (SEM-EDX) provided limited insight in the changes occurring on the media during the trial (data not presented here). It was then decided to carry out a P sequential extraction by exposing media grains to a series of solutions (protocol adapted from Kokursuz et al., 2007 and Drizo et al., 2008) which determines the fractions to which the P is attached in the media (i.e. loosely bound, Al bound, Fe bound, Ca bound and Ca bound stable residual pool). The results show that the P already present on the fresh media (washed and unwashed) is mainly Ca bound (Figure 48). For all used media samples, the biggest frac-tion of P remains Ca bound (except for E2) but more significant proportions of P were then Fe bound and in the Ca bound stable pool. These results then suggest that the phosphate attached to the media surface and pores reacts preferentially with the iron from the media to form iron phosphate which is known to be very insoluble at pH above 8, as observed in this study, or with calcium to make more stable forms of calcium phosphate. It should be noted that this experiment only evaluates the P frac-tions present on the media itself, and the loading of P onto the media was calculated to range between 8 and 10 mg of P/g of media for the samples of used media. However, the total mass of P removed at the point of sampling normalised to the total mass of media in the bed provided a loading of just under 73 mg of P/ g of media suggesting most of the P removed is in fact not on the media itself but elsewhere in the bed. This confirms the assumption that most of the P removed in the system is likely to be pre-cipitates that are filtered out of the water by the media and settled into the bed.
Figure 48 P sequential extraction from fresh media unwashed (FU) and washed (FW – rinsed with clean water
to remove any loose deposits), and used media from four locations in the direction of the flow in the middle of the bed, with E1 closer to the inlet and E4 closer to the outlet.
Throughout the project, the constructed wetland was regularly visually inspected and it quickly emerged that growth of the reeds initially planted, Phragmites Australis, was limited and that a weed, identified to be Epilobium hirsutum and known to grow in high pH conditions, took over the front of the bed (Figure 49). The limited growth of either reeds or weeds at the back of the bed is likely to be due to the higher pH expected near the outlet. Over time, as pH decreased in the bed, less weeds grew and more reeds started growing, especially at the back of the bed. As the weeds initially out-grew the reeds at the front, it is likely that the reeds planted in that area died. However, the reeds planted at the

D3.2: Combining constructed wetlands and engineered treatment for surface water protection 42
back of the bed did not grow initially because of the pH and were essentially dormant, but as conditions became more favourable they started growing and were very green and healthy in the later years of the trial.
Inlet Middle Outlet
Figure 49 Pictures of the plants at the inlet, middle and outlet of the CW in June 2016.
4.1.3.7 pH control
The increased pH observed during this trial was shown to be a key parameter to help with the removal of P (Figure 38); however, WWTP effluents to be discharged in the environment typically have to com-ply with a pH between 6 and 9. The highest pH values monitored with the reactive media CW of 11-12 would consequently breach consent for discharge. It then becomes critical to be able to control the pH in the effluent before discharge. Tests were then carried out at lab scale to evaluate the potential of two methods for pH control. As the aim of implementing a reactive media CW is to use a simple and sus-tainable technology for P removal, pH control through chemical dosing is consequently not considered here. A simple and/or natural method should then be considered. Two sets of experiments were con-ducted to evaluate the potential of blending and natural humic acids for pH control. At full-scale, blending would be implemented by by-passing part of the influent directly into the effluent, while the use of humic acids simulate a bark filter through which humic substances are released into the water. The results from the trials with humic acids (data not shown) showed that only limited impact was obtained in terms of pH decreased and this was associated with a significant increase in the organic matter content of the water as more humic substances were added to the effluent. More interestingly, the blending experiments did show, after an initial rise of the pH in the water in contact with the media for the initial 72 hours, a significant decrease in pH (Figure 50) as the dilution factor was increased. However, it should be noted that high dilution factors would be needed to bring a water at pH 11-12 down to below 9 and consequently a significant fraction of untreated effluent would have to be mixed with the effluent from the CW, defeating the purpose of the scheme. Overall, these experiments high-light the need to find a simple and reliable way to control pH for the reactive media CW to be imple-mented at full-scale.

D3.2: Combining constructed wetlands and engineered treatment for surface water protection 43
Figure 50 Impact of dilution factor for pH control by blending.
7.0
7.5
8.0
8.5
9.0
0 10 20 30 40 50 60 70 80 90
pH
Time [hours]
Blank 1.25 1.5 1.75 2 2.5Dilution factor

D3.2: Combining constructed wetlands and engineered treatment for surface water protection 44
4.2 Comparative analysis
The aim of this section is to provide, through the comparison of the different systems on all three demonstration sites, an overview of the performance to be expected from these systems with a partic-ular focus on the application of natural systems, constructed wetlands, as a polishing step after engi-neered wastewater treatment plants.
In this section, all data is presented in box-whisker plots where the lower and upper limit of the box represent the first and third quartile of the data sets, the line in the box represents the median and the bottom and top whisker represent the minimum and maximum values respectively. The black circle represents the mean.
4.2.1 Organics
4.2.1.1 Bulk concentrations
All CWs used as a final treatment step after conventional WWTP provided some additional organics removal with average values (as COD) between 6 and 43% across all three sites and allowed to deliver a cleaner effluent before discharge (Figure 51). CWs are not only able to remove the particulate fraction of organics through filtration in the media bed, similarly to the deep-bed filters, but also through bio-logical degradation of the organics with the microbial communities developed within the bed. The ad-dition of adsorptive media such GAC provide additional removal capacity as demonstrated by the RSF system studied on the Rheinbach site (and the stand alone GAC filter studied on the Schönerlinde site).
Figure 51 COD concentrations in the influent and effluent from all systems trialled on the 3 demonstration
sites.
0
5
10
15
20
25
30
35
40
45
WWTPeffluent(n=14)
RSF withGAC
effluent(n=5)
RSFwithout
GACeffluent(n=14)
WWTPeffluent(n=24)
Ozonationeffluent(n=24)
CW1effluent(n=23)
CW2effluent(n=22)
BACeffluent(n=23)
S/BACeffluent(n=24)
S/Aeffluent(n=22)
Post_GACeffluent(n=11)
WWTPeffluent(n=79)
RMCWeffluent(n=72)
Site 11: Rheinbach Site 12: Schönerlinde Site 13: Packington
COD
(mg/
L)
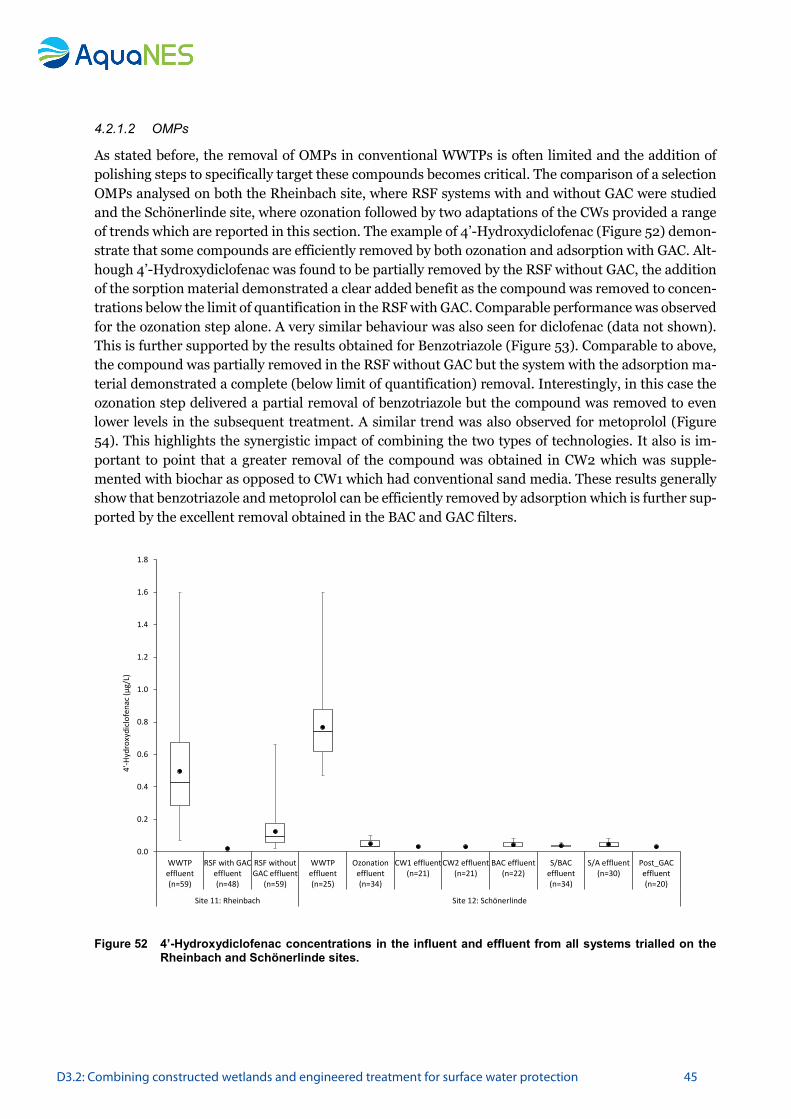
D3.2: Combining constructed wetlands and engineered treatment for surface water protection 45
4.2.1.2 OMPs
As stated before, the removal of OMPs in conventional WWTPs is often limited and the addition of polishing steps to specifically target these compounds becomes critical. The comparison of a selection OMPs analysed on both the Rheinbach site, where RSF systems with and without GAC were studied and the Schönerlinde site, where ozonation followed by two adaptations of the CWs provided a range of trends which are reported in this section. The example of 4’-Hydroxydiclofenac (Figure 52) demon-strate that some compounds are efficiently removed by both ozonation and adsorption with GAC. Alt-hough 4’-Hydroxydiclofenac was found to be partially removed by the RSF without GAC, the addition of the sorption material demonstrated a clear added benefit as the compound was removed to concen-trations below the limit of quantification in the RSF with GAC. Comparable performance was observed for the ozonation step alone. A very similar behaviour was also seen for diclofenac (data not shown). This is further supported by the results obtained for Benzotriazole (Figure 53). Comparable to above, the compound was partially removed in the RSF without GAC but the system with the adsorption ma-terial demonstrated a complete (below limit of quantification) removal. Interestingly, in this case the ozonation step delivered a partial removal of benzotriazole but the compound was removed to even lower levels in the subsequent treatment. A similar trend was also observed for metoprolol (Figure 54). This highlights the synergistic impact of combining the two types of technologies. It also is im-portant to point that a greater removal of the compound was obtained in CW2 which was supple-mented with biochar as opposed to CW1 which had conventional sand media. These results generally show that benzotriazole and metoprolol can be efficiently removed by adsorption which is further sup-ported by the excellent removal obtained in the BAC and GAC filters.
Figure 52 4’-Hydroxydiclofenac concentrations in the influent and effluent from all systems trialled on the
Rheinbach and Schönerlinde sites.
0.0
0.2
0.4
0.6
0.8
1.0
1.2
1.4
1.6
1.8
WWTPeffluent(n=59)
RSF with GACeffluent(n=48)
RSF withoutGAC effluent
(n=59)
WWTPeffluent(n=25)
Ozonationeffluent(n=34)
CW1 effluent(n=21)
CW2 effluent(n=21)
BAC effluent(n=22)
S/BACeffluent(n=34)
S/A effluent(n=30)
Post_GACeffluent(n=20)
Site 11: Rheinbach Site 12: Schönerlinde
4'-H
ydro
xydi
clof
enac
(µg/
L)

D3.2: Combining constructed wetlands and engineered treatment for surface water protection 46
Figure 53 Benzotriazole concentrations in the influent and effluent from all systems trialled on the Rheinbach
and Schönerlinde sites.
Figure 54 Metoprolol concentrations in the influent and effluent from all systems trialled on the Rheinbach
and Schönerlinde sites.
0
2
4
6
8
10
12
14
WWTPeffluent (n=73)
RSF with GACeffluent (n=55)
RSF withoutGAC effluent
(n=75)
WWTPeffluent (n=25)
Ozonationeffluent(n=34)
CW1 effluent(n=21)
CW2 effluent(n=21)
BAC effluent(n=22)
S/BAC effluent(n=34)
S/A effluent(n=30)
Post_GACeffluent(n=20)
Site 11: Rheinbach Site 12: Schönerlinde
Benz
otria
zole
(µg/
L)
0.0
0.5
1.0
1.5
2.0
2.5
3.0
3.5
WWTPeffluent (n=73)
RSF with GACeffluent (n=55)
RSF withoutGAC effluent
(n=75)
WWTPeffluent (n=25)
Ozonationeffluent(n=33)
CW1 effluent(n=21)
CW2 effluent(n=21)
BAC effluent(n=21)
S/BAC effluent(n=34)
S/A effluent(n=30)
Post_GACeffluent(n=20)
Site 11: Rheinbach Site 12: Schönerlinde
Met
opro
lol (
µg/L
)

D3.2: Combining constructed wetlands and engineered treatment for surface water protection 47
Importantly, some compounds such as TCPP (Figure 55) were found not to be removed by ozonation but were efficiently removed by all constructed wetland technologies. This shows that this type of com-pounds is most probably more easily removed by a combination of adsorption and biodegradation in the wetland systems.
It should also be noted that it was not always possible to confirm specific trends for individual com-pounds by comparing the different systems. For example for amidotrizoate (Figure 56), as part of the trials at the Rheinbach site, it was not removed in the RSF wihtout GAC but was removed efficiently in the RSF supplemented with GAC suggesting again an affinity of the compound for adsorption. How-ever, amidotrizoate was not removed by any of the technologies tested on the Schönerlinde site. An-other example is candesartan (Figure 57) as it was not removed by the RSF without GAC but was re-moved to below limit of quantification for the system with GAC, again suggesting efficient removal by adsorption processes, which was in fact confirmed by the results from the GAC filter. However, the constructed wetland supplemented with biochar (CW2) and even the BAC filter did not provide addi-tional treatment of the compound following ozonation. This emphasizes the varied nature of the or-ganic compounds present in wastewaters and show that one treatment solution will not fit all needs, which ultimately demonstrates the benefit of combining systems for more efficient and sustainable treatment.
Figure 55 TCPP concentrations in the influent and effluent from all systems trialled on the Rheinbach and
Schönerlinde sites.
0.0
0.5
1.0
1.5
2.0
2.5
3.0
WWTPeffluent (n=73)
RSF with GACeffluent (n=55)
RSF withoutGAC effluent
(n=75)
WWTPeffluent (n=13)
Ozonationeffluent(n=18)
CW1 effluent(n=10)
CW2 effluent(n=11)
BAC effluent(n=11)
S/BAC effluent(n=18)
S/A effluent(n=15)
Post_GACeffluent(n=10)
Site 11: Rheinbach Site 12: Schönerlinde
TCPP
(µg/
L)

D3.2: Combining constructed wetlands and engineered treatment for surface water protection 48
Figure 56 Amidotrizoate concentrations in the influent and effluent from all systems trialled on the Rheinbach
and Schönerlinde sites.
Figure 57 Candesartan concentrations in the influent and effluent from all systems trialled on the Rheinbach
and Schönerlinde sites.
0.0
1.0
2.0
3.0
4.0
5.0
6.0
7.0
8.0
WWTPeffluent(n=72)
RSF with GACeffluent(n=54)
RSF withoutGAC effluent
(n=74)
WWTPeffluent (n=9)
Ozonationeffluent (n=9)
CW1 effluent(n=6)
CW2 effluent(n=7)
BAC effluent(n=8)
S/BAC effluent(n=9)
S/A effluent(n=5)
Site 11: Rheinbach Site 12: Schönerlinde
Amid
otriz
oate
(µg/
L)
0.0
0.5
1.0
1.5
2.0
2.5
3.0
3.5
4.0
WWTPeffluent (n=19)
RSF with GACeffluent (n=11)
RSF withoutGAC effluent
(n=19)
WWTPeffluent (n=25)
Ozonationeffluent(n=34)
CW1 effluent(n=19)
CW2 effluent(n=19)
BAC effluent(n=21)
S/BAC effluent(n=34)
S/A effluent(n=29)
Post_GACeffluent(n=19)
Site 11: Rheinbach Site 12: Schönerlinde
Cand
esar
tan
(µg/
L)

D3.2: Combining constructed wetlands and engineered treatment for surface water protection 49
4.2.2 Solids
Due to the presence of the granular media in the CW technology, it is generally expected to act as a filter and removal particulate matter from wastewater. Comparison of the suspended solids results showed that the CWs at both Schönerlinde and Packington achieved average TSS removals of 95 % and 63 %, respectively (Figure 58). It is interesting to note that the performance of both wetlands at Schönerlinde, including CW2 with a coarser media, delivered comparable performance to the deep-bed filters. Overall, this demonstrates again the potential of CWs as polishing steps.
Figure 58 Solids concentrations in the influent and effluent from all systems trialled on all 3 sites.
4.2.3 Nutrients
As introduced before, the removal of nutrients from wastewater is critical to avoid eutrophication in the receiving waters. It should be noted that ammonia was removed to very low levels (< 0.2 mg/L) by all conventional WWTP, highlighting good nitrification on all sites. It was consequently not possible to evaluate any additional removal by the different CWs. For P, all three WWTPs are fitted with bio-logical and chemical processes to specifically target P, which translated to low average P concentra-tions of 0.25 mg/L and 0.77 mg/L in the effluent of the Rheinbach and Schönerlinde WWTPs, respec-tively (Figure 59). As a reminder, although the main WWTP at Packington achieves effective P removal to below 1 mg/L, the effluent was spiked to a typical raw wastewater concentration for the purpose of the trial. Although P concentrations were low in the WWTP effluent from Rheinbach and Schönerlinde, subsequent treatment through the CWs provided additional removal with removals of 40-50% for the RSF systems and 20-30% for the CWs following the ozonation. As conventional CWs
0
5
10
15
20
25
30
WWTP effluent(n=20)
Ozonationeffluent(n=20)
CW1 effluent(n=19)
CW2 effluent(n=19)
BAC effluent(n=20)
S/BAC effluent(n=20)
S/A effluent(n=18)
Post_GACeffluent (n=8)
WWTP effluent(n=77)
RMCW effluent(n=68)
Site 12: Schönerlinde Site 13: Packington
TSS
(mg/
L)

D3.2: Combining constructed wetlands and engineered treatment for surface water protection 50
are known to be limited at reactive P removal, these results suggest that the current systems mostly removed P in particulate form. This is supported by the similar results obtained by the BAC and GAC filters. As the influents from the Sand/BAC and Sand/Anthracite deep-bed filters were dosed with coagulant, they achieved even better P removal with effluent concentrations consistently below 0.2 mg/L. Nonetheless, these results highlight the benefit of CWs to help meeting stricter consents. As reported above, the reactive media CW tested at Packington was specifically implemented to tackle high loads of P and over the trial duration its performance varied from excellent removal with effluent P concentration of <0.1 mg/L to almost no removal in the later stages. The data obtained over the initial two years of operation reported here (Figure 59) does show this variability but also demonstrate the potential of the technology, pending some adaptation, to deliver complete P removal in a single step.
Figure 59 P concentrations in the influent and effluent from all systems trialled on all 3 sites.
4.2.4 Microbial indicators
As presented above, the removal of microbial indicators is essential to meet the standards for bathing water quality. The trials at Schönerlinde confirm the disinfection effect of ozonation as shown here with a reduction by more than 2 log-units of E. Coli (Figure 60). More interestingly, all CWs tested on both sites delivered an E. Coli reduction of 1-2 log-units. This reduction is mainly expected to occur by filtration through the media bed. This outcome is supported by the similar results obtained with the deep-bed filters. Overall, this highlights once more the benefit of using the natural systems as polishing step.
0
2
4
6
8
10
12
14
WWTPeffluent(n=74)
RSF withGAC
effluent(n=54)
RSFwithout
GACeffluent(n=75)
WWTPeffluent
(n=9)
Ozonationeffluent(n=24)
CW1effluent(n=23)
CW2effluent(n=22)
BACeffluent
(n=9)
S/BACeffluent(n=24)
S/Aeffluent(n=22)
Post_GACeffluent(n=11)
RMCWinfluent(n=80)
RMCWeffluent(n=77)
Site 11: Rheinbach Site 12: Schönerlinde Site 13: Packington
TP (m
g/L)
0.0
0.2
0.4
0.6
0.8
1.0
1.2
1.4
WWTPeffluent(n=74)
RSF with GACeffluent(n=54)
RSF withoutGAC effluent
(n=75)
WWTPeffluent
(n=9)
Ozonationeffluent(n=24)
CW1 effluent(n=23)
CW2 effluent(n=22)
BAC effluent(n=9)
S/BACeffluent(n=24)
S/A effluent(n=22)
Post_GACeffluent(n=11)
Site 11: Rheinbach Site 12: Schönerlinde
TP (m
g/L)
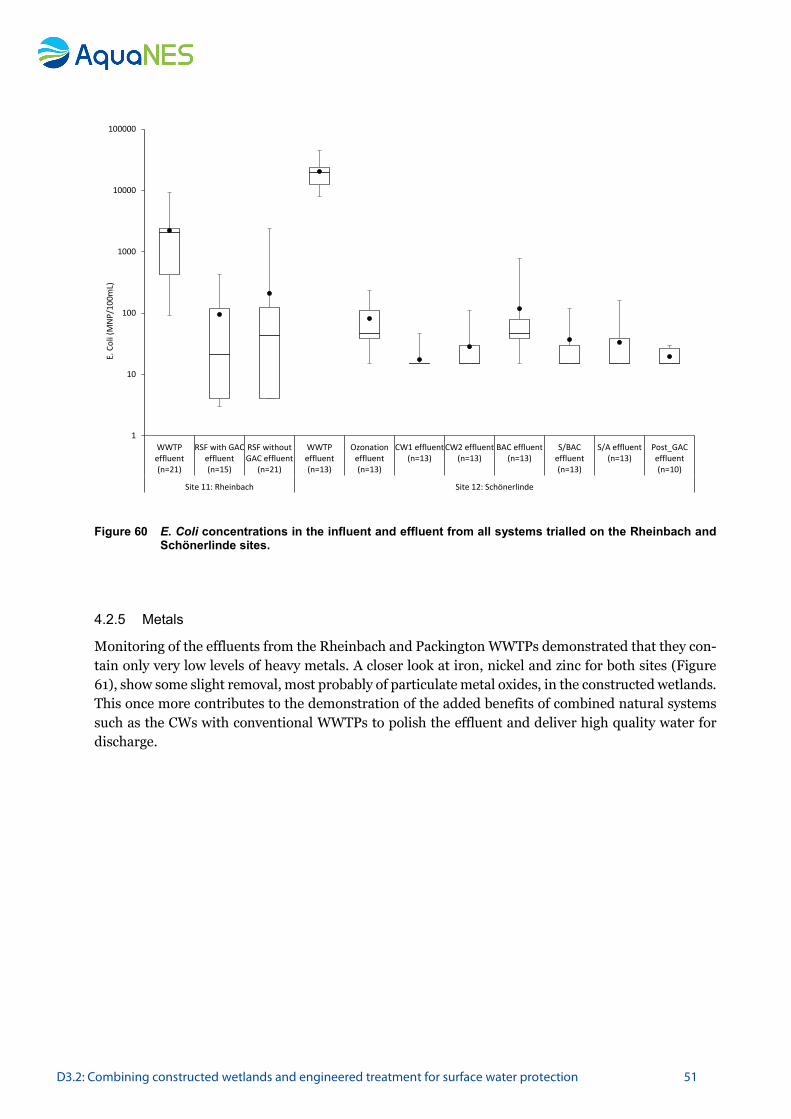
D3.2: Combining constructed wetlands and engineered treatment for surface water protection 51
Figure 60 E. Coli concentrations in the influent and effluent from all systems trialled on the Rheinbach and
Schönerlinde sites.
4.2.5 Metals
Monitoring of the effluents from the Rheinbach and Packington WWTPs demonstrated that they con-tain only very low levels of heavy metals. A closer look at iron, nickel and zinc for both sites (Figure 61), show some slight removal, most probably of particulate metal oxides, in the constructed wetlands. This once more contributes to the demonstration of the added benefits of combined natural systems such as the CWs with conventional WWTPs to polish the effluent and deliver high quality water for discharge.
1
10
100
1000
10000
100000
WWTPeffluent(n=21)
RSF with GACeffluent(n=15)
RSF withoutGAC effluent
(n=21)
WWTPeffluent(n=13)
Ozonationeffluent(n=13)
CW1 effluent(n=13)
CW2 effluent(n=13)
BAC effluent(n=13)
S/BACeffluent(n=13)
S/A effluent(n=13)
Post_GACeffluent(n=10)
Site 11: Rheinbach Site 12: Schönerlinde
E. C
oli (
MN
P/10
0mL)
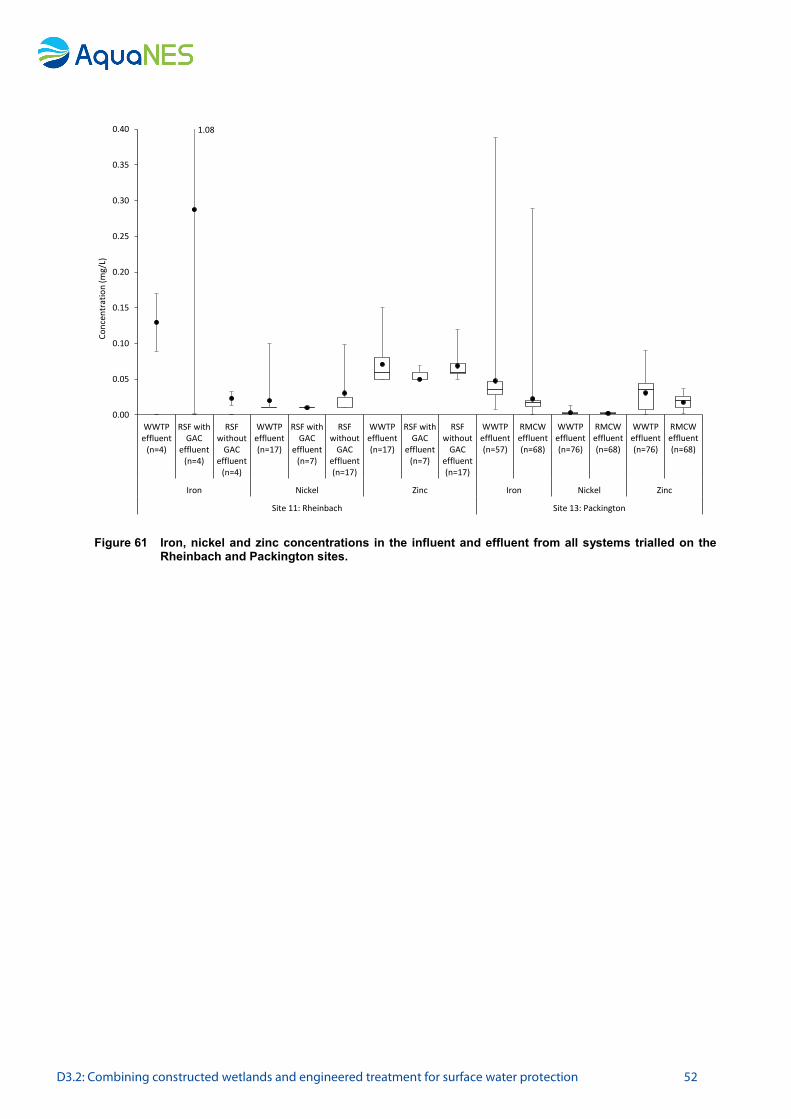
D3.2: Combining constructed wetlands and engineered treatment for surface water protection 52
Figure 61 Iron, nickel and zinc concentrations in the influent and effluent from all systems trialled on the
Rheinbach and Packington sites.
0.00
0.05
0.10
0.15
0.20
0.25
0.30
0.35
0.40
WWTPeffluent
(n=4)
RSF withGAC
effluent(n=4)
RSFwithout
GACeffluent
(n=4)
WWTPeffluent(n=17)
RSF withGAC
effluent(n=7)
RSFwithout
GACeffluent(n=17)
WWTPeffluent(n=17)
RSF withGAC
effluent(n=7)
RSFwithout
GACeffluent(n=17)
WWTPeffluent(n=57)
RMCWeffluent(n=68)
WWTPeffluent(n=76)
RMCWeffluent(n=68)
WWTPeffluent(n=76)
RMCWeffluent(n=68)
Iron Nickel Zinc Iron Nickel Zinc
Site 11: Rheinbach Site 13: Packington
Conc
entr
atio
n (m
g/L)
1.08
D3.2: Combining constructed wetlands and engineered treatment for surface water protection 53
5 Concluding remarks The trials at the Rheinbach WWTP delivered long term (> 3.5 years) study of RSF systems for the treatment of CSOs and WWTP effluent with exhaustive study specifically on the removal of OMPs by the natural systems. The results demonstrated the variability in removal depending on the nature of the OMPs but crucially highlighted the benefit of the addition of an adsorbent, GAC, into the filter material which improved removal for all compounds tested. The work showed that removal not only occurred through adsorption but also through a biological degradation pathway, highlighting the im-portance of the extended retention time in these systems and emphasising the benefit of combining the natural system with the conventional WWTP. The trials with the RSFs also demonstrated their efficiency to remove microbial indicators with 1-2 log-units removal for Coliforms and E. Coli, bringing the effluent concentrations below the limit required for bathing water quality.
Results from the trial at Schönerlinde, show that ozonation and CW treatment is a suitable combina-tion to remove organic and microbial contamination. Synergy of the process combination could be clearly shown for removal of organic matter, comparing ozone and subsequent CW treatment with CW as a stand-alone solution. OMPs were mainly reduced by the ozonation step. However, for selected OMPs with insufficient reaction rates during ozonation, removal could be complemented by CW. Bio-char addition to the substrate was demonstrated to temporarily retain well adsorbing OMPs. Overall adsorption capacity of biochar is limited though and exchange is not possible without a complete re-newal of the filter bed including vegetation. Similarly to the work with the RSF, disinfection was im-proved by CW post-treatment. After ~2 log-units reduction of E. coli and Enterococci during ozonation they further decreased below LOQ in CW treatment. C. perfringens and somatic coliphages were in-sufficiently inactivated by ozone. CW post-treatment effectively retained both organisms and hence, compensated the short-comings the ozone treatment. This highlights that the process combination of ozone and CW works for a wider range of microorganisms and therefore provides higher disinfection safety.
The trials with the reactive media CW at Packington have demonstrated the potential of a simple and sustainable technology to remove P to very low levels in a single step, while maintaining its expected performance for the removal of solids and organics. The long term trials (> 3 years) have highlighted some of the limitations with the current media, steel slag, including high pH levels in the effluent and breakthrough of P in the effluent after 1-2 years (depending on P target) of operation. However, the diagnostic work carried throughout the trial on the system has provided invaluable learning on the process and its mechanisms. Although, this trial has shown that the technology is not yet ready for full-scale application, it has undeniably provided the tools to deliver a much needed technology (through modification of the media or use of alternative media) for small WWTPs.
The comparative analysis of all three demonstration sites has generally highlighted the added value of combining natural systems such as the CWs with conventional WWTPs to deliver high quality water for discharge into the environment with lower effluent concentrations for organics, nutrients, solids, microbial indicators and metals across all sites.
Overall, the work delivered in the AquaNES WP3 and presented here demonstrate that the combina-tion of engineered systems and constructed wetlands provides a sustainable alternative to produce high quality treated effluent for discharge into the environment, meeting key EU regulations such the Water Framework Directive, the Urban Wastewater Directive and the Bathing Water Directive and ultimately protect the quality of receiving waters.

D3.2: Combining constructed wetlands and engineered treatment for surface water protection 54
6 Bibliography Affair, D. f. E. F. and Rural (2012). Waste water treatment in the United Kingdom -2012-
Implementation of the European Union Urban Waste Water Treatment Directive- 91/271/EEC. Tech. rep. DEFRA, p. 49.
Altmann, J., Massa, L., Sperlich, A., Gnirss, R., and Jekel, M. (2016 a). UV254 absorbance as real-time monitoring and control parameter for micropollutant removal in advanced wastewater treatment with powdered activated carbon. Water Research 94: 240-245.
Altmann, J., Rehfeld, D., Träder, K., Sperlich, A., and Jekel, M. (2016 b). Combination of granular activated carbon adsorption and deep-bed filtration as a single advanced wastewater treatment step for organic micropollutant and phosphorus removal. Water Research 92: 131-139.
Andrews, J., Hobson, J., Hunt, D., and Shepherd, D. (2008). Water Framework Directive: Sustainable Treatment Solutions for Achieving Good Ecological Status. Tech. rep. London: UKWIR.
Barca, C., Gerente, C., Meyer, D., Chazarenc, F., and Andres, Y. (2012). Phosphate removal from syn-thetic and real wastewater using steel slags produced in Europe. Water Research, 46(7): 2376–2384.
Brunsch, A. F., ter Laak, T. L., Christoffels, E., Rijnaarts, H. M., and Langenhoff, A. M. (2018). Retention soil filter as post treatment step to remove micropollutants from sewage treatment plant effluent. Science of the Total Environment 637-638: 1098-1107.
Butterworth, E., Richards, A., Jones, M., Dotro, G., and Jefferson, B. (2016). Assessing the potential for tertiary nitrification in sub-surface flow constructed wetlands. Environmental Technology Reviews, 5(1): 68-77.
Carranza Díaz, O. (2015). Behavior of selected organic micropollutants in horizontal subsurface-flow constructed wetlands operating at high organic load. Dissertation, Martin-Luther-University, Halle-Wittenberg.
Christoffels, E., Mertens, F.M., Kistemann, T. and Schreiber, C., 2015, Retention of pharmaceutical residues and microorganisms at the Altendorf retention soil filter. Water Science & Technology 70(9): 1503-9.
Drizo, A., Cummings, J., Weber, D., Twohig, E., Druschel, G. and Bourke, B. (2008). New evidence for rejuvenation of phosphorus retention capacity in EAF steel slag. Environment Science and Technology, 42(16): 6191-6197.
European Commission (EC) (2019). Introduction to the EU Water Framework Directive. http://ec.europa.eu/environment/water/water-framework/info/intro_en.htm. Last accessed in March 2019.
Fonseca, N. (2018). Reactive media for phosphorus removal in wastewater treatment. Ph.D. thesis. Cranfield University.
Jekel, M., Dott, W., Bergmann, A., Dünnbier, U., Gnirß, R. Haist-Guldee, B., Hamscher, G., Letzel, M., Lichah, T., Lykoi, S., Miehe, U., Sacher, F., Scheurer, M., Schmidt, C., Reemtsma, T., and Ruhl, A.S. (2015). Selection of organic process and source indicator substances for the anthropogenically influenced water cycle. Chemosphere 125: 155-167.
Knopp, G., Prasse, C., Ternes, T. A., and Cornel, P. (2016). Elimination of micropollutants and transformation products from a wastewater treatment plant effluent through pilot scale ozonation followed by various activated carbon and biological filters. Water Reserch 100: 580-592.
Korkusuz, E., Beklioğlu, M. and Demirer, G. N. (2007). Use of blast furnace granulated slag as a substrate in vertical flow reed beds: Field application. Bioresource Technology, 98(11): 2089-2101.

D3.2: Combining constructed wetlands and engineered treatment for surface water protection 55
Luo, Y., Guoa, W., Ngo, H. H., Nghiemb, L. D., Hai, F. I., Zhang, J., Liang, S., Wang, X. C. (2014). A review on the occurrence of micropollutants in the aquatic environment and their fate and removal during wastewater treatment. Science of the Total Environment 473-474: 619-641.
Mertens, F.M., Christoffels, E., Schreiber, C., and Kistemann, T. (2012). Retention of Pharmaceuticals and Micro-Organisms-the Example of the Altendorf Retention Soil Filter. Korrespondenz Abwasser,Abfall, 59. Jahrgang, Ausgabe 12/2012: 1137-1143.
Paerl, H. W., Fulton, R. S., Moisander, P. H., and Dyble, J. (2001). Harmful freshwater algal blooms, with an emphasis on cyanobacteria. Scientific World Journal 4(1): 76-113.
Rühmland, S., and Barjenbruch, M. (2013). Disinfection capacity of seven constructed wetlands and ponds. Water Science and Technology 68 (10): 2111–2117.
Stapf, M., Miehe, U., and Jekel, M. (2016). Application of online UV absorption measurements for ozone process control in secondary effluent with variable nitrite concentration. Water Research 104: 111-118.
von Gunten, U. (2003). Ozonation of drinking water: Part I. Oxidation kinetics and product formation. Water Research 37(7): 1443-67.
Water Framework Directive (WFD) (2000) The EU Water Framework Directive - integrated river basin management for Europe, 2000/60/EC.
World Health Organization (2011), Guidelines for Drinking-water Quality, 4th ed. ISBN 978 92 4 154815 1.
Zimmermann, S.G., Wittenwiler M., Hollender, J., Krauss, M., Ort, C., Siegrist, H., and von Gunten, U. (2011). Kinetic assessment and modeling of an ozonation step for full-scale municipal wastewater treatment: Micropollutant oxidation, by-product formation and disinfection. Water Research 45: 605-617.