© Crown copyright Met Office Andrew Colman presentation to EuroBrisa Workshop July 21-23 2009 Met...
38
© Crown copyright Met Office Andrew Colman presentation to EuroBrisa Workshop July 21- 23 2009 statistical and dynamical forecasts for NE Brazil: method, skill and prediction for MAM 2009.
-
date post
22-Dec-2015 -
Category
Documents
-
view
213 -
download
0
Transcript of © Crown copyright Met Office Andrew Colman presentation to EuroBrisa Workshop July 21-23 2009 Met...

© Crown copyright Met Office
Andrew Colman
presentation to EuroBrisa Workshop July 21-23 2009
Met Office combined statistical and dynamical forecasts for NE Brazil:method, skill and prediction for MAM 2009.

© Crown copyright Met Office
CONTENTS
1. Forecast method and Performance (measured using hindcasts)
2. Forecast for 2009
3. Two Issues arising:
1.1 Data uncertainty
1.2 Effect of changes in S Atlantic SST
4. Future Developments

© Crown copyright Met Office
NE Brazil areas
• Forecasts for all regions are produced using statistical methods and GloSea model output
• Region 8 is our Standard NE Brazil Region (SNEBR)
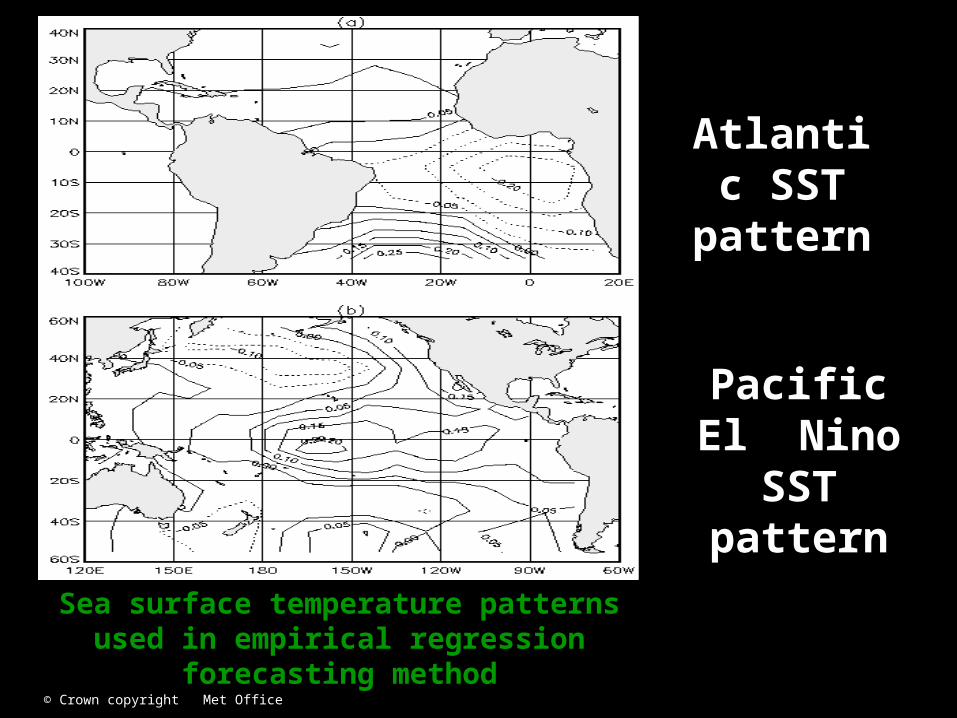
• Statistical forecasts use indices of 2 SST patterns as predictors
© Crown copyright Met Office
Sea surface temperature patterns used in empirical regression forecasting method
Atlantic SST
pattern
Pacific El Nino SST pattern

© Crown copyright Met Office
Global Seasonal Forecast (GloSea) model
• Enhanced version of the Hadley Centre climate model (HadCM3)
• 2.5° x 3.75° x 19Level AGCM
• (1.25° to 0.3°) x 1.25° x 40Level OGCM
• Six month real-time 41-member ocean atmosphere global forecast ensemble
• 5 ocean analyses from perturbed wind stresses
• Ocean analyses further perturbed with instantaneous SST perturbations
• Forecasts of temperatures and rainfall produced monthly and published on our website (www.metoffice.gov.uk)

© Crown copyright Met Office
Prob(abv) 1/d
Prob(avg) 1/d
Prob(blw) 1/d
Principles of linear discriminant calibration (a skillful system example)
Historical predictions
eg rainfall at nearest grid-point to predicted location
mean
mean
mean
d
d
d
real-time prediction (e.g. single ensemble member)
Predicted values when above-normal category observed
Predicted values when near-normal category observed
Predicted values when below-normal category observed
Corresponding observations

© Crown copyright Met Office
Linear discriminant combination/calibration:
2
2
1,3
exp[ 0.5 ( )]( )
exp[ 0.5 ( )]t
tu
u
D xP x
D x
( )tP x
2 ( )tD x
- probability of category ‘t’
- generalised squared ‘distance’ from hindcast predictor values when ‘t’ is observed (takes account of skill)
x -vector of predictor values
-Eg Nino 3.4 SST index
-Dynamical model gridpoint forecast
2 1( ) ( ) ( )t ttD x x m S x m mt -predictor mean prior to each category t
S-1 –Covariance matrix of predictor variables

© Crown copyright Met Office
2 Variable Discriminant analysis
Variable 1
Variable 2
© Crown copyright Met Office
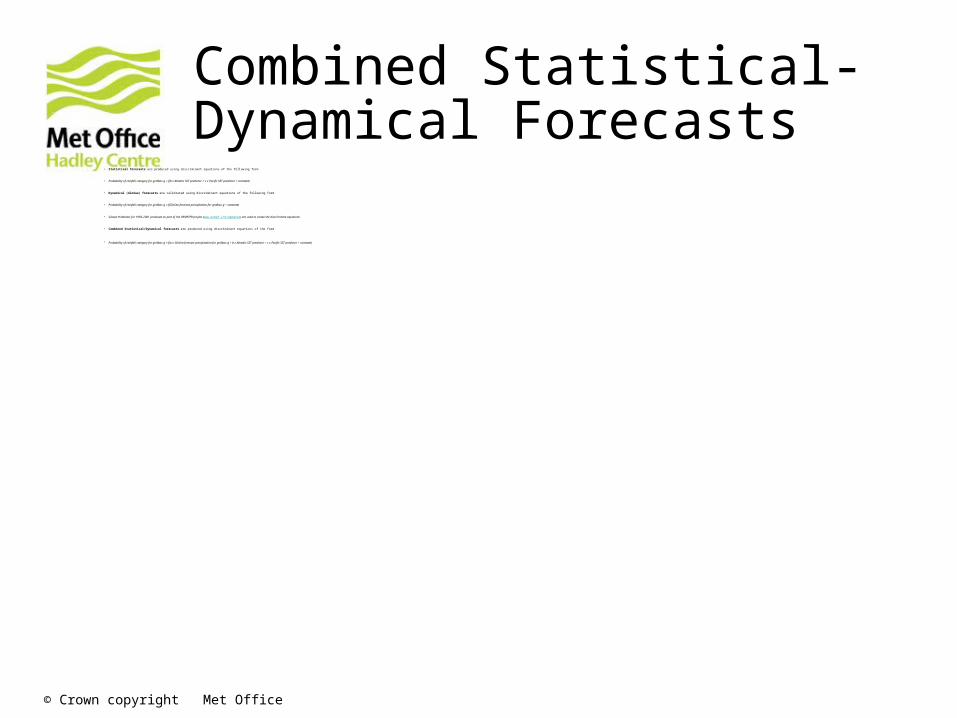
Combined Statistical-Dynamical Forecasts
• Statistical forecasts are produced using discriminant equations of the following form
• Probability of rainfall category for gridbox g = f(b x Atlantic SST predictor + c x Pacific SST predictor + constant)
• Dynamical (GloSea) forecasts are calibrated using discriminant equations of the following form
• Probability of rainfall category for gridbox g = f(GloSea forecast precipitation for gridbox g + constant)
• Glosea Hindcasts for 1959-2001 produced as part of the DEMETER project ( www.ecmwf.int/demeter) are used to create the discriminant equations.
• Combined Statistical/Dynamical forecasts are produced using discriminant equations of the form
• Probability of rainfall category for gridbox g = f(a x GloSea forecast precipitation for gridbox g + b x Atlantic SST predictor + c x Pacific SST predictor + constant)

© Crown copyright Met Office
GloSea model skill maps verified against GPCP

© Crown copyright Met Office
GloSea + statistical model skill maps 1959-2001

© Crown copyright Met Office
GloSea+statistical model ROC skill maps 1959-2001

© Crown copyright Met Office
Plots of forecast v Observed series for SNEBR
© Crown copyright Met Office
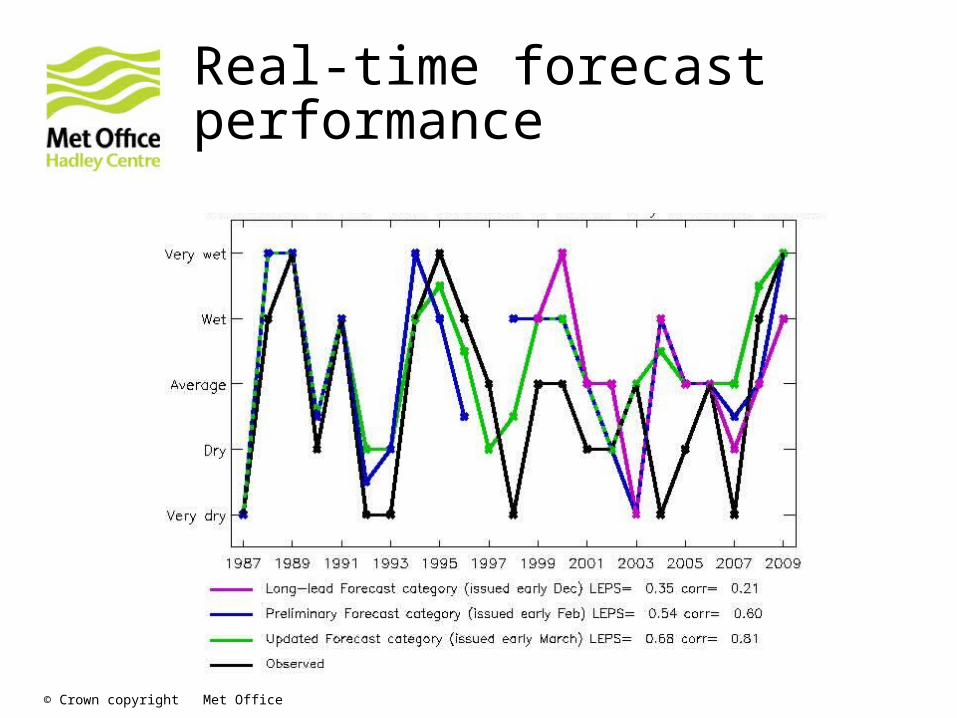
Real-time forecast performance

© Crown copyright Met Office
2009 Forecast
1. Recent SST patterns
2. EuroSip model output
3. Statistical Forecast for Terciles
4. Combined Stats/Dynamical Forecast for terciles
5. Verification

© Crown copyright Met Office
SST anomalies for Nov, Dec 08 and Jan 09

© Crown copyright Met Office
Global SST anomaly forecast from GloSea
© Crown copyright Met Office
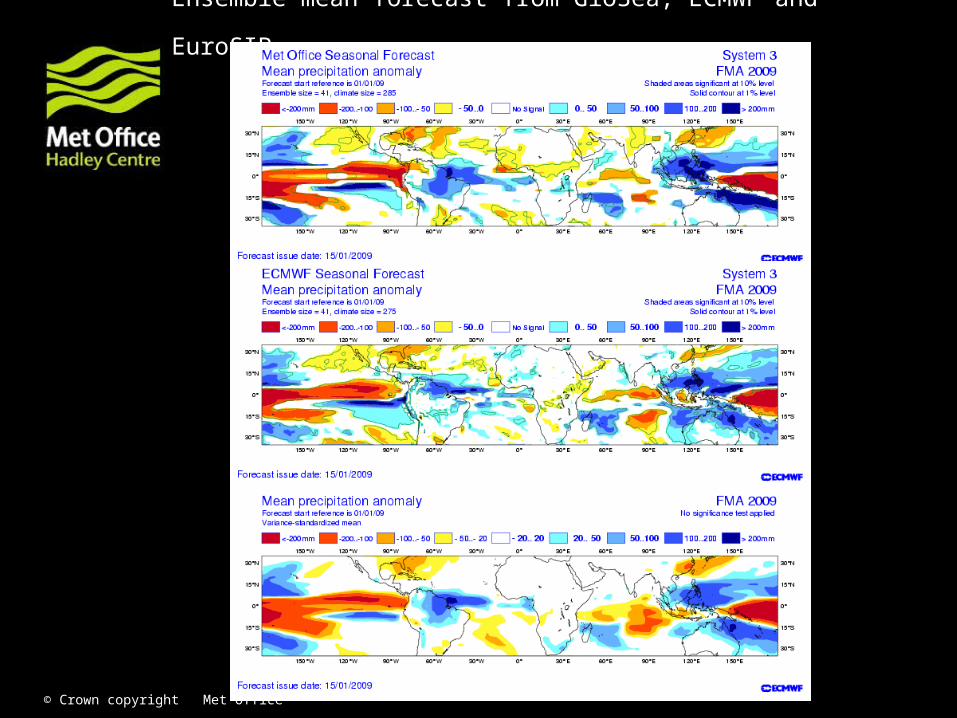
Ensemble mean forecast from GloSea, ECMWF and EuroSIP

© Crown copyright Met Office
Statistical forecast probabilities for terciles (with respect to 1961-1990 climatology)

© Crown copyright Met Office
Multi-variate Statistical/Dynamical forecast probabilities for terciles (with respect to 1961-1990 climatology)

© Crown copyright Met Office
Verification of 2009 forecast

© Crown copyright Met Office
ISSUE 1
DATA UNCERTAINTY
Differences between NCEP Gauge data and GPCP blended gauge and satellite data

© Crown copyright Met Office
Comparison between GPCP AND NCEP

© Crown copyright Met Office
Comparison between GPCP AND NCEP

© Crown copyright Met Office
Comparison between GPCP AND NCEP

© Crown copyright Met Office
ISSUE 2
CHANGES IN S ATLANTIC SST
ANOMALIES
Look at incorrect wet forecast for 2004 as example.

© Crown copyright Met Office
Observed SST Anomaly For January,
February, March and April 2004

© Crown copyright Met Office
Glosea forecast SST Anomaly For MAM 2004 from December and February

© Crown copyright Met Office
ECMWF forecast SST Anomaly For MAM 2004 from February, January & December
© Crown copyright Met Office
Future Developments
1. GloSea4 upgrade
2. KMA/NCEP multi-model system
3. Daily event predictions

© Crown copyright Met Office
Current (GloSea3) and next (GloSea4) seasonal forecast models
GloSea3 (present model)
GloSea4 (as of May 2009)
Atmosphere
Resolution
HadCM3
N48 (~250km),19 lev.
HadGAM3
May 09: N96 (~150 km), 60 lev.
Oct 09: N144 (~90km), 60 lev.
or N216 (~50km), 85 lev. (?)
Ocean
Resolution
HadCM3
1.25ºx1.25º (0.3º tropics)
NEMO
1º x1º (0.3º tropics)
May(Oct?) 09 0.25º x 0.25º (?)
IC Perturbations Climatological errors in SSTs and wind stress
Lagged approach
Model Perturbations
None Perturbed physics
Stochastic Kinetic Energy Backscatter (sub-grid scale uncertainties)

© Crown copyright Met Office
KMA/NCEP: developing Lead Centre for Long-Range Forecast Multi-model Ensembles (LC-LRFMME)
• collect LRF data from GPCs (Global Producing Centres of Long-range Forecasts)
•, display GPC forecasts and MME forecasts in standard formats
• research MME techniques and products
• Lead Centre is active, WMO designation expected March 2009
Dr Won-Tae Yun (KMA), Dr Arun Kumar (NCEP CPC)
http://www.wmolc.org/
9 WMO GPCs designated in 2006

© Crown copyright Met Office
WMO GPC ensemble-mean precipitation forecasts for JJA 2008
Melbourne Montreal Moscow
Seoul Tokyo Washington
© Crown copyright Met Office
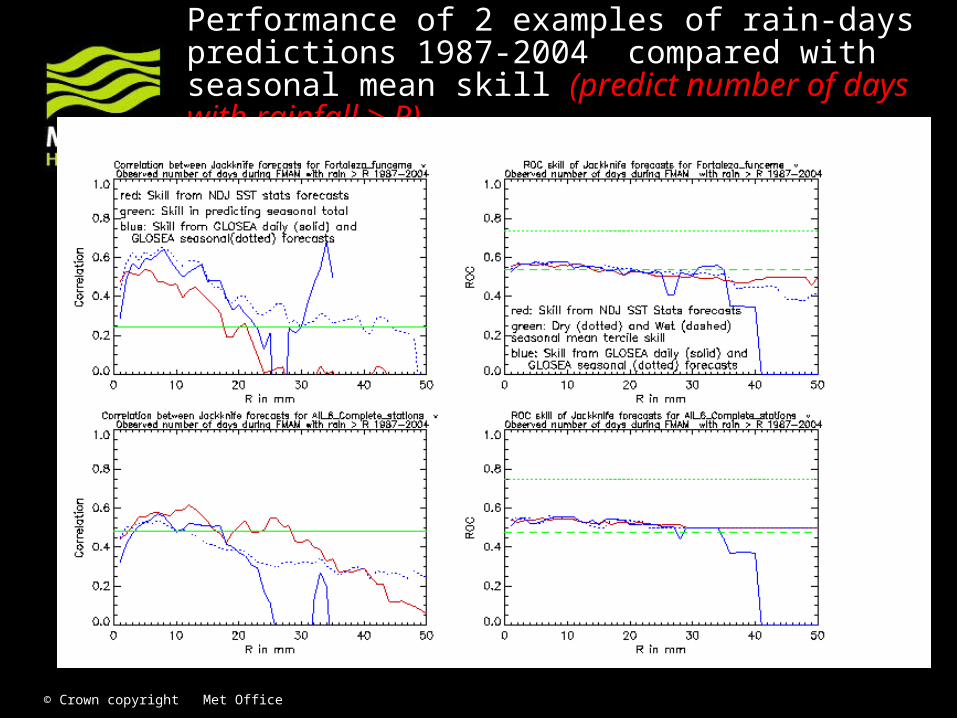
Performance of 2 examples of rain-days predictions 1987-2004 compared with seasonal mean skill (predict number of days with rainfall > R)

© Crown copyright Met Office
Performance of 2 examples of rain-days predictions 1987-2004 compared with seasonal mean skill

© Crown copyright Met Office
Summary
• The Met Office has been issuing seasonal rainfall forecasts for the NE Brazil wet season (March-May) since 1987 based on an established physical link between rainfall and SST
• Useful predictions can be made as far ahead as December
• Problems include uncertainty in rainfall observations and predicting month to month changes in SST in the Gulf of Guinea
• Introduction of newer higher resolution models will hopefully lead to better skill

© Crown copyright Met Office
Questions and answers

© Crown copyright Met Office
Discriminant Probabilities
Discriminant equations are calculated from historicaldata like regression equations but the output is probabilities for a set of forecast categories
Linear Discriminant Analysis is our principal tool for combining and calibrating forecasts