© Copyright. Saul Carliner. 2000-2002. We Are What We Measure: Productivity and Effectiveness...
37
© Copyright. Saul Carliner. 2000-2002. Agenda Exercise About the Study 12 Lessons and Insights Applying the Lessons
Transcript of © Copyright. Saul Carliner. 2000-2002. We Are What We Measure: Productivity and Effectiveness...

© Copyright. Saul Carliner. 2000-
2002.
Agenda
ExerciseAbout the Study12 Lessons and InsightsApplying the Lessons
© Copyright. Saul Carliner. 2000-
2002.
Setting Expectations
FunBut no formula

© Copyright. Saul Carliner. 2000-
2002.
Clarifying
“We”Helen ConstantinedesKirk St.AmantCatherine WalstadSTC
© Copyright. Saul Carliner. 2000-
2002.
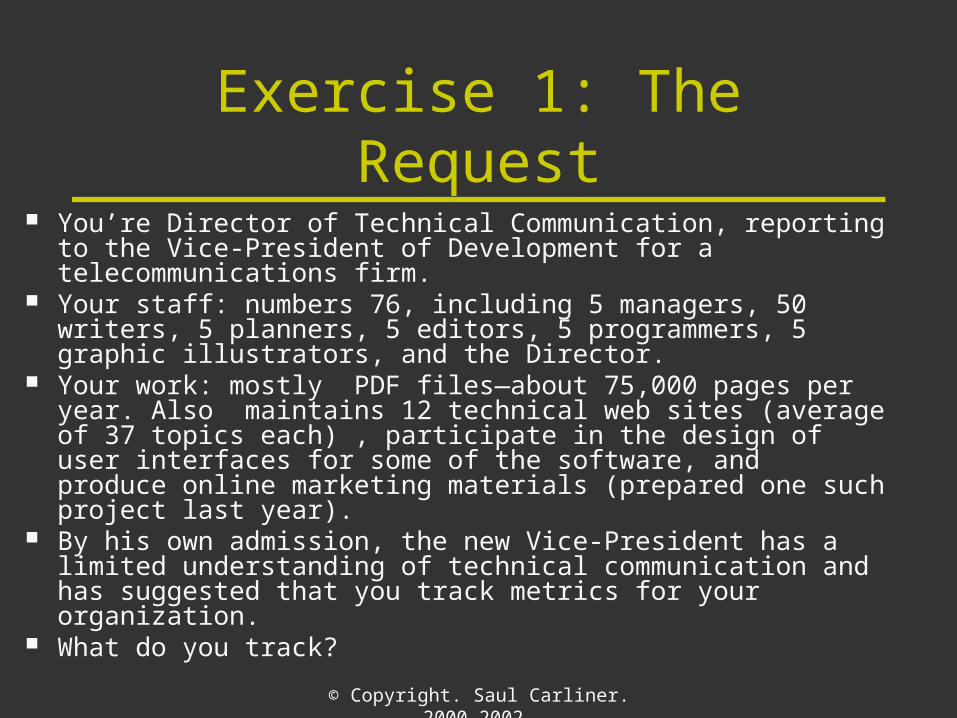
Exercise 1: The Request You’re Director of Technical Communication, reporting to
the Vice-President of Development for a telecommunications firm.
Your staff: numbers 76, including 5 managers, 50 writers, 5 planners, 5 editors, 5 programmers, 5 graphic illustrators, and the Director.
Your work: mostly PDF files—about 75,000 pages per year. Also maintains 12 technical web sites (average of 37 topics each) , participate in the design of user interfaces for some of the software, and produce online marketing materials (prepared one such project last year).
By his own admission, the new Vice-President has a limited understanding of technical communication and has suggested that you track metrics for your organization.
What do you track?

© Copyright. Saul Carliner. 2000-
2002.
Some Definitions
ProductivityEffectivenessMetrics AssessmentEvaluationProof

© Copyright. Saul Carliner. 2000-
2002.
About the Studies
Personal desire to find out how well I’m doing
Best practices often emerge from non-competitors
© Copyright. Saul Carliner. 2000-
2002.
Details: Part One
Beginning of a larger study Purpose
– Identify metrics used by related professions
– Assess their transferability to technical communication
Reviewed literature in software engineering, training, marketing and technical communication, public relations

© Copyright. Saul Carliner. 2000-
2002.
Details: Part Two
Studied larger technical communication departments
Questioned about project, people, and business management
Insufficient response for statistical validity but..
Some responses were abundantly clear

© Copyright. Saul Carliner. 2000-
2002.
12 Best Lessons and Insights about Metrics
© Copyright. Saul Carliner. 2000-
2002.
1. It’s about Evaluation
It’s not about measurement
© Copyright. Saul Carliner. 2000-
2002.
2. Metrics Involve Several Measures
No single measure suffices Differences in assessing
Types of products IndividualsTypes of projects DepartmentsEffectiveness Productivity

© Copyright. Saul Carliner. 2000-
2002.
3. Simple Measures Don’t
(in fact, no standard practicesacross organizations in technicalcommunication) Page counts Topics written Lines of codes written Student days
© Copyright. Saul Carliner. 2000-
2002.
Issues
Producing better often means producing less
As number of media grow, no single count works
© Copyright. Saul Carliner. 2000-
2002.
4. You Cannot Wait Until Completion to Begin
Showing a change in performance usually requires a before:after comparison: – Effectiveness of communication product– Productivity of development effort
To be credible, measurement cannot begin after-the-fact
© Copyright. Saul Carliner. 2000-
2002.
In Technical Communication
Evaluation is not a standard business activity.
Until that changes, measures unlikely to have credibility.

© Copyright. Saul Carliner. 2000-
2002.
5. Metrics Assume You Follow a Documented
Process Preferably, an industry-standard one Software Capability Maturity Model Instructional Systems Design
Process Analysis-Design-Placement
Approach

© Copyright. Saul Carliner. 2000-
2002.
In Technical Communication
A standard process seems to exist Focused on project management
rather than design and development issues
Requirements-Development- “Checks”-Release

© Copyright. Saul Carliner. 2000-
2002.
6. (starting it, anyway)
Why do organizations commission us to write information for users?
Hint: It’s not for usability.
© Copyright. Saul Carliner. 2000-
2002.
Organizations Hire Us to Produce Business Results
Why we’re commissionedGenerate revenueContain expensesComply with regulations
© Copyright. Saul Carliner. 2000-
2002.
6. To Assess Effectiveness, Must Begin with Clear
GoalsState goals in observable and measurable terms: For intended business results For the content

© Copyright. Saul Carliner. 2000-
2002.
In an Interesting Paradox in Technical Communication
“Users performing intended tasks” and “business results” are commonly stated measures of effectiveness
Projects do not begin with content or business objectives
Usability testing is rarely performed

© Copyright. Saul Carliner. 2000-
2002.
7. To Assess Productivity, You Must Benchmark Against the
Industry Industry surveys provide benchmarks: TRAINING Industry Survey IDG Surveys Merrill Lynch and other investment
firms AD Week AC Nielsen

© Copyright. Saul Carliner. 2000-
2002.
Unfortunately
We have no comparable survey in technical communication.
© Copyright. Saul Carliner. 2000-
2002.
8. Industry Standard Models Build Acceptance
They also improve methods Examples
– Kirkpatrick Model – Direct response measures– cpm

© Copyright. Saul Carliner. 2000-
2002.
Question
You receive a resume. The applicant is one of the best you’ve seen.
But you find a visible typo on the resume.
Would you hire the candidate or not?
© Copyright. Saul Carliner. 2000-
2002.
In Technical Communication
Most common method of assessing effectiveness is technical reviews
Use of Readers’ Comment Forms is low

© Copyright. Saul Carliner. 2000-
2002.
9. Measurements of Technique Are Not Persuasive
They assess neither effectiveness nor productivity
Although research might indicate which characteristics correlate with effectiveness, they do not guarantee it

© Copyright. Saul Carliner. 2000-
2002.
Examples
White space Typographical errors Number of index entries per
page Number of illustrations per
page Choice of type font

© Copyright. Saul Carliner. 2000-
2002.
When Possible, Use Financially Based Measures
Sales generated Billings Registrations Billings

© Copyright. Saul Carliner. 2000-
2002.
10. Intangibles Matter to Executives
PerceptionsFeelingsFrustrationName recognitionAlso collect descriptive data
in addition to numeric data
© Copyright. Saul Carliner. 2000-
2002.
Use of Data
Numerical data indicates the extent
Descriptive data tells the impact
© Copyright. Saul Carliner. 2000-
2002.
11. Collect Data on an Ongoing Basis
Devote between 2 and 5 percent of a project budget to evaluation
© Copyright. Saul Carliner. 2000-
2002.
Issues
One-time studiesDesperation studiesMetrics for tyranny rather
than as a tool for continuous improvement

© Copyright. Saul Carliner. 2000-
2002.
12. On Their Own, Metrics Prove Nothing
Metrics build perceptions Data supports those perceptions Data promotes informed decision-
making Part of a larger system of building
and maintaining relationships with sponsors

© Copyright. Saul Carliner. 2000-
2002.
In Other Words
Metrics are a value system.
We choose to measure things we believe to be important.

© Copyright. Saul Carliner. 2000-
2002.
A Successful Metrics Program
Tracks measurements that are important to us as technical communicators and meaningful to our sponsors

© Copyright. Saul Carliner. 2000-
2002.
Take-Aways