© Copyright IBM Corporation 2007 Disclaimer (Optional location for any required disclaimer copy. To...
25
© Copyright IBM Corporation 2007 Disclaimer (Optional location for any required disclaimer copy. To set disclaimer, or delete, go to View | Master | Slide Master) IBM Institute for Business Value IBM Global Business Services Estimates of Labour Productivity in Wholesale and Retail Trade:2002-2005 Dr. Mary Keeling, Global Centre for Economic Development Research, IBM Institute for Business Value Dr. Rita Buckley, Department of Economics, Kemmy Business School, University of Limerick CSO Business Statistics Seminar, 26 th February 2008
-
Upload
pearl-mcdowell -
Category
Documents
-
view
217 -
download
0
Transcript of © Copyright IBM Corporation 2007 Disclaimer (Optional location for any required disclaimer copy. To...

© Copyright IBM Corporation 2007
Disclaimer(Optional location for any required disclaimer copy.
To set disclaimer, or delete, go to View | Master | Slide Master)
IBM Institute for Business Value
IBM Global Business Services
Estimates of Labour Productivity in Wholesale and Retail Trade:2002-2005
Dr. Mary Keeling, Global Centre for Economic Development Research, IBM Institute for Business ValueDr. Rita Buckley, Department of Economics, Kemmy Business School, University of Limerick
CSO Business Statistics Seminar, 26th February 2008

© Copyright IBM Corporation 2007
IBM Global Business Services
CSO Business Statistics Seminar | 26th February 20082
Empirical estimates of productivity in wholesale and retail trade in Ireland:2002-2005
Why examine labour productivity in wholesale and retail trade?
How we measure productivity in wholesale and retail trade
Questions we are interested in answering
1. Within wholesale and retail trade, how have individual sub sectors performed over the 2002-05 period?
2. How does productivity vary according to firm size?
3. How does productivity vary for family vs non-family owned firms?
4. How does productivity vary for foreign vs domestically owned firms?
Contents OR Agenda

© Copyright IBM Corporation 2007
IBM Global Business Services
CSO Business Statistics Seminar | 26th February 20083
Wholesale and retail trade account for the majority of employment in services
38.8 38.3 37.9 38.6
18.8 18.7 18.1 17.5
12.6 12.6 12.5 11.9
24.2 24.2 25.2 25.7
5.5 6.3 6.3 6.2
0%
20%
40%
60%
80%
100%
2002 2003 2004 2005
Other community, social andpersonal services activities
Real estate renting
Transport, storage andcommunications
Hotels and restaurants
Wholesale and retail distribution

© Copyright IBM Corporation 2007
IBM Global Business Services
CSO Business Statistics Seminar | 26th February 20084
They also account for a significant proportion of total enterprises in services
38.3 37.3 36.1 34.8
15.4 14.8 13.2 12.4
7.6 8.1 8.1 7.8
30.0 32.0 34.8 37.2
8.7 7.8 7.7 7.7
0%
20%
40%
60%
80%
100%
2002 2003 2004 2005
Other community, social andpersonal services activities
Real estate renting
Transport, storage andcommunications
Hotels and restaurants
Wholesale and retail distribution

© Copyright IBM Corporation 2007
IBM Global Business Services
CSO Business Statistics Seminar | 26th February 20085
Data requirements for measurement of productivity
Nominal Output
Prices Real Output Inputs Productivity
Productivity = real output per unit of input
Labour Productivity : The most extensively developed and widely used productivity measure because of its relevance to economic analyses and because, as a practical matter, labour is the most easily measured input

© Copyright IBM Corporation 2007
IBM Global Business Services
CSO Business Statistics Seminar | 26th February 20086
How should output be measured in wholesale and retail trade?
Caution must be exercised when using value added figures especially for non-tradable services as - there are significant measurement issues that arise from the use of the
value added method in relation to non-tradable services (Forfas, 2006)
Value added conceptually less appropriate for estimating productivity - Output and purchased intermediate input data are more suitable for
industry productivity analysis (Triplett and Bosworth, 2003)
- There is a general shift away from emphasis on value added for output and productivity measurement in services (Bosworth, 2005)

© Copyright IBM Corporation 2007
IBM Global Business Services
CSO Business Statistics Seminar | 26th February 20087
How we measure the volume of output in wholesale and retail trade
Volume of sales
Volume of margin output
The main part of the output consists of wholesale and retail trade marginsThe most widely used method of estimating the volume of margin output is to assume that the volume of margins follows the volume of sales
The volume of sales is obtained by deflating sales by a sales price indexFor retail trade, this should be an index of retail sales prices, e.g. a CPI. For wholesale trade, the appropriate index would be a wholesale price indexThis is considered by Eurostat (2001) as an acceptable alternative (B) to the ideal method (A)
Any other methods, in particular the deflation of margin output or VA directly by a sales price index, are classified by Eurostat (2001) as ‘C’ methods.
Currently there are no estimates using ideal (A) or acceptable alternative (B) methods for Ireland
Volume of margin output
© Copyright IBM Corporation 2007
IBM Global Business Services
CSO Business Statistics Seminar | 26th February 20088
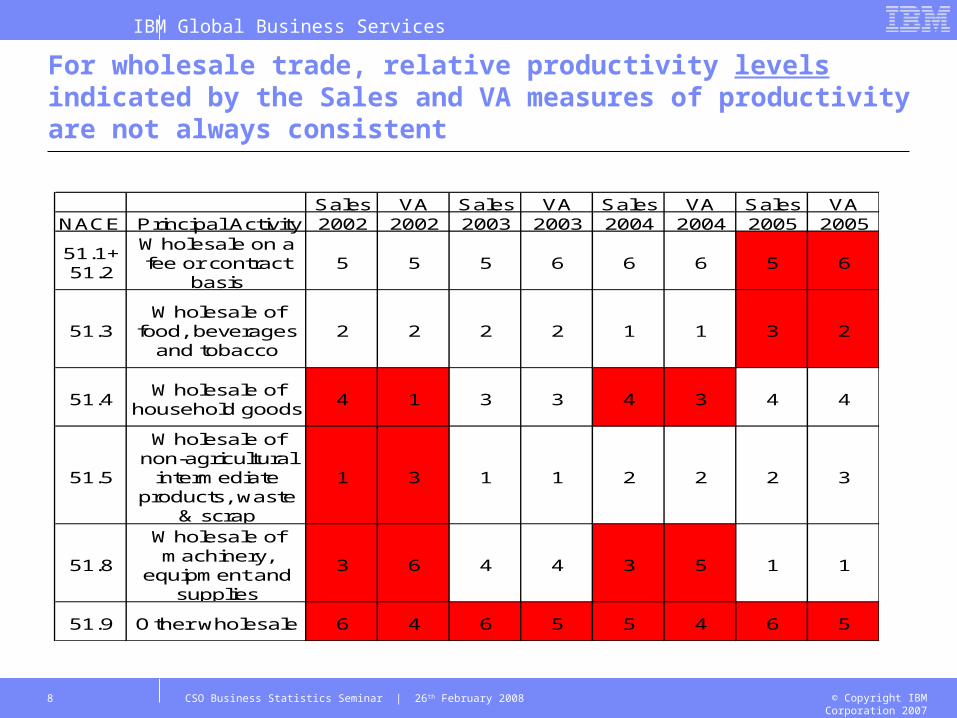
For wholesale trade, relative productivity levels indicated by the Sales and VA measures of productivity are not always consistent
Sales VA Sales VA Sales VA Sales VANACE Rev.1.1 Principal Activity 2002 2002 2003 2003 2004 2004 2005 2005
51.1+51.2
Wholesale on a fee or contract
basis5 5 5 6 6 6 5 6
51.3Wholesale of
food, beverages and tobacco
2 2 2 2 1 1 3 2
51.4Wholesale of
household goods4 1 3 3 4 3 4 4
51.5
Wholesale of non-agricultural
intermediate products, waste
& scrap
1 3 1 1 2 2 2 3
51.8
Wholesale of machinery,
equipment and supplies
3 6 4 4 3 5 1 1
51.9 Other wholesale 6 4 6 5 5 4 6 5

© Copyright IBM Corporation 2007
IBM Global Business Services
CSO Business Statistics Seminar | 26th February 20089
These inconsistencies are also evident for retail trade
NACE Rev.1.1 Principal Activity 2002 2002 2003 2003 2004 2004 2005 2005
52.1Retail sale in non-
specialised stores
3 4 3 3 3 3 3 4
52.2
Retail sale of food, beverages and tobacco in
specialised stores
5 6 5 5 5 7 5 6
52.3
Retail sale of pharmaceutical
and medical goods, cosmetic and toilet articles
2 2 2 2 2 2 2 1
52.4
Other retail sale of new goods in
specialised stores
4 3 4 4 4 4 4 3
52.5Retail sale of second-hand
goods in stores6 7 6 7 6 6 6 7
52.6Retail sale not in
stores1 1 1 1 1 1 1 2
52.7Repair of
personal and household goods
7 5 7 6 7 5 7 5

© Copyright IBM Corporation 2007
IBM Global Business Services
CSO Business Statistics Seminar | 26th February 200810
There is even greater variance between the two measures for productivity growth in wholesale trade
NACE Rev.1.1 Principal Activity Sales VA Sales VA Sales VA Sales VA
51.1+51.2
Wholesale on a fee or contract
basis3 4 6 6 2 3 5 6
51.3Wholesale of
food, beverages and tobacco
2 3 1 1 6 6 4 2
51.4Wholesale of
household goods4 6 4 3 4 4 3 5
51.5
Wholesale of non-agricultural
intermediate products, waste
& scrap
1 2 5 5 3 5 2 3
51.8
Wholesale of machinery,
equipment and supplies
5 1 2 4 1 1 1 1
51.9 Other wholesale 6 5 3 2 5 2 6 4
2002-20052004-052003-042002-03

© Copyright IBM Corporation 2007
IBM Global Business Services
CSO Business Statistics Seminar | 26th February 200811
…. As well as for retail trade
NACE Rev.1.1 Principal Activity Sales VA Sales VA Sales VA Sales VA
52.1Retail sale in non-
specialised stores
5 1 4 5 1 5 1 3
52.2
Retail sale of food, beverages and tobacco in
specialised stores
4 5 5 6 4 1 5 1
52.3
Retail sale of pharmaceutical
and medical goods, cosmetic and toilet articles
2 2 7 7 5 4 7 6
52.4
Other retail sale of new goods in
specialised stores
3 4 6 4 2 2 3 4
52.5Retail sale of second-hand
goods in stores6 3 3 3 3 6 2 5
52.6Retail sale not in
stores1 6 2 1 7 7 4 7
52.7Repair of
personal and household goods
7 7 1 2 6 3 6 2

© Copyright IBM Corporation 2007
IBM Global Business Services
CSO Business Statistics Seminar | 26th February 200812
‘Wholesale of food, beverages and tobacco’ is the most important sector in terms of employment and enterprise within wholesale trade
NACE Rev.1.1 Principal Activity2002 2003 2004 2005 2002 2003 2004 2005
51.1+51.2 Wholesale on a fee or contract basis, Wholesale of agricultural raw materials and live animals
8.9 15.1 11.1 9.5 17.2 19.7 20.5 21.8
51.3 Wholesale of food, beverages and tobacco
26.7 25.4 25.3 25.9 21.7 22.1 22.7 22.5
51.4 Wholesale of household goods
19.7 17.1 17.2 17.7 17.0 16.7 17.0 16.8
51.5 Wholesale of non-agricultural intermediate products, waste and scrap
19.7 19.5 21.7 22.2 16.5 16.0 16.0 16.6
51.8 Wholesale of machinery, equipment and supplies
17.6 14.8 16.1 16.8 15.3 13.4 12.9 12.3
51.9 Other wholesale 7.4 8.1 8.5 7.7 12.3 12.0 10.9 10.0Total 100 100 100 100 100 100 100 100
Number of Persons Engaged Number of Enterprises

© Copyright IBM Corporation 2007
IBM Global Business Services
CSO Business Statistics Seminar | 26th February 200813
While retail sales in non-specialised stores accounts for the majority of employment, other retail sale of new goods in specialised stores accounts for most enterprises
NACE Rev.1.1 Principal Activity2002 2003 2004 2005 2002 2003 2004 2005
52.1 Retail sale in non-specialised stores
47.9 45.8 45.2 46.3 24.2 23.3 22.9 19.8
52.2 Retail sale of food, beverages and tobacco in specialised stores
6.3 6.9 6.7 5.8 12.4 12.2 12.3 11.8
52.3 Retail sale of pharmaceutical and medical goods, cosmetic and toilet articles
5.3 5.6 6.0 6.1 5.3 5.4 5.6 5.9
52.4 Other retail sale of new goods in specialised stores 38.0 38.3 39.1 39.3 50.8 51.4 51.1 54.0
52.5 Retail sale of second-hand goods in stores
0.5 0.6 0.6 0.3 1.6 1.4 1.7 1.0
52.6 Retail sale not in stores 0.7 1.4 1.2 1.0 1.6 2.2 2.1 2.852.7 Repair of personal and
household goods1.3 1.3 1.2 1.1 4.1 4.1 4.4 4.7
100 100 100 100 100 100 100 100
Number of Persons Engaged Number of Enterprises

© Copyright IBM Corporation 2007
IBM Global Business Services
CSO Business Statistics Seminar | 26th February 200814
Within wholesale trade, sales volume indicates that the sector with the highest productivity level has not been constant between 2002-05
NACE Rev.1.1 Principal Activity 2002 2003 2004 2005
51.1+51.2Wholesale on a fee or contract
basis368339 401336 318199 436381
51.3Wholesale of
food, beverages and tobacco
548684 614477 825943 715413
51.4Wholesale of
household goods466451 475186 542613 610740
51.5
Wholesale of non-agricultural
intermediate products, waste
& scrap
583018 714445 722408 975065
51.8
Wholesale of machinery,
equipment and supplies
475075 465072 569434 998320
51.9 Other wholesale 328014 286766 343588 385483

© Copyright IBM Corporation 2007
IBM Global Business Services
CSO Business Statistics Seminar | 26th February 200815
Whereas within retail trade, ‘Retail sale not in stores’ has consistently had the highest productivity level between 2002-05
NACE Rev.1.1 Principal Activity 2002 2003 2004 2005
52.1Retail sale in non-
specialised stores
140635 138624 141926 156381
52.2
Retail sale of food, beverages and tobacco in
specialised stores
111993 111893 113712 112121
52.3
Retail sale of pharmaceutical
and medical goods, cosmetic and toilet articles
168708 181373 170670 162084
52.4
Other retail sale of new goods in
specialised stores
125457 128834 126373 132470
52.5Retail sale of second-hand
goods in stores64578 57309 69081 71218
52.6Retail sale not in
stores217913 272974 375075 219438
52.7Repair of
personal and household goods
50006 39788 54734 49832

© Copyright IBM Corporation 2007
IBM Global Business Services
CSO Business Statistics Seminar | 26th February 200816
‘Wholesale of machinery, equipment and supplies’ had the highest productivity growth over the 2002-2005 period
NACE Rev.1.1 Principal Activity 2002-03 2003-04 2004-05 2002-05
51.1+51.2
Wholesale on a fee or contract
basis9.0 -20.7 37.1 18.5
51.3Wholesale of
food, beverages and tobacco
12.0 34.4 -13.4 30.4
51.4Wholesale of
household goods
1.9 14.2 12.6 30.9
51.5
Wholesale of non-agricultural
intermediate products, waste
& scrap
22.5 1.1 35.0 67.2
51.8
Wholesale of machinery,
equipment and supplies
-2.1 22.4 75.3 110.1
51.9 Other wholesale -12.6 19.8 12.2 17.5

© Copyright IBM Corporation 2007
IBM Global Business Services
CSO Business Statistics Seminar | 26th February 200817
‘Retail sales in non-specialised stores’ had the highest productivity growth rate for the 2002-2005 period
NACE Rev.1.1 Principal Activity 2002-03 2003-04 2004-05 2002-05
52.1Retail sale in
non-specialised stores
-1.4 2.4 10.2 11.2
52.2
Retail sale of food, beverages and tobacco in
specialised stores
-0.1 1.6 -1.4 0.1
52.3
Retail sale of pharmaceutical
and medical goods, cosmetic and toilet articles
7.5 -5.9 -5.0 -3.9
52.4
Other retail sale of new goods in
specialised stores
2.7 -1.9 4.8 5.6
52.5Retail sale of second-hand
goods in stores-11.3 20.5 3.1 10.3
52.6Retail sale not in
stores25.3 37.4 -41.5 0.7
52.7
Repair of personal and
household goods
-20.4 37.6 -9.0 -0.3

© Copyright IBM Corporation 2007
IBM Global Business Services
CSO Business Statistics Seminar | 26th February 200818
Larger firms account for the marjority of employment and small firms account for the majority of enterprises in wholesale and retail trade
NACE Rev.1.1
Principal Activityand
Number of Persons Engaged2002 2003 2004 2005 2002 2003 2004 2005
51 1 - 9 Persons engaged 16.1 18.0 17.9 19.4 77.9 78.5 79.3 81.710 - 19 Persons engaged 11.9 14.4 14.1 11.1 10.3 11.7 10.8 8.320 - 49 Persons engaged 20.6 18.8 21.5 18.8 8.0 6.5 6.6 6.450 or more Persons engaged 51.4 48.8 46.5 50.6 3.9 3.4 3.2 3.6Total 100.0 100.0 100.0 100.0 100.0 100.0 100.0 100.0
52 1 - 9 Persons engaged 25.2 24.7 23.8 20.3 89.7 88.9 87.7 86.710 - 19 Persons engaged 10.0 11.9 12.4 11.4 5.7 6.5 7.4 7.820 - 49 Persons engaged 11.8 11.4 11.7 10.8 3.1 2.9 3.1 3.350 or more Persons engaged 53.0 52.0 52.1 57.6 1.4 1.6 1.8 2.2Total 100.0 100.0 100.0 100.0 100.0 100.0 100.0 100.0
Total Numberof Employees
Total Number of Enterprises

© Copyright IBM Corporation 2007
IBM Global Business Services
CSO Business Statistics Seminar | 26th February 200819
In wholesale trade, larger firms generally also have higher productivity levels, while for retail trade, smaller firms have higher productivity levels
2002 2003 2004 200551 1 - 9 Persons
engaged415,592 428,866 450,970 673,601
10 - 19 Persons engaged
488,687 551,125 773,332 667,027
20 - 49 Persons engaged
525,720 485,044 487,869 746,071
50 or more Persons engaged
574,073 645,226 771,662 832,560
Sub-total 528,456 562,667 653,359 766,9472002 2003 2004 2005
52 1 - 9 Persons engaged
185,080 180,902 178,402 186,414
10 - 19 Persons engaged
129,289 126,813 125,356 134,091
20 - 49 Persons engaged
132,331 117,153 125,049 117,910
50 or more Persons engaged
146,651 156,049 149,928 150,087
Sub-total 152,926 154,294 150,746 152,159

© Copyright IBM Corporation 2007
IBM Global Business Services
CSO Business Statistics Seminar | 26th February 200820
But the highest productivity growth between 2002-05 was in smaller firms in wholesale trade and firms employing 10-19 persons in retail trade
2002-2003 2003-2004 2004-2005 2002-200551 1 - 9 Persons
engaged3.2 5.2 49.4 62.1
10 - 19 Persons engaged
12.8 40.3 -13.7 36.5
20 - 49 Persons engaged
-7.7 0.6 52.9 41.9
50 or more Persons engaged
12.4 19.6 7.9 45.0
Sub-total 6.5 16.1 17.4 45.12002-2003 2003-2004 2004-2005 2002-2005
52 1 - 9 Persons engaged
-2.3 -1.4 4.5 0.7
10 - 19 Persons engaged
-1.9 -1.1 7.0 3.7
20 - 49 Persons engaged
-11.5 6.7 -5.7 -10.9
50 or more Persons engaged
6.4 -3.9 0.1 2.3
Sub-total 0.9 -2.3 0.9 -0.5

© Copyright IBM Corporation 2007
IBM Global Business Services
CSO Business Statistics Seminar | 26th February 200821
Non-family owned firms account for the majority of enterprises and employment in wholesale trade, but family owned firms are relatively more important in retail trade
NACE Rev. 1.1
Nationality of
Ownership2004 2005 2004 2005
51 Family 48.4 48.4 35.1 40.6Non-Family 51.6 51.6 64.9 59.4Total 100.0 100.0 100.0 100.0
52 Family 60.1 56.1 55.2 50.2Non-Family 39.9 43.9 44.8 49.8Total 100.0 100.0 100.0 100.0
Number of Enterprises Employment

© Copyright IBM Corporation 2007
IBM Global Business Services
CSO Business Statistics Seminar | 26th February 200822
While non-family owned firms had the highest productivity levels in both wholesale and retail trade, family owned firms in both wholesale had higher productivity growth
Growth
NACE Rev. 1.1
Nationality of
Ownership2004 2005 2004-05
51 Family 383430 510571 33.2Non-Family 799383 942017 17.8Total 653368 766947 17.4
52 Family 139446 145115 4.1Non-Family 156502 159250 1.8Total 147089 152159 3.4
Productivity level

© Copyright IBM Corporation 2007
IBM Global Business Services
CSO Business Statistics Seminar | 26th February 200823
Irish owned firms account for the majority of employment and enterprises in both wholesale and retail trade
NACE Rev. 1.1
Nationality of
Ownership2002 2003 2004 2005 2002 2003 2004 2005
51 Irish 79.4 79.4 80.6 78.9 70.8 77.3 74.2 71.4Foreign 20.6 20.6 19.4 21.1 29.2 22.7 25.8 28.6Total 100.0 100.0 100.0 100.0 100.0 100.0 100.0 100.0
52 Irish 93.1 94.0 93.6 93.5 72.0 73.4 73.0 69.5Foreign 6.9 6.0 6.4 6.5 28.0 26.6 27.0 30.5Total 100.0 100.0 100.0 100.0 100.0 100.0 100.0 100.0
Numberof Enterprises Number of Persons Engaged

© Copyright IBM Corporation 2007
IBM Global Business Services
CSO Business Statistics Seminar | 26th February 200824
But foreign firms had higher productivity levels and growth between 2002-05
NACE Rev. 1.1
Nationality of
Ownership2002 2003 2004 2005
2002-03
2003-04
2004-05
2002-05
51 Irish 463699 531734 568982 621112 14.7 7.0 9.2 33.9Foreign 775579 819808 991483 1259729 5.7 20.9 27.1 62.4Total 554916 597074 677851 803495 7.6 13.5 18.5 44.8
52 Irish 131579 140114 134384 128334 6.5 -4.1 -4.5 -2.5Foreign 173300 171075 172387 180490 -1.3 0.8 4.7 4.1Total 143240 148364 144652 144250 3.6 -2.5 -0.3 0.7
Productivity level Productivity growth rate

© Copyright IBM Corporation 2007
IBM Global Business Services
CSO Business Statistics Seminar | 26th February 200825
So what have we learned?
Sales and VA measures of productivity are not always consistent in indicating the sectors within wholesale and retail trade that are the most productive, or where productivity is increasing the most
Firm size matters for productivity levels and growth- In wholesale trade, larger firms generally have higher productivity levels, while for
retail trade, smaller firms have higher productivity levels Family ownership matters for productivity levels and growth
- While non-family owned firms had the highest productivity levels in both wholesale and retail trade, family owned firms in both wholesale had higher productivity growth
Foreign ownership matters for productivity levels and growth- Foreign firms had higher productivity levels and growth between 2002-05
Next steps- Interaction between firms size, family ownership, foreign ownership, exporting- Analyse the contribution of each sub-sector within wholesale and retail trade to
productivity growth- Set out the implications of the results for differentiating and targeting public policy