© Copyright 2017 Orvalho Joaquim Augusto
32
© Copyright 2017 Orvalho Joaquim Augusto
Transcript of © Copyright 2017 Orvalho Joaquim Augusto

© Copyright 2017
Orvalho Joaquim Augusto

First Trimester Use of Artemisinin-Based Combination Therapy and Risk of Low Birth Weight
Orvalho Joaquim Augusto
A thesis
submitted in partial fulfillment of the
requirements for the degree of
MASTER OF PUBLIC HEALTH
University of Washington
2017
Committee:
Andy Stergachis
Stephen Gloyd
Program Authorized to Offer Degree:
Global Health

University of Washington
Abstract
First Trimester Use of Artemisinin-Based Combination Therapy and Risk of Low Birth Weight
Orvalho Joaquim Augusto
Chair of the Supervisory Committee:
Professor Andy Stergachis
Global Health
Introduction: There is a lack of sufficient evidence on the safety of use of artemisinin-based combination
therapies (ACT) among pregnant women, especially during early pregnancy. We determined the
association between exposure to ACT during the first trimester of pregnancy and occurrence of low birth
weight (LBW), and small for gestational age (SGA) among the offspring of pregnant women.
Methods: We performed a secondary analysis of data from a prospective cohort study of pregnant
women recruited at three health and demographic surveillance system (HDSS) sites in the sub-Saharan
African countries of Mozambique, Burkina Faso and Kenya. Data from the HDSS allowed earlier
pregnancy identification and linkage and tracking of pregnancy outcomes to determine birth weight and
gestational age at delivery. Exposure to any antimalarials was ascertained through a combination of
data collected from clinic registers, prescription records and self-reported usage by the women.
Results: There was no difference in the pooled prevalence of LBW among children born to pregnant
women who were exposed to quinine, ACT and had no exposure to antimalarials, 21.0%, 11.3% and
10.2%, respectively. Children whose mothers had exposure to ACTs during the first trimester had 21%
lower occurrence of LBW when compared to children born to mothers exposed to ACTs in second or
third trimester, this difference was not statistical significant (95%CI: -7-49%).

Conclusion: ACT exposure during the first trimester was not associated with an increased risk of LBW.
Our findings support the use of ACT for treatment of malaria during the first trimester of pregnancy.

Table of Contents Acknowledgement ......................................................................................................................................... 1
Dedication ..................................................................................................................................................... 1
Introduction ................................................................................................................................................... 1
Objective ................................................................................................................................................... 2
Methods ........................................................................................................................................................ 3
Study design .............................................................................................................................................. 3
ASAP data collection procedures .............................................................................................................. 3
Enrollment into the Study ..................................................................................................................... 3
Data collection procedures ................................................................................................................... 4
Inclusion criteria for the analysis............................................................................................................... 6
Outcomes .................................................................................................................................................. 6
Study groups .............................................................................................................................................. 7
Potential covariates ................................................................................................................................... 7
Data sources .............................................................................................................................................. 7
Bias and control measures ........................................................................................................................ 7
Statistical methods .................................................................................................................................... 9
Baseline characteristics of different comparison groups ...................................................................... 9
Prevalence of low birth weight and of small for gestational age analysis ............................................ 9
Mean weight and mean gestational age at birth .................................................................................. 9
Software ..............................................................................................................................................10
Ethical Approval .......................................................................................................................................10
Results .........................................................................................................................................................11
Baseline characteristics ...........................................................................................................................11
Mean weight at birth ...............................................................................................................................12
Prevalence of LBW ...................................................................................................................................12
Prevalence of SGA ...................................................................................................................................12
Discussion ....................................................................................................................................................13
Limitations ...............................................................................................................................................14
Conclusions ..............................................................................................................................................15
References ...............................................................................................................................................16
Tables ......................................................................................................................................................18
All weights from 2134 newborns are included in the analysis post imputation. ................................22
Figures .....................................................................................................................................................25
Acknowledgement This work would not have been possible without the support and dedication from many. Firstly, I thank
all ASAP study participants, clinicians and other study staff. Many thanks to Stephanie Kovacs, Greg
Calip, Stephanie Dellicour and Brandon Guthrie for the immense guidance you offered me. Thank you
Kenneth Sherr, James Pfeiffer, Julie Cliff and the great Health Alliance International for your support and
making my way to Seattle possible. I am grateful to the Kunde’s family (Bob and Gwen) who without
reservation accepted me in their home, kept me alive and supported me in every step. I am indebted to
the magnificent 2014 MPH cohort for the continuous infusion of good mood, thank you for that. I also
thank Anne Njoroge, Gloria Ikilezi and Christopher Kemp for helping out on desperation. Finally, I thank
my thesis committee members, Stephen Gloyd and my committee chair Andy Stergachis along with my
longtime mentor, Esperanca Sevene. Kanimambo!

Dedication
To my parents (Augusto and Isabel) who sacrificed a lot and dedicate their life for my education and
wellbeing. To my brothers (Olinda, Ivo, Paulo and Augusto Jr) who understood and taught me what is
love and sharing. To my Country, Mozambique, that has been promoting health and education for
everyone even under the most adverse circumstances.

Introduction Artemisinin-based combination therapy (ACT) is the recommended first line treatment of Plasmodium
falciparum uncomplicated malaria. Yet, there is a lack of sufficient safety evidence of artemisinin
derivative products used by pregnant women due to ethical concerns of enrolling pregnant women in
randomized controlled trials (RCT). ACTs are not recommended by the World Health Organization
(WHO) for use in the first trimester of pregnancy, unless there are no other drugs available, due to
concerns based upon animal studies suggesting their potential for embryotoxicity and teratogenicity1.
Preclinical studies show that artemisinins are embryotoxic and teratogenic in multiple animal species2-6.
However, in settings where ACTs are the recommended treatment for uncomplicated malaria, it is very
likely that a woman will be inadvertently exposed in the early pregnancy due to their high market
availability and because the women and health care providers being unaware of a woman’s pregnancy
status at the time of prescribing an antimalarial 7.
Malaria infection in pregnancy is associated with maternal anemia and intrauterine growth restriction
(IUGR), leading to poor pregnancy outcomes such as low birth weight (LBW). Malaria accounts for 14%
to 25% of LBW in Sub-Saharan Africa 8,9. Due to these concerns, multiple measures to prevent malaria in
pregnancy are recommended. These measures include the use of long lasting insecticide treated nets
(LLITNs), administration of intermittent preventive treatment in pregnancy with sulfadoxine-
pyremethamine (IPTp-SP), and malaria case management 10. The WHO currently recommends the use of
artemisinin-based combination therapy (ACT) for the treatment of uncomplicated malaria in adults,
children and in pregnant women in their 2nd or 3rd trimester. Seven days of quinine with clindamycin is
recommended for uncomplicated malaria in the first trimester of pregnancy1. All these measures have
shown an impact on reducing malaria mortality and morbidity including the occurrence of LBW 11.
The WHO defines LBW as a birth weight of live born infant of less than 2500g 12. LBW is a result of a
short gestational period, IUGR or a combination of both processes, and contributes globally to high
2
neonatal and infant mortality and morbidity 12. The global prevalence of LBW among live births is 15.5%
representing as many as 20 million infants in the world, of which 95% of are from developing countries.
Sub-Saharan Africa (SSA) alone accounts for 4 million infants born LBW 13. A LBW neonate born in SSA is
9 times more likely to die than a normal-weight baby in the first month of life 14,15. Moreover, infant
mortality rates increase exponentially the lower the birth weight 16.
A related measure to LBW that accounts for gestational age is the small-for-gestational age (SGA)
measure. SGA is weight less than the 10th percentile of birth weight for the newborn’s gestational age 17.
Infants who are growth-restricted experience higher rates of fetal and infant death, birth asphyxia,
hypothermia, hypoglycemia, meconium aspiration, and long-term neurological impairment 16.
Given the widespread use of ACT in malaria endemic region, inadvertent exposure in the first trimester
of pregnancy is common18. Therefore, it is imperative to gather and generate safety data and analysis of
ACT exposure in the first trimester.
The Assessment of Safety of Antimalarial drug use during early Pregnancy (ASAP) study was a multi-
country prospective cohort study of pregnant women to evaluate whether ACT exposure in early
pregnancy increased the risk for miscarriage, stillbirths, congenital malformations and low birth weight
when compared to current therapeutic options 19. The risk of miscarriage, stillbirths and congenital
anomalies have been reported elsewhere 20. In this analysis we aim to evaluate the association between
ACT exposure during pregnancy and LBW and SGA among the offspring of pregnant women.
Objective The primary objective of this study was to determine the association between exposure to ACT during
the first trimester of pregnancy and LBW and the occurrence of SGA by comparing women exposed to
ACT versus quinine and to no antimalarials during pregnancy. In addition, this study assessed the risk of
LBW associated with ACT exposure during the first trimester versus later gestational ACT exposure.

3
Methods
Study design ASAP was a multi-centered prospective cohort study of pregnant women, conducted in three SSA sites
associated with the Malaria in Pregnancy Consortium (MiPc). The sites were located in Asembo-Siaya
County, Kenya; Nanoro, Burkina Faso; and Manhiça District, Mozambique. In all three sites Plasmodium
falciparum is the main malaria etiologic agent with high transmission rates. While Nanoro and Manhiça
have a clear seasonal transmission pattern increasing during the rainy season, Asembo has year-round
transmission19.
All three ASAP sites have health and demographic surveillance system (HDSS) platforms and are active
members of the International Network of field sites with continuous demographic Evaluation of
Populations and Their Health (INDEPTH) in developing countries21-24. Within their defined communities,
HDSS sites ensure recording of all vital status (births, deaths, migration) and other demographic events
such pregnancy through full enumeration of residences and its members during twice a year household
visits and the use of community key informants24. The ASAP cohort study was designed to leverage this
platform. Additional recruitment and data collection strategies were employed for the ASAP study to
identify pregnancies, antimalarial exposures, determine gestational age at the time of exposure to
antimalarials, monitor pregnancy outcomes, and systematically assess infant outcomes19. The emphasis
was placed on identifying first-trimester pregnancy exposures to antimalarials through identifying and
recruiting women as early as possible in pregnancy.
ASAP data collection procedures
Enrollment into the Study Pregnant women were identified through household visits, community key informants, and at antenatal
care visits in a health facility within the HDSS area. Only women who planned to remain in the study
area through delivery and who were willing and able to provide informed consent were enrolled in the
study. Exclusion criteria common across all study sites were refusal to participate or to be followed up

4
through the end of pregnancy, or any condition that would interfere with the ability to provide informed
consent or provide an accurate medical history. In Mozambique and Burkina Faso, pregnant women
were identified within the HDSS through repeated household visits. In addition, field workers visited
village reporters on weekly basis to learn about any pregnancies identified in their community. All
identified pregnant women were invited to the antenatal care (ANC) and assessed for eligibility. Baseline
information was then collected and the data entered into a pregnancy register. In addition, electronic
records from outpatient and inpatient visits were recorded through the HDSS platform and linked to the
study records to identify possible exposure to ACTs during the first trimester of the pregnancy.
In Kenya, in addition to the above HDSS procedures, recruitment was broadened to include
identification of women of childbearing age who were participating in the population-based infectious
disease surveillance (PBIDS) in order to detect pregnancies as early as possible through this additional
community based strategy.
Data collection procedures At enrollment, each site collected demographic data, information on possible risk factors and potential
confounding factors via a detailed questionnaire administered to enrolled participants at first ANC visit,
at antenatal follow-up visits and at the end of pregnancy. Drug exposure ascertainment was based on a
combination of retrospective patient self-report, health facility treatment records, inpatient and
outpatient visit databases and prospective self-report. For pregnancy outcomes ascertainment, health
facility assessments and home base assessment were used. To ensure standardization across sites,
nurses and/or midwives were trained on assessment of drug exposure, gestational age assessment using
a portable ultrasound scans, and newborn examination. To promote and improve adherence to
protocol, community engagement activities were regularly conducted.

5
Ascertainment of Antimalarial Drug Exposures
The ascertainment of drug exposure included prospective and retrospective self-report and linkage to
treatment records at local health facilities, drug prescribing and dispensing clinics. “Possible” ACT
exposure was defined as exposure identified in only one data source and “confirmed” ACT exposure as
exposures identified in 2+ data sources.
Drug identification – Before study initiation an assessment of antimalarials available in the study areas
was conducted and country-specific visual aids and pictorial keys were prepared to assist with recall
during the data collection interviews. Study staff reviewed participant’s drug packages, tablets and
prescriptions when available. They also reviewed and abstracted prescribing information from ANC
cards and/or patient hospital files, where available. Data collected included timing of exposure,
medication name, dose, and treatment duration.
Self-Reported Drug Exposure – Each study participant was asked about current and previous pregnancy
exposure to antimalarials during the baseline interview. This evaluation was conducted post-
ascertainment of pregnancy status at first antenatal consultation and repeated at each follow-up
antenatal visits. In Kenya, the PBIDS program allowed prospectively collected data on drug exposure and
morbidity on a weekly and then bi-weekly basis. The timing of drug exposures was determined by using
estimated gestational age 19.
Health Facility Records Drug Exposures – Record linkages techniques were used to match pregnant
women as recorded in the health facility log-books to the morbidity surveillance database and
outpatient department record. This was conducted to ascertain drugs dispensed at the health facilities
located within the study catchment areas.
Gestational Age Assessment and Classification
Ascertainment of gestational age is critical for correct exposure classification. Multiple methods were
used, including date of last menstrual period, Ballard Score, fundal height and ultrasound as explained

6
elsewhere19. Study staff were trained on newborn examination, Ballard Score assessment, fundal height
measurements, and use of ultrasound scans to date the pregnancy. Quality control of these procedures
consisted on immediate feedback during training, supervising visits and assessment of a sample of
ultrasound scans by a consulting radiologist at University of Washington who provided feedback to the
midwives. Fundal height was assessed at every antenatal visit. On the first antenatal visit ultrasound
scans were performed whenever possible.
For this analysis we define embryo-sensitive period (ESP) as gestational age between 6 and 12 weeks
post last menstrual period, which is equivalent to between 4 and 10 weeks post-conception.
Pregnancy Outcomes Assessment
The ASAP protocol included several pregnancy outcomes of interest namely miscarriages, fetal
deaths/stillbirths, low birthweight, small for gestational age, and live births. The present analysis is
restricted to birthweight and gestational age. Women were encouraged to deliver at closest health
facility where systems were in place to identify and link records. Also, deliveries occurring outside the
health facility where actively identified by close monitoring lists of probable delivery and home-based
visits or by notification from village recorders whereby a study staff team assessed at home cases as
soon as possible. In addition, traditional birth attendants (TBAs) were instructed to alert study staff of
the occurrence of any pregnancy outcome, including miscarriage, stillbirth or live birth.
Inclusion criteria for the analysis For purposes of this study of LBW and SGA we included live-born infants of women enrolled in the ASAP
study who had her exposure status ascertained during pregnancy and birth weight collected within the
first 10 days of life of her offspring.
Outcomes The primary outcome for the analysis was low birthweight (LBW), defined as weight at birth below
2500g regardless gestational age 12. As a secondary outcome, we evaluated small for gestational age

7
(SGA) defined by weight at birth below 10th percentile of weight for the gestational age according to
international reference curves 17,25. Weight at birth was measured in grams.
Study groups We identified exposure groups based upon the type and timing of antimalarial drug exposure. These
were: a) not-exposed to any antimalarial with or without exposed IPTp-SP; b) exposed to ACT during the
first trimester of pregnancy (early ACT exposure); c) exposed to ACT during the second or third trimester
of pregnancy (later ACT exposure); and d) exposed to another antimalarial with or without IPTp-SP in
first trimester.
For evaluating the association of early pregnancy exposure to ACT and LBW or SGA, the early ACT
exposure group was compared to the non-ACT exposed group. A secondary comparison was early ACT
exposure compared to exposure to an ACT during the second or third trimester.
Potential covariates Covariates considered for adjustment in the analyses were level of maternal education, mother’s age at
recruitment, marital status, gravidity, HIV serological status and study site.
Data sources Each site submitted its patient-level study data along with database documentation. The datasets were
merged and used for this analysis.
Bias and control measures
Confounding
Clinical malaria is a potential confounding for the association between ACT exposure and LBW. Pregnant
women who present with clinical malaria tend to receive an antimalarial other than IPTp-SP. Also,
malaria is associated with LBW occurrence. To address this bias, for the main comparison (association of
ACT exposure and LBW or secondary outcomes) we first compared ACT exposed women to women
without other antimalarial other than IPTp-SP, then we compare ACT exposed to non-ACT antimalarial
8
exposed women. With the same concern for the second comparison (association of earlier ACT exposure
and LBW or secondary outcomes) we restricted the comparison to women who received an antimalarial
other than IPTp-SP.
We adjusted for the mother’s age and gravidity. No other potential covariate was used in the
multivariate analyses because of sparse data. For example, no exposure to quinine during pregnancy
was observed in Asembo. The between-sites comparison of the baseline data showed important
heterogeneity. Thus a multilevel approach was chosen to address such heterogeneity.
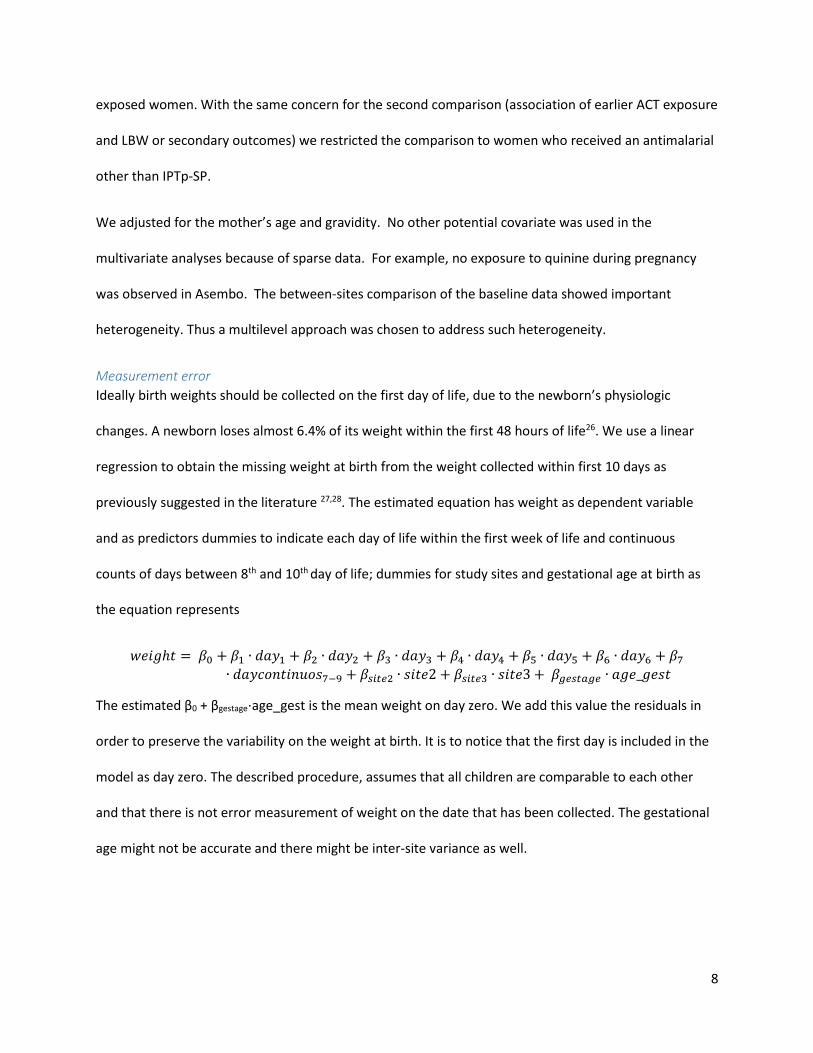
Measurement error
Ideally birth weights should be collected on the first day of life, due to the newborn’s physiologic
changes. A newborn loses almost 6.4% of its weight within the first 48 hours of life26. We use a linear
regression to obtain the missing weight at birth from the weight collected within first 10 days as
previously suggested in the literature 27,28. The estimated equation has weight as dependent variable
and as predictors dummies to indicate each day of life within the first week of life and continuous
counts of days between 8th and 10th day of life; dummies for study sites and gestational age at birth as
the equation represents
𝑤𝑒𝑖𝑔ℎ𝑡 = 𝛽0 + 𝛽1 ∙ 𝑑𝑎𝑦1 + 𝛽2 ∙ 𝑑𝑎𝑦2 + 𝛽3 ∙ 𝑑𝑎𝑦3 + 𝛽4 ∙ 𝑑𝑎𝑦4 + 𝛽5 ∙ 𝑑𝑎𝑦5 + 𝛽6 ∙ 𝑑𝑎𝑦6 + 𝛽7
∙ 𝑑𝑎𝑦𝑐𝑜𝑛𝑡𝑖𝑛𝑢𝑜𝑠7−9 + 𝛽𝑠𝑖𝑡𝑒2 ∙ 𝑠𝑖𝑡𝑒2 + 𝛽𝑠𝑖𝑡𝑒3 ∙ 𝑠𝑖𝑡𝑒3 + 𝛽𝑔𝑒𝑠𝑡𝑎𝑔𝑒 ∙ 𝑎𝑔𝑒_𝑔𝑒𝑠𝑡
The estimated β0 + βgestage⋅age_gest is the mean weight on day zero. We add this value the residuals in
order to preserve the variability on the weight at birth. It is to notice that the first day is included in the
model as day zero. The described procedure, assumes that all children are comparable to each other
and that there is not error measurement of weight on the date that has been collected. The gestational
age might not be accurate and there might be inter-site variance as well.

9
Statistical methods
Baseline characteristics of different comparison groups Counts and proportions were employed for categorical variables, continuous arithmetic means,
standard deviations, and quartiles. Baseline data were compared by site to assess heterogeneity among
sites and by antimalarial exposure to evaluate imbalance of covariates. One-way ANOVA is used to
compare means and Fisher’s exact chi-squared are used to compare the distribution of frequencies.
Prevalence of low birth weight and of small for gestational age analysis The prevalence of LBW was computed among groups of comparison. As the measure of association we
used prevalence-ratio (PR). The PR is computed through two steps. First a random intercepts logistic
regression is fitted; and secondly the fitted proportions are used to compute the prevalence ratio as
explained elsewhere29. Briefly the fitted models have the form:
logit(𝐿𝐵𝑊_𝑝𝑟𝑒𝑣𝑎𝑙𝑒𝑛𝑐𝑒) = 𝛽𝑠 + 𝛽1 ∙ 𝑒𝑥𝑝𝑜𝑠𝑢𝑟𝑒𝐴𝐶𝑇 + 𝛽1 ∙ 𝑒𝑥𝑝𝑜𝑠𝑢𝑟𝑒𝑄𝑁𝑁 + 𝛽𝑗 ∙ 𝑐𝑜𝑣𝑎𝑟𝑖𝑎𝑡𝑒𝑠 + 𝜀
𝛽𝑠 = 𝛽0 + 𝜂𝑠
The dependent variable is the dummy indicating low birth weight (or small for gestational age)1; the
predictors of interest are included as the dummies for ACT and QNN exposure; other covariates may
also be included in the model. The subscripts on the intercept is to indicate different intercepts on
different sites due to some specific site influence η (from a normal distribution); ε represents some
random error due to measurement error. The same regression equations are used to compute
unadjusted and adjusted pooled prevalences. We also report the 95% confidence intervals (95%CI) of
the estimates.
Mean weight and mean gestational age at birth As measure of association we use mean difference. We use a mixed linear model with random
intercepts defined by the site. This regression has the form:
1 These are 2 different regressions.

10
𝑏𝑖𝑟𝑡ℎ𝑤𝑒𝑖𝑔ℎ𝑡 = 𝛽𝑠 + 𝛽1 ∙ 𝑒𝑥𝑝𝑜𝑠𝑢𝑟𝑒𝐴𝐶𝑇 + 𝛽1 ∙ 𝑒𝑥𝑝𝑜𝑠𝑢𝑟𝑒𝑄𝑁𝑁 + 𝛽𝑗 ∙ 𝑐𝑜𝑣𝑎𝑟𝑖𝑎𝑡𝑒𝑠 + 𝜀
𝛽𝑠 = 𝛽0 + 𝜂𝑠
The dependent variable is birthweight; the predictors of interest are included as the dummies for ACT
and QNN exposure; other covariates may also be included in the model. The subscripts on the intercept
is to indicate different intercepts on different sites due to some specific site influence η (from a normal
distribution); ε represents some random error due to measurement error (from a normal distribution).
The effects are the β’s. The same regression equations are used to compute unadjusted and adjusted
pooled means and its 95%CI.
Software All analysis was performed on Stata 14 (StataCorp. 2015. Stata: Release 14. Statistical Software. College
Station, TX: StataCorp LP).
Ethical Approval All study sites and the University of Washington had institutional ethical review approvals and the study
sites obtained informed consent from all participants.
11
Results From the total of 2930 women recruited into the main ASAP study, 381 women were not included in the
analysis due to lack of baseline information and 338 women were excluded due to lack of a recorded
birth weight. Thus 2134 (72.8%) of pregnancies that ended in a live born infant are included in the
analysis (Figure 1 and Table 1). There were 1872 non-exposed women, 236 exposed to ACT and 26 to
quinine. A total of 204 cases of LBW were initially counted. However, post-correction due to the effect
of first days of life on birthweight, resulted in an extra 32 cases identified and 1 case became normal
weight at birth resulting in a total of 235 cases of LBW included in the analysis.
Baseline characteristics There were important inter-site differences among study participants. Although there were some
statistically significant differences between study sites, age at recruitment was similar with mean of 25.7
(SD 6.61) years and ranging from 12 to 49 years (Table 2). There were different levels of illiteracy ranging
from 92.1% in Nanoro, 45.1% in Asembo, and 14.5% Manhiça. Almost (98.7%) all women in Nanoro
were married or lived in married union whereas in Asembo and Manhiça these values were 78.3% and
63.9%, respectively. A total of 21.9% of women were pregnant for the first time. Women were recruited
at an average of 20.8 (SD 8.38) weeks of gestation. Asembo had a considerable (35.4%) percentage of
women recruited in the first trimester of pregnancy compared to less than 10% in Nanoro and Manhiça.
No woman in Nanoro was reported to be HIV positive whereas in Asembo and Manhiça 21.6% and
24.3% of women were HIV positive, respectively.
No quinine exposures during pregnancy were identified in Asembo (Table 3). Important differences on
distribution of exposure groups were present (p-value=0.031). The age at recruitment was similar
among different exposure groups. Women exposed to ACT or quinine had 5 weeks lower mean
gestation age at recruitment compared to the non-exposed group, with 44.5% of those exposed to ACT
12
identified in first trimester of pregnancy. Also, there tended to be more women who were HIV positive
among those exposed to quinine in the first trimester.
Mean weight at birth The mean weight at birth in grams was 2871.1, 3093.9 and 3080.2 in Nanoro (Burkina Faso), Manhiça
(Mozambique) and Asembo (Kenya), respectively. These mean values are below the standard defined
weight as 3500g. Although non-statistically significant, infants born to women exposed to quinine
during the first trimester weighed 108.9 g (95%CI: -89.1 – 306.9g) less than infants not exposed to
quinine. Similarly, babies exposed (confirmed or possible) to quinine during first trimester of pregnancy
weighted 29.3g (95% CI: -100.2 – 41.6g) more than non-exposed to no antimalarial (Table 4).
Prevalence of LBW The pooled prevalence of LBW was 21.0%, 11.3% and 10.2% among confirmed quinine, artemisinin and
antimalarials non-exposure, respectively. These prevalence values were not statistically different by
exposure group and did not change materially after adjustment for age at recruitment, gravidity and HIV
status (Table 5). Moreover, first trimester exposure to ACTs had a non-significant 21% (95%CI: -7 – 49%)
relatively less occurrence of LBW when compared to exposure to ACTs in the second or third trimester.
Prevalence of SGA We found no association between first trimester exposure to ACT and occurrence of SGA (Table 6). The
quinine confirmed exposed group during first trimester of pregnancy had non-significant 22% (95%CI: -
74 – 119%) relatively higher occurrence of SGA than non-exposed and non-significant 32% (95%CI: -86 –
149%) relatively higher compared to the artemisinin group. These associations become stronger but still
not statistical significance when restricting the exposure to the embryo sensitive period.

13
Discussion We leveraged the use of the HDSS platform to determine the occurrence of LBW and SGA among
women exposed to artemisinin therapy or quinine during pregnancy. Results from this analysis indicate
no evidence of an increased risk of LBW (PR: 1.01; 95%CI: 0.45 – 1.57) or SGA (PR: 0.93; 95%CI: 0.50 –
1.36) among infants born to women with confirmed first trimester exposure to artemisinin treatment
compared to babies born to women unexposed to antimalarials. Quinine exposure during the embryo-
sensitive period was associated with a non-statistically significant level of prevalence of LBW (PR: 1.89;
95%CI: 0.47 – 3.13) when compared to unexposed pregnancies.
The prevalence of LBW in Manhiça and Kenya (6.1% and 11.0% respectively) in our study was lower than
what national community surveys (14.1% and 7.6% respectively) have reported 30,31. However, these
two sites are relatively underrepresented within the national sample frames. Additionally, many
interventions contributing to reduction of LBW have been strengthened since these national surveys
were conducted, such as increase of antenatal coverages that detects earlier pregnancies and malaria
prevention, e.g., high coverage IPTp and intra-domiciliary bed net use programs. Thus our findings may
be a reflection of the contribution of such interventions.
The prevalence of SGA found in this study varied between 15.3% among infants born to women non-
exposed to antimalarials during pregnancy to 23.9% among infants born to women exposed to quinine
during pregnancy. These estimates are consistent with recent estimates of SGA based on 22 birth cohort
studies from the SGA-Preterm Birth working group32.
More than half of the women had their first antenatal visit during the second trimester of the
pregnancy. This finding is very similar to DHS reports30,31. However, Asembo is an exception given that at
least a third of the recruited women had the first antenatal visit in first trimester. This could have played

14
a role on earlier use of IPTp-SP which could have reduced the occurrence of malaria and thus less need
of quinine or an ACT at this site.
HDSS procedures mandate frequent visits to a household. This increases the likelihood of detecting
early pregnancies and facilitates follow-up of pregnancy outcomes. Nevertheless, cultural barriers7 still
pose challenges to the field workers to identify not yet visible pregnancies as almost half of the
pregnancies were detected during second semester.
Limitations We included in the analysis only pregnancies ending as singleton live-birth and with birth weight
collected within 10 days of life. This could lead to bias because the small gestation for age (the outcome)
is associated with less probability to survival. Thus the inclusion in the data analysis is conditioning on
the outcome. However, we do not expect this to be an important source of bias because the neonatal
mortality rate in these sites is small (less than 30 per 1000 live-births).
Compared to other study sites, Asembo (Kenya) had higher proportion of missing information of weight
at birth variable, representing 12% of all pregnancies recruited (figure 1). The vast majority of these
missing birth weights are among babies born at home, at which no evaluation on birth day was possible.
We used an imputation technique to address this problem. The employed imputation assumes that all
babies in one site are similar regardless of potential unmeasured biological differences (gender, mother
anthropometrics). This may have contributed to lower prevalence of LBW because babies who died due
to conditions linked to LBW didn’t get their weights recorded and thus they do not contribute on the
imputation. However, we do not expect this bias to have contributed much on the overall direction of
the association.

15
In Nanoro all women were HIV negative according to the database documentation. The HIV prevalence
in Nanoro is very small and our findings are likely to be correct. However, we do not rule out the
possibility of poor documentation of HIV status.
Conclusions We found no evidence of an increased risk of LGW or SGA among infants born to women with confirmed
first trimester exposure to an ACT. Our findings add to the support for use of ACT for uncomplicated
Plasmodium falciparum malaria during the first trimester of pregnancy. The existence of the HDSS
platform greatly facilitated active surveillance pregnancy pharmacovigilance.
16
References 1. WHO. Guidelines for the Treatment of Malaria - 3rd edition. 3rd ed2015. 2. Chen LJ, Wang MY, Sun WK, Liu MZ. [Embryotoxicity and teratogenicity studies on artemether in mice, rats and rabbits]. Zhongguo Yao Li Xue Bao 1984;5:118-22. 3. Clark RL. Embryotoxicity of the artemisinin antimalarials and potential consequences for use in women in the first trimester. Reprod Toxicol 2009;28:285-96. 4. Clark RL, Arima A, Makori N, et al. Artesunate: developmental toxicity and toxicokinetics in monkeys. Birth Defects Res B Dev Reprod Toxicol 2008;83:418-34. 5. White TE, Clark RL. Sensitive periods for developmental toxicity of orally administered artesunate in the rat. Birth Defects Res B Dev Reprod Toxicol 2008;83:407-17. 6. Longo M, Zanoncelli S, Torre PD, et al. In vivo and in vitro investigations of the effects of the antimalarial drug dihydroartemisinin (DHA) on rat embryos. Reprod Toxicol 2006;22:797-810. 7. Manyando C, Mkandawire R, Puma L, et al. Safety of artemether-lumefantrine in pregnant women with malaria: results of a prospective cohort study in Zambia. Malar J 2010;9:249. 8. van Eijk AM, Hill J, Noor AM, Snow RW, Ter Kuile FO. Prevalence of malaria infection in pregnant women compared with children for tracking malaria transmission in sub-Saharan Africa: a systematic review and meta-analysis. Lancet Glob Health 2015. 9. Desai M, ter Kuile FO, Nosten F, et al. Epidemiology and burden of malaria in pregnancy. Lancet Infect Dis 2007;7:93-104. 10. WHO. A strategic framework for malaria prevention and control during pregnancy in the African region. Geneva: World Health Organization; 2004. 11. van Eijk AM, Ayisi JG, ter Kuile FO, et al. Effectiveness of intermittent preventive treatment with sulphadoxine-pyrimethamine for control of malaria in pregnancy in western Kenya: a hospital-based study. Trop Med Int Health 2004;9:351-60. 12. Kramer MS. Determinants of low birth weight: methodological assessment and meta-analysis. Bull World Health Organ 1987;65:663-737. 13. Wardlaw T, Blanc A, Zupan J, Ahman E. Low birthweight: country, regional and global estimates. New York: UNICEF; 2004. 14. Guyatt HL, Snow RW. Malaria in pregnancy as an indirect cause of infant mortality in sub-Saharan Africa. Trans R Soc Trop Med Hyg 2001;95:569-76. 15. Guyatt HL, Snow RW. Impact of malaria during pregnancy on low birth weight in sub-Saharan Africa. Clin Microbiol Rev 2004;17:760-9, table of contents. 16. Adams MM, Alexander GR, Kirby RS, Wingate MS. Perinatal Epidemiology for Public Health Practice: Springer; 2009. 17. Wilcox AJ. On the importance--and the unimportance--of birthweight. Int J Epidemiol 2001;30:1233-41. 18. Dellicour S, ter Kuile FO, Stergachis A. Pregnancy Exposure Registries for Assessing Antimalarial Drug Safety in Pregnancy in Malaria- Endemic Countries (Health in Action). PLoS Medicine 2008;5:e187. 19. Tinto H, Sevene E, Dellicour S, et al. Assessment of the safety of antimalarial drug use during early pregnancy (ASAP): protocol for a multicenter prospective cohort study in Burkina Faso, Kenya and Mozambique. Reprod Health 2015;12:112. 20. Dellicour S, Desai M, Aol G, et al. Risks of miscarriage and inadvertent exposure to artemisinin derivatives in the first trimester of pregnancy: a prospective cohort study in western Kenya. Malar J 2015;14:461. 21. Sacoor C, Nhacolo A, Nhalungo D, et al. Profile: Manhiça Health Research Centre (Manhiça HDSS). Int J Epidemiol 2013;42:1309-18. 22. Odhiambo FO, Laserson KF, Sewe M, et al. Profile: the KEMRI/CDC Health and Demographic Surveillance System--Western Kenya. Int J Epidemiol 2012;41:977-87. 23. Derra K, Rouamba E, Kazienga A, et al. Profile: Nanoro Health and Demographic Surveillance System. Int J Epidemiol 2012;41:1293-301. 24. Ye Y, Wamukoya M, Ezeh A, Emina JB, Sankoh O. Health and demographic surveillance systems: a step towards full civil registration and vital statistics system in sub-Sahara Africa? BMC Public Health 2012;12:741.
17
25. Villar J, Cheikh Ismail L, Victora CG, et al. International standards for newborn weight, length, and head circumference by gestational age and sex: the Newborn Cross-Sectional Study of the INTERGROWTH-21st Project. Lancet 2014;384:857-68. 26. Flaherman VJ, Schaefer EW, Kuzniewicz MW, Li SX, Walsh EM, Paul IM. Early weight loss nomograms for exclusively breastfed newborns. Pediatrics 2015;135:e16-23. 27. Greenwood AM, Armstrong JR, Byass P, Snow RW, Greenwood BM. Malaria chemoprophylaxis, birth weight and child survival. Trans R Soc Trop Med Hyg 1992;86:483-5. 28. González R, Desai M, Macete E, et al. Intermittent preventive treatment of malaria in pregnancy with mefloquine in HIV-infected women receiving cotrimoxazole prophylaxis: a multicenter randomized placebo-controlled trial. PLoS Med 2014;11:e1001735. 29. Kleinman LC, Norton EC. What's the Risk? A simple approach for estimating adjusted risk measures from nonlinear models including logistic regression. Health Serv Res 2009;44:288-302. 30. Kenya National Bureau of Statistics, Ministry of Health/Kenya, National AIDS Control Council/Kenya, Kenya Medical Research Institute, Population NCf, Development/Kenya. Kenya Demographic and Health Survey 2014. Rockville, MD, USA2015. at http://dhsprogram.com/pubs/pdf/FR308/FR308.pdf.) 31. Ministerio da Saude - MISAU/Moçambique, Instituto Nacional de Estatística - INE/Moçambique, ICF International. Moçambique Inquérito Demográfico e de Saúde 2011. Calverton, Maryland, USA: MISA/Moçambique, INE/Moçambique and ICF International; 2013. at http://dhsprogram.com/pubs/pdf/FR266/FR266.pdf.) 32. Lee ACC, Katz J, Blencowe H, et al. National and regional estimates of term and preterm babies born small for gestational age in 138 low-income and middle-income countries in 2010. The Lancet Global Health;1:e26-e36.

18
Tables Table 1 – Detailed data processing steps from the total pregnancy recorded to final sample included in the analysis, ASAP cohort, 2015
LBW – low birth weight; GA – gestational age
Asembo Manhiça Nanoro Total
Total pregnancy records 1453 763 714 2930
↓ ↓ ↓ ↓
↓ ↓ ↓ ↓
Step 1 Removed because of no baseline data 314 49 18 381
Out migration
Withdrawl or refused follow-up
Maternal death
Detected at outcome
Entered after 28 weeks
No GA information
Preganancy end date error
No follow-up
↓ ↓ ↓ ↓
↓ ↓ ↓ ↓
Step 2 Removed due to 144 40 28 212
Twins 14 0 14 28
Weight at birth missing 81 40 14 135
More than 1 pregnancy follow up 49 0 0 49
↓ ↓ ↓ ↓
↓ ↓ ↓ ↓
Step 3
Removed because of no weight collected after
10th day of life202 0 1 203
↓ ↓ ↓ ↓
↓ ↓ ↓ ↓
Step 4 Records included in the Analysis 793 674 667 2134
LBW cases 87 41 107 235
19
Table 2 - Baseline characteristics of pregnancies included for low birth weight analysis per study site, ASAP cohort, 2015
SD – standard deviation; Except for the means all p-values are computed through Fisher’s exact chi-squared test.
For the means are computed from one-way ANOVA.
Characteristic N % N % N % N %
N participants 793 674 667 2134
Age at recruitment (years)
Range
Mean (SD) < 0.001
Education < 0.001
Never went to school or primary incomplete 358 45.1 98 14.5 614 92.1 1070 50.1
Primary completed 374 47.2 331 49.1 52 7.8 757 35.5
Secondary completed 61 7.7 245 36.4 1 0.1 307 14.4
Marital Status < 0.001
Married or living together 621 78.3 431 63.9 658 98.7 1710 80.1
Not married 172 21.7 243 36.1 9 1.3 424 19.9
Gravidity < 0.001
Primigravida 167 21.1 185 27.4 116 17.4 468 21.9
1-3 pregnancies 382 48.2 396 58.8 313 46.9 1091 51.1
4 or more pregnancies 244 30.8 93 13.8 238 35.7 575 26.9
Gestational age at recruitment (weeks), mean (SD) < 0.001
Gestational age in categories < 0.001
First trimester 281 35.4 29 4.3 45 6.7 355 16.6
Second timester 263 33.2 418 62.0 294 44.1 975 45.7
Third trimester 249 31.4 227 33.7 328 49.2 804 37.7
HIV status < 0.001
Positive 171 21.6 164 24.3 0 0.0 335 15.7
Negative 583 73.5 447 66.3 648 97.2 1678 78.6
No information 39 4.9 63 9.3 19 2.8 121 5.7
18.5 (10.54) 21.2 (5.65) 23.2 (6.94) 20.8 (8.38)
Asembo Manhiça Nanoro Total
15 - 48
25.8 (6.65)
12.4 - 41.9
24.2 (6.24)
15 - 49
27.0 (6.63)
12.4 - 49.0
25.7 (6.61)
p-value

20
Table 3 - Baseline characteristics by exposure level (no exposure, possible or confirmed), ASAP cohort, 2015
No exposure Possible or confirmed exposure Confirmed exposure Confirmed exposure
Artemisinins Quinine p-value Artemisinins Quinine
p-value
Artemisinins Quinine p-
value
Characteristic N % N % N % N % N % N % N % N %
N participants 2134 100.0 1872 100.0 236 100.0 26 100.0 103 100.0 26 100.0 133 100.0 0
Site 0.031 < 0.001 < 0.001
Nanoro 667 31.3 608 32.5 37 15.7 22 84.6 37 35.9 22 84.6 0 0.0 0
Manhiça 674 31.6 648 34.6 22 9.3 4 15.4 19 18.4 4 15.4 3 2.3 0
Asembo 793 37.2 616 32.9 177 75.0 0 0.0 47 45.6 0 0.0 130 97.7 0
Age at recruitment (years)
Range 12.4 - 49.0 12.4 - 49.0 15.0 - 46.0 17 - 36 15.0 - 45.0 17 - 36 15.0 - 46.0 -
Mean (SD) 25.7 (6.61) 25.6 (6.58) 26.1 (6.91) 24.7 (6.05) 0.468 25.7 (6.71) 24.7 (6.05) 0.708 26.3 (7.07) - 0.288
Education 0.031 0.380 0.013 Never went to school or
primary incomplete 1070 50.1 943 50.4 109 46.2 18 69.2 50 48.5 18 69.2 59 44.4 0
Primary completed 757 35.5 650 34.7 101 42.8 6 23.1 39 37.9 6 23.1 62 46.6 0
Secondary completed 307 14.4 279 14.9 26 11.0 2 7.7 14 13.6 2 7.7 12 9.0 0
Marital Status 0.035 0.037 0.355
Married or living together 1710 80.1 1498 80.0 186 78.8 26 100.0 84 81.6 26 100.0 102 76.7 0
Not married 424 19.9 374 20.0 50 21.2 0 0.0 19 18.4 0 0.0 31 23.3 0
Gravidity 0.428 0.719 0.351
Primigravida 468 21.9 406 21.7 54 22.9 8 30.8 24 23.3 8 30.8 30 22.6 0
1-3 pregnancies 1091 51.1 970 51.8 110 46.6 11 42.3 49 47.6 11 42.3 61 45.9 0
4 or more pregnancies 575 26.9 496 26.5 72 30.5 7 26.9 30 29.1 7 26.9 42 31.6 0

21
Gestational age at recruitment (weeks), mean (SD) 20.8 (8.38) 21.5 (8.00) 16.0 (9.87) 16.8 (5.56) < 0.001 16.6 (9.24) 16.8 (5.56) < 0.001 17.1 (10.24) - < 0.001
Gestational age in categories < 0.001 < 0.001 < 0.001
First trimester 355 16.6 245 13.1 105 44.5 5 19.2 50 48.5 5 19.2 55 41.4 0
Second trimester 975 45.7 878 46.9 78 33.1 19 73.1 37 35.9 19 73.1 41 30.8 0
Third trimester 804 37.7 749 40.0 53 22.5 2 7.7 16 15.5 2 7.7 37 27.8 0
HIV status 0.279 0.446 0.067
Positive 1678 78.6 1,478 79.0 177 75.0 23 88.5 81 78.6 23 88.5 96 72.2 0
Negative 335 15.7 289 15.4 45 19.1 1 3.8 14 13.6 1 3.8 31 23.3 0
No information 121 5.7 105 5.6 14 5.9 2 7.7 8 7.8 2 7.7 6 4.5 0

22
Table 4 - Mean birthweight in grams, by exposure status and study site, ASAP cohort, 2015
Pooled Mean Weight at Birth
Pooled mean difference Unadjusted
Mean difference
Characteristic 95% CI 95% CI 95% CI
Site
Nanoro (Burquina Faso) 2871.1 2838.2 - 2904.0
Manhiça (Mozambique) 3093.9 3061.6 - 3126.1
Asembo (Kenya) 3080.2 3036.9 - 3123.6
Confirmed or possible Exposure
No exposure 3015.4 2991.8 - 3038.9 0.0 - 0.0 Artemesinin 3062.0 2995.7 - 3128.3 46.6 -23.8 - 116.9 29.3 -41.6 - 100.2
Quinine 2902.6 2702.9 - 3102.4 -112.7 -313.9 - 88.4 -108.9 -306.9 - 89.1
Confirmed Exposure
No exposure 3015.4 2991.8 - 3038.9 0.0 - 0.0 Artemesinin confirmed 3014.0 2912.8 - 3115.2 -1.4 -105.3 - 102.5 -20.1 -124.3 - 84.1
Quinine confirmed 2902.6 2701.3 - 3104.0 -112.7 -315.5 - 90.0 -107.9 -307.8 - 92.0
Confirmed ESP Exposure
No exposure 3015.4 2991.8 - 3038.9 0.0 - 0.0 Artemesinin confirmed 3043.7 2924.0 - 3163.5 28.4 -93.8 - 150.5 23.0 -98.7 - 144.6
Quinine confirmed 3002.1 2744.5 - 3259.7 -13.3 -272.0 - 245.4 -39.4 -294.5 - 215.7
Confirmed earlier versus later ACT Exposure
Earlier 3043.7 2940.3 - 3147.2 105.6 -89.3 - 300.6 152.7 -43.0 - 348.4
Later 2938.1 2772.9 - 3103.4 0.0 - 1.00 -
All weights from 2134 newborns are included in the analysis post imputation.

23
Table 5 - LBW prevalence and prevalence rate ratio, per exposure level, ASAP cohort, 2015
The unadjusted pooled prevalences are fitted values from a random-intercepts logistic regression with low birth weight as the
dependent variable and site as predictor. For the adjusted pooled prevalence age of the mother, gestational age and gravidity
are added on the regression. The prevalence rate-ratio are division of the fitted prevalence on the random intercept at the
median.
ESP – Embryo Sensitive Period
Characteristic N cases % 95% CI % 95% CI PRR 95% CI PRR 95% CI
Confirmed Exposure
No exposure 1872 201 10.2 5.7 - 14.7 10.3 5.2 - 15.3 1.00 1.00
Artemesinin confirmed 103 13 11.2 3.7 - 18.6 10.4 4.1 - 16.6 1.09 0.50 - 1.68 1.01 0.45 - 1.57
Quinine confirmed 26 7 21.0 4.4 - 37.6 18.5 4.7 - 32.3 2.05 0.59 - 3.51 1.80 0.47 - 3.13
Confirmed ESP Exposure
No exposure 1872 201 10.2 5.7 - 14.7 10.3 5.2 - 15.3 1.00 1.00
Artemesinin confirmed 74 9 11.3 2.8 - 19.7 10.0 5.4 - 14.7 1.10 0.40 - 1.80 0.98 0.34 - 1.62
Quinine confirmed 16 4 20.6 0.2 - 40.9 19.5 3.1 - 38.7 2.01 0.15 - 3.87 1.89 0.12 - 3.67
Confirmed earlier versus later ACT Exposure
Earlier (First trimester) 74 9 12.2 4.7 - 19.6 11.8 11.4 - 12.2 0.88 0.29 - 2.64 0.79 0.27 - 2.35
Later (Second or third trimester) 29 4 13.8 1.2 - 26.3 14.9 10.1 - 19.7 1.00 - 1.00 -
CountsPooled Prevalence (%)
Adjusted
Prevalence Rate-Ratio
Unadjusted
Pooled Prevalence (%)
Unadjusted
Prevalence Rate Ratio
Adjusted
24
Table 6 – Small for gestation age prevalence, per exposure level, ASAP cohort, 2015
The unadjusted pooled prevalences are fitted values from a random-intercepts logistic regression with low birth weight as the
dependent variable and site as predictor. For the adjusted pooled prevalence age of the mother, gestational age and gravidity
are added on the regression. The prevalence rate-ratio are division of the fitted prevalence on the random intercept at the
median.
ESP – Embryo Sensitive Period
Characteristic N cases % 95% CI % 95% CI PRR 95% CI PRR 95% CI
Confirmed Exposure
No exposure 1821 307 15.3 8.0 - 27.4 14.8 7.4 - 27.7 1.00 1.00
Artemesinin confirmed 100 19 14.7 6.6 - 30.0 13.9 6.0 - 29.1 0.96 0.53 - 1.39 0.93 0.50 - 1.36
Quinine confirmed 26 6 20.7 7.4 - 46.0 18.2 6.1 - 43.2 1.36 0.34 - 2.37 1.22 0.26 - 2.19
Confirmed ESP Exposure
No exposure 1821 307 15.3 8.0 - 27.4 14.8 7.4 - 27.7 1.00 1.00
Artemesinin confirmed 71 12 13.7 5.7 - 29.4 12.3 4.9 - 27.7 0.90 0.40 - 1.39 0.83 0.35 - 1.30
Quinine confirmed 16 4 23.9 7.4 - 55.1 23.0 6.8 - 55.0 1.56 0.17 - 2.95 1.54 0.13 - 2.96
Confirmed earlier versus later ACT Exposure
Earlier (First trimester) 71 12 10.8 2.5 - 36.0 7.3 1.4 - 30.1 0.64 0.24- 1.76 0.46 0.14 - 1.47
Later (Second or third trimester) 29 7 16.7 3.5 - 52.6 16.0 3.0 - 53.5 1.00 - 1.00 -
CountsPooled Prevalence (%)
Unadjusted
Pooled Prevalence (%)
Adjusted
Prevalence Rate-Ratio
Unadjusted
Prevalence Rate Ratio
Adjusted

25
Figures
Figure 1 - Flow chart of the recruited participants in ASAP cohort utilized in this analysis, 2015
2930 pregnancies recorded
2134 records included in the analysis
235 LBW cases
381 no baseline data
28 Twins
135 weight at birth missing
49 more than 1 pregnancy follow up
203 birth weight collected after 10th day of life