© Copyright 2014 Jennifer DeHart
54
© Copyright 2014 Jennifer DeHart
Transcript of © Copyright 2014 Jennifer DeHart

© Copyright 2014
Jennifer DeHart


Quadrant distribution of tropical cyclone inner-core kinematics in relation to environmental
shear
Jennifer C. DeHart
A thesis submitted in partial fulfillment of the requirements for the degree of
Master of Science
University of Washington
2014
Reading Committee:
Robert A. Houze, Jr., Chair
Gregory J. Hakim
John M. Wallace
Program Authorized to Offer Degree:
Atmospheric Sciences

University of Washington
ABSTRACT
Quadrant distribution of tropical cyclone inner-core kinematics in relation to environmental
shear
Jennifer C. DeHart
Chair of the Supervisory Committee: Professor Robert A. Houze, Jr.
Department of Atmospheric Sciences
Airborne Doppler radar data collected in tropical cyclones by National Oceanic and
Atmospheric Administration WP-3D aircraft over an eight-year period (2003-2010) is used to
statistically analyze the vertical structure of tropical cyclone eyewalls with reference to the deep
layer shear. Convective evolution within the inner core conforms to patterns shown by previous
studies: convection initiates downshear-right, intensifies downshear-left and weakens upshear.
Analysis of the vertical distribution of radar reflectivity and vertical air motion indicates the
development of upper-level downdrafts in conjunction with strong convection downshear-left
and a maximum in frequency upshear-left. Intense updrafts and downdrafts both conform to the
shear asymmetry pattern. While strong updrafts occur within the eyewall, intense downdrafts
show far more radial variability, particularly in the upshear-left quadrant, though they
concentrate along the eyewall edges. Strong updrafts are collocated with low-level inflow and
upper-level outflow superimposed on the background flow. In contrast, strong downdrafts occur
in association with low-level outflow and upper-level inflow.


i
TABLE OF CONTENTS
Page
List of Figures ………………………………………………………………………… ii List of Tables …………………………………………………………………………. iii Chapter 1: Introduction ………………………………………………………………. 1 Chapter 2: Data and Methodology ……………………………………………………. 5 Chapter 3: Eyewall Statistics …………………………………………………………. 8 Chapter 4: Intense Vertical Velocities ………………………………………………… 20 Chapter 5: Context of the Drafts ……………………………………………………… 25 Chapter 6: Conclusions ……………………………………………………………….. 35 References …………………………………………………………………………….. 40

ii
LIST OF FIGURES
Figure Number Page
1. Contoured frequency by altitude diagram (CFAD) of eyewall radar reflectivity binned every 1 dBZ……………………………………………..
9
2. CFAD of eyewall radar reflectivity binned every 1 dBZ, but separated according to shear quadrant…………………………………………………
10
3. Anomaly CFADS of eyewall reflectivity for each shear quadrant, where the CFAD in Fig. 1 has been subtracted from the CFADs in Fig. 2………...
13
4. CFAD of eyewall vertical velocity binned every 1 m s-1…………………...
14
5. Anomaly CFADs of vertical velocity for each shear quadrant, where the CFAD in Fig. 4 has been subtracted from the shear-separated CFADs (not shown)…………………………………………………………………….....
16
6. Averaged joint probability distribution diagrams of radius and height for intense (a) updrafts (w ≥ 5 m s–1) and (b) downdrafts (w ≤ –4 m s–1). Normalized joint probability distribution diagrams were produced for each swath and then averaged to be representative of the entire dataset…………
21
7. Averaged joint probability distribution diagrams of radius and height for for intense updrafts (w ≥ 5 m s–1) separated by shear-oriented quadrant.…..
22
8. Averaged joint probability distribution diagrams of radius and height for for intense downdrafts (w ≤ –4 m s–1) separated by shear-oriented quadrant……………………………………………………………………..
24
9. (a) Composite reflectivity cross-section through intense updrafts (b) Composite vertical velocity cross-section through intense updrafts (c) Composite tangential velocity cross-section through intense updrafts (d) Composite radial velocity cross-section through intense updrafts………
26
10. (a) Composite reflectivity cross-section through intense downdrafts (b) Composite vertical velocity cross-section through intense downdrafts (c) Composite tangential velocity cross-section through intense downdrafts (d) Composite radial velocity cross-section through intense downdrafts…...
27
11. Composite cross-sections through intense updrafts of vertical velocity for each shear-oriented quadrant………………………………………………..
29
12. Composite cross-sections through intense updrafts of radial velocity for each shear-oriented quadrant………………………………………………..
30

iii
13. Composite cross-sections through intense downdrafts of vertical velocity
for each shear-oriented quadrant.……………………………………………
32
14. Composite cross-sections through intense downdrafts of radial velocity for each shear-oriented quadrant………………………………………………..
33
15. (a) Three-dimensional schematic depicting the vertical motion distribution in each quadrant. (b) Three-dimensional schematic illustrating the mean circulation that occurs when intense updrafts are present. (c) Three-dimensional schematic illustrating the mean circulation that occurs when intense downdrafts are present………………………………..
37

iv
LIST OF TABLES
Table Number Page
1. Database Characteristics…………………………………………………….
7
2. Pixel counts of strong updrafts and downdrafts within each quadrant identified for cross-section analysis. Updrafts lie within normalized radius values of 0.75 and 1.25, while downdrafts lie within normalized radius values of 0.5 and 1.5………………………………………………………...
28

v
ACKNOWLEDGMENTS
We thank John Gamache for developing the automated quality control and synthesis
technique, which made this study possible. Paul Reasor helped in obtaining and analyzing the
data. We are indebted the NOAA Aircraft Operation Center for the time spent collecting this
data. We appreciate the feedback from three anonymous reviewers whose comments greatly
improved the manuscript. Finally, we thank Beth Tully for her assistance with graphics and
editing. This work was supported by NSF RAINEX Grant ATM-0743180 and NASA Grant
NNX12AJ82G.
1
Chapter 1
INTRODUCTION
Although tropical cyclone vertical motion within the inner core is often approximated as
axisymmetric, real cyclones are often characterized by prominent asymmetries. A better
understanding of the internal structure, particularly deviations from the mean slantwise-neutral
circulation, is crucial to storm-intensity forecast error improvement, which currently lags behind
track forecast error (DeMaria et al. 2005). Asymmetries can arise from a variety of sources;
however, the vertical wind shear of the surrounding environment has been a focus of recent
studies.
Beyond its detrimental effect on tropical cyclone intensity, vertical wind shear has a
crucial role in organizing the inner-core structure. Recent studies have focused attention on two
mechanisms proposed to cause vertical motion asymmetries: vortex tilt and storm-relative flow.
In response to the shear-induced deep layer tilt of the vortex, an asymmetric vertical circulation
develops temporarily, where upward motion occurs downtilt and downward motion occurs uptilt,
simultaneously producing a wavenumber-1 asymmetry of potential temperature. This in turn
induces a second, persistent vertical motion asymmetry as air moves through the temperature
anomalies (upward from the positive to negative anomalies and downward from the negative to
positive anomalies). The vertical motion is 90º out of phase with the temperature anomalies
(Jones 1995; Frank and Ritchie 1999; Braun et al. 2006; Reasor and Eastin 2012). In addition,
vertical shear imposes opposite flow patterns onto the vortex at low and high levels: downshear,
the relative flow is radially inward closer to the surface and radially outward aloft (the opposite
2
pattern occurs upshear). Due to the strong radial vorticity gradient, this relative flow causes
appreciable vorticity advection, which is approximately balanced by vortex stretching or
compression (Bender 1997; Frank and Ritchie 1999; Frank and Ritchie 2001; Rogers et al. 2003;
Braun et al. 2006; Wu et al. 2006). Distinguishing between these two mechanisms is challenging,
as the two often exist simultaneously.
Despite the difficulty in evaluating the dominant mechanism, several observational
studies have investigated the resulting impact on storm structure. However, they tend to be case
studies (Black et al. 2002; Reasor et al. 2009; Reasor and Eastin 2012) or focus on horizontal
patterns of vertically integrated convective proxies (Corbosiero and Molinari 2002; Corbosiero
and Molinari 2003; Chen et al. 2006). Nonetheless, a basic vertical velocity pattern emerges,
wherein updrafts are more frequent downshear and downdrafts upshear. Black et al. (2002) used
case studies to deduce that convective echoes initiate downshear and mature as they move
around the eyewall, and that reflectivity maximizes left of shear. Though not examined
specifically in reference to the environmental shear, Heymsfield et al. (2001) noted a similar
evolution of individual convective cells within Hurricane Bonnie. Corbosiero and Molinari
(2002) and Chen et al. (2006) examined the horizontal distribution of lightning and rainfall,
respectively. Within the inner core, these proxies for convection skewed preferentially towards
the downshear side of the storm, with a maximum downshear-left. Moreover, Corbosiero and
Molinari (2003) and Chen et al. (2006) showed that when shear was stronger than a certain
threshold, it was the dominant mechanism in organizing convection, superseding any effect by
storm motion.
Although the asymmetric eyewall kinematic structure is often generalized by a
downshear-upshear difference, both observational and modeling studies have shown that these
3
gross asymmetries occur due to temporal and spatial averaging of smaller, transient features that
evolve while circling the eyewall (Black et al. 2002; Braun et al. 2006). Using case studies of
Hurricanes Jimena (1991) and Olivia (1994), Black et al. (2002) found that the convective pulses
tended to be periodic. In a numerical simulation of Hurricane Bonnie, Braun et al. (2006) showed
that updraft initiation could result from the interaction of smaller-scale eyewall mesovortices
with low-level inflow downshear. Thus, while the vertical shear projects strongly onto the low
wavenumber structure, resolving smaller-scale features is also important.
Finally, the vertical dimension of this problem cannot be ignored. Two recent studies
have used a large sample of storms to document the vertical structure of the tropical cyclone's
inner core. Hence and Houze (2011) performed a statistical analysis of data obtained by the
Tropical Rainfall Measurement Mission (TRMM) Precipitation Radar (PR) to investigate the
vertical structure of hydrometeors in tropical cyclone eyewalls in relation to the large-scale
shear. Their reflectivity distributions imply a systematic progression cyclonically from young
convection in the downshear-right quadrant, to a mixture of mature convection and stratiform
rain, to progressively more stratiform characteristics around the eyewall in the upshear
quadrants. Similarly, Reasor et al. (2013) took advantage of a multiyear sample of National
Oceanic and Atmospheric Administration (NOAA) WP-3D tail Doppler radar data to investigate
the impact of shear on the mean kinematic vertical structure. They showed that composite
vertical motion was consistent with previous studies; however, they noted that peak composite
motion skewed towards the quadrant with the strongest and deepest low-level inflow, i.e.,
downshear-right. By separating the storms into low- and high-shear cases, they demonstrated the
robust nature of this relationship, where the high-shear cases were far more asymmetric than
those storms embedded within weaker shear.

4
In this study, we expand upon the results of Hence and Houze (2011) and Reasor et al.
(2013). We utilize the same overall dataset as Reasor et al. (2013), which provides the kinematic
information that Hence and Houze (2011) lacked. However, we employ a similar statistical
analysis as Hence and Houze (2011) to investigate the eyewall distribution of reflectivity and
vertical velocity, as opposed to the mean, to get a better sense of the total sample variability. As
in these previous studies, we examine the radar data in relation to the deep-layer large-scale
environmental wind shear. Results are organized by quadrant relative to the large-scale shear
vector. Using a statistical distribution approach similar to Hence and Houze (2011), but on a
dataset that includes vertical air motions, allows us to determine the nature of the smaller-scale
convection active in each quadrant of the storm and not simply the mean structures. Finally, we
place the updraft and downdraft outliers within the context of their respective circulations to
determine if they exhibit different mean dynamical characteristics. In summary, we do not focus
on the net amount of mass flux or total precipitation in each quadrant, but rather seek insight into
the type of small-scale cloud and precipitation features that contribute to the net fluxes and
rainfall.

5
Chapter 2
DATA AND METHODOLOGY
This study utilizes the database of tail Doppler radar data from NOAA WP-3D aircraft
from 2003 through 2010, which has been analyzed in several other studies (Rogers et al. 2012;
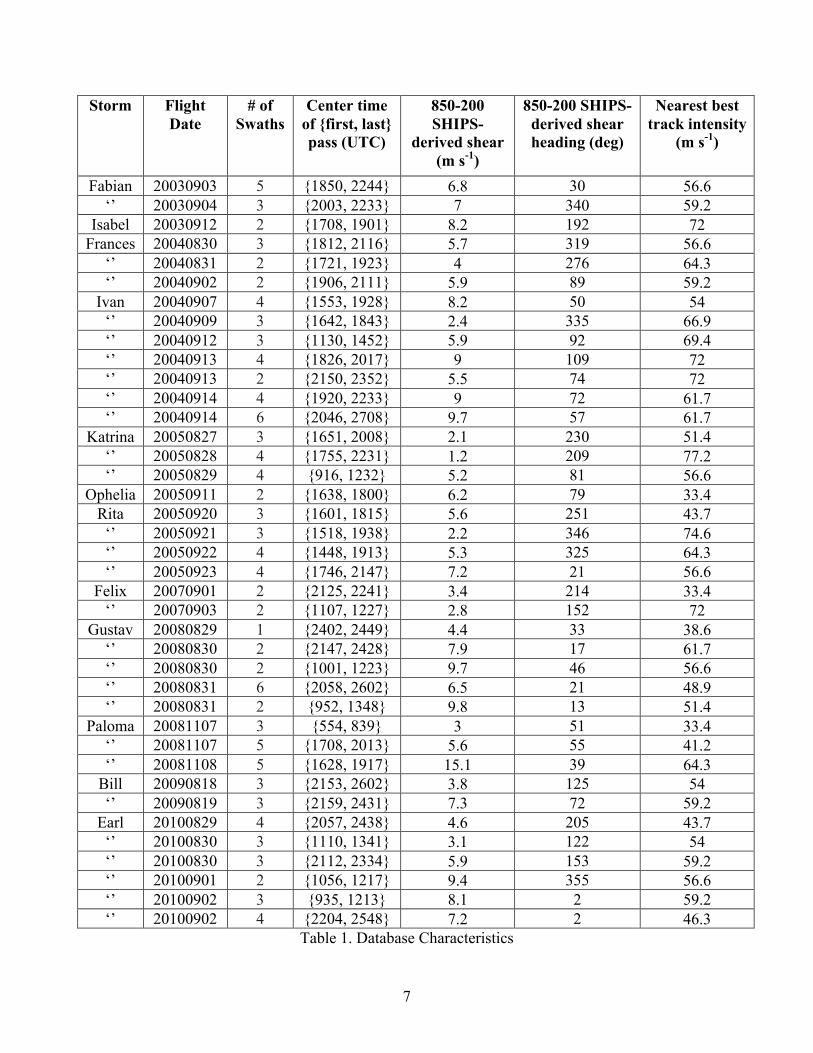
Reasor et al. 2013; Rogers et al. 2013). Our study compiles information from 125 eyewall
penetrations obtained during 39 separate flights within 12 tropical cyclones. Details regarding
each flight are described in Table 1. All of the storms included in this study were of hurricane
strength at the time they were sampled; using the nearest National Hurricane Center (NHC) best-
track data to the actual flight time, the average storm intensity was 56.8 m s–1s, though the
distribution is skewed towards more intense cyclones.
The data come from the X-band dual-Doppler tail radar that scans in a cone alternating
20° fore and aft of the vector normal to the airplane track as it traverses the eyewall. An
automated variational algorithm (Gamache 1997) takes the measured reflectivity and Doppler
radial velocity to produce gridded three-dimensional analyses. The algorithm simultaneously
solves the continuity and Doppler projection equations using least-squares minimization (Reasor
et al. 2009). The resulting analyses, referred to as swaths, have horizontal and vertical resolutions
of 2 km and 0.5 km, respectively. Compared with high-resolution case studies by Black et al.
(1996) and Heymsfield et al. (2010), the resolution is considerably lower; their datasets have
horizontal resolutions of 750 and 100 m and vertical resolutions of 300 and 37.5 m, respectively.
As a result, smoothing of the smallest features occurs in our study. While the reduced is a
disadvantage of the automated processing algorithm, it also enables us to analyze a large number
6
of storms to look for common features. Therefore, despite the tradeoff between sample size and
resolution, we still feel that we are able to examine features smaller than quadrant means.
For each swath, we calculated the approximate storm motion from NHC best track data,
which is removed from the horizontal wind field. Next, the storm center was calculated at 2 km
altitude by using a simplex algorithm (Neldar and Mead 1965), which locates the center that
maximizes the axisymmetric tangential wind within a 5-km wide annulus. Data at all altitudes
are centered relative to this location. In order to account for the variety of storm size, we
normalize the horizontal distance of each swath by its respective radius of maximum wind at the
2-km level, as in Rogers et al. (2012). In order to isolate the eyewall, we define the eyewall by
those pixels with normalized radius values between 0.75 and 1.25, as in Rogers et al. (2012). In
order to analyze the characteristics of smaller-scale features, we only consider the individual
radial passes; we do not merge them together, as is done in Reasor et al. (2013).
In order to categorize the storms by shear, we take the 850-200 hPa deep-layer shear from
the Statistical Hurricane Intensity Prediction Scheme (SHIPS) database (DeMaria et al. 2005).
Within our sample, the average magnitude of the vector wind difference between the two levels
was 6 m s–1, as seen in Table 1. Ensuring the presence of shear, we only include storms where
the magnitude of the wind velocity difference between the two levels was >2.5 m s–1, as in
Reasor et al. (2013). We then use this vector to separate the data into four shear-oriented
quadrants: downshear-right (DR), downshear-left (DL), upshear-left (UL), and upshear-right
(UR).
7
Storm Flight Date
# of Swaths
Center time of {first, last} pass (UTC)
850-200 SHIPS-
derived shear (m s-1)
850-200 SHIPS-derived shear heading (deg)
Nearest best track intensity
(m s-1)
Fabian 20030903 5 {1850, 2244} 6.8 30 56.6 ‘’ 20030904 3 {2003, 2233} 7 340 59.2
Isabel 20030912 2 {1708, 1901} 8.2 192 72 Frances 20040830 3 {1812, 2116} 5.7 319 56.6
‘’ 20040831 2 {1721, 1923} 4 276 64.3 ‘’ 20040902 2 {1906, 2111} 5.9 89 59.2
Ivan 20040907 4 {1553, 1928} 8.2 50 54 ‘’ 20040909 3 {1642, 1843} 2.4 335 66.9 ‘’ 20040912 3 {1130, 1452} 5.9 92 69.4 ‘’ 20040913 4 {1826, 2017} 9 109 72 ‘’ 20040913 2 {2150, 2352} 5.5 74 72 ‘’ 20040914 4 {1920, 2233} 9 72 61.7 ‘’ 20040914 6 {2046, 2708} 9.7 57 61.7
Katrina 20050827 3 {1651, 2008} 2.1 230 51.4 ‘’ 20050828 4 {1755, 2231} 1.2 209 77.2 ‘’ 20050829 4 {916, 1232} 5.2 81 56.6
Ophelia 20050911 2 {1638, 1800} 6.2 79 33.4 Rita 20050920 3 {1601, 1815} 5.6 251 43.7
‘’ 20050921 3 {1518, 1938} 2.2 346 74.6 ‘’ 20050922 4 {1448, 1913} 5.3 325 64.3 ‘’ 20050923 4 {1746, 2147} 7.2 21 56.6
Felix 20070901 2 {2125, 2241} 3.4 214 33.4 ‘’ 20070903 2 {1107, 1227} 2.8 152 72
Gustav 20080829 1 {2402, 2449} 4.4 33 38.6 ‘’ 20080830 2 {2147, 2428} 7.9 17 61.7 ‘’ 20080830 2 {1001, 1223} 9.7 46 56.6 ‘’ 20080831 6 {2058, 2602} 6.5 21 48.9 ‘’ 20080831 2 {952, 1348} 9.8 13 51.4
Paloma 20081107 3 {554, 839} 3 51 33.4 ‘’ 20081107 5 {1708, 2013} 5.6 55 41.2 ‘’ 20081108 5 {1628, 1917} 15.1 39 64.3
Bill 20090818 3 {2153, 2602} 3.8 125 54 ‘’ 20090819 3 {2159, 2431} 7.3 72 59.2
Earl 20100829 4 {2057, 2438} 4.6 205 43.7 ‘’ 20100830 3 {1110, 1341} 3.1 122 54 ‘’ 20100830 3 {2112, 2334} 5.9 153 59.2 ‘’ 20100901 2 {1056, 1217} 9.4 355 56.6 ‘’ 20100902 3 {935, 1213} 8.1 2 59.2 ‘’ 20100902 4 {2204, 2548} 7.2 2 46.3
Table 1. Database Characteristics

8
Chapter 3
EYEWALL STATISTICS
To establish consistency with the conclusions of Hence and Houze (2011), we first carry
out a similar analysis of reflectivity to see if the same progression of convective lifecycle stage
with azimuth appears in this dataset. Since the TRMM PR and NOAA P3 radars have different
wavelengths (Ku- and X-band, respectively), sensitivities, and scanning strategies, comparing
their respective eyewall reflectivity patterns is essential. Both experience attenuation, although it
is more extreme for the TRMM PR and is corrected. Additionally, the datasets do not sample
identical storms, although there is a great deal of overlap. After establishing that the NOAA P3
radar captures the same eyewall convective evolution with regard to radar reflectivity (i.e., the
precipitation field) as TRMM, we will extend the analysis to eyewall vertical velocity derived
from the airborne radar. Due to a reduction in data quality at higher altitudes, we only examine
vertical velocity data below 10 km and the primary reflectivity analysis focuses on that altitude
range as well.
In our analysis of tropical cyclone vertical structure, we employ contoured frequency by
altitude diagrams (CFADs; Yuter and Houze 1995) of reflectivity and vertical velocity to
investigate the statistical behavior of convection within hurricanes. CFADs are joint probability
distributions that detail the vertical structure of data frequency. They are normalized by the
maximum frequency to determine the relative contributions to bulk structure. Frequencies greater
and less than 50% are hereafter referred to as the modal and outlier distributions, respectively.

9
a. Reflectivity
Figure 1 shows the full eyewall reflectivity structure. Two frequency peaks are evident:
one associated with intense low-level rainfall, and a stronger one associated with upper-level
Figure 1. CFAD of eyewall radar reflectivity binned every 1 dBZ. Contours every 5% beginning at 5% represent the frequency of occurrence relative to the maximum absolute frequency in the data sample represented in the CFAD. The 50% contour line has been colored black for reference.
frozen hydrometeors. Altitudes below 6 km are marked by a large spread of reflectivities (~35
dB); however, the modal distribution encompasses stronger reflectivities, reflecting the intense
precipitation that is characteristic of tropical cyclones. Reflectivity values decrease dramatically
from 5 to 6 km, both in the modal and outlier distributions, arising from the transition from
liquid to ice hydrometeors above the melting level. The frequency peak above 6 km is sharper.
The brightband structure and upper-level frequency peak are consistent with the results from
Hence and Houze (2011); however, their upper-level peak was much larger relative to lower
levels. This difference could be related to the different sampling strategies and sensitivities of the

10
two radars. Whereas TRMM samples from above the storms, the NOAA WP-3D aircraft
typically fly at 3 km altitude. Thus, both radars suffer from attenuation, but in different
directions. Additionally, the TRMM PR sensitivity is only 17 dBZ; in contrast, the NOAA radars
are capable of measuring much weaker reflectivities. Thus, the upper-level signature in Figure 1
is much broader, spanning a larger range of reflectivity values, possibly weakening the upper-
level frequency peak. Finally, the dataset used by Hence and Houze (2011) had considerable
diversity of storm strength, whereas the dataset here skews towards more intense storms,
possibly affecting the magnitudes of the low-level frequencies of occurrence.
Separating the total eyewall into shear-oriented quadrants highlights the structural
differences around the storm. To ensure an appropriate comparison between quadrants, the
CFADs are each normalized by their respective maximum frequency (Fig. 2). Many similarities
Figure 2. As in Fig. 1, but separated according to shear quadrant. Quadrants are labeled DR, DL, UL, and UR.

11
to the total eyewall CFAD exist in each quadrant: the lower- and upper-level frequency maxima,
brightband structure, and overall reflectivity range. However, closer examination of each
quadrant reveals important structural differences. The two frequency peaks are nearly equally
sharp in the left of shear quadrants, while the right of shear quadrants have far fewer intense low-
level reflectivities; UR has the smallest amount. Furthermore, the modal values in the right of
shear quadrants are centered on weaker reflectivities. This variation with shear is broadly
consistent with that found by Hence and Houze (2011). The increased presence of low-level
hydrometeors left of shear is consistent with the surface rainfall patterns seen in Chen et al.
(2006) and the composite cross-sections of Reasor et al. (2013).
Despite the tendency for the right of shear distributions to peak at higher altitudes and
weaker reflectivities, at the expense of the low-level reflectivities, the low-level modal
distribution DR is not as anemic as UR. Centered on 30 dBZ, the DR modal distribution spans
approximately 15 dB and exhibits little reflectivity variation below the melting layer, where the
50% contour is nearly vertical. Intense reflectivities occur relatively frequently both near the
surface and up to the melting layer; their vertical extent suggests convective generation and
lifting by updrafts. In the transition to the DL quadrant, the structure changes, notably reflected
by the increased frequencies below the melting layer. The low-level frequency maximum is
strong DL. Moreover, the largest frequencies are centered on 33 dBZ and extend up from the
surface through 6 km, while the 95% contour line spans 30 to 35 dBZ not far above the surface.
The vertically uniform frequency distribution below 6 km suggests the presence of updrafts DL,
as in DR, while the near-surface frequency maximum of intense reflectivity suggests strong
fallout. The relative widths of the modal distributions DR and DL are opposite to that seen by
Hence and Houze (2011). These differences are likely due to a combination of differences in

12
storm diversity and attenuation (and correction) of the TRMM PR and airborne radar. Despite
these differences, the shift in relative importance of the upper and lower level frequency peaks is
consistent.
A substantial structural change occurs in the upshear quadrants. While there is still a
strong signature of copious amounts of intense reflectivities at low-levels in UL, the frequencies
drop off quite quickly with height. In particular, the modal distribution tilts towards weaker
reflectivities with height, implying a reduction in lifting as strong precipitation still occurs closer
to the surface. This tilt of the modal distribution is consistent with Hence and Houze (2011). The
heavy near-surface rainfall generated downshear has been advected around the eyewall and the
remnants fall out in this quadrant (cf. Fig. 17 from Black et al. 2002). Finally, UR sees a
dramatic reduction in convection. Very few intense reflectivities are found here and the modal
distribution is not connected, implying weak upward motion.
These key structural differences are seen more clearly by removing the mean structure.
We create anomaly CFADs by subtracting the total eyewall CFAD from the quadrant CFADs as
shown in Figure 3. In an effort to ensure our results are robust, we subsampled the data and
recreated the anomaly CFADs. We selected, at random, one swath from each flight in order to
generate the subsampled dataset; this was done five separate times. Overall, the subsampled data
exhibited the same characteristics as the full dataset, signifying that structures in Figure 3 are
robust (not shown). This same technique was applied to all quadrant-separated figures
throughout the study. The most striking feature of the anomaly plots is the strong departure from
the total eyewall that prevails within the DL and UR quadrants. The distribution in DL shifts
towards more intense reflectivities up through 18 km, whereas the strong negative anomalies UR
signify a shift in the distribution towards weak reflectivities.

13
Figure 3. Anomaly CFADs of reflectivity for each shear quadrant, where the CFAD in Fig. 1 has been subtracted from the CFADs in Fig. 2. Contours represent the frequency anomaly, contoured every 5%, where red contours are positive anomalies and blue contours are negative anomalies.
The deviations from the total eyewall are muted in the DR and UL quadrants. The low-
level precipitation anomaly patterns yield further insight into the differing convective behavior of
the DR and UL quadrants. Below 4 km and between 20 and 40 dBZ, the anomaly patterns of the
two quadrants are opposite: there is a decrease in intense reflectivities and an increase in weaker
reflectivities DR, while UL shows a slight preference for intense reflectivities and a reduction in
weak reflectivities. In the layer from 4 to 6 km, the anomalous frequency pattern switches UL;
reflectivities ranging from 30 to 40 dBZ are less common, whereas reflectivities weaker than 30
dBZ are more frequent. In contrast, within this same layer, DR deviates little from the total
CFAD. This distribution implies that larger particles may be more frequent UL, but they are
SHEAR

14
constrained vertically to the lowest levels, again consistent with fallout. Low-level reflectivities
still have an appreciable, if somewhat reduced, relative frequency DR that remains steady with
altitude, indicating DR is a more favorable quadrant for upward motion than UL.
b. Vertical velocity
The previous discussion of the reflectivity CFADs establishes that the aircraft radar data
are statistically consistent with the TRMM radar data studied by Hence and Houze (2011). With
the Doppler-derived vertical velocity provided by the aircraft data and absent in the TRMM data,
we may now test their hypotheses regarding how the nature of the inner-core convection varies
from quadrant to quadrant relative to the environment shear vector. The eyewall vertical velocity
statistics are displayed in Figure 4. As expected, eyewall vertical motion is dominated by
Figure 4. As in Fig. 1, but for eyewall vertical velocity.
updrafts. The modal distribution spans a narrow range of weak velocities from –1 to 1.5 m s–1
and its vertical extent is rather shallow, again due to the decreasing number of scatterers aloft.
15
The prevalence of weak motion has been noted in several observational studies (Jorgensen 1984;
Black et al. 1996; Rogers et al. 2013). Nevertheless, outlier vertical velocities can be quite
strong; the 0.5% frequency contour encompasses velocities between –6 and +9 m s–1. As a
consequence of the reduced spatial resolution, the outlier velocity magnitudes are weaker than
those found in case studies by Black et al. (1996), Heymsfield et al. (2001), and Heymsfield et al.
(2010). Although the strongest velocity magnitudes are more frequent above 4 km in Figure 4,
the aforementioned studies found updrafts maximize and strong downdrafts exist above 10 km,
which we do not analyze due to degradation of data quality above this altitude. The tendency for
the strongest inner-core convective-scale updrafts to occur above the melting level has been
noted since the earliest use of airborne Doppler radar within tropical cyclones; Marks and Houze
(1987) found the maximum vertical velocities in the eyewall of Hurricane Alicia (1983) at the 6-
14 km levels and suggested that they were the result of release of latent heat of fusion as had
been indicated by the early modeling results of Lord et al. (1984). Drawing upon thermodynamic
arguments, Zipser (2003) discussed how freezing heating is likely a general cause of the
tendency for intense vertical velocities to occur at the highest levels in tropical convection. More
specifically, observational studies by Black et al. (1996), Heymsfield et al. (2001), and
Heymsfield et al. (2010) noted that the strongest updrafts are located above 8 km, maximizing in
strength around 12 km in the latter study. Another recent modeling study of tropical convection
by Fierro et al. (2009) produced a secondary updraft maximum between 10 and 12 km. In these
studies, the secondary updraft peak is attributed to a combination of precipitation unloading at
middle levels and additional buoyancy from ice processes further aloft. Since we limit the
vertical extent of our analysis to 10 km, due to the reduction in vertical velocity quality and
availability above that altitude, we do not sample the uppermost updraft peak observed in these

16
prior studies. Nonetheless, these studies also show an increase in vertical velocity beginning
around 7 km, which our analysis captures.
As with reflectivity, separating the vertical velocity data into shear quadrants provides
more insight about the asymmetric eyewall structure (Fig. 5). The differences between the
Figure 5. Anomaly CFADs of vertical velocity for each shear quadrant, where the CFAD in Fig. 4 has been subtracted from the shear-separated CFADs (not shown). Contours represent the frequency anomaly, contoured every 2%, where red contours are positive anomalies and blue contours are negative anomalies.
upshear and downshear quadrants are striking and were robust when subsampled. As would be
expected according to the analyses of Black et al. (2002) and Hence and Houze (2011), updrafts
are found preferentially downshear, while downdrafts are more frequent upshear. Additionally, a
strong wavenumber-1 asymmetry is visible in the frequency anomalies: DL and UR have weaker
anomalies that are nearly identically opposite, while DR and UL have opposite patterns of
stronger anomalies.
SHEAR

17
In the DR quadrant, the positive and negative frequency anomalies of updrafts and
downdrafts indicate much more updraft activity and much less downdraft activity than the
eyewall as a whole. The 2% anomaly contour spans a wide range of updraft velocities, reaching a
maximum updraft speed of 6 m s–1 while two smaller maxima of 10% straddle the 2 m s–1 line at
4 and 6 km. The negative anomalies, centered on –1 m s–1, extend from 1 to 10 km, and they are
also stronger, maximizing at –16% for –1 m s–1 and 5 km. This pattern of anomalies is consistent
with convective initiation tending to occur in the DR quadrant: updrafts are beginning to occur
here, but the convection has not yet reached the more mature stage in which downdrafts occur.
The frequency anomaly pattern DL is not a simple shift in the distribution. Similar to the
DR quadrant, DL exhibits strong positive frequency anomalies of updrafts; however, the
differences are noteworthy. The reduction in weak velocity frequency (i.e., w approximately 0 m
s–1) and the simultaneous increase in strong updraft frequency together indicate a broader
distribution than that seen DR, with somewhat more frequent updrafts stronger than 4 m s–1. Yet,
while positive anomalies DR more evenly cover a broad range of updraft intensities, the
anomalies DL maximize for stronger updrafts. In addition, DL has fewer weak updrafts above 2
km; meaning upward motion that is present within DL is preferentially stronger. This occurrence
of stronger drafts at higher altitudes is consistent with the results of Rogers et al. (2013), who
found that convective bursts, defined in their study as vertical velocities > 5.5 m s–1 at 8 km (i.e.,
the top 1% of vertical velocities at that altitude), occur more often in the DL quadrant.
Convection initiating DR, which matures and strengthens as it moves DL, has been noted
previously in case studies by Black et al. (2002) and Heymsfield et al. (2001), and is consistent
with simulations carried out by Frank and Ritchie (1999) and Braun et al. (2006).
18
Downdraft behavior also evolves through the quadrant transition. Negative frequency
anomalies exist for downdrafts of all magnitudes and at all altitudes in the DR quadrant;
downdrafts are not common. In contrast, negative frequency anomalies DL only surround weak
downward motion below 5 km and above 7 km only weak upward motion is less frequent.
Outside of these negative anomalies, the weak downdraft frequency is nearly equal to the total
eyewall above 6 km and may be even slightly greater. Though this presence of downdrafts pales
in comparison to the positive anomalies of downdraft frequency UL, it does signify the tendency
for downdrafts to develop in the transition from the DR to the DL quadrant in conjunction with
the development of more mature and intense convection. In vertical cross-sections shown in
Black et al. (2002), strong updrafts left of shear were often flanked by downdrafts on either side,
radially. Hurricane Bonnie, as analyzed by Heymsfield et al. (2001), also exhibited the
development of a strong downdraft adjacent to convection at its peak intensity. Despite
maximizing in the upper troposphere (10 to 15 km), this downdraft had considerable vertical
extent down to an altitude of 7 km. Additionally, this distribution broadening likely contributes
to the weakened composite vertical motion DL shown by Reasor et al. (2013); the strong
updrafts and increasing number of downdrafts could cancel each other out in a composite
analysis, particularly when considering eyewall variability from storm to storm.
In contrast to the updraft-dominated downshear quadrants, downdrafts become more
prevalent upshear. Similar to the DR anomaly pattern, the distribution UL shifts, towards
downward motion. Moderate negative frequency anomalies are associated with updrafts of all
magnitudes above 2 km. The distribution pattern UR is nearly the opposite of DL: positive
frequency anomalies surround weak velocities (downdrafts below 5 km and updrafts above 7
km) and negative frequency anomalies surround moderate to strong updrafts. The combination of

19
frequent weak vertical motion and infrequent updrafts indicates that the distribution is narrower
than the total eyewall in the UR quadrant. The upshear quadrants are also broadly consistent with
Reasor et al. (2013), though this analysis provides additional insight into how the mean motions
are comprised of up- and downdrafts. The composite vertical motion UL is reduced due to the
increased presence of strong downdrafts cancelling out the updrafts that may still exist there as
cells are advected around. The weak motion UR, on the other hand, is due to a narrow
distribution centered on weak vertical velocities.

20
Chapter 4
INTENSE VERTICAL VELOCITIES
The possibility that strong local "bursts" of especially strong updraft motion may play a
role in determining tropical cyclone intensity has received attention in the literature (e.g., Rogers
et al. 2013). We therefore examine in this section the behavior of the outliers of the vertical
velocity distribution in reference to the environmental wind. Specifically, we examine those data
points with updrafts stronger than +5 m s–1 or downdrafts stronger than –4 m s–1. This updraft
threshold is approximately equal to the convective burst definition in Rogers et al. (2013). In
order to ensure that the outlier velocities are robust features, we require that they cover at least
five contiguous pixels. Their horizontal and vertical characteristics are examined through radial-
altitude joint probability distributions. However, since we are examining distribution outliers, the
frequency counts are rather small. In order to prevent the distribution of a single swath from
dominating the overall sample, we calculate a joint probability distribution of radius and altitude
for each swath. Each distribution is normalized by its respective maximum count. We then take
the average of the swath distributions, thereby creating a new distribution plot, which is
subsequently normalized by its maximum value. Overall, the average distributions communicate
the same result as the non-averaged versions (not shown), but are more representative of the
overall dataset.
Figure 6 shows the averaged distribution plots for the intense updrafts and downdrafts.
The bulk of the strong updrafts reside within the previously defined eyewall band, though some
do exist beyond those limits. They preferentially occur at middle to higher altitudes, specifically
above 5 km. The increasing frequency of strong updrafts with altitude likely results from a

21
Figure 6. Averaged joint probability distribution diagrams of radius and height for intense (a) updrafts (w >= 5 m/s) and (b) downdrafts (w <= -4 m/s). Normalized joint probability distribution diagrams were produced for each swath and then averaged to be representative of the entire dataset. Black lines denote the inner and outer edges of the eyewall.
combination of precipitation unloading and latent heat release from both freezing raindrops
immediately above the melting level and cloud droplets higher aloft (Zipser 2003; Heymsfield et
al. 2010). Strong downdrafts cover a larger radial range; however, two frequency maxima flank
the edges of the defined eyewall band, straddling the location of the updraft frequency
maximum, with the inner downdraft maximum being the larger of the two. In contrast to the
strong updrafts, the strong downdraft frequencies peak in middle, rather than upper, levels.
Hydrometeor weighting would more likely produce downdrafts at low-levels where the
reflectivity and rain rate are greatest. The concentration of downdrafts seen here higher aloft
suggests that they are related to alternative mechanisms, such as the pressure gradient response
to buoyancy or the shear-relative flow (Houze 1993, Chap. 7; Yuter and Houze 1995; Bender
1997; Frank and Ritchie 1999; Didlake and Houze 2009).. Another potential downdraft source is
the detrainment of air within hot towers. In particular, in their analysis of Hurricane Bonnie,
Heymsfield et al. (2001) highlight the existence of a large upper-level downdraft adjacent to an

22
intense convective tower. They suggest the initial development occurs in response to the
overshooting top, which is then sustained and driven downward by evaporation of detraining air
from the convective tower. Though this particular downdraft originates and maximizes above the
vertical limit of our dataset, it is maintained down to an altitude of 7 km. Thus, this could play a
role in the downdraft concentration seen in our data. However, the limitations of the tail radar
dataset prevent us from thoroughly evaluating this hypothesis.
Overall, the intense updrafts follow the same pattern with respect to shear as described in
the previous section (Fig. 7). In order to highlight the quadrants that are the most favorable for
Figure 7. As in Fig. 6, but for intense updrafts separated by shear-oriented quadrant. Joint probability distribution diagrams were produced for each quadrant and then normalized by the maximum frequency in any quadrant for each swath. These normalized quadrant diagrams were then averaged and normalized again by the maximum average frequency in any quadrant.
23
the distribution outliers, we normalize each quadrant distribution by the maximum frequency
occurring in any of the four quadrant distributions. Just as in the CFAD plots, these distributions
were consistent when subsampled. The strongest updrafts occur preferentially downshear, with a
slight preference for the DL quadrant. In the DR quadrant the strong drafts occur most frequently
in the midlevels, while they occur aloft in the DL quadrant. This progression could result from
the maturation of convection as updraft cores rise helically around the eyewall. Since DR is the
quadrant where convective initiation takes place, intense velocities may not have had sufficient
time to strengthen. There is a steep reduction in strong updrafts in the upshear quadrants, where
they only exist aloft.
Strong downdrafts also follow the same shear pattern as the weaker downdrafts; however,
there is an unmistakable peak of intense downdrafts in the UL quadrant, which is robust when
subsampled (Fig. 8). The DR quadrant, in contrast, has remarkably few intense downdrafts,
which is unsurprising given its updraft-dominated structure as discussed in the previous section.
Moderate amounts of intense downdrafts exist DL and UR, with the strong downdraft frequency
DL peaking at midlevels and above 8 km and UR between 2 and 8 km. Strong downdrafts DL
and UR concentrate along the edges of the eyewall. The midlevel maximum of downdraft
occurrence DL strongly suggests that they may result from potential mechanisms such as
dynamical forcing in response to the high-altitude convective updrafts or detraining air from the
intense convection (Houze 1993, Chap. 7; Yuter and Houze 1995; Bender 1997; Frank and
Ritchie 1999; Heymsfield et al. 2001; Didlake and Houze 2009). The intense downdrafts UL
maximize in frequency on the inner edge of the eyewall, which could at least partially be a result
of the radar signal becoming too weak because of radar attenuation. Black et al. (2002) suggested
that the convective cores that were initiated downshear developed precipitation-driven

24
downdrafts upon moving into the UL quadrant. However, they also noted an example where
downdrafts UL appeared to have an upper-tropospheric origin. Since convection begins to die in
this quadrant, it seems unlikely that the convective generation mechanisms would directly cause
downdrafts to initiate here, though they could be residual. The shear-relative flow is more
conducive for downdraft generation and could be a likely explanation.
Figure 8. As in Fig. 7 but for intense downdrafts.

25
Chapter 5
CONTEXT OF THE DRAFTS
To get a sense of the behavior of the strongest updrafts and downdrafts around the storm,
we place them within the context of reflectivity and horizontal velocity. In order to capture the
dominant structures, we consider only the powerful updrafts that lie within the defined eyewall
band, i.e., normalized radius values of 0.75 to 1.25. Upon identifying the azimuth corresponding
to an intense draft, the pixels that lie within two degrees on either side at all radii and altitudes
are flagged. These pixels are then averaged to create radial-height cross-sections. Only unique
data points are included; even though strong drafts may lie next to each other, such that their
flagged sectors would overlap, the data points are not included multiple times. Figure 9 shows
the mean eyewall radial-height structure in which the strong updrafts are embedded, requiring
50% of swaths to have data for a value to be plotted. Drawing upon the total storm structure, the
reflectivity field associated with the vigorous updrafts is strongest within the eyewall, where lift,
hydrometeor generation and fallout are maximized. Similarly, the tangential wind field is
centered on the radius of maximum wind, which exhibits the expected outward slope, with the
peak values decreasing with altitude. The vertical velocity field is dominated by strong upward
motion throughout 10 km, with the strongest upward motion occurring above the melting level.
The accompanying radial flow displays the classic overturning secondary circulation. Low-level
inflow of –2 m s–1 below 2 km converges with 3 m s–1 outflow at the radius of maximum wind.
Outflow dominates the structure above 3 km, reaching its maximum strength of 5 m s–1 on the
outer edge of the strong composite updrafts.

26
Figure 9. Composite cross-sections through intense updrafts of (a) reflectivity, (b) vertical velocity, (c) tangential velocity and (d) radial velocity. Black lines denote the inner and outer edges of the eyewall.
To determine the context of the strong downdrafts, we follow the same procedure as for
the strong updrafts; however, the radial range is larger (normalized radius values between 0.5
and 1.5) to accommodate the different radial distribution seen in Figure 6. While the reflectivity
and tangential wind cross-sections for strong downdrafts are slightly weaker than the
corresponding plots for the strong updrafts, they nonetheless display a similar structure (Fig. 10).
On the other hand, the vertical velocity cross-section is marked by two regions of weak
downward motion flanking an updraft centered on the radius of maximum wind. The updraft
core is much weaker than that seen in the strong updraft plot. However, the most distinctive

27
difference between the updrafts and downdrafts occurs in the radial velocity cross-section. The
overturning circulation seen in Figure 9 is non-existent in the strong downdraft composite.
Outside the radius of maximum wind, with the exception of approximately 0 m s-1 radial flow
Figure 10. As in Fig. 9 but through intense downdrafts.
between 0.5 and 1 km, the radial flow below 3 km is weakly outward. Above this outflow, the
radial flow is weak, though slightly inward. A narrow filament of weakened outflow that
strengthens above 8 km is concurrent with the composite updraft while weak inflow is collocated
with the two regions of downward motion seen in Figure 10b.
While these overall composite cross-sections suggest different behavior of the strong
updrafts and downdrafts, further examination of Figures 7 and 8 shows that the cross-sections for
these intense drafts are being drawn from nearly opposite quadrants of the storm (downshear

28
quadrants for the updrafts and UL for the downdrafts). Thus, it is necessary to separate the
analysis by shear quadrant. Since structural differences were most noticeable in the vertical
velocity and radial velocity fields, the analysis will focus on these two variables. Table 2 shows
the relative counts of strong vertical velocities in each quadrant. Since there is variability among
the quadrants, particularly for the intense downdrafts, our analysis will focus on those quadrants
with more comparable amounts.
DR DL UL UR Updrafts 12984 15523 6555 6096 Downdrafts 1688 3849 8193 5077
Table 2. Pixel counts of strong updrafts and downdrafts within each quadrant identified for cross-section analysis. Updrafts lie within normalized radius values of 0.75 and 1.25, while downdrafts lie within normalized radius values of 0.5 and 1.5.
The shear-separated cross-sections for intense updrafts reveal that the vertical velocity
behavior is relatively similar for each quadrant, despite the quadrant differences in updraft counts
(Fig. 11). As in the total eyewall composite, strong updraft cores extend from the surface to 10
km and are constrained by the eyewall boundaries. The composite motion is strongest DR
(similar to Reasor et al. 2013), where it also occupies the largest portion of the eyewall. Though
DL has more powerful drafts, the composite updraft is weaker than DR, likely as a result of the
increased presence of downdrafts that weaken the average vertical velocity magnitude. The
updraft magnitude drops off even more UL, which has fewer updrafts and more downdrafts. UR
shows a moderately strong composite updraft, despite this quadrant exhibiting some of the
weakest updraft magnitudes overall. However, the structures UR exhibited more variability when
subsampled, and the composite updraft strength is likely not robust.

29
Figure 11. Composite cross-sections through intense updrafts of vertical velocity for each shear-oriented quadrant. Black lines denote the inner and outer edges of the eyewall.
The radial flow structure that accompanies strong updrafts is shown in Figure 12. There
is substantial variation among the quadrants, associated with the strong wavenumber-1
asymmetry of radial velocity, which is consistent with the results of Reasor et al. (2013). The
strongest radial flow exists DR, where strong inflow on the order of 5 m s–1 lies below strong
outflow of roughly 8 m s–1 outside of the radius of maximum wind. This pattern weakens
substantially DL, but has a similar structure, particularly outside the radius of maximum wind:
near-surface inflow lies below a broad layer of outflow. A pronounced outflow region,
corresponding to the outward edge of the composite updraft seen in Figure 11, slants radially
outward with height DL from 1 km through 10 km. Additionally, there is a region of inflow on

30
Figure 12. As in Fig. 11 but for radial velocity.
the radially inward flank of the composite updraft, this could be related to upper-level divergence
associated with the strong updraft. Within the upshear quadrants, the expected low-level inflow
and upper-level outflow pattern disappears; in fact, the radial flow is reversed UL. Outside of the
radius of maximum wind, weak outflow exists below 5 km with inflow lying above it, though
there is a shallow layer between 0.5 and 1 km where the radial flow is approximately 0 m s-1.
Despite the reversal in the radial flow pattern, a thin filament of weak radial flow cuts through
the stronger upper-level inflow UL. The weaker radial flow collocated with the outer edge of the
composite updraft UL resembles a superposition of the radial flow associated with a composite
updraft (low-level inflow and upper-level outflow) onto the shear-relative background flow UR

31
(low-level outflow and upper-level inflow). Corresponding to the decrease in intense updrafts in
the UR quadrant, as indicated in Table 2, the pattern is less coherent. With the exception of the 5
m s–1 outflow core above 8 km, the composite radial velocities are relatively weak. Nevertheless,
outflow in this quadrant resides within the eyewall, occupying the same radial-height space as
the outer edge of the composite updraft UR in Figure 11. However, this structure UR was not as
consistent when subsampled and when combined with the lack of intense downdrafts in this
quadrant, it is not robust like the structures seen in the other quadrants.
Unlike their updraft counterparts, the intense downdrafts show considerable quadrant-to-
quadrant structural variability in vertical velocity (Figure 13). Updraft cores stretching from the
surface to 10 km within the eyewall appear in the downshear quadrants, particularly DR, but are
nearly absent upshear. Given the lack of downdrafts DR, as shown in Table 2, any structure is
drowned out by the strong surrounding upward motion. The severe drop-off of intense downdraft
frequency DR means structural differences in this quadrant may not be representative of the full
dataset. Furthermore, the composite structure exhibited greater variability when subsampled and
is not significant. Thus, our analysis will focus on the quadrants with robust structures.
Downdrafts hug each side of the updraft core and eyewall DL, though the interior one is
stronger. Indeed, its magnitude is the strongest composite downward motion found in any
quadrant, despite the greater downdraft frequency found in the UL quadrant (Figure 8). Several
factors could explain this structure, including the concentration of downdrafts along the eyewall
edges DL in comparison to the large radial spread UL. The location of the strong downdrafts,
especially in relation to upward motion, experiences more variability between the swaths UL. As
a result, the structural diversity UL could result in features being averaged together, reducing the
downdraft magnitude. Additionally, the contrasting structures of the downshear and UL
32
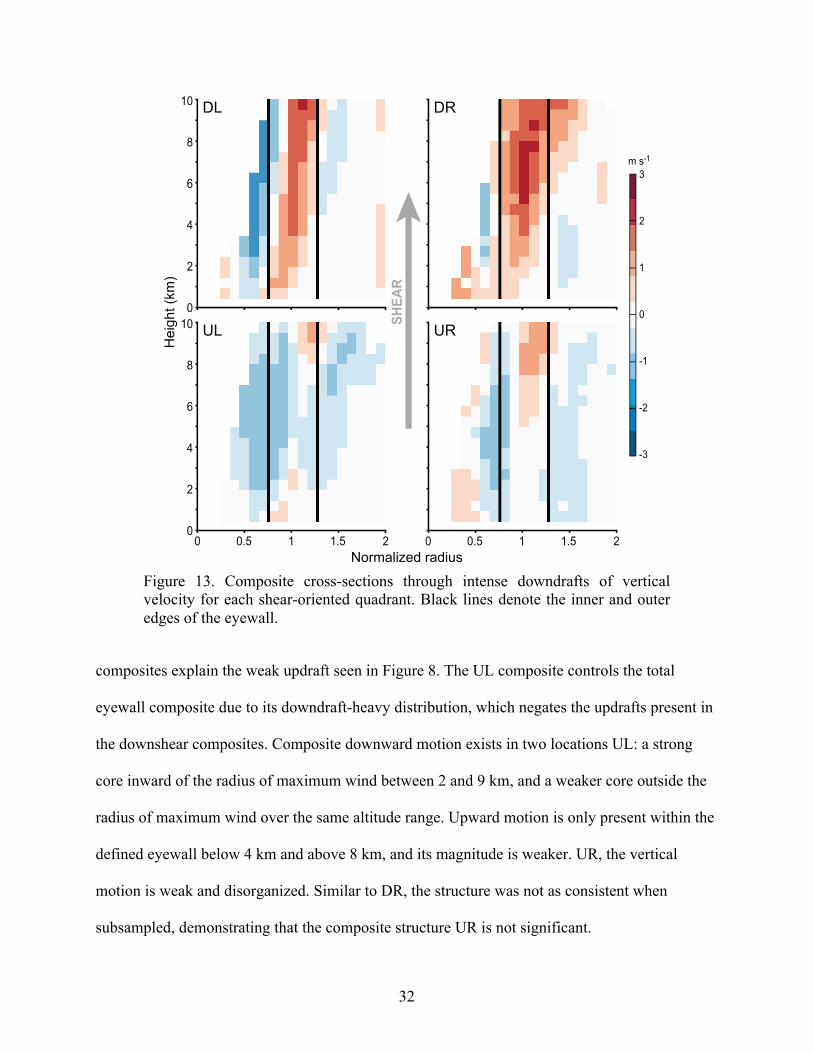
Figure 13. Composite cross-sections through intense downdrafts of vertical velocity for each shear-oriented quadrant. Black lines denote the inner and outer edges of the eyewall.
composites explain the weak updraft seen in Figure 8. The UL composite controls the total
eyewall composite due to its downdraft-heavy distribution, which negates the updrafts present in
the downshear composites. Composite downward motion exists in two locations UL: a strong
core inward of the radius of maximum wind between 2 and 9 km, and a weaker core outside the
radius of maximum wind over the same altitude range. Upward motion is only present within the
defined eyewall below 4 km and above 8 km, and its magnitude is weaker. UR, the vertical
motion is weak and disorganized. Similar to DR, the structure was not as consistent when
subsampled, demonstrating that the composite structure UR is not significant.

33
The corresponding radial flow (Fig. 14) is similar to that for the strong updrafts except
for the notable absence of outflow tied to the updraft core in the left of shear quadrants (Fig. 12).
The wavenumber-1 asymmetry emerges again, strongest in the DR and UL quadrants. The
structure DR strongly resembles the corresponding plot in Figure 12, where inflow extends up to
4 km with strong outflow above it. Although this is the expected radial flow structure for this
Figure 14. As in Fig. 13 but for radial velocity.
quadrant, the lack of samples DR, and variability when subsampled, indicate this structure is
likely not significant. The overturning circulation is much weaker DL, especially when compared
to the intense updraft radial flow in the same quadrant from Figure 12. For the intense
downdrafts, the inflow layer is restricted to the lowest 0.5 km of analysis and only reaches a
34
maximum of –2 m s–1, before converging with weak outflow at the radius of maximum wind.
Outside the eyewall, outflow only extends up to approximately 6 km and strengthens to no more
than 3 m s–1. Though there is a core of upward motion within the eyewall in Figure 13, similar to
the intense updrafts, there is no accompanying outward motion. Instead, weak inflow is present,
particularly on the flanking edges of the updraft. UL is nearly the opposite of DR; moderate
outflow below 3 km lies beneath relatively strong inflow. The upper-level inflow is stronger than
that for the UL quadrant for strong updrafts. There may be a possible dynamical relationship
between the downdrafts and radial flow pattern, i.e., UL may be more favorable for downdrafts
owing to upper-level inflow and/or from the possible entrainment of dryer midlevel
environmental air. However, without thermodynamic data, we are unable to evaluate the latter
mechanism. Similar to the vertical motion, the composite radial flow UR is weak and
disorganized; it is not significant due to variability when subsampled, as mentioned for the
vertical motion composite.
In summary, when comparing these radial flow cross-sections for the intense updrafts and
downdrafts, we see strong updrafts generally having stronger lower-level inflow and upper-level
outflow, forming a stronger secondary circulation. Strong downdrafts, on the other hand, exhibit
the opposite pattern (stronger lower-level outflow and upper-level inflow). However, it is unclear
whether the vertical motion is amplified by, or induces, the relative radial flow structure or if
they arise from a common cause. Finally, the role of latent heat release and dry air entrainment in
amplifying or weakening the vertical circulation cannot be fully explored without
thermodynamic coverage.

35
Chapter 6
CONCLUSIONS
We have analyzed airborne Doppler radar data from a large number of Atlantic tropical
cyclones to study the frequency distributions of reflectivity and vertical velocity, and their
variations with height, in the inner-core regions of tropical cyclones in the presence of shear. The
velocity results are summarized in the schematic shown in Figure 15. Our focus on the
distributions extends the analysis of Hence and Houze (2011), whose statistical study was limited
to reflectivity, which is the only parameter provided by the TRMM radar. The airborne Doppler
radar data provided by Reasor et al. (2013) has allowed us to examine the velocity field along
with the reflectivity so that we may test the hypotheses derived from reflectivity by Hence and
Houze (2011).
The reflectivity distributions were broadly consistent with the TRMM data as analyzed
by Hence and Houze (2011), despite the different sampling methods and sensitivities of the
satellite and aircraft radars. The nearly constant downshear presence of strong reflectivities up to
the melting layer signifies the influence of updrafts, while the increased frequency of stronger
reflectivities from DR to DL suggests stronger, more mature convection DL. Strong reflectivities
are present primarily at the lowest levels UL, due to fallout of larger hydrometeors that have
been advected around the eyewall from downshear. The dearth of intense reflectivities UR
indicates that the largest particles have mostly fallen out before reaching that quadrant and that
initiation is generally not occurring there.

36
The statistical distributions of vertical velocity indicate a strong downshear-upshear
difference in vertical motion as shown in Figure 15a. Since we have done a statistical and not a
case-study analysis, we have represented the convective differences by arrow populations, where
the length represents velocity magnitude. The distributions of arrows in the figure are meant to
be visually consistent with convection initiating DR and maturing DL. Primarily upward motion
occurs DR , with a mix of weak, moderate, and strong magnitudes. Updrafts are shown to be
more powerful DL, particularly at upper levels, likely due to a combination of precipitation
unloading and the release of latent heat of fusion. Updrafts weaken UL, before dying out almost
entirely UR. Figure 15a therefore contains fewer upward arrows in the upshear quadrants, and
those that exist are of small magnitude.
Downdrafts also exhibit systematic behavior around the eyewall, as shown in Figure 15a.
The DR quadrant has the fewest downdrafts, while UL has the greatest number. In the transition
from DR, where convection initiates, to DL, where the convection tends to mature, downdrafts
become more prominent, developing primarily at higher levels, likely as a forced stable response
to the strong, mature convective updrafts. Downdrafts do not appear frequently at lower levels,
but attenuation of the radar beams cannot be ruled out as a possible explanation for the lack of
low-level downdraft activity. This distribution analysis helps explain the reduced composite
vertical motion DL found by Reasor et al. (2013) using a similar dataset; the increased number of
downdrafts could cancel out the strong updrafts.
Deep layer shear exhibits a similar influence on the patterns of occurrence of the most
intense vertical velocities. Strong updrafts do not stray far from the eyewall and occur most often
at upper levels, likely as a result of the release of latent heat of fusion (Zipser 2003) and
precipitation unloading. They occur almost equally in the downshear quadrants, although with a

37
Figure 15. (a) Three-dimensional schematic depicting the vertical motion distribution in each quadrant. The environmental shear vector is denoted by an arrow pointing towards the top of the figure and quadrants are labeled according to their direction relative to the shear vector (DR, DL, UL, and UR). Concentric circles below the clouds show the locations of the eyewall (normalized radius values between 0.75 and 1.25), which connect to grey dashed boxes encompassing the eyewall up to 10 km altitude. Vertical arrows denote the vertical motion distribution, where size is proportional to magnitude. (b) As in (a), but illustrating the mean circulation that occurs when intense updrafts are present. Arrow width corresponds to composite velocity magnitude, as noted in the legend at the bottom. Dashed arrows refer to features that were present in the composite analysis, but were shown to not be significant. (c) As in (b), but illustrating the mean circulation that occurs when intense downdrafts are present. The question mark denotes the structure existing UR is weak, disorganized and not robust.

38
slightly greater number DL. There is a steep drop-off in frequency within the upshear quadrants,
but when strong drafts do occur, they appear in the upper levels. Strong downdrafts show a
strong preference for UL and exist over a larger radial range. Downdrafts do occur DL and UR,
but the frequency is far less and they tend to flank the edges of the eyewall.
Framing the powerful vertical motions within the context of radial flow reveals different
mean dynamical behavior in the presences intense updrafts and downdrafts. Figure 15b,c
summarizes the differing mean circulations found when intense updrafts or downdrafts are
present, with the width of the arrows corresponding qualitatively to velocity magnitude. A strong
overturning circulation exists DR. Though the shear-relative flow has diminished somewhat DL,
denoted by moderate low-level inflow and upper-level outflow, an overturning circulation is
nonetheless present near the strong composite updraft. The upper-level inflow on the inner edge
of the eyewall could be a result of divergence near the top of the strong updraft. The radial flow
pattern switches UL and the resulting low-level outflow and upper-level inflow are rather weak.
Weak radial flow breaks up the upper-level inflow just below 10 km and the low-level outflow is
reduced in the lowest layer of analysis: the overturning circulation associated with the
moderately strong upward branch of the mean flow cuts through the upshear inflow-outflow
pattern. Finally, though there is a hint of an overturning circulation UR, it was not significant and
a dashed arrow represents its uncertainty. In summary, strong updrafts are part of an overturning
mean circulation, which is superimposed on whatever background flow is present.
A distinctly different mean circulation is present when strong downdrafts occur (Figure
15c). Although the circulation DR matches what is expected from this quadrant based on the
shear-relative flow, the inferred internal details were not statistically robust, so they are marked
as uncertain. The secondary circulation does not appear DL; instead, a strong inward moving

39
downdraft flanks the inner edge of an updraft, possibly in response to the strong convection in
this quadrant. While there is a hint of an additional inward moving downdraft on the outer flank,
it is weaker and statistically uncertain. The radial flow is strongest UL, where the circulation is
the opposite of DR. Finally, due to the weak velocities and their variability when subsampled,
the behavior UR is unknown and denoted by a question mark. Overall, the mean circulation
found when intense downdrafts are present is stronger outflow at low levels and inflow at upper
levels. This updraft-downdraft structural difference is particularly noticeable UL where the
upper-level radial inflow is reduced substantially in the presence of the outflow accompanying
the strong updrafts. It is not clear from this study whether the convective lifecycle or the
dynamic forcing (i.e., upper-level inflow) is critical in determining the UL downdraft
concentration.
This study has shown that tropical cyclones can have significant asymmetries in both
their precipitation and kinematic structure involving combinations of the mean horizontal and
vertical flow. If future work (e.g. numerical modeling) reproduces the vertical velocity
distributions and quadrant varying mean circulations documented in this study, much could be
learned about the mechanisms by which shear modulates vortex tilt and storm-relative flow in
the inner-core regions of tropical cyclones. Future studies should aim for this objective. In
addition, the effect of storm strength and size on the ability of shear to modify the inner-core
structure cannot be ignored and should be investigated in future studies.

40
BIBLIOGRAPHY
Bender, M. A., 1997: The effect of relative flow on the asymmetric structure in the interior of
hurricanes. J. Atmos. Sci., 54, 703-724.
Black, M. L., R. W. Burpee, and F. D. Marks Jr., 1996: Vertical motion characteristics of
tropical cyclones determined with airborne Doppler radial velocities. J. Atmos. Sci., 53,
1887–1909.
Black, M. L., J. F. Gamache, F. D. Marks, C. E. Samsury, and H. E. Willoughby, 2002: Eastern
Pacific Hurricanes Jimena of 1991 and Olivia of 1994: The effect of vertical shear on
structure and intensity. Mon. Wea. Rev., 130, 2291–2312.
Braun, S. A., M. T. Montgomery, and Z. Pu, 2006: High-resolution simulation of Hurricane
Bonnie (1998). Part I: The organization of eyewall vertical motion. J. Atmos. Sci., 63, 19-
42.
Chen, S. Y. S., J. A. Knaff, and F. D. Marks, 2006: Effects of vertical wind shear and storm
motion on tropical cyclone rainfall asymmetries deduced from TRMM. Mon. Wea. Rev.,
134, 3190-3208.
Corbosiero, K. L., and J. Molinari, 2002: The effects of vertical wind shear on the distribution of
convection in tropical cyclones. Mon. Wea. Rev., 130, 2110-2123.
Corbosiero, K. L. and J. Molinari, 2003: The relationship between storm motion, vertical wind
shear, and convective asymmetries in tropical cyclones. J. Atmos. Sci., 60, 366-376.

41
DeMaria, M., M. Mainelli, L. K. Shay, J. A. Knaff, and J. Kaplan, 2005: Further improvements
to the Statistical Hurricane Intensity Prediction Scheme (SHIPS). Wea. Forecasting, 20,
531-543.
Didlake, A. C., Jr., and R. A. Houze Jr., 2009: Convective-scale downdrafts in the principal
rainband of Hurricane Katrina (2005). Mon. Wea. Rev., 137, 3269–3293
Fierro, A. O., J. M. Simpson, M. A. LeMone, J. M. Straka, and B. F. Smull, 2009: On how hot
towers fuel the Hadley cell: An observational and modeling study of line-organized
convection in the equatorial trough from TOGA COARE. J. Atmos. Sci.,
66, 2730-2746.
Frank, W. M., and E. A. Ritchie, 1999: Effects of environmental flow upon tropical cyclone
structure. Mon. Wea. Rev., 127, 2044–2061.
Frank, W. M., and E. A. Ritchie, 2001: Effects of vertical wind shear on the intensity and
structure of numerically simulated hurricanes. Mon. Wea. Rev., 129, 2249–2269.
Gamache, J. F., 1997: Evaluation of a fully three-dimensional variational Doppler analysis
technique. Preprints, 28th Conf. on Radar Meteorology, Austin, TX, Amer. Meteor. Soc.,
422-423.
Hence, D. A. and R. A. Houze Jr., 2011: Vertical structure of hurricane eyewalls as seen by the
TRMM Precipitation Radar. J. Atmos. Sci., 68, 1637–1652.
Heymsfield, G. M., J. B. Halverson, J. Simpson, L. Tian, and P. Bui, 2001: ER-2 Doppler radar
(EDOP) investigations of the eyewall of Hurricane Bonnie during the Convection and
Moisture Experiment-3. J. Appl. Meteor., 40, 1310-1330.

42
Heymsfield, Gerald M., Lin Tian, Andrew J. Heymsfield, Lihua Li, Stephen Guimond, 2010:
Characteristics of Deep Tropical and Subtropical Convection from Nadir-Viewing High-
Altitude Airborne Doppler Radar. J. Atmos. Sci., 67, 285-308.
Houze, R.A., Jr., 1993: Cloud Dynamics. Academic Press, 573 pp.
Jones, S. C., 1995: The volution of vortices in vertical shear: Initially barotropic vortices. Quart.
J. Roy. Meteor. Soc., 121, 821–851.
Jorgensen, D. P., 1984: Mesoscale and convective-scale characteristics of mature hurricanes. Part
II: Inner core structure of Hurricane Allen (1980). J. Atmos. Sci., 41, 1287–1311.
Lord, S. J., H. E. Willoughby and J. M. Piotrowicz, 1984: Role of parameterized ice-phase
microphysics in an axisymmetric, non-hydrostatic tropical cyclone model. J. Atmos. Sci.,
41, 2836-2848.
Marks, F. D., Jr., and R. A. Houze, Jr., 1987: Inner core structure of Hurricane Alicia from
airborne Doppler radar observations. J. Atmos. Sci., 44, 1296-1317.
Neldar, J. A., and R. Mead, 1965: A simplex method for function minimization. Comput. J., 7,
308–313.
Reasor, P. D., M. Eastin, and J. F. Gamache, 2009: Rapidly intensifying Hurricane Guillermo
(1997). Part I: Low-wavenumber structure and evolution. Mon. Wea. Rev., 137, 603-631.
Reasor, P. D., and M. D. Eastin, 2012: Rapidly intensifying Hurricane Guillermo (1997). Part II:
Resilience in Shear. Mon. Wea. Rev., 140, 425-444.
Reasor, P. D., R. Rogers, S. Lorsolo, 2013: Environmental flow impacts on tropical cyclone
structure diagnosed from airborne Doppler radar composites. Mon. Wea. Rev., 141,
2949–2969.

43
Rogers, R.F., S.S. Chen, J.E. Tenerelli, and H.E. Willoughby, 2003: A numerical study of the
impact of vertical shear on the distribution of rainfall in Hurricane Bonnie (1998). Mon.
Wea. Rev., 131, 1577-1599.
Rogers, R. F., S. Lorsolo, P. Reasor, J. Gamache, and F. Marks, 2012: Multiscale analysis of
tropical cyclone kinematic structure from airborne Doppler radar composites. Mon. Wea.
Rev., 140, 77-99.
Rogers, R. F., P. Reasor, S. Lorsolo, 2013: Airborne Doppler observations of the inner-core
structural differences between intensifying and steady-state tropical cyclones. Mon. Wea.
Rev., 141, 2970–2991.
Wu, L., S. A. Braun, J. Halverson, and G. Heymsfield, 2006: A numerical study of Hurricane
Erin (2001). Part I: Model verification and storm evolution. J. Atmos. Sci., 63, 65–86.
Yuter, S. E., and R. A. Houze Jr., 1995: Three-dimensional kinematic and microphysical
evolution of Florida cumulonimbus. Part II: Frequency distributions of vertical velocity,
reflectivity, and differential reflectivity. Mon. Wea. Rev., 123, 1941–1963.
Zipser, E. J., 2003: Some Views On “Hot Towers” after 50 Years of Tropical Field Programs and
Two Years of TRMM Data. Meteorological Monographs, 29, 49-49.