Carrie’s first 4 science test scores were 92, 85, 89 and 90. What score does she need to get on...
15
BELL WORK Carrie’s first 4 science test scores were 92, 85, 89 and 90. What score does she need to get on her 5 th test in order to have a mean of 90? Show your work! 92+85+89+90+x = 90 5 92+85+89+90+x = 450 356 + x = 450 x = 94
-
Upload
darrell-domenic-york -
Category
Documents
-
view
212 -
download
0
Transcript of Carrie’s first 4 science test scores were 92, 85, 89 and 90. What score does she need to get on...

BELL WORK
Carrie’s first 4 science test scores were 92, 85, 89 and 90. What score does she need to get on her 5th test in order to have a mean of 90? Show your work!
92+85+89+90+x = 90 5
92+85+89+90+x = 450
356 + x = 450
x = 94

COMPARING TWO GRAPHS

So far, we have looked at single graphs and made inferences about one population. Now we are going to compare two graphs and make inferences about two populations.
We will see examples of a:Double Line PlotBack-to-back Stem and Leaf PlotDouble Bar Graph/HistogramDouble Box Plot
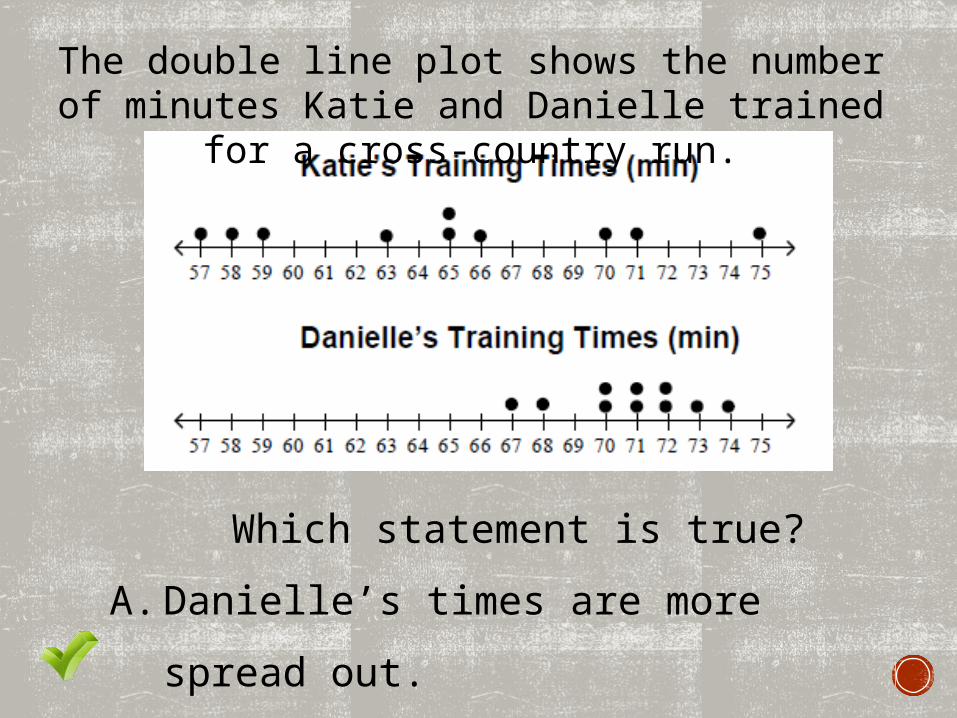
Which statement is true?
A. Danielle’s times are more spread out.
B. Katie’s times are more spread out.
The double line plot shows the number of minutes Katie and Danielle trained for a
cross-country run.
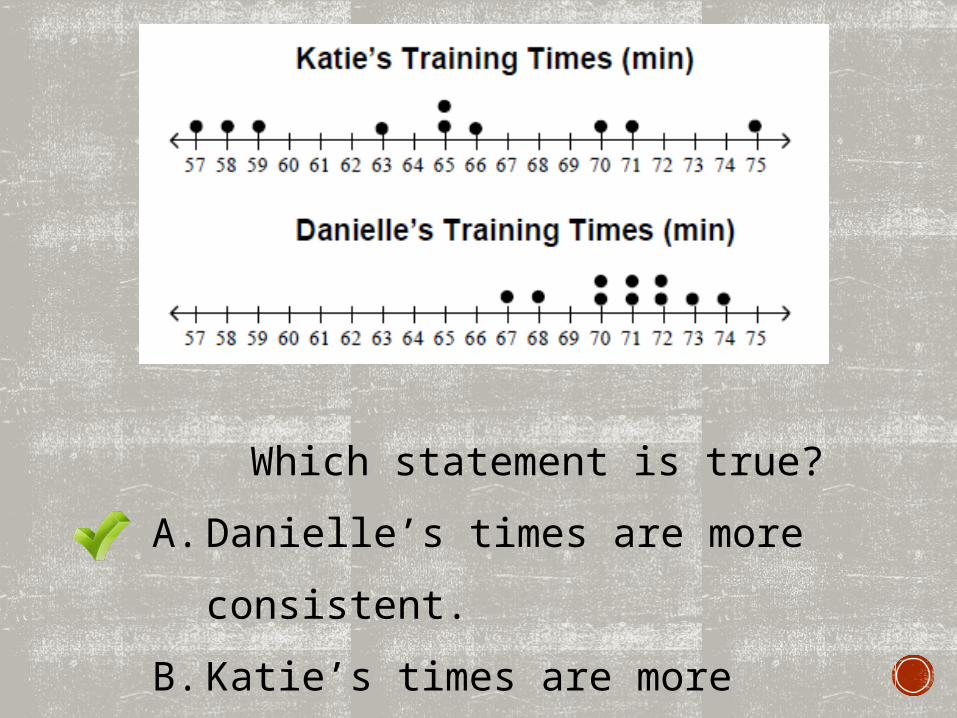
Which statement is true?
A. Danielle’s times are more
consistent.
B. Katie’s times are more consistent.
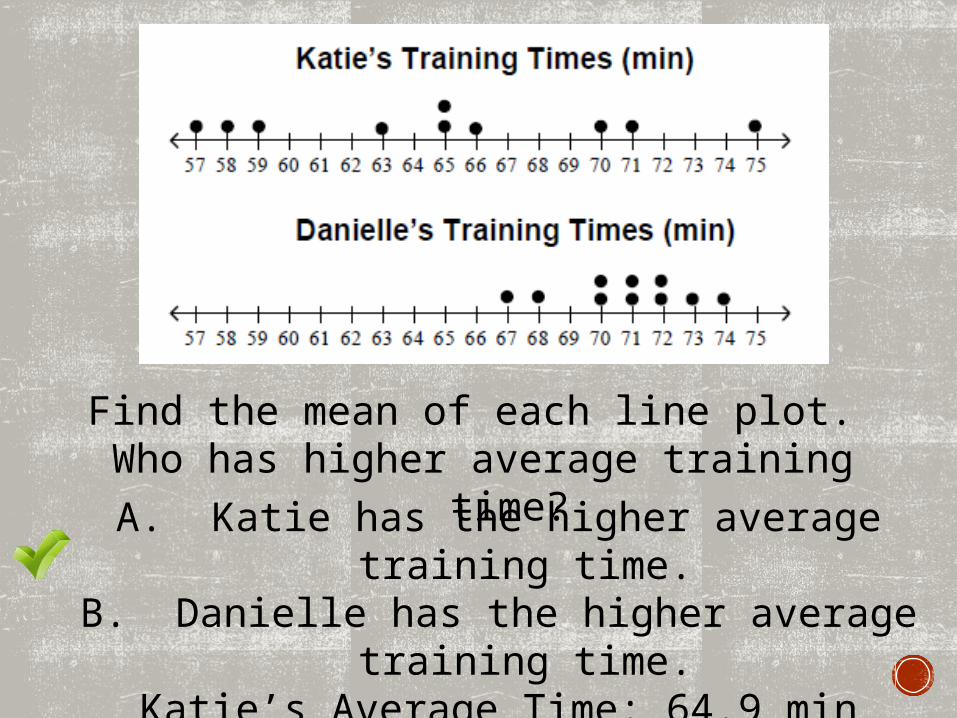
Find the mean of each line plot. Who has higher average training time?
A. Katie has the higher average training time.
B. Danielle has the higher average training time.
Katie’s Average Time: 64.9 minDanielle’s Average Time: 70.8 min
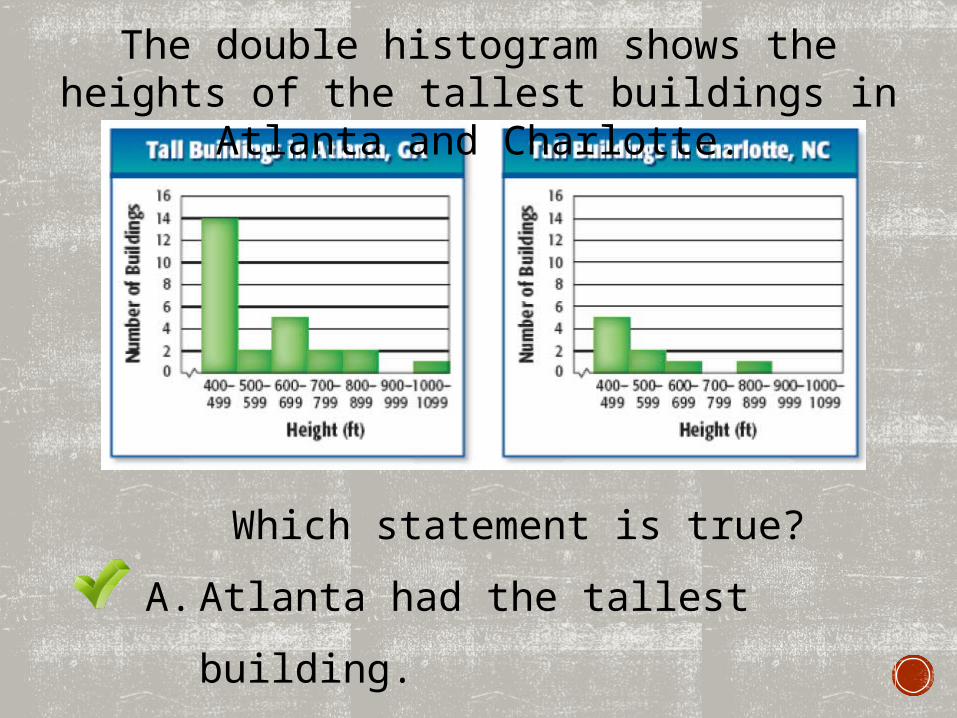
The double histogram shows the heights of the tallest buildings in Atlanta and
Charlotte.
Which statement is true?
A. Atlanta had the tallest building.
B. Charlotte had the tallest building.
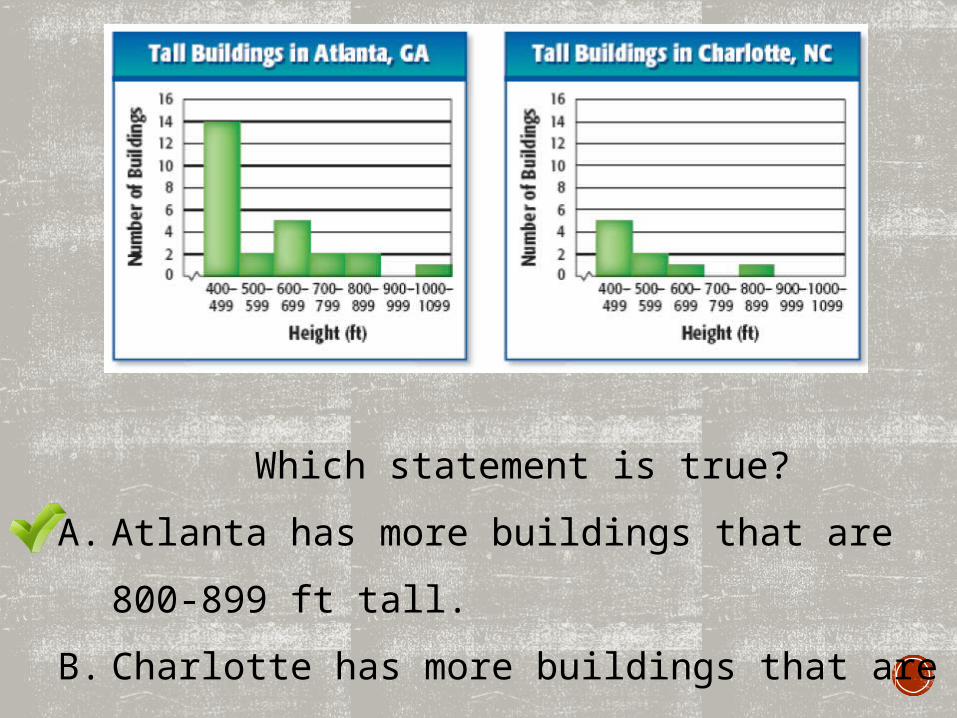
Which statement is true?
A. Atlanta has more buildings that are 800-899 ft
tall.
B. Charlotte has more buildings that are 800-899
ft tall.
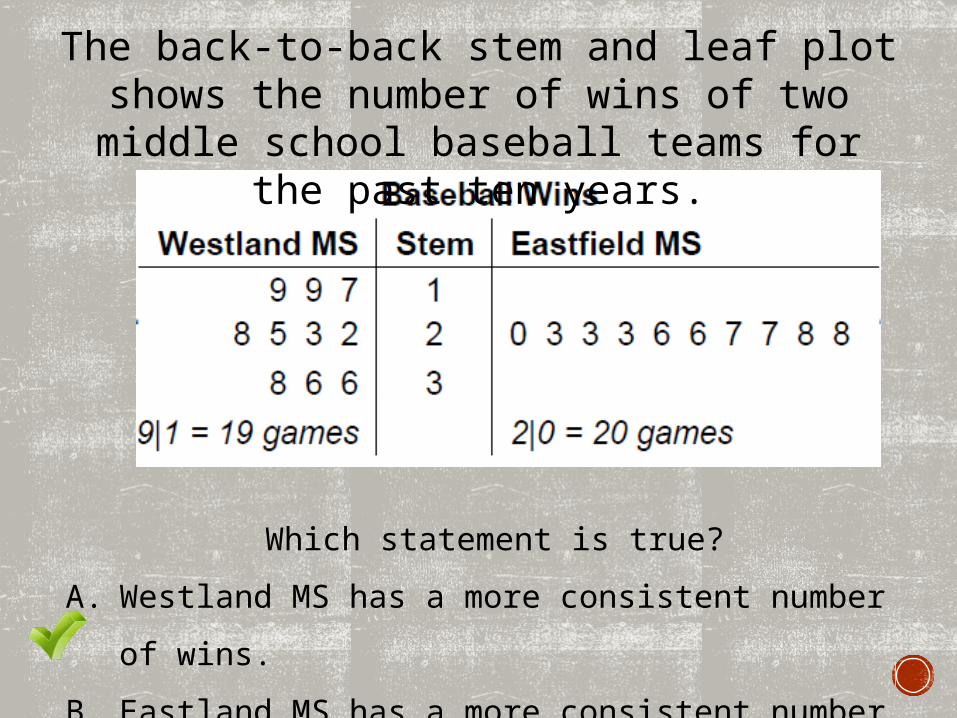
The back-to-back stem and leaf plot shows the number of wins of two middle school
baseball teams for the past ten years.
Which statement is true?
A. Westland MS has a more consistent number of
wins.
B. Eastland MS has a more consistent number of
wins.

Find the median number of wins for each
team.Westland: 24 games
Eastfield: 26 games
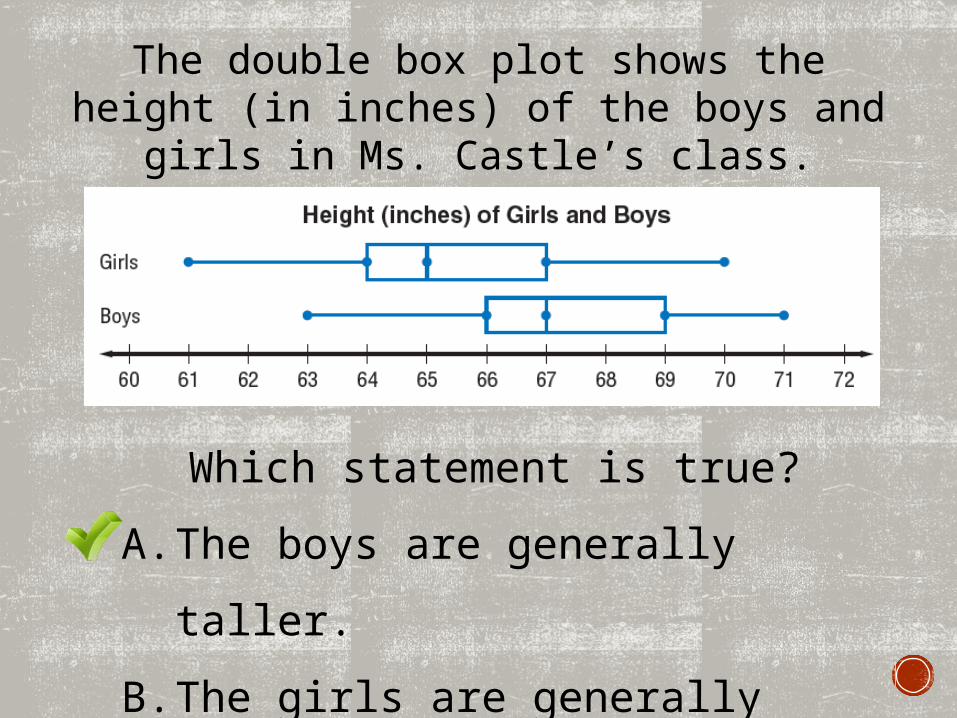
The double box plot shows the height (in inches) of the boys and girls in Ms.
Castle’s class.
Which statement is true?
A. The boys are generally taller.
B. The girls are generally taller.
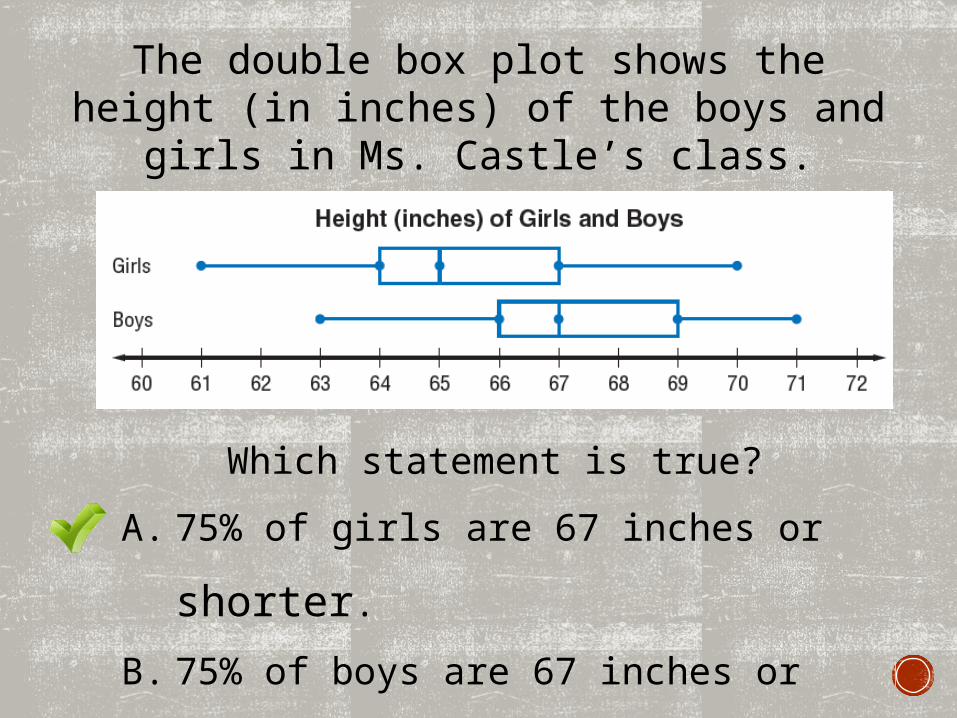
The double box plot shows the height (in inches) of the boys and girls in Ms.
Castle’s class.
Which statement is true?
A. 75% of girls are 67 inches or
shorter.
B. 75% of boys are 67 inches or
shorter.
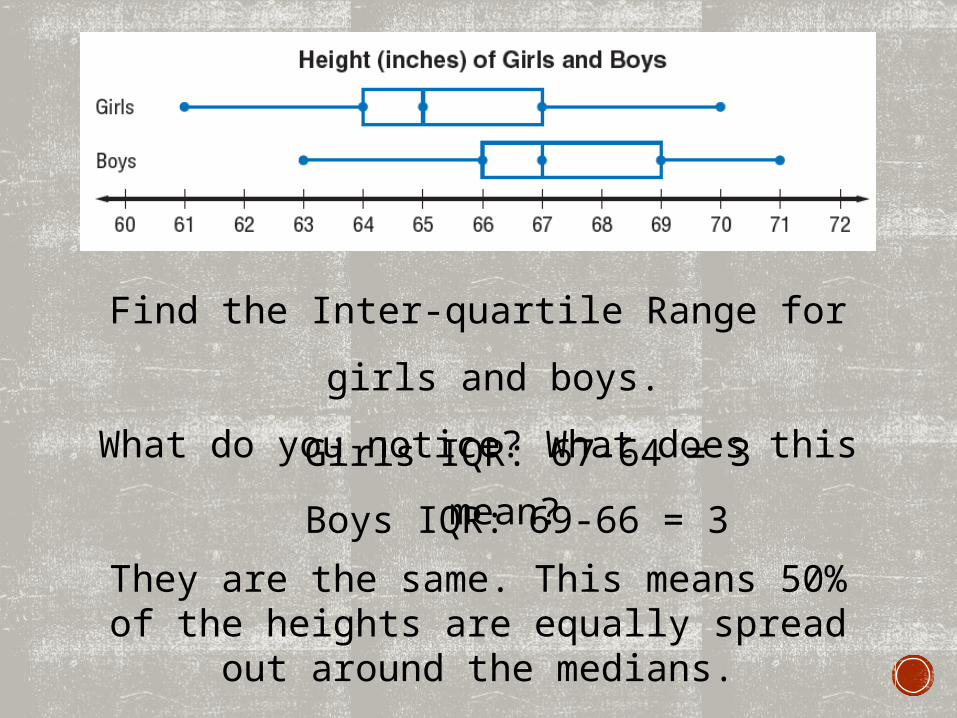
Find the Inter-quartile Range for girls and
boys.
What do you notice? What does this mean?Girls IQR: 67-64 = 3
Boys IQR: 69-66 = 3
They are the same. This means 50% of the heights are equally spread out around the
medians.

If there are 16 girls in the class, how
many are 65 inches or taller?
50% of 16 = 8 girls

PRACTICE:COMPARING TWO GRAPHS WORKSHEET