Caio Martora… · ./ %0& 1 %2& !"# %3& 4 4 * '
6
Delta Ferrite Formation in Austenitic Stainless Steel Castings Angelo Fernando Padilha 1,a ; Caio Fazzioli Tavares 2,b ; Marcelo Aquino Martorano 1,c 1 Department of Metallurgical and Materials Engineering, University of São Paulo, Brazil 2 Açotécnica S.A., Jandira, SP, Brazil a [email protected] ; b [email protected] ; c [email protected] Keywords: Austenitic stainless steel; microstructure; solidification; delta ferrite Abstract. The effects of chemical composition and cooling rate on the delta ferrite formation in austenitic stainless steels have been investigated. Ferrite fractions measured by a magnetic method were in the range of 0 to 12% and were compared with those calculated by empirical formulas available in the literature. The delta ferrite formation (amount and distribution) was strongly affected by the steel chemical composition, but less affected by the cooling rate. Among several formulas used to calculate the amount of delta ferrite, the best agreement was obtained with those proposed independently by Schneider and Schoefer, the latter being recommended in the ASTM 800 standard. Introduction The properties and performance of austenitic stainless steels are strongly related to their microstructures, especially the amount and distribution of delta ferrite, which, in the case of castings, depends chiefly on chemical composition and on the cooling rate during solidification [1]. The number of relevant chemical components in austenitic stainless steels is often more than five, but published phase diagrams with more than four components are rarely available to predict the phases and their amounts on the steel microstructure. As a result, empirical maps were developed to indicate the amount and types of phases from indexes based on the alloy chemical composition. One of the best-known maps was proposed by Schaeffler [2,3], who divided the alloying elements into two groups, namely, ferrite and austenite stabilizers, whose effects could be predicted by formulas of chromium and nickel equivalent, respectively. The Schaeffler diagram was further improved by DeLong [4], Espy [5], and others and became an ASTM standard [6]. In the literature on solidification of austenitic stainless steels, there are no technical papers in which measurements of both cooling rate and the complete chemical composition are carried out. In the present work, sixteen heats of five different austenitic stainless steel types were cast and their complete chemical compositions (16 elements) were determined. The effects of the chemical composition and the cooling rate were analyzed and the experimental results compared with fractions of delta ferrite calculated using empirical formulas available in the literature. Casting and preparation of samples Stainless steel charges of approximately 100 kg were melted in a vacuum induction furnace and their chemical compositions (16 elements) were determined by optical emission spectroscopy analysis of a small portion of the melt (Table 1). Materials Science Forum Vols. 730-732 (2013) pp 733-738 © (2013) Trans Tech Publications, Switzerland doi:10.4028/www.scientific.net/MSF.730-732.733 All rights reserved. No part of contents of this paper may be reproduced or transmitted in any form or by any means without the written permission of TTP, www.ttp.net. (ID: 143.107.101.223-20/08/12,19:11:26)
Transcript of Caio Martora… · ./ %0& 1 %2& !"# %3& 4 4 * '

Delta Ferrite Formation in Austenitic Stainless Steel Castings
Angelo Fernando Padilha1,a; Caio Fazzioli Tavares2,b;
Marcelo Aquino Martorano1,c 1Department of Metallurgical and Materials Engineering, University of São Paulo, Brazil
2Açotécnica S.A., Jandira, SP, Brazil
[email protected] ; [email protected] ; [email protected]
Keywords: Austenitic stainless steel; microstructure; solidification; delta ferrite
Abstract. The effects of chemical composition and cooling rate on the delta ferrite formation in
austenitic stainless steels have been investigated. Ferrite fractions measured by a magnetic method
were in the range of 0 to 12% and were compared with those calculated by empirical formulas
available in the literature. The delta ferrite formation (amount and distribution) was strongly
affected by the steel chemical composition, but less affected by the cooling rate. Among several
formulas used to calculate the amount of delta ferrite, the best agreement was obtained with those
proposed independently by Schneider and Schoefer, the latter being recommended in the ASTM
800 standard.
Introduction
The properties and performance of austenitic stainless steels are strongly related to their
microstructures, especially the amount and distribution of delta ferrite, which, in the case of
castings, depends chiefly on chemical composition and on the cooling rate during solidification [1].
The number of relevant chemical components in austenitic stainless steels is often more than five,
but published phase diagrams with more than four components are rarely available to predict the
phases and their amounts on the steel microstructure. As a result, empirical maps were developed to
indicate the amount and types of phases from indexes based on the alloy chemical composition. One
of the best-known maps was proposed by Schaeffler [2,3], who divided the alloying elements into
two groups, namely, ferrite and austenite stabilizers, whose effects could be predicted by formulas
of chromium and nickel equivalent, respectively. The Schaeffler diagram was further improved by
DeLong [4], Espy [5], and others and became an ASTM standard [6].
In the literature on solidification of austenitic stainless steels, there are no technical papers in which
measurements of both cooling rate and the complete chemical composition are carried out. In the
present work, sixteen heats of five different austenitic stainless steel types were cast and their
complete chemical compositions (16 elements) were determined. The effects of the chemical
composition and the cooling rate were analyzed and the experimental results compared with
fractions of delta ferrite calculated using empirical formulas available in the literature.
Casting and preparation of samples
Stainless steel charges of approximately 100 kg were melted in a vacuum induction furnace and
their chemical compositions (16 elements) were determined by optical emission spectroscopy
analysis of a small portion of the melt (Table 1).
Materials Science Forum Vols. 730-732 (2013) pp 733-738© (2013) Trans Tech Publications, Switzerlanddoi:10.4028/www.scientific.net/MSF.730-732.733
All rights reserved. No part of contents of this paper may be reproduced or transmitted in any form or by any means without the written permission of TTP,www.ttp.net. (ID: 143.107.101.223-20/08/12,19:11:26)
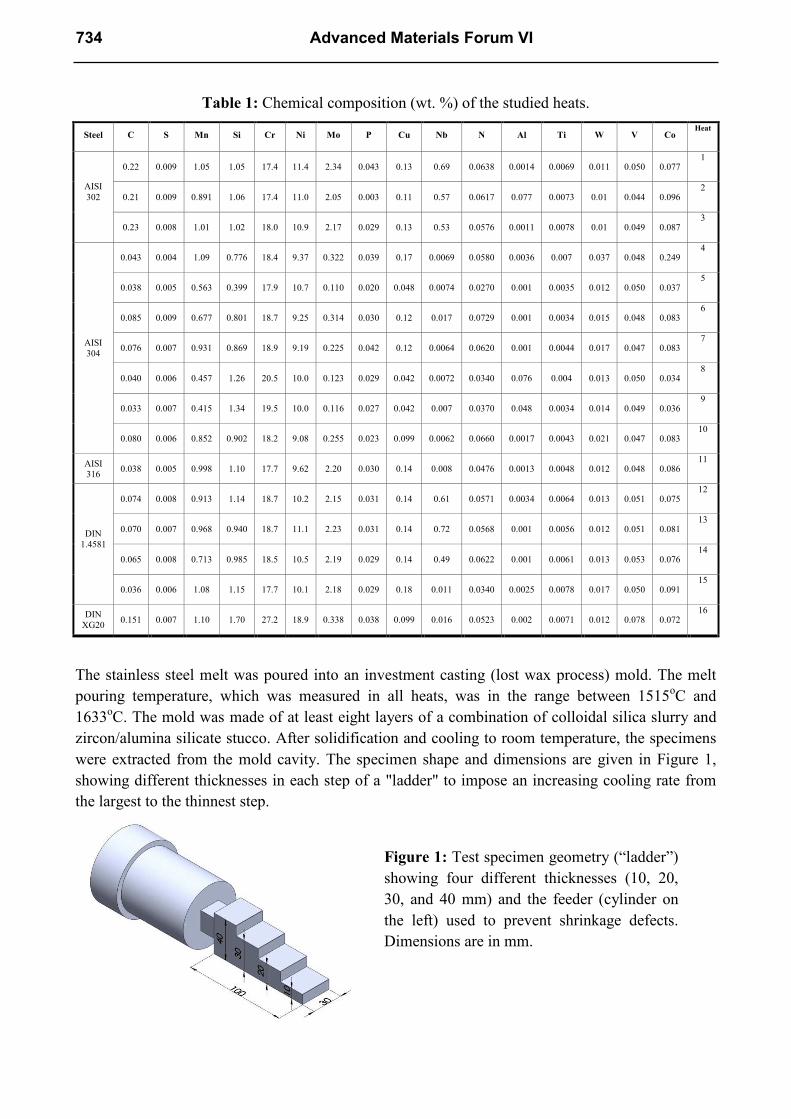
Table 1: Chemical composition (wt. %) of the studied heats.
The stainless steel melt was poured into an investment casting (lost wax process) mold. The melt
pouring temperature, which was measured in all heats, was in the range between 1515oC and
1633oC. The mold was made of at least eight layers of a combination of colloidal silica slurry and
zircon/alumina silicate stucco. After solidification and cooling to room temperature, the specimens
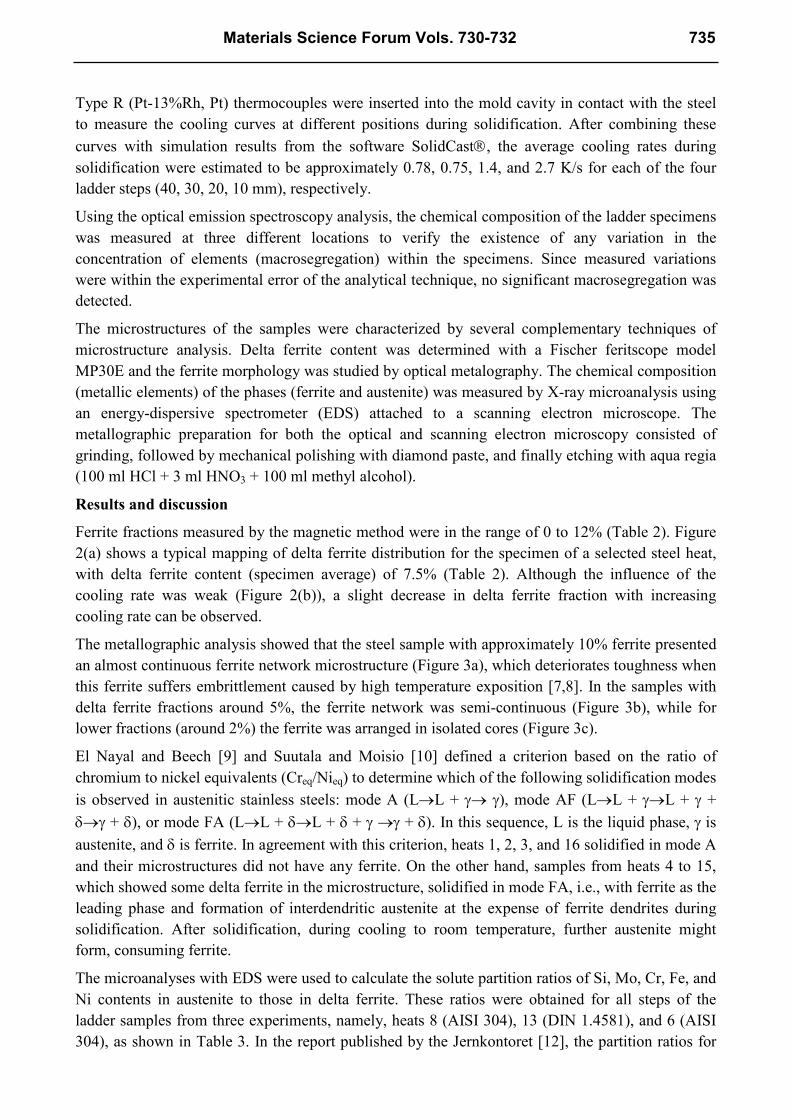
were extracted from the mold cavity. The specimen shape and dimensions are given in Figure 1,
showing different thicknesses in each step of a "ladder" to impose an increasing cooling rate from
the largest to the thinnest step.
Figure 1: Test specimen geometry (“ladder”)
showing four different thicknesses (10, 20,
30, and 40 mm) and the feeder (cylinder on
the left) used to prevent shrinkage defects.
Dimensions are in mm.
Steel C S Mn Si Cr Ni Mo P Cu Nb N Al Ti W V Co Heat
AISI
302
0.22 0.009 1.05 1.05 17.4 11.4 2.34 0.043 0.13 0.69 0.0638 0.0014 0.0069 0.011 0.050 0.077 1
0.21 0.009 0.891 1.06 17.4 11.0 2.05 0.003 0.11 0.57 0.0617 0.077 0.0073 0.01 0.044 0.096 2
0.23 0.008 1.01 1.02 18.0 10.9 2.17 0.029 0.13 0.53 0.0576 0.0011 0.0078 0.01 0.049 0.087 3
AISI
304
0.043 0.004 1.09 0.776 18.4 9.37 0.322 0.039 0.17 0.0069 0.0580 0.0036 0.007 0.037 0.048 0.249 4
0.038 0.005 0.563 0.399 17.9 10.7 0.110 0.020 0.048 0.0074 0.0270 0.001 0.0035 0.012 0.050 0.037 5
0.085 0.009 0.677 0.801 18.7 9.25 0.314 0.030 0.12 0.017 0.0729 0.001 0.0034 0.015 0.048 0.083 6
0.076 0.007 0.931 0.869 18.9 9.19 0.225 0.042 0.12 0.0064 0.0620 0.001 0.0044 0.017 0.047 0.083 7
0.040 0.006 0.457 1.26 20.5 10.0 0.123 0.029 0.042 0.0072 0.0340 0.076 0.004 0.013 0.050 0.034 8
0.033 0.007 0.415 1.34 19.5 10.0 0.116 0.027 0.042 0.007 0.0370 0.048 0.0034 0.014 0.049 0.036 9
0.080 0.006 0.852 0.902 18.2 9.08 0.255 0.023 0.099 0.0062 0.0660 0.0017 0.0043 0.021 0.047 0.083 10
AISI
316 0.038 0.005 0.998 1.10 17.7 9.62 2.20 0.030 0.14 0.008 0.0476 0.0013 0.0048 0.012 0.048 0.086
11
DIN
1.4581
0.074 0.008 0.913 1.14 18.7 10.2 2.15 0.031 0.14 0.61 0.0571 0.0034 0.0064 0.013 0.051 0.075 12
0.070 0.007 0.968 0.940 18.7 11.1 2.23 0.031 0.14 0.72 0.0568 0.001 0.0056 0.012 0.051 0.081 13
0.065 0.008 0.713 0.985 18.5 10.5 2.19 0.029 0.14 0.49 0.0622 0.001 0.0061 0.013 0.053 0.076 14
0.036 0.006 1.08 1.15 17.7 10.1 2.18 0.029 0.18 0.011 0.0340 0.0025 0.0078 0.017 0.050 0.091 15
DIN
XG20 0.151 0.007 1.10 1.70 27.2 18.9 0.338 0.038 0.099 0.016 0.0523 0.002 0.0071 0.012 0.078 0.072
16
734 Advanced Materials Forum VI
Type R (Pt-13%Rh, Pt) thermocouples were inserted into the mold cavity in contact with the steel
to measure the cooling curves at different positions during solidification. After combining these
curves with simulation results from the software SolidCast, the average cooling rates during
solidification were estimated to be approximately 0.78, 0.75, 1.4, and 2.7 K/s for each of the four
ladder steps (40, 30, 20, 10 mm), respectively.
Using the optical emission spectroscopy analysis, the chemical composition of the ladder specimens
was measured at three different locations to verify the existence of any variation in the
concentration of elements (macrosegregation) within the specimens. Since measured variations
were within the experimental error of the analytical technique, no significant macrosegregation was
detected.
The microstructures of the samples were characterized by several complementary techniques of
microstructure analysis. Delta ferrite content was determined with a Fischer feritscope model
MP30E and the ferrite morphology was studied by optical metalography. The chemical composition
(metallic elements) of the phases (ferrite and austenite) was measured by X-ray microanalysis using
an energy-dispersive spectrometer (EDS) attached to a scanning electron microscope. The
metallographic preparation for both the optical and scanning electron microscopy consisted of
grinding, followed by mechanical polishing with diamond paste, and finally etching with aqua regia
(100 ml HCl + 3 ml HNO3 + 100 ml methyl alcohol).
Results and discussion
Ferrite fractions measured by the magnetic method were in the range of 0 to 12% (Table 2). Figure
2(a) shows a typical mapping of delta ferrite distribution for the specimen of a selected steel heat,
with delta ferrite content (specimen average) of 7.5% (Table 2). Although the influence of the
cooling rate was weak (Figure 2(b)), a slight decrease in delta ferrite fraction with increasing
cooling rate can be observed.
The metallographic analysis showed that the steel sample with approximately 10% ferrite presented
an almost continuous ferrite network microstructure (Figure 3a), which deteriorates toughness when
this ferrite suffers embrittlement caused by high temperature exposition [7,8]. In the samples with
delta ferrite fractions around 5%, the ferrite network was semi-continuous (Figure 3b), while for
lower fractions (around 2%) the ferrite was arranged in isolated cores (Figure 3c).
El Nayal and Beech [9] and Suutala and Moisio [10] defined a criterion based on the ratio of
chromium to nickel equivalents (Creq/Nieq) to determine which of the following solidification modes
is observed in austenitic stainless steels: mode A (L→L + γ→ γ), mode AF (L→L + γ→L + γ +
δ→γ + δ), or mode FA (L→L + δ→L + δ + γ →γ + δ). In this sequence, L is the liquid phase, γ is
austenite, and δ is ferrite. In agreement with this criterion, heats 1, 2, 3, and 16 solidified in mode A
and their microstructures did not have any ferrite. On the other hand, samples from heats 4 to 15,
which showed some delta ferrite in the microstructure, solidified in mode FA, i.e., with ferrite as the
leading phase and formation of interdendritic austenite at the expense of ferrite dendrites during
solidification. After solidification, during cooling to room temperature, further austenite might
form, consuming ferrite.
The microanalyses with EDS were used to calculate the solute partition ratios of Si, Mo, Cr, Fe, and
Ni contents in austenite to those in delta ferrite. These ratios were obtained for all steps of the
ladder samples from three experiments, namely, heats 8 (AISI 304), 13 (DIN 1.4581), and 6 (AISI
304), as shown in Table 3. In the report published by the Jernkontoret [12], the partition ratios for
Materials Science Forum Vols. 730-732 735

chromium and nickel were: Crδ/Crγ = 1.2 and Niδ/Niγ = 0.5 (steel AISI 304), and Crδ/Crγ = 1.3 and
Niδ/Niγ = 0.6 (steel DIN 1.4583). These values are in reasonable agreement with those reported in
Table 3 for the present work samples.
Table 2: Delta ferrite content measured with the feritscope in the ladder steps of different
thicknesses from samples of different heats. The average value and standard deviation are shown
for each step and an average for all steps of the same ladder sample (same heat) is also given.
Heat
Thickness (mm)
Average Standard
Deviation
10 20 30 40
Average Standard
Deviation Average
Standard
Deviation Average
Standard
Deviation Average
Standard
Deviation
1 0 0 0 0 0 0 0 0 0 0
2 0 0 0 0 0 0 0 0 0 0
3 0 0 0 0 0 0 0 0 0 0
4 4.2 0.3 4.5 1.0 4.6 1.1 4.6 0.7 4.5 0.9
5 1.8 0.4 1.8 0.5 1.8 0.7 1.5 0.6 1.7 0.6
6 1.5 0.3 1.8 0.5 2.2 0.6 2.4 0.9 2.1 0.7
7 2.8 0.3 3.0 0.8 3.4 0.9 3.1 0.9 3.1 0.9
8 10.6 0.6 11.2 1.2 11.6 1.1 11.3 1.7 11.3 1.3
9 6.5 0.4 7.2 0.6 7.5 0.9 7.8 1.0 7.5 0.9
10 1.8 0.6 1.7 0.8 1.8 0.8 1.7 0.6 1.8 0.7
11 8.1 0.5 8.8 0.7 9.1 1.1 10.1 1.4 9.2 1.3
12 7.1 0.4 8.1 0.5 8.1 0.9 8.3 0.9 8.1 0.9
13 3.6 1.1 4.7 0.8 5.0 0.8 5.3 0.7 4.9 0.9
14 6.2 0.7 7.1 0.9 7.3 1.1 6.5 2.1 6.8 1.5
15 8.1 0.6 8.8 0.6 9.7 1.3 9.6 1.4 9.3 1.3
16 0 0 0 0 0 0 0 0 0 0
(a)
(b)
Figure 2: Measurements of delta ferrite fraction: (a) on the central longitudinal section of specimen
obtained from heat 9 (AISI 304); (b) as a function of cooling rate (R) for heats in Table 1.
736 Advanced Materials Forum VI

Figure 3: Morphology of delta ferrite (cooling rate 2.7 K/s): (a) continuous network (heat 8 AISI
304); (b) semi-continuous network (heat 13 DIN 1.4581); and (c) isolated cores (heat 6 AISI 304).
Table 3: Solute partition ratios of Si, Mo, Cr, Fe, and Ni concentrations in ferrite (δ) to those in
austenite (γ) of three different steel ladder samples in the four steps of different thicknesses.
Heat Thickness (mm) Siδδδδ/Siγγγγ Moδδδδ/Moγγγγ Crδδδδ/Crγγγγ Feδδδδ/Feγγγγ Niδδδδ/Niγγγγ
8
(AISI 304)
10 0.95 1.07 1.33 1.00 0.38
20 1.04 4.22 1.41 0.98 0.42
30 1.16 0.68 1.42 0.96 0.43
40 1.32 3.00 1.35 0.97 0.48
Average 1.12 2.24 1.38 0.98 0.43
13
(DIN 1.4581)
10 0.91 1.15 1.26 0.97 0.59
20 1.18 1.78 1.38 0.97 0.42
30 1.37 2.37 1.36 0.96 0.42
40 1.10 0.81 1.28 0.94 0.77
Average 1.14 1.53 1.32 0.96 0.55
6
(AISI 304)
10 1.10 1.88 1.33 0.91 0.30
20 1.09 1.28 1.39 0.96 0.35
30 1.11 0.70 1.28 0.99 0.33
40 1.50 - 1.60 0.87 0.57
Average 1.20 1.29 1.4 0.93 0.39
Figure 4: Delta ferrite content as a function of the ratio of chromium to nickel equivalents
calculated from the formulas proposed by (a) Schaeffler [2,3] and (b) Schoefer [6].
(a) (b) (c)
Materials Science Forum Vols. 730-732 737
The influence of steel chemical composition on the delta ferrite content was noteworthy. Using
suggested formulas for nickel and chromium equivalents, the correlation between the ferrite content
and the ratio of chromium to nickel equivalents were examined (Figure 4). Among the many tested
formulas for predicting delta ferrite content, the two that showed better correlation coefficients are
those proposed by Schneider and Schoefer; the latter being recommended by the ASTM A800
Standard [6]. In Figure 4, examples of strong and weak correlations are given using the formulas
proposed by Schaeffler [2,3] and Schoefer [6].
Conclusions
The following conclusions can be drawn: (a) the amount and distribution of delta ferrite was
strongly affected by the steel chemical composition, but less affected by the cooling rate; (b) among
several formulas used to predict the delta ferrite content, the best agreement was obtained with
those proposed independently by Schneider and Schoefer; the latter is recommended in the ASTM
800 standard; (c) In the heats 4 to 15, which probably solidified following the sequence L → L + δ
→ L + δ + γ → γ + δ, the solute partition ratios of Si, Mo, Cr, Fe, and Ni contents in ferrite to those
in austenite are in agreement with values published in the literature for similar steel compositions.
References
[1] A. F. Padilha and P. R. Rios, Decomposition of austenite in austenitic stainless steels, ISIJ
International 42 (2002) 325 - 337.
[2] A. L. Schaeffler, Selection of austenitic electrodes for welding dissimilar metals, Welding
Journal Res. Suppl. 26 (1947) 603s - 620s.
[3] A. L. Schaeffler, Constitution diagram for stainless steel weld metal, Metal Progress 56 (1949)
680 - 680B.
[4] W. T. DeLong, Ferrite in austenitic stainless steel weld metal, Welding Journal Res. Suppl. 53
(1974) 273s – 286s.
[5] R. H. Espy, Weldability of nitrogen-strengthened stainless steels, Welding Journal Res. Suppl.
61 (1982) 149s - 156s.
[6] ASTM 800/A 800M-01, Standard practice for steel casting, austenitic alloy, estimating ferrite
content thereof, American Society for Testing and Material.
[7] T. Yamada, S. Okano and H. Kuwano, Mechanical property and microstructural change by
thermal aging of SCS14A cast duplex stainless steel, J. Nucl. Mater. 350 (2006) 47 - 55.
[8] A. F. Padilha, D. M. Escriba, E. Materna-Morris, M. Rieth and M. Klimenkov, Precipitation in
AISI 316L(N) during creep tests at 550 and 600 ºC up to 10 years, J. Nucl. Mater. 362 (2007)
132 - 138.
[9] G. El Nayal and J. Beech, Relationship between composition, impurity content, cooling rate, and
solidification in austenitic stainless-steels, Mater. Sci. Tech. 2 (1986) 603 - 610.
[10] N. Suutala and T. Moisio, Use of chromium and nickel equivalents in considering
solidification phenomena in austenitic stainless steels, In: Solidification Technology in the
Foundry and Cast House, The Metals Society, Coventry (1980) 310 - 314.
[11] A guide to the solidification of steels, Jernkontoret, Stockholm (1977) 91-101.
738 Advanced Materials Forum VI