' c USAAVLABS TECHNICAL REPORT 66-17 - … c / V USAAVLABS TECHNICAL REPORT 66-17 HIGH-PERFORMANCE...
102
' c / V USAAVLABS TECHNICAL REPORT 66-17 HIGH-PERFORMANCE ÜH-1 COMPOUND HELICOPTER MANEUVER FLIGHT TEST PROGRAM By J. F. Van Wyckhou^e c L ^THYH O I E FOR FEDhJiiAL SfUENHFlC A^D __ TBCHmCA'. l-y.-^iMATlr.N Hardcopy February 1966 Microfuahei U. S. ARMY AVIATION MATERIEL [^ORATORIES FORT EÜSTIS, VIRGINIA Ct-rt?^ / CONTRACT DA 44-177-AMC-162(T) BELL HELICOPTER COMPANY A DIVISION OF BELL AEROSPACE CORPORATION FORT WORTH, TEXAS Distribution of this document is unlimited.
Transcript of ' c USAAVLABS TECHNICAL REPORT 66-17 - … c / V USAAVLABS TECHNICAL REPORT 66-17 HIGH-PERFORMANCE...

' c ■
/ V
USAAVLABS TECHNICAL REPORT 66-17
HIGH-PERFORMANCE ÜH-1 COMPOUND HELICOPTER MANEUVER FLIGHT TEST PROGRAM
By
J. F. Van Wyckhou^e c L ^THYH O I E
FOR FEDhJiiAL SfUENHFlC A^D __ TBCHmCA'. l-y.-^iMATlr.N Hardcopy
February 1966
Microfuahei
U. S. ARMY AVIATION MATERIEL [^ORATORIES
FORT EÜSTIS, VIRGINIA
Ct-rt?^ /
CONTRACT DA 44-177-AMC-162(T) BELL HELICOPTER COMPANY
A DIVISION OF BELL AEROSPACE CORPORATION FORT WORTH, TEXAS
Distribution of this document is unlimited.

·•·
THIS DOCUMENT IS BEST QUALITY AVAILABLE. THE COPY
FURNISHED TO DTIC CONTAINED
A SIGNIFICANT NUMBER OF
PAGES WHICH DO NOT
REPRODUCE LEGIBLYo

Disclaimers
The findings in this report are not to be construed as an official Depart- ment of the Army position unless so designated by other authorized documents.
When Government drawings, specifications, or other data are used for any purpose other than in connection with a definitely related Govern- ment procurement operation, the United States Government thereby incurs no responsibility nor any obligation whatsoever; and the fact that the Government may have formulated, furnished, or in any way supplied the said drawings, specifications, or other data is not to be regarded by implication or otherwise as in any manner licensing the holder or any other person or corporation, or conveying any rights or permission, to manufacture, use, or sell any patented invention that may in any way be related thereto.
Disposition Instructions
Destroy this report when no longer needed. Do not return it to the originator.
|
| ..:■•
1 i -; V: ',■ 1 «
-, | f-'i'.
. t:l
f v 1 t ''
|
m r
DEPARTMENT OF THE ARMY U. S. ARMY AVIATION MATERIEL LABORATORIES
FORT EUSTIS. VIRGINIA 23604
This report has been reviewed by the U. S. Army Aviation Materiel Laboratories and is considered to be technically sound. The report is being disseminated for the advance of knowledge and stimulation of ideas.
The work described herein was conducted under the Army's continuing exploratory development effort in support of future high-speed rotary-wing aircraft. As such, it contains reliable flight test experience directly applicable to design criteria of future Army aircraft.
I.,:

Task IPL2140IAIU31I Gontracc DA i+4-I77-AMG-L62(T)
USAAVLABS Technical Report 66-17 February 1966
HIGH-PERFORMANCE UH-I GOMPOUND HELICOPTER MANEUVER FLIGHT TEST PROGRAM
(Bell Helicopter Report 533-099-025)
by
J. F. Van Wyckhouse
Prepared by
BELL HELICOPTER COMPANY A Division of Bell Aerospace Corporation
Fort Worth, Texas
for
I U.S. ARMY AVIATION MATERIEL LABORATORIES
FORT EUSTIS, VIRGINIA
Distribution of this doaument is unlimited.
r

\
SUMMARY
The high-performance UH-1 compound helicopter was repowered with J69-T29 turbojet auxiliary engines, and flight tests were conducted to extend, the vehicle's flight envelope, particularly with respect to maneuvers. A standard UH-1B rotor and one modified with tapered tip blades were the principal rotors tested during the program. With the tapered tip blades, the compound, helicopter was flown to a true airspeed of 221 knots and significant reductions in power and control loads were obtained. The rise in power required and the rotor controls load associated with compressibility were delayed by about .05 Mach number with the tapered tip blades.
Approximately 55 maneuvers, encompassing a velocity-normal acceleration envelope exceeding 2g,s at 190 knots, were accomplished to define the maneuver capabilities of the test vehicle. Various types of maneuvers were investigated. The cyclic turn was the principal maneuver tested, as it best represents how compound rotorcraft will be flown. The lift of the various components of the machine is defined herein, and. it is shown that the rotor provides the largest incre- ment of normal load factor during a maneuver. For a rotor- controlled compound helicopter, rotor lift capability will establish the maneuver characteristics of the machine.
The rotor and control loads and. cockpit vibration data were evaluated and used for trends to define rotor limits. Although the measured loads were well below structural limits, the chord load was characterized by an "abrupt rise" after which a small increase in rotor lift would have resulted in structural damage. This characteristic of the chord load provided a basis for defining the maximum limits of the test helicopter. A normal maneuver limit and a structural limit thrust coefficient are defined as a function of advance ratio and. airframe drag. The normal maneuver limit is a design value which assures nondamaging loads and. acceptable vibration levels. The structural limits are based on load levels that would be considered acceptable only for structural demonstrations or in case of extreme emergency. Although rotor system dynamics, blade twist, planform, airfoil section, etc., will influence the values of limiting thrust coefficients, it is believed that the effects of these will be small, and with proper inter- pretation the limiting tc shown herein is- generally applicable to all rotorcraft.
in
.iu^nmrtiK"

■
■;.
FOREWORD
This report summarizes the results of a flight research program conducted to obtain test data on the high speed and maneuver capability of rotary-wing compound, aircraft. The program was accomplished by Bell Helicopter Company under USAAVLABS Contract DA 4i+-177-AMG-162(T) (Reference 1). The work conducted under this program is an extension of the high-performance helicopter (HPH) flight research program conducted under Contract DA 44-177-TC-711 (Reference 2) and reported by References 3 and k.
Design and fabrication of the auxiliary engine installation and control system modifications commenced upon receipt of the contract on 14 April 1964. Ground and flight tests of the engine installation began on 25 July 1964. The flight test program as originally contracted was completed 7 April 1965. Additional flight tests as authorized under modifica- tion five were completed 20 August 1965.
The program was conducted under the technical cognizance of Mir. G. N. Smith of the Applied Aeronautics Division of USAAVLABS. Principal Bell Helicopter Company personnel associated with the program were Messrs. W. Cresap, L. Hartwig, W. Jennings, R. Lynn, L, Rohrbough, and J. F. Van Wyckhouse.
'^^l9IK'r'^™'v""

■■f'lv mm. aim
u a)
a o o
•r-l r-l
X
X) c o
e 8 a) ü c CO e o
u a)
i .d bO
•H
VI
-
, l-t-

, r*- " "*«nff«»Mw
i
CONTENTS
Page
SUMMARY iii
FOREWORD v
LIST OF ILLUSTRATIONS viii
LIST OF SYMBOLS xii
INTRODUCTION I
DESCRIPTION OF TEST VEHICLE 2
INSTRUMENTATION 5
FLIGHT TESTS 7
FLIGHT TEST RESULTS AND DISCUSSION .... 9
Performance ........ 9
Steady-State Structural Loads and Vibrations 10
Maneuvers ......... 12
Stability and Control 18
CONCLUSIONS 23
REFERENCES 2k
DISTRIBUTION 87
Vll

ILLUSTRATIONS
Figure Page
Frontispiece High-Performance Compound Helicopter vi
1 General Arrangement of the Test Helicopter , , . . .... 28
2 J69-T29 Auxiliary Engine Installation . 29
3 Auxiliary Thrust vs ToNj Jet . . . .30
4 Tapered Tip Main Rotor Blade . . .31
5 Airspeed Calibration . .... 32
6 Total Power and Distribution - Level Flight 33
7 Shaft Horsepower Required - Test and Calculated 34
8 Main Rotor Yoke Moments ..... 35 i
9 Control System Loads . . . . .36
10 Tail Rotor Loads and Flapping . . .37
11 Vibration Characteristics in High-Speed Level Flight . 38
12 Airspeed Range vs Auxiliary Engine RPM . 39
13 Test Velocity - Normal Acceleration Envelope .... .... 40
14 Rotor Lift vs Steady Yoke Beam Bending Moment 41
■
15 Lift Distribution Durim; Maneuvers at 186-Knot Entry Airsp-ec" 42
16 Time History of Right Cyclic Turn, 95% Nj Jet 43
Vlll
_ar.i--fc. -■

Figure
17
18
19
20
21
22
23
2k
25
26
27
28
29
30
31
Time History of Right Cyclic Turn, 98% Nj Jet
Page
47
Maximum Rotor Thrust Coefficients . . .51
Vibration Characteristics During a High- Speed. Maneuver ...... . . 52
Vibration Level vs Rotor Thrust Coefficients . 53
Control Load vs Rotor Thrust Coefficient 98% Nj Jet 5k
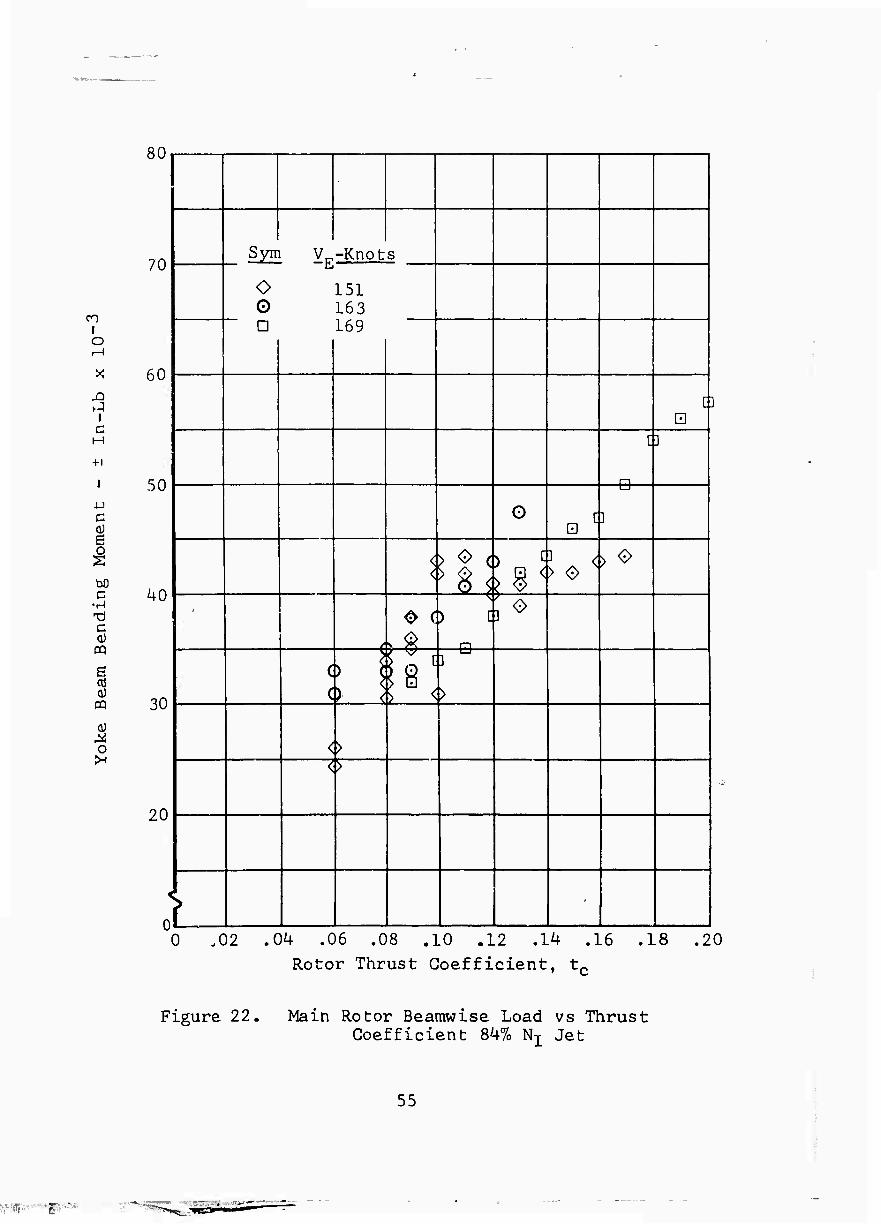
Main Rotor Beamwise Load, vs Thrust Coefficient 8k% Ni Jet 55
Main Rotor Beamwise Load vs Thrust Coefficient 87% Nj Jet 56
Main Rotor Beamwise Load vs Thrust Coefficient 90% Nj Jet 57
Main Rotor Beamwise Load vs Thrust Coefficient 95% Nj Jet 58
Main Rotor Beamwise Load vs Thrust Coefficient 98% Nj Jet 59
Main Rotor Chordwise Load, vs Thrust Coefficient 84% Nj Jet 60
Main Rotor Chordwise Load, vs Thrust Coefficient 87% Nj Jet 61
Main Rotor Chordwise Load vs Thrust Coefficient 90% Nj Jet 62
Main Rotor Chordwise Load vs Thrust Coefficient 95% Nj Jet 63
Main Rotor Chordwise Load vs Thrust Coefficient 98% Nj Jet 6k
IX

Figure Page
32 Limiting Rotor Thrust Coefficients . . .65
33 Limiting Rotor Thrust Coefficients . . .66
34 Roll Control Response ...... 67
35 Loc.a Factor Control Sensitivity . . . .68
36 Longitudinal Response, 152 Knots, Forward Pulse ........ 69
37 Longitudinal Response, 159 Knots, Aft Pulse .... .... 70
38 Longitudinal Response, 169 Knots, Forward Pulse . . . . . . . .71
39 Longitudinal Response, 170 Knots, Aft Pulse 72
40 Longitudinal Response, 183 Knots, Forward Pulse ........ 73
41 Longitudinal Response, 184 Knots, Aft Pulse 74
42 Lateral Response, 161 Knots, Right Pulse . 75
43 Lateral Response, 159 Knots, Left Pulse . . 76
44 Lateral Response, 174 Knots, Right Pulse . 77
45 Lateral Response, 174 Knots, Left Pulse . . 78
46 Lateral Response, 185 Knots, Right Pulse . 79
47 Lateral Response, 184 Knots, Left Pulse . . 80
48 Directional Response, 162 Knots, Right Pulse 81

Figure
49
50
51
52
53
Directional Response, 162 Knots, Left Pulse
Directional Response Right Pulse .
Directional Response Left Pulse
Directional Response Right Pulse .
Directional Response Left Pulse
171 Knots, • •
171 Knots, • •
180 Knots, • •
182 Knots,
Page
. 82
. 83
. 84
. 85
. 86
I
XI
rsxa ■ •"■• ■%:
SYMBOLS
b Number of blades
c Rotor blade chord, feet
GT Thrust coefficient, L/nR2 p (0 R)2
L Rotor lift, pounds
NR Rotor speed, rpm
N-j- Engine speed, rpm
R Rotor radius, feet
t Rotor thrust coefficient, 2 G^/a
V Rotor forward speed, feet/second
V,p True airspeed, knots
VE Entry airspeed, (V-p)
A Increment
M Advance ratio, V/ÜR
p Air density, slugs/cubic feet
a Rotor solidity, bc/VR
i// Blade azimuth angle, degrees*
(2 Rotor rotational speed, radians/second
r Convergence time constant **
* (Measured from downwind position in direction of rotation)
** (Time to reach 63.3 percent of final value)
Xll
^f

:■
INTRODUCTION
In August 1961, a high-performance research helicopter program was initiated, which substantiated the validity of predicted trends with respect to increased speed, range, and productivity and rotor Loads reduction (Reference 3). In late 1962, the program was extended to include the flight test of the high-performance vehicle with a wing and auxil- iary J69-T9 engines. During these tests the compound heli- copter was flown to a level-flight true airspeed of 186 knots, and mild maneuvers and simulated power failures were investigated at speeds to 177 knots. It was found (Reference 4) that the structural loads, vibration characteristics, and stability and control of the vehicle were satisfactory for all conditions tested and that, with the exception of the control loads, the rotor system loads and cockpit vibrations were lower than those of the UH-1B at its power limit speed. During these tests a standard UH-1B rotor system was used.
The UH-1B blades were subsequently replaced with blades having tapered thickness over the outboard 20-percent radius. With these blades, the compound helicopter was flown to a true airspeed of 193 knots, and significant reductions were realized in the control loads and power requirements as compared to the standard blades. It was concluded that higher speed and increased load capability can be achieved by compounding the helicopter and that this can be accomplished without increased vibrations and structural loads, or compromise of the autorotational safety characteristics of the helicopter (Reference k).
In April 1964, additional tests were contracted (Reference 1) for the exploration of the maneuver flight envelope of the test vehicle. For this program the high-performance UH-1 compound helicopter was reconfigured with J69-T29 turbojet engines. The major portion of the program was con- ducted with a set of the tapered tip blades installed in the UH-1B hub. During these tests a maximum speed of 221 knots was obtained in a slight dive and the maneuver envelope was defined for airspeeds to about 210 knots. To allow a meaningful definition of rotor capability, this was accom- plished with the rotor carrying a significant portion of the machine gross weight and providing a large contribution to the net propulsive force. The results of this work are reported herein.
••,

1- 1
DESCRIPTION OF THE TEST VEHICLE
The basic test vehicle used for this program was the high- performance compound helicopter as described in the Phase II High-Performance Helicopter report (Reference 4) except for the auxiliary engine installation. The general arrange- ment of the test helicopter is shown by Figure 1. Following are brief descriptions of the various components of the aircraft.
FUSELAGE
The basic fuselage is YH-40 (Serial No. 56-6723) with UH-1B dynamic components modified into a high-performance con- figuration. The principal modifications include a tilting pylon installation, new fixed and rotating controls, exter- nal pylon and aft body fairings, and a cambered vertical fin. A detailed description of these modifications is given in Reference 3,
WING INSTALLATION
The wing installation consists of airframe-mounted support structure, incidence controls, and right- and left-hand removable wing panels. The wing panel incidence controls are coupled with the main rotor controls such that the wing panels move differentially with a lateral cyclic input, and together with a collective input. A full lateral stick in- put produces a 6-degree (±3 degrees from neutral) wing inci- dence, differential. The wind incidence is coupled through a slip clutch with the main rotor collective control such that the wing incidence changes 20 degrees for a 50-percent col- lective input. The wing incidence increases to +10 degrees with a 50-percent or greater up collective input and reduces to -10 degrees with a 50-percent or greater down collective input. The reduction in wing incidence with reduced col- lective was provided to maintain satisfactory rotor rpm control during autorotation.
AUXILIARY ENGINE INSTALLATION
The previously used J69-T9 jet engines were removed and replaced with the more powerful J69-T29 jet engines. The modifications required for installation of the J69-T29 engines consisted mainly of fabricating new forward mount- ing rings, new aft engine mounts, and new engine cowling.

The engine-mount pylon fairing and the fuselage-installed engine-mount structure for the J69-T9 engine installation were used with only minor modifications. The aft cabin door's width was reduced k inches to provide opening clear- ance with the engine air inlets. The engine control panel on the pilot's pedestal was modified by removing the mechanical throttles and installing electrical switches for the electric throttle controls supplied on the engines.
During the initial flight tests of the installation, slats (eyebrows) were installed on the engine pylon fairing. These slats had an approximate 8~inch chord length §.nd were installed parallel to and k inches above the contour of the pylon fairing. The purpose of these slats was to .prevent airflow separation from the engine pylon during autorotation. A more detailed discussion of this is found on page 19.
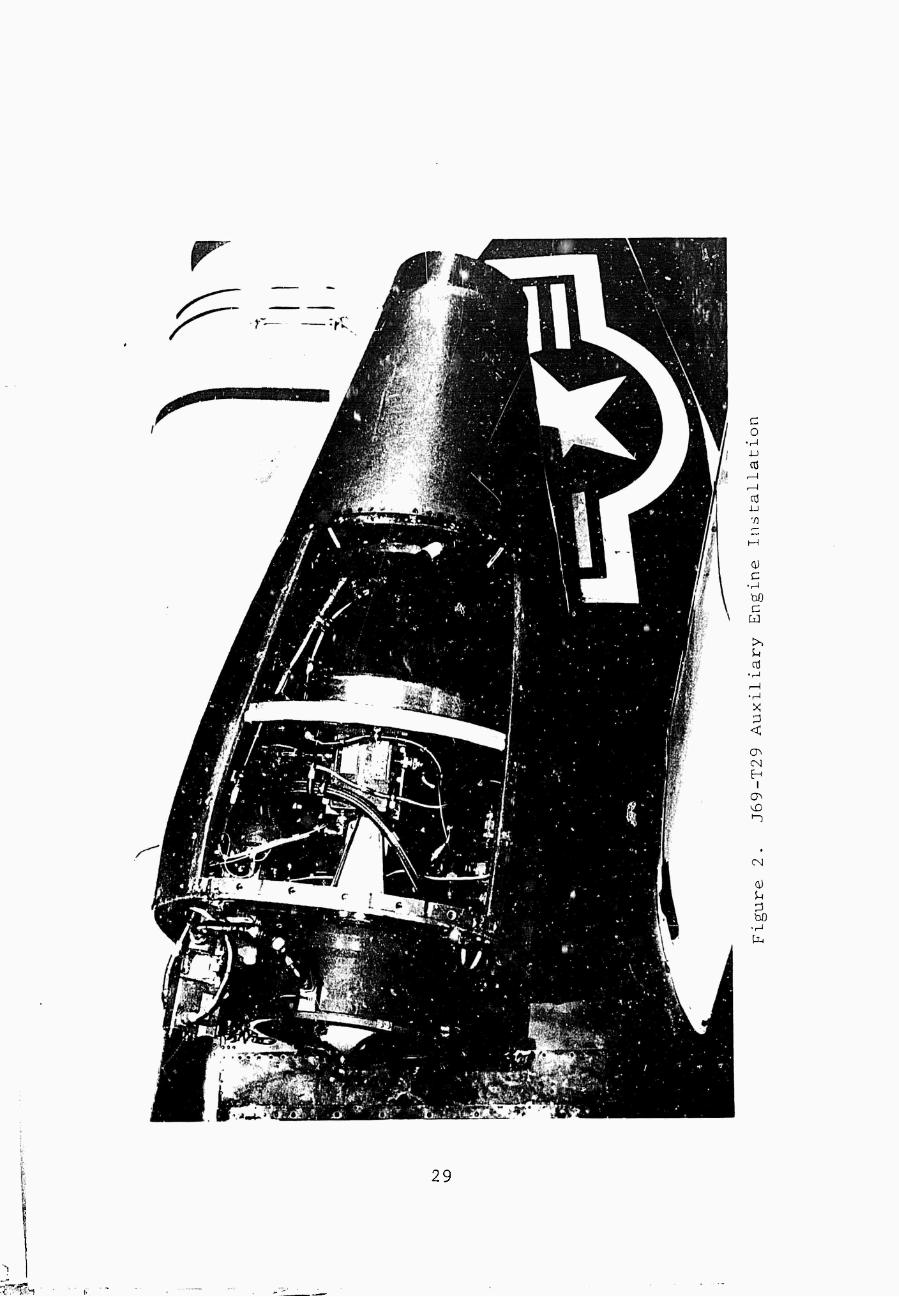
The J69-T29 engine is a limited-life drone engine with a Military power rating of 1700 pounds' static sea level thrust. The throttle actuators supplied with the engines have electrical limit-switch stops for the 84-percent and 100-percent rpm settings. These actuators were modified for the helicopter installation to provide an idle (~ 50- percent rpm) and a 95-percent rpm maximum derated power setting. The engines were originally derated to 95-percent rpm (1400 pounds, thrust) to assure satisfactory operation and adequate l^'fe for the conduct of the test program. After sufficient test experience was obtained with the installation, uprating was justified and the engines were rerated to 98-percent rpm (=1600 pounds, thrust) for the remainder of the test program. Figure 2 shows the engine installation on the helicopter. Figure 3 shows the net thrust available from a single engine as a function of forward speed and percent of maximum engine rpm (%N,).
MAIN ROTOR
The UH-1B main rotor used during the initial phase of this program was modified by the addition of the tapered tip blades and root fairings. Figure 4 shows the tapered tip blades installed on the test helicopter. The basic para- meters of this rotor as listed on the following page are the same as those of the standard rotor. The rotor system is basically a UH-1B system with the stabilizer bar removed.
r

Number of blades Airfoil designation
Root to .8R Tip
Chord Diameter Blade twist Blade area (total) Disc area Solidity Rotor rpm at a600 engine rpm Tip speed at 324 rotor rpm
NAGA 0012 NAGA 0006 mod. 21 inches ki4 feet -10 degrees 77 square feet 1521 square feet .0507 324 746 ft/sec
TAIL ROTOR
A UH-1B tail rotor was used throughout the test program. The parameters of this rotor are given below.
Number of blades 2 Airfoil designation NACA 0015 Chord 8.41 inches Diameter 8.5 feet Blade twist None Blade area (total) 5.96 square feet Disc area 56.8 square feet Solidity .105 Rotor rpm at 324 main rotor rpm 1654 Tip speed at 1654 rot( Dr rpm 736 ft/sec

INSTRUMENTATION
Instrumentation was installed to record and/or monitor the test helicopter's performance, stability, controllability, rotor and control loads, fuselage vibrations, and other information as desired during the flight test program. The information was recorded on two oscillographs installed on the wing support structure in the cabin area.
INSTRUMENTED ITEMS
Specific channels of instrumentation were provided for re- cording the following information:
Airspeed Rotor azimuth Differential torque pressure CG vertical acceleration Pilot and copilot station vertical acceleration Pitch and roll attitude Pitch and roll rate (stability and control test only) Yaw attitude (stability and control test only) Cyclic, directional, and collective control positions Main rotor flapping and feathering position Main rotor hub assembly (beam and chord) moments Main rotor blade (beam and chord) moments Main rotor control (pitch link) loads R.H. cyclic boost tube loads Pylon lift link load Tail rotor flapping Tail rotor hub chord moments Tail rotor blade beam and chord moments Horizontal stabilizer moments Horizontal stabilizer position Wing beam bending Wing position (angle of incidence) Wing angle of attack
To reduce the possibility of reading errors in data reduction, only the specific channels necessary for a particular test were connected into the oscillographs. If postflight in- spection of data indicated an area of particular concern, additional channels were connected to provide a more com- prehensive evaluation of the area in question. In general, vibration, fuselage attitude, power, rotor flapping, main

rotor yoke loads, control loads, control positions, wing loads, and wing angles of attack were recorded for each flight. Additional information was recorded as necessary throughout the test program.
AIPSPEED CALIBRATION
Airspeed calibration was accomplished by pacing the test helicopter with a T-28 aircraft from the Army Test Center at Edwards Air Force Base. The observed speeds (I. A. S. ) of bot^ aircraft were recorded at various speeds, and the T-28 observed speeds were corrected for instrument and position error and plotted against the observed airspeeds of the test helicopter. Figure 5 shows the airspeed cali- bration obtained with the T-28 pace aircraft and also the calibration obtained with the Cessna 310 pace aircraft used during the previous program.

FLIGHT TESTS
The initial flight of the high-performance helicopter re- powered with the J69-T29 engines was made on 21 July 1964. The preliminary tests were conducted with a UH-1B rotor in- stalled. The purpose of these tests was to shake down the new engine installation and to obtain baseline performance and loads data. The auxiliary engine installation required much more development time than had been originally antici- pated. Approximately 5 hours of ground and flight time was required before two acceptable engines were found. During this period three (two right, one left) engines were removed and replaced and numerous engine components were changed. Two acceptable engines were obtained late in September 1964, and. no major engine problems were encountered for the remainder cf the test program.
Under the original program plan, a contractor-owned Model 540 "doorhinge" rotor was to be the basic rotor for the maneuver tests. This rotor is described in Reference 5. The rotor was installed, and testing commenced on 18 December 1965. Preliminary testing was conducted with cold jets,and the rotor operation was found, to be satisfactory throughout the speed, range. With the addition of auxiliary propulsion, however, high control loads and fuselage vibration levels were encountered. The maximum speed, attained with this rotor was 162 knots. The cause of the high vibration level is believed to be due to a blade frequency and control system coupling at the blade pitch and loading conditions required for trim flight with auxiliary propulsion. Higher control loads also result from the wider chord of the 540 blades. (The control load component associated with the reverse flow region is strongly influenced by airspeed and the blade chord length.)
The controls coupling causes an imbalance between the control moments in the fixed, and rotating systems at the higher speeds. The existence of this phenomenon was established by resolution and comparison of the fixed system loads to the rotating system loads in terms of swashplate rolling moment during a complete revolution of the rotor. These moments were found to be equal during helicopter flight with cold jets. However, with increased speed and. the addition of auxiliary thrust, the moments were found, to be unequal and also out-of-phase. The abnormal phasing caused high oscil- latory loads in the hydraulic boost cylinders and. resulted in fatigue damage to the non-rotating controls components.
,**.■ '

It was determined that a major modification of the test vehicle's control system would be necessary to obtain an acceptable configuration for the full speed range required, for the test program. In order to continue the program, the rotor was replaced by a UH-IB rotor hub with the experimental tapered tip blades evaluated during a previous program (Reference 6).
The maneuver tests were started on 11 March and completed 8 April 1965. The program was later modified (Reference 7) to include additional flight tests for the extension of the maneuver envelope and evaluation of the dynamic stability of the test helicopter. These flights commenced 19 July and were completed 19 August 1965. A total of 21.9 flight hours was expended in performance of the contract. During the program, 2.9 hours of ground run and 9.7 hours of flight were accumulated on the auxiliary engines. Additionally, 13.8 hours (including 5.1 hours with auxiliary engines) of flight time was recorded during the contractor's independent research and development programs conducted in parallel with the contracted work.
■
8
'5-
1

FLIGHT TEST RESULTS AND DISCUSSION
PERFORMANCE
Hovering
Hovering performance data for the UH-IB and tapered tip blades are given in References 4 and 6. There are no significant differences between the UH-IB and tapered tip blades in the measured or the calculated hovering perform- ance .
Level Flight
The total power requirements for the HPH with UH-IB (standard) and. tapered tip blades are shown by Figure 6. Total power is defined as the sum of engine shaft horsepower and equivalent auxiliary jet thrust horsepower. The estimated distribution of total power at an airspeed of 217 knots is also shown. The advancing blade tip Mach number and rotor advance ratio for this condition are .958 and .505, respectively. For the distribution shown, approximately 15 percent of the total power is attributed to compressibility even with the tapered tip blades. Comparison with the power curve of the standard blades indicates the power savings resulting from the modi- fied blades. During these tests the rotor carried about 30 percent of the weight of the aircraft.
Calculations of power required were made for both standard and. tapered tip blades as shown by Figure 7. NACA 0012 airfoil section data (based, on UH-IB and HPH correlation studies) were used for the standard blade computations. For the tapered tip blade calculations, the 0012 section data were again used, but the drag divergence Mach number was increased in steps. Correlation was obtained with the drag divergence Mach number increased by 0.05. In the subsequent section it is shown that the compressibility effect on the control loads of the tapered tip blades becomes apparent at the same increment in Mach number ( AM = .05) above that of the standard blades.

\
STEADY-STATE STRUCTURAL LOADS AND VIBRATIONS
Main Rotor Yoke Moments
The compound HPH main rotor yoke beam and chord bending moments for the UH-LB and tapered tip blades are shown as a function of velocity by Figure 8. For the data shown, the rotor lift equals approximately 30 percent of the gross weight and the auxiliary propulsion thrust varies from approximately 1300 pounds at the low speed to 2800 pounds at the. high speed. For comparison, the. corresponding beam and chord moments for the UH-1B at 120 knots are approxi- mately 30,000 and 110,000 inch-pounds, respectively.
The beam moments, with a frequency principally two-per-rev, appear to be primarily a function of forward speed (or advance ratio). The chord moments with frequencies princi- pally of one-, three-, and five-per-rev are. primarily in- fluenced by blade dynamics; however, for a given system the moments are reduced, significantly with a decrease in drag (or increase in auxiliary thrust). No sharp rise in rotor chord, load was found; however, the reduction in the chord, bending moments between the standard, and tapered tip blades indicates the significance of compressibility effects.
Control Loads
Figure 9a shows the HPH pitch link loads as a function of speed with the standard and tapered tip blades installed. With the tapered tip blades there is a significant reduction in load. The control load at higher speeds is comprised of two major components: a positive pitching moment at approxi- mately ^= 270 degrees which is associated with the reversed flow region, and a negative pitching moment at approximately <A = 120 degrees which is associated with compressibility effects. The positive moment rises steadily with increasing airspeed, and. is influenced by the rotor advance ratio, rotor thrust, and auxiliary jet thrust. Figure 9b illus- trates these effects.
The negative component of control load shown by Figure 9c is nonexistent below a Mach number of .875 for the standard blades and .925 for the tapered tip blade. This load, com- ponent, which is responsible for the abrupt rise in the control load with speed, is the most positive evidence of
L0

.• V:.^~-
t:he onset of compressibility. It is with the reduction in this load component that the most significant benefit of the tapered tip blades is obtained.
With the tapered tip blades, the onset of the rapid rise in control loads is delayed approximately 35 knots ( \Mach number ~.05). As noted previously, this increment in Mach number matches that obtained during the performance correla- tion .
During the tests with tapered tip blades a maximum advancing blade, tip Mach number of .985 was obtained. With the excep- tion of the increase in control loads and power requirements, no adverse effects were noted and there is good reason to believe that supersonic blade tip operation is possible.
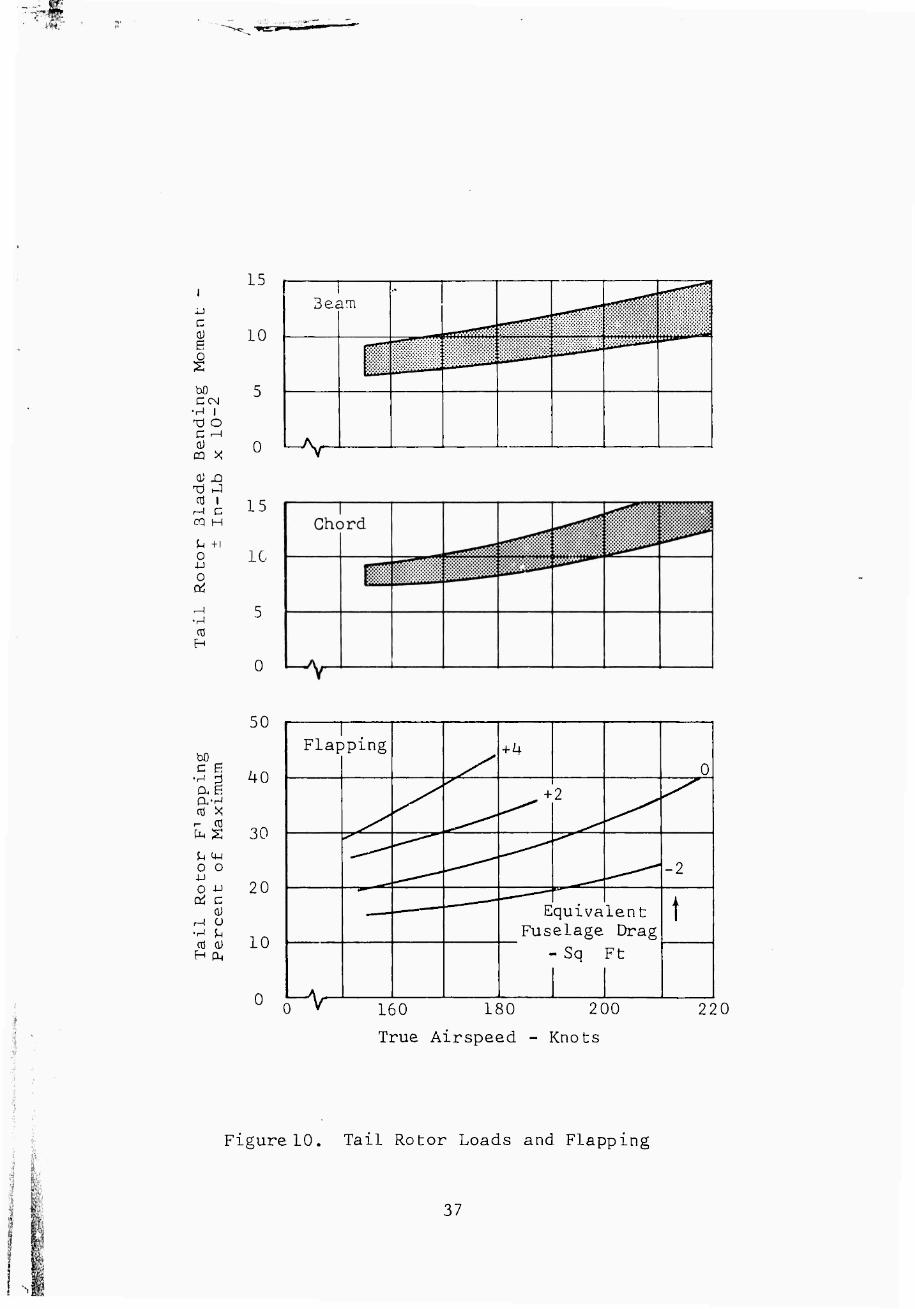
Tail Rotor Loads and Flapping
The envelope of the steady-state tail rotor loads and flap- ping obtained during this program is shown by Figure 10. The loads (blade, beam and chord bending moment) are primarily a function of airspeed. Flapping, which is influenced by both airspeed and auxiliary thrust, is shown as a function of equivalent airframe drag area. It is seen from the figure that airframe drag (or jet thrust) is the stronger influence. The tail rotor loads were not critical, and flapping was with- in acceptable limits for all combinations of airspeed and auxiliary thrust tested.
Vibration
The vibration characteristics of the test helicopter with tapered tip blades are shown by Figure II. The envelope of pilot station over-all vertical vibration and the principal harmonics of that vibration are shown as a function of speed for the various usable combinations of rotor power, jet thrust, wing lift, etc., tested. Figure 11 shows the usable range of airspeed, associated with auxiliary jet throttle settings. Flight could be maintained at somewhat lower speeds than shown by the control limit of Figure II; however, below these speeds the fuselage angles were excessive, con- trol of the aircraft became sluggish, and the load and vibra- tion levels increased.
The over-all vibration level remains nearly constant to about 190 knots and rises abruptly thereafter. Generally, the top of the band (Figure II) is associated with lower jet thrusts.
II

It should be noted that the over-all vibration level is not the summation of the various components due to the phase relationship of the harmonics. The pilot's comments rela- tive to vibration level were that the ride was good up to 180 knots with the standard blades and to 200 knots with the tapered tip blades.
The major rotor excitation, two-per-rev, is seen to remain nearly constant throughout the speed range. The four- and six-per-rev vibration levels rise rapidly above a speed of about 190 knots. The one-, three-, and five-per-rev com- ponents of the vibration levels are not shown,as in all cases they were less than -r-.05g. Longitudinal and lateral vibra- tions were determined, by pilot's comment to be insignificant and therefore were not recorded.
MANEUVERS
The principal objective of the subject test program was to extend the flight envelope of the machine, particularly with respect to maneuvers. To accomplish this,approximately 55 maneuvers were executed in a progressive buildup fashion, within a speed range of 151 to 209 knots. From these tests, the characteristics of the research vehicle during maneuvers, including the effects of the wing and auxiliary propul; '„n system, are defined.
The maneuvers included, cyclic pull-ups, pushovers, and turns, and collective pull-ups. The cyclic turn was the principal maneuver investigated, as this best represents how a high- speed, rotorcraft will be flown (i.e., with cyclic control and auxiliary propulsion throttle).
As the. electrically-adjusted throttle system of the J69-T29 engine did not provide adequate response for precise in- flight control of the auxiliary thrust, all maneuvers were flown with a fixed throttle setting of the jet engines. Consequently, there were small variations in airspeed during the maneuvers. To account for this variation in airspeed in the data presentation, maneuvers were made at five auxiliary jet throttle settings throughout the speed-range capability of the machine with each of those settings. Phis provided a 10- to 20-knot overlap of speed for the various throttle settings., and. this, in turn, allowed a complete mapping of the effect of the jet thrust throughout the over-all speed range. As noted earlier, Figure 12 shows the useful speed range of the test aircraft.
12

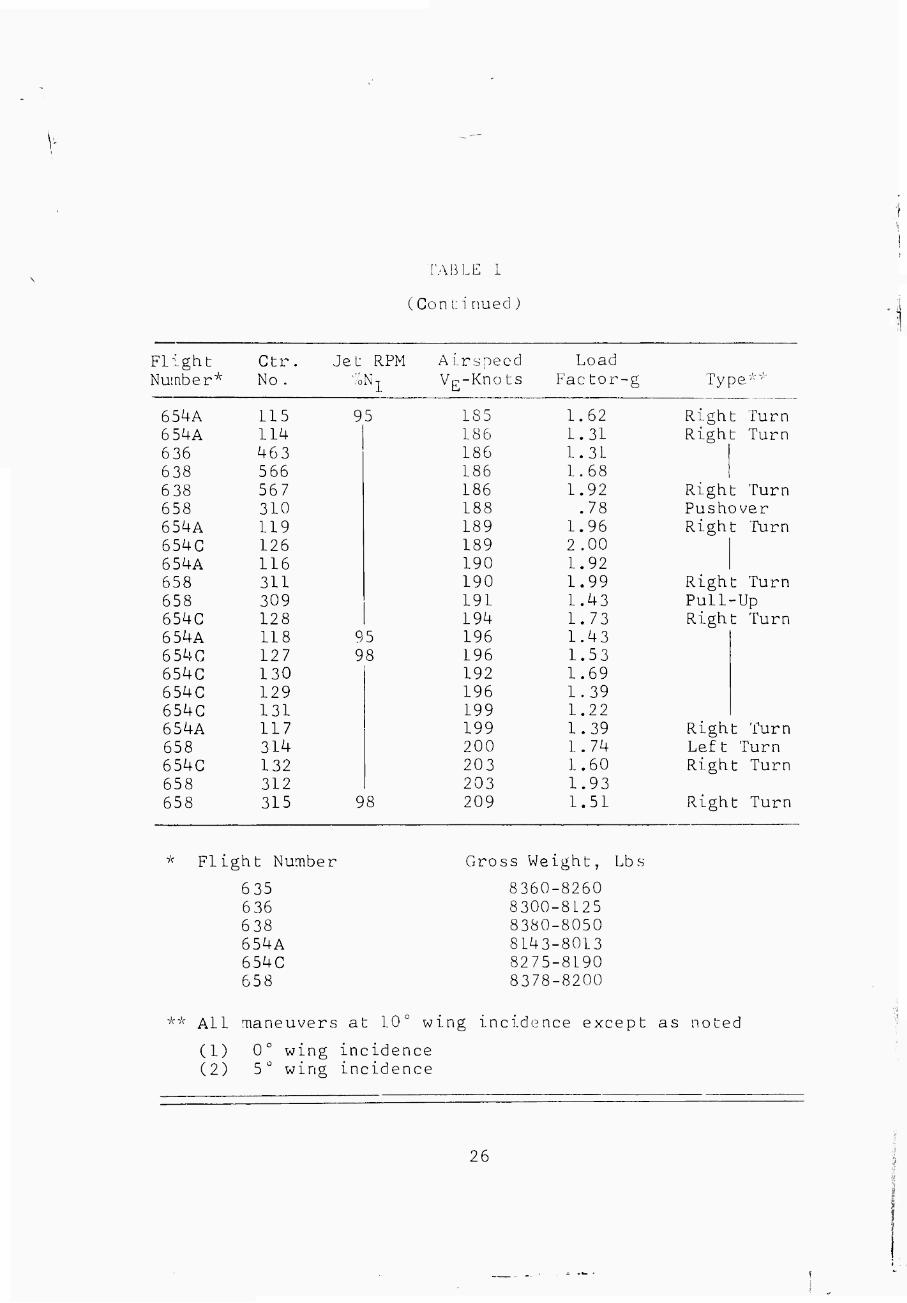
Figure 13 shows the test velocity - normal acceleration envelope. All the maneuver points are shown on the plot. The entry airspeeds, maximum load factors, auxiliary engine throttle settings, and the flight and counter numbers for
' all maneuvers are given in Table I.
Lift Distribution
In evaluating the maneuver performance of a compound heli- copter, it is necessary that the distribution of lift be- tween the rotor and airframe be known. With this, a true assessment of the rotor performance and limits can be made. To obtain this distribution, the lifts (normal force) pro- duced by the rotor, airframe, and jet engines were obtained independently and their sum was compared to measured accel- erometer data.
Airframe Lift - The airframe (wing) lift is defined by wing beam bending moments. During the previous program (Reference 4) good, r urrelation of measured and. calculated lift data was obtained, for the individual wing and auxiliary propulsion configurations, but not for the full compound, (wing and jet) configuration. The discrepancy between the measured and calculated airframe lift for this configuration was attrib- uted to wing-engine-nacelle-fuselage interference effects. It was noted, however, that good agreement was obtained, if total airframe lift was defined in the same manner as used for the wing-only configuration. Subsequent wind tunnel tests (Reference 8) also indicated that the airframe lift of the wing-only and full compound configurations could be based on wing bending moment. The wind, tunnel data show that the lift angle-of-attack curves for two configurations are essentially the same except at extreme fuselage angles of attack.
With the test results and. theoretical wing lift distribution, the airframe lift is defined with reasonable accuracy from the wing bending moment data. The technique for determining wing (airframe) lift is described in Reference k. The air- frame lift determination can be further simplified, when the wing incidence is fixed, and. the fuselage angle-of-attack variation is small. This was the case for the majority of the maneuvers accomplished, during the subject program. Under these, conditions, an adequate determination of airframe lift is obtained, by multiplying the measured, bending moment at the wing root by a constant. For the maneuvers flown with a 10-degree wing incidence, the value of this constant is .06. This value defines the airframe lift of the UH-1 compound
13
.s;2!._ .*....i'j*^

V
with reasonable accuracy for fuselage angles of attack to about 5 degrees (15-degree wing angle of attack). At higher fuselage angles or lower wing incidence, the value of the constant must be reduced.
Rotor Lift - Rotor lift is determined from the steady yoke beam bending moment. Data were obtained in hover at various gross weights and rotor rpm to establish the relationship of the yoke beam bending moment to rotor lift. Additionally, data were obtained at various rotor rpm during ground runs with the rotor in flat pitch. Figure Ik shows the variation in rotor lift (tapered tip blades) as a function of yoke beam bending moment and rotor rpm.
Auxiliary Jet Engine Lift (Normal Component) - The auxiliary jet engine centerlines are located at an angle of +7 degrees (nose up) relative to a fuselage waterline. Additionally, certain combinations of auxiliary thrust and airspeed result in high fuselage angles of attack. Under these conditions the component of lift produced by the auxiliary thrust can represent a significant percentage of the total lift. This component is defined as the jet thrust t les the sine of the fuselage angle plus 7 degrees.
Lift Summation - Representative samples of maneuver time histories showing the component lift distributions, their summation and a comparison with e.g. accelerometer data are shown by Figure 15. Over one-third of all maneuvers per- formed were evaluated in this manner, and in all cases good agreement was found between the accelerometer data and the summation of the individual lift components. The lift distribution is thus substantiated, permitting valid assess- ment of the rotor performance during maneuvers.
Rotor Lift Contribution During Maneuvers
From the lift distribution and other data, it is found that for the test aircraft, which is designed, to use the rotor as the primary control element, the rotor provides the most significant increment in load factor during a maneuver. In level flight, the rotor provided about 30 percent of the required lift and the wing about 70 percent. During the high load factor maneuvers, the rotor lift increased about 300 percent and. the airframe lift increased about 20 percent.
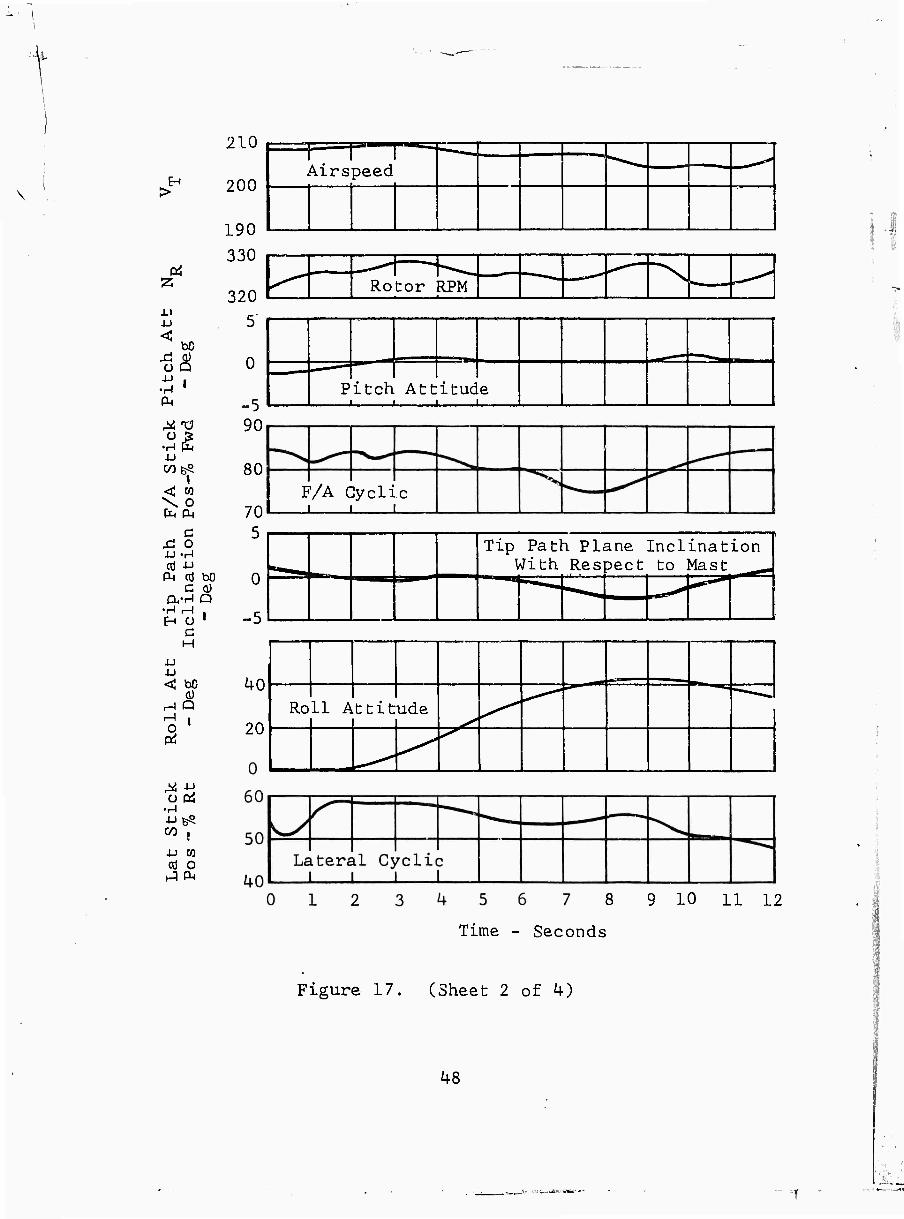
The rotor lift contribution to the load factor is shown by Figures 16 and. 17. It is seen in the figures that the yoke beam steady bending moment (rotor lift) variation roughly approximates the load factor variation, and. that the
14

V n
ö
■;..
wing beam bending moment variation is small. The airspeed, controls input, rotor speed, oscillatory main and tail rotor loads and flapping, and the elevator-stabilizer loads are also shown to illustrate the time variation of these items during typical maneuvers.
Rotor Thrust Coefficient
With the lift distribution defined, it is possible to describe, the performance of the rotor during a maneuver in terms of its lift, rpm and physical parameters, or, nondimensionally in terms of the rotor-thrust coefficient, tc. The maximum rotor-thrust coefficients obtained during the subject pro- gram are shown as a function of advance ratio, ^ , on Figure 18. For comparison, ^ milar data for the UH-1B, obtained during structural demonstration tests (Reference 9), are also given. In all cases, the structural loads obtained during the HPH maneuver tests were considerably lower than those obtained during the UH-1B structural demonstration.
Structural Loads and Vibration
To establish rotor capabilities during maneuvers, the rotor and control loads and cockpit vibration level were plotted as a function of rotor-thrust coefficient for the various maneuver entry airspeeds and jet thrust conditions tested. With the exception of the control loads, the resulting variation of rotor loads with thrust coefficient provided a means of defining the useful range of thrust coefficients for the subject rotor. The following paragraphs discuss the loads and vibration data thus obtained.
Vibrations - A time history of the pilot station vibration level during a high-speed turn (2g's at 189 knots) is shown by Figure 19. The mean load factor at both the pilot's station and the aircraft e.g. is shown in addition to the total vibration level and the major harmonic components. The one-, three-, and five-per-rev harmonics are all less than ±.05 and are not shown. From the figure it is seen that the major increase in vibration during a maneuver is due to the four-per-rev component,with the six-per-rev contributing to a lesser degree.
Figure. 20 shows the pilot station vibration characteristics as a function of rotor thrust coefficient for a speed range of 180 to 200 knots at 95-percent auxiliary engine rpm. These c\ita show the same characteristics discussed above; that is, the two-per-rev harmonic remains nearly constant
15

with increased load or tc while the four-per-rev shows the nost significant increase. The predominant vibration input is the result of the three-per-rev inplane loads in the main rotor. These are the result of operating near a blade natural frequency and. can be controlled by changes in blade ^ dynamics and damping. By comparison with Figure 11, it is seen that increases in velocity and lift (or tc) have much the same influence on vibration characteristics.
These data are significant in that they show that the two- per-rev beamwise input, long believed to be the most critical item with respect to a two-bladed semirigid rotor, is ^'n fact not critical. This rotor system has demonstrated its capability to operate at high speeds with high values of rotor thrust and. power.
Control Loads - The main rotor control loads (pitch link) are shown by Figure 21 as a function of rotor thrust coefficient for the 98-percent auxiliary engine throttle setting. The trends shown by the figure are typical of those obtained for all throttle settings. In the case of the control loads, the effect of airspeed, decay (i.e., reduction in advance ratio and tip Mach number) during the maneuver is much more significant than the increase in rotor thrust, and no trend. toward, a limiting thrust coefficient is apparent. It is believed that a deep penetration into blade stall would be required, to reverse the trend, shown, and that other loads will become critical at lower values of thrust coefficient. Therefore, while the rotor system control loads increase significantly with speed, they do not increase appreciably during a maneuver and. do not constitute a basis for defining a limiting rotor thrust coefficient.
Main Rotor Loads - The rotor loads were plotted, as a function of rotor thrust coefficient for the various thrust and entry airspeed, combinations tested. The oscillatory yoke beam bending moments are shown by Figures 22 through 26. From these figures it is seen that the beam load increases at a fairly uniform rate with increasing rotor thrust coefficient, and. generally there is a trend toward higher loads with increasing entry airspeed. The beam loads (individually and in combination with the chord loads) are well within the structural capability of the test rotor and do not con- stitute a basis for defining a limiting rotor lift capability.
The oscillatory yoke chord, moments are shown by Figures 2 7 through 31. These loads are characterized by an abrupt increase in load which occurs generally at values of thrust
16

coefficient beyond, one-tenth. Although no structural limits were exceeded during the tests, it is apparent from these data that a small increase in rotor lift (Atc "=.02) beyond the maximum values tested could easily have resulted in damaging structural loads.
The characteristic abrupt rise in the chord, load provides a good basis for establishing the maneuver limits for the test helicopter. In defining these limits, a constant load-thrust coefficient curve slope (Atc/.\load. = .2 times 10~'7) was used, to define the "abrupt load, rise" for each condition of airspeed, and. auxiliary thrust tested. Although the value of this constant is arbitrarily selected, the slope occurs just above the "knee of the curve" and at a load of 150 to 200 percent of the level flight-trim load for all cases evaluated
Limiting Rotor Thrust Coefficients
Using the slope as defined in the preceding paragraph, the corresponding value of rotor tc was obtained for each of the airspeed-auxiliary thrust combinations tested. These values were then plotted as a function of rotor advance ratio and auxiliary jet thrust. These data were then cross-plotted to eliminate the airframe drag variation with airspeed that results with a constant value of aux- iliary thrust. The final data thus obtained define the approximate thrust coefficient beyond which damaging loads will occur as a function of forward, speed (or advance ratio) and. net fuselage drag or non-dimensionally in terms of rotor propulsive force and lift. These values of thrust coeffi- cient are shown on Figures 32 (in terms of net fuselage drag) and 33 (in terms of rotor propulsive force and lift) and are defined, as the normal maneuver limit.
Use of the normal maneuver limit in design or test planning assures nondamaging loads and acceptable vibration levels. For the test helicopter, these limits are conservative and provide a margin of error in the execution of the maneuvers. For design use, these limiting values should, be used, in con- junction with infinite life stress allowables.
In addition to the normal maneuver limits, the maximum theoretical rotor lift capability and. a "structural limit" area are shown on Figures 32 and 33. The maximum rotor lift is based, on peak lift values calculated by the contractor's aerodynamic computer program. The "structural limits" are based, on extrapolations of the previously discussed. load.-tc data to oscillatory load levels which would be considered acceptable only for structural demonstrations or in the case
17
V

V-
of an extreme emergency. Consequently, in establishing a fatigue Life spectrum, only a small percentage of the time would be assumed at those load levels.
The "structural limit" data are shown as a shaded area due to the large extrapolation in the test data required. It is estimated, however, that these limits are within 5 per- cent of the values shown for the high and low equivalent drag areas noted.
These limits, as defined herein, are based on the results obtained with the test helicopter and theoretical con- siderations such as those defined in Reference 9. It is recognized that such items as rotor system dynamics, blade twist, etc., will influence the values of the limiting thrust coefficients; however, it is believed that their effects will be small and that with proper interpretation these data will be found to be generally applicable to all rotorcraft.
On the basis of the limiting uirust coefficients and further considerations of performance, it becomes apparent that future compound, rotorcraft should be designed such that more effective use of the airframe lifting surfaces is made during a maneuver. Additionally, it is equally obvious that some means must be provided to restrict the lift and the related high loads and vibrations that the rotor can develop during the maneuver.
STABILITY AND CONTROL
Throughout the flight research program, the stability and control of the vehicle were evaluated both quantitatively and qualitatively to provide an improved understanding of helicopter operation at increased forward speeds. Addi- tionally, specific flights were conducted to record and evaluate the test helicopter's dynamic stability at high speeds. The general handling and control characteristics, the dynamic stability, and the correlation of responses com- puted by the contractor's dynamic maneuver program with the flight data are discussed in the following paragraphs.
Control Response Characteristics
The control characteristics of the flight research vehicle were found to be good even in the very high speed, range. No difficulty was noted by the pilot in flying and maneuver- ing the aircraft. Control sensitivity in the upper speed
L8

range oi the vehicle was found Lo be quite acceptable. This is of si gni f icance, as it; had previously represented an area of considerable concern for high-speed rotorcraft.
figure 34 illustrates the rull control response of the test aircraft as a function of spe-.o for vari.ous conditions of jet thrust and wing trim. All conditions resulted in acceptable Levels of response. This is primarily a result of the wing's contribution to the roll damping and to the total lift of the machine. it is seen that the effect of increased jet thrust is to reduce the magnitude of the. ship's response. This arises from the decreased rotor inflow and the decreased rotor lift required. The wing incidence is shown to have a small effect on response. This occurs because the airframe-rotor lift sharing is not a strong function of wing incidence. The rise in the roll response magnitude, with speed as shown by the figure indicates the probable need to decrease the wing aileron function at speeds higher than those tested.
Although the pilots reported excellent pitch response of the aircraft, subsequent to the stability maneuver tests some concern was expressed with respect to the maneuver stability of the machine. The final normal acceleration per inch of longitudinal control increased excessively with speed.
Figure 35 explains these qualitative impressions. The ini- tial and final normal load factors resulting from a displace-
■:ent of the longitudinal control are shown for two values of wing incidence throughout the speed range tested. The initial acceleration/inch of longitudinal control does not increase markedly with speed; in fact, with low wing inci- dence the test data show a decrease in the initial pitch response. As this initial acceleration is the primary cue that the pilot receives in response to a control motion during normal flying where the controls are not displaced and held (but, rather, moved to make minute corrections continuously), it is understandable that no significant pitch response changes were noted during the early flights.
The final normal load factor/inch of longitudinal control shown on the figure, which better defines the over-all maneuver response of the aircraft, is seen almost to double in the speed range from 170 to 190 knots, thus confirming the pilot's impression. The increase in the final normal acceleration/inch of longitudinal control with speed is excessive, and this indicates the need for an auxiliary
19
V
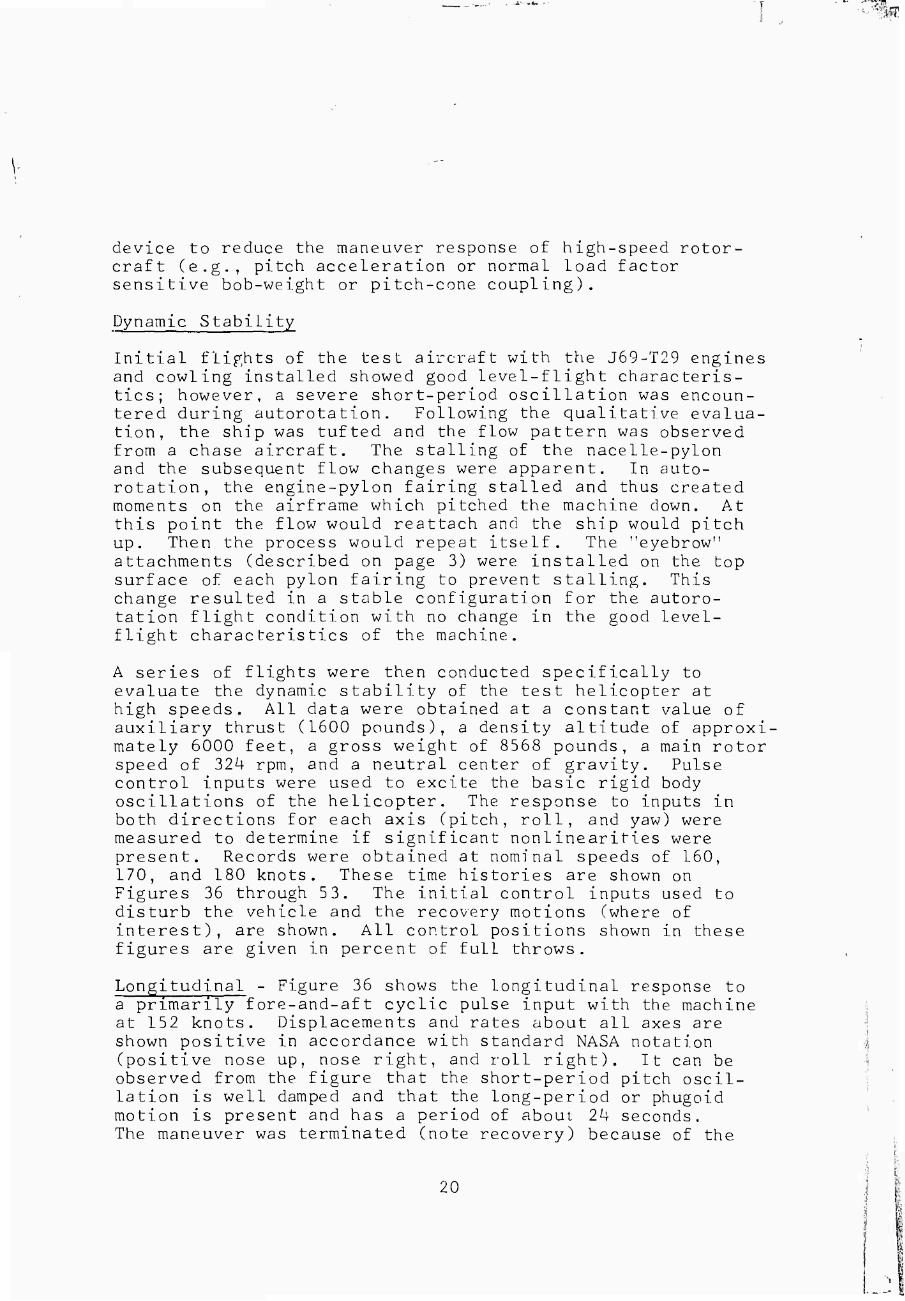
device to reduce the maneuver response of high-speed rotor- craft (e.g., pitch acceleration or normal load factor sensitive bob-weight or pitch-cone coupling).
Dynamic Stability
Initial flights of the test aircraft with the J69-T29 engines and cowling installed showed good level-flight characteris- tics; however, a severe short-period oscillation was encoun- tered during autorotation. Following the qualitative evalua- tion, the ship was tufted and the flow pattern was observed from a chase aircraft. The stalling of the nacelle-pylon and the subsequent flow changes were apparent. In auto- rotation, the engine-pylon fairing stalled and thus created moments on the airframe which pitched the machine down. At this point the flow would reattach and the ship would pitch up. Then the process would repeat itself. The "eyebrow" attachments (described on page 3) were installed on the top surface of each pylon fairing to prevent stalling. This change resulted in a stable configuration for the autoro- tation flight condition with no change in the good level- flight characteristics of the machine.
A series of flights were then conducted specifically to evaluate the dynamic stability of the test helicopter at high speeds. All data were obtained at a constant value of auxiliary thrust (1600 pounds), a density altitude of approxi- mately 6000 feet, a gross weight of 8568 pounds, a main rotor speed of 324 rpm, and a neutral center of gravity. Pulse control inputs were used to excite the basic rigid body oscillations of the helicopter. The response to inputs in both directions for each axis (pitch, roll, and yaw) were measured to determine if significant nonlinearities were present. Records were obtained at nominal speeds of 160, 170, and 180 knots. These time histories are shown on Figures 36 through 53. The initial control inputs used to disturb the vehicle and the recovery motions (where of interest), are shown. All control positions shown in these figures are given in percent of full throws.
Longitudinal - Figure 36 shows the longitudinal response to a primarily fore-and-aft cyclic pulse input with the machine at 152 knots. Displacements and rates about all axes are shown positive in accordance with standard NASA notation .;
(positive nose up, nose right, and roll right). It can be observed from the figure that the short-period pitch oscil- lation is well damped and that the long-period or phugoid motion is present and has a period of about 24 seconds. The maneuver was terminated (note recovery) because of the
I 20 I

increase in roll attitude; however, pilot comment indicated the vehicle to be adequately stable. The damping was esti- mated to be such that one period (24 seconds') was required to half amplitude. This same test was flown with the pilot attempting to control roll attitude but was unsuccessful because of the introduction of inadvertent pitch inputs. No further efforts were made along these lines, as the data obtained do help demonstrate coupling effects and allow sufficient stability measurements to be made.
Repeating the input in the aft direction produced the time histories shown on Figure 37. It can be seen that the phugoid is considerably more stable when disturbed by an aft input than by a forward input. The response appears to be such that half amplitude would occur in about 12 seconds. Also, the short-period oscillation is so heavily damped that it is, for practical purposes, not present. The more stable condition for aft inputs is a result of rotor nonlinear char- acteristics that are a direct function of inflow.
Although the auxiliary thrust reduces the inflow condition, the rotor angle-of-attack stability contribution is de- stabilizing. For aft inputs the inflow is decreased and the short-period oscillation, which is primarily an angle-of- attack and pitch attitude oscillation, is destabilized to the point that it becomes oscillatory and apparent on the pitch attitude response. Figures 38 through 41 illustrate the longitudinal response up to a speed of 184 knots. The general trend was for the phugoid to become more unstable as spped increased. The basic characteristics are summarized in Table II. It should be noted that these characteristics, which were reported as satisfactory by the pilots, were obtained without the aid of any artificial stabilization equipment and without the standard gyro stabilizer bar.
Lateral - Lateral cyclic pulse inputs disturb the research vehicle as shown by Figures 42 through 47. The most pro- nounced effect with respect to roll is the tendency of the aircraft to seek a left roll even following a right control disturbance. This left rolling tendency has been charac- teristic of all configurations of the HPH and is apparently due. to aerodynamic flow effects caused by the fuselage fairing and afterbody. The addition of wings and jets has lessened the strength of this tendency, as reported during Phase II of this program, but the condition remains. Noting Figure 42, it can be seen that a right lateral pulse causes the machine to roll right, but also excites an oscillation. This oscillation is a result of coupling between roll and pitch and is essentially the manifestation of the phugoid
21

In the roll axis. The period can be seen to be icentical to that measured with the longitudinal pulse inpuls Also, the pitch attitude trace indicates that the :)!; .^ ),(. ---as d i s turbed.
Figure U3 shows the lateral stability following a left pulse with the machine at 159 knots. For this case, it is apparent that the basic roll response is a pure convergence with a time constant of about 2 seconds. ['he wing's effect and the reduction in inflow made possible, by the auxiliary propulsion act to provide strong damping for the roll mode. "he trend of damping for the roll convergence is generally ■-w rd reduced damping as speed increases. rime h's;,or..c :. .re snowi; for speeds up to 185 knots, and this trend car. be ■..■oserved . fable II summarizes the basic roll characteristics of the test aircraft. Pilot comments with regard to roll stabilijy point, out that although the machine is adequate in this area, increased roll damping is desirable and would make the air- craft easier to fly.
Direc tional - Directional dynamic stability was invescigated in the 160-, 170-, and 180-knot speed ranges by pulsing the pedals and recording the resulting directional oscillations. Figures 48 through 53 are tue results of these tests. ['ho oscillation can be observed best by noting the yaw rate trace. It can be seen that in each case the 'notion is strongly damped. As speed increases, the period decreases from some 2.3 seconds to about 2 seconds at 1.82 kn 'ts. In is arises from the tact that trie i in and tail rotor c .i • r ' bu t i ^n ;:o the directional ang 1 e-ot'-a t tack stabil i'y <'::.(■ ;;ro-" icnal spring effect,) increases with soeed . Thv cyc.es ' , aa L :. amplitude likewise decrease wiin speed, going from aboui I at 162 knots to 0.7 cycle at 180 knots. the results of the directional stability test are summarized in Table 11. Lt is interesting to note that the tail rotor input, being off the princioal axis in roll, creates a roll reaction. This effect can be seen best by following the roll rate trace. This characteristic of the HPH was noted by the pilots only after the subject pulse input flight tests, and is not con- sidered to be a problem during normal maneuvering flight because only slight lateral stick motion is required to correct the tendency.
The research vehicle did not evidence a strong basic yaw- roll coupling in that no tendency to enter into a ''Dutch Roll" oscillation was noted. The dihedral effect of the wing was not great enough no contribute significantly to interaxis coupling.
22

GONCLL'S IONS
10::' s a I D M; 1CI
a:
a",:. L_.' reduce rotor power require- n .' u n s DO ed s . A 'aa x ': muTi ad va nc i n G
9 S 5 w a s a c ' ned durinc; 'he subject test ! )ad and oowcr increases re-
ed due to hi eh ' ic p r-i.. LMT, , a:\ii otaer i'.i^n coniroJ ported herein, ri'> adverse effects were n Mach nu'nber operation. '['here is every reason to :JP . . ^ve supersonic advancing tip operation is possible.
i na
• •> e n c i
or ';'.>ckp ! i i- 'i r a ii i vc aid ow
s der i ved frcn aux i ar ■ropu Ls '. on n eve increase:! speed .und or reduced rotor Loads and
brations.i are also obtained durinc maneuvers.
d
i' gher nor'na a ; r s pc?ed , i nc re a s ed au x i
oad t ac tors tor Le ve ': . L i'?.' ' ng ro tor L i
! ''nod as a function ot equivalent fuselage drag and advance . i o .
iary propuLs i on w i1 1 :: h e s a Tie rotor s t r u c -
ft cauabii i ties can be
For a fixed-wing ccn u ,<: helicopter that is designed to u e the rotor /is vhv pri nary control eletient, the rotor provides the TIOS! signil icant i nci'^'iien t rn load factor during a 'uaneu- ver, and ' lip Tia'.K'Uver '"ao ibil iiy of the vehicle will be
1 '■•d'^o ds i tic rotor. .-! conoound he 1 i confer that uses u i : .i . ri;:, i nc ; i-: ■/er ' en ! • /e r .':>■;.■ : < >n s!i"U i d
vi'roi. , ce nus: l)e !:aken to prevent id i ng -•!' 'die ro'^r dur'nc: a Tianeuver.
c'.^ec'.ed t:oward : inding means ay which c 'n • r )U; '. on c ia ,: sed .
■ in,1 w. n-J, dur:;ai a Tianeuver can be
Acceptable stability ana control characteristics, including responue, can be achieved for a coTipound helicopter through- out the flight envelone and in all regi.mes of flight without imposing demands on tne flight path of the vehicle during ai ■^rotation. Additional researches are required to investi- gate further and develop means of reducing the high-speed load factor control sensitivity (maximum load factor/control displacement) of such machines.
The directly-controlled two-bladed semirigid rotor is capable of high-speed flight with low vibration levels and acceptable structural loads while providing a significant amount of lift and propulsive force.
23
.im.'

REFERENCES
L. Hlsh-PerEormance Helicopter, U. S. Army TRECOM Contract DA i+4-177-AMC-162(T) , April 4, 1964.
2. High-performance Helicopter, U. S. Army TRECOM Contract DA i+4-I77-TC-7LI, July 31, 1961.
3. Van Wyckhouse, J. F., and Cresap, W. L., Summary Report, Hig;h-Per£ormance-Helicopter Program, Phase I, TRECOM Technical Report 63-42, U. S. Army Transportation Research Command,* Fort Eustis, Virginia, September 1963.
4. Van Wyckhouse, J. F., and Cresap, W. L., Summary Report, High-Per£ormance Helicopter Program, Phase II, TRECOM Technical Report 64-61, U. S. Army Transportation Research Command, Fort Eustis, Virginia, October 1964.
5. Military Potential Pest o£ the Model 540 "Doorhinge" Rotor System, ATA-TR-64-2, U. S. Army Test Activity, Edwards Air Force Base, Lancaster, California, February 1964.
6. Van Wyckhouse, J. F., Company-Funded. Flight Researches Conducted in Conjunction with the High Performance Helicopter Program, BHC Report 533-099-015, Bell Helicopter Company, Fort Worth, Texas, February 1964.
7. Modification No. 5, Supplemental Agreement to U. S. Army TRECOM Cont-act DA 44-177-AMC-162(T), July 16, 1965.
8. Oldenbuttel, R. H., A Low Speed Wind Tunnel Test of a .200 Scale Modified 533 Bell Helicopter Model Investi- gating Aerodynamic Characteristics, LTV Low Sf _ed Wind Tunnel Test No. L85, Ling-Femco-Vought, Inc., Grand Prairie, Texas, July 30, 1965.
9. Wettengel, W. 0., UH-IB Component Load Level Survey, BHC Report 209-099-959, Bell Helicopter Company, Fort Worth, Texas, January L6, 1961.
10. Drees, J. M. , and McGuigan, M. J., "High Speed Helicopters and Compounds in Maneuvers and Gusts," Proceedings of the Twenty-First Annual National Forum of the American Helicopter Society, Washington, D. C, May 12-14, 1965.
Now U. S, Army Aviation Materiel Laboratories
24

TABLE I
MANEUVER TEST FLIGHT LOG
Flight Gtr. Jet RPM Airspeed Load Number* No. XNj VE-Knot3 Factor-g Type**
635 426 84 151 1.31 Right Turn hll 151 1.57 428 151 1.89 431 163 1.30
635 432 163 1.60 638 561 84 169 1.88 635 429 87 151 1.30 635 430 151 1.58 636 454 155 1.88
456 167 1.30 (1) 458 169 1.29 (2) 457 169 1.60 (1) 459 169 1.61 (2) 460 169 1.88 (2)
636 455 169 1.88 638 563 171 1.64 638 564 171 1.78 638 562 171 1.99 636 461 183 1.32 636 462 184 1.57 6 38 565 87 186 1.69 635 433 88 163 1.31 635 434 88 163 1.55 638 568 90 169 1.32 638 569 169 1.57
570 169 1.92 Right Turn 576 186 .63 Pushover 575 186 1.60 Pull-Up 571 187 1.34 Right Turn 572 187 1.60 Right Turn 573 187 1.92 Right Turn
6 38 574 90 188 1.37 45° Bank
25
\
FABLE 1
(Continued)
Flight Otr. JeL RPM Airspeed Load Number* No . '/oN-r VE-Kno Ls Factor-g Type--'''-
654A LL5 95 L85 L.62 Right Turn 65i+A LL4 L86 L.3L Right Turn 636 463 L86 L.3L 638 566 L86 L.68 638 567 L86 L.92 Right Turn 658 3L0 L88 .78 Pushover 654A LL9 L89 L.96 Right Turn 6540 L26 L89 2.00 654A LL6 L90 L.92 658 3LL L90 L.99 Right Turn 658 309 L9L L.43 PuLL-Up 6540 L28 L94 L.73 Right Turn 654A LL8 95 L96 L.43 6540 L27 98 L96 L.53 6540 L30 L92 L.69 6540 L29 L96 L.39 6540 L3L L99 L.22 654A LL7 L99 L.39 Right Turn 658 3L4 200 L.74 Left Turn 6540 L32 203 L.60 Right Turn 658 3L2 203 L.93 658 3L5 98 209 L.5L Right Turn
* FlU ght Number Gross Wei .ght, Lbs
635 8360- -8260 636 8300- -8125 638 8380- -8050 654A 8143- -80L3 6540 8275- -8190 658 8378- -8200
■
** ALL maneuvers at LO0 wing incidence except as noted
(L) 0° wing incidence -
(2) 5° wing incidence
26

TABLE II
PERIOD AND DAMPING OF CHARACTERISTIC MODES OF MOTION
True Control Oscillation Characteristics* Airspeed- Input Period - Time to Half Knots Direction Seconds Ampl .itude-Seconds
Longi tudinal 152 Fwd 24,0 24.0 159 Aft 24.0 12.0 L69 Fwd 26.0 CO
170 Aft 24.0 24.0 183 Fwd 15.0 -7.0 184 Aft 26.0 20.0
Lateral 161 Right 26.0 -20.0 159 Left X (r = 1.3) m Right X C = 3.0) m
Direc
Left
tional
oc (r = 3.0)
162 Right 2.5 2.1 162 Left 2.2 2.8 171 Right 2.0 1.0 L71 Left 2.0 1.0 180 Right 2.0 1.4 182 Lef t 2.0 1.4
* Approximate
27
SjW»
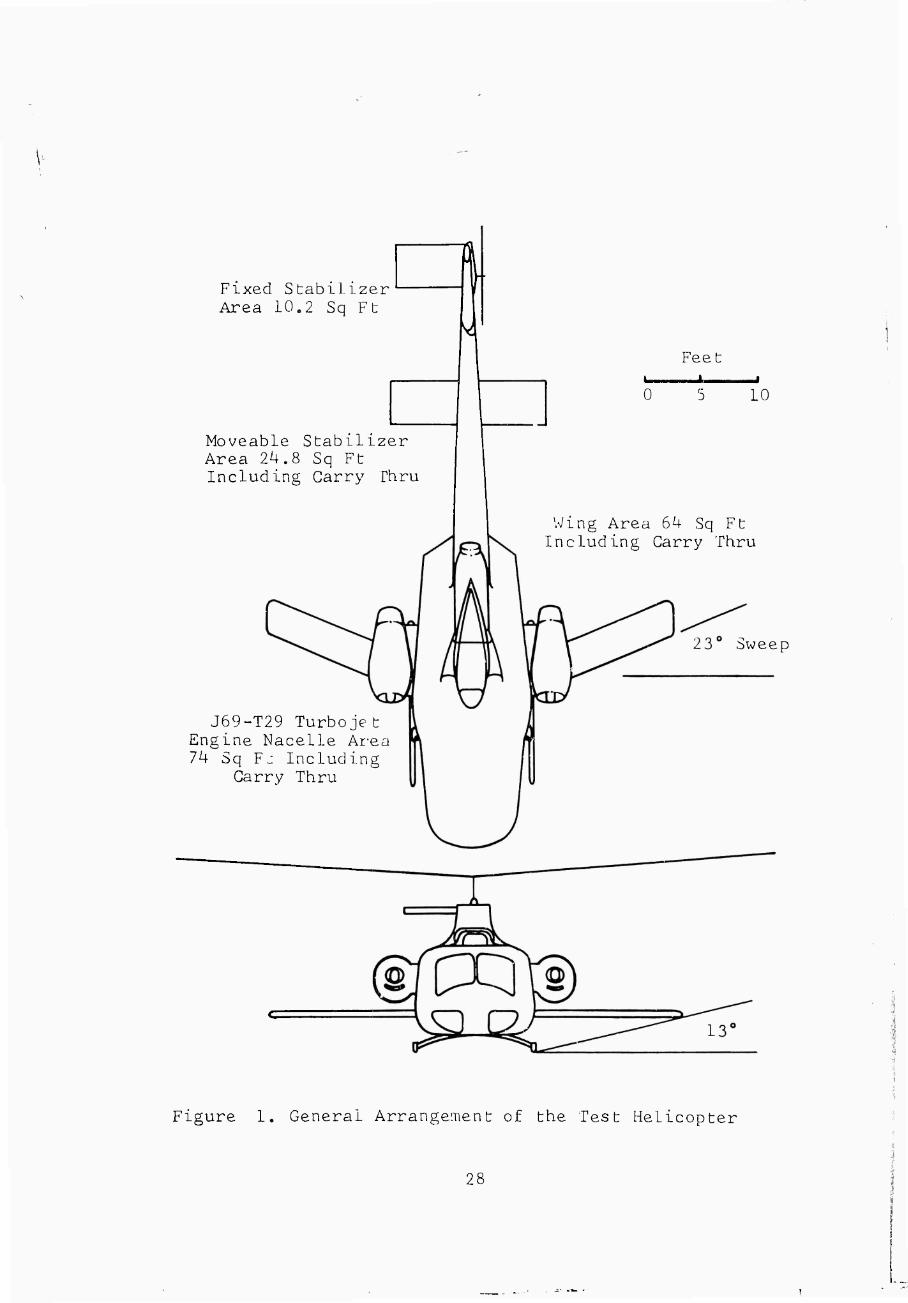
Fixed Stabilizer Area 10.2 Sq Ft
Moveable Stabilizer Area 24.8 Sq Ft Including Garry Thru
J69-T29 Turbojet Engine Nacelle Area 74 Sq FJ Including
Carry Thru
Feet i
0 10
Wing Area 64 Sq Ft Including Garry Thru
bweep
Figure 1. General Arrangement of the Test Helicopter
28
c o
•r->
0-1
CO
0) u
c •r-l
c
cd
•H X
<
CN H
i c^
CN
bO
29

\
1800
M
c o CM
w U
4-)
1600
IU00
1200
1000
800
600
400
200
% NT Jet
Figure 3. Auxiliary Thrust vs %N-r Jet
30

CO n-l CO
u o
-M O
cd
TO
a
Ü
3L
|

200
120 140 160 180
Indicated Airspeed - Kno'^s
2 00
Figure 5. Airspeed Calibration
32

3.0
I O
u o o
4-) O H
2.5
Dive 221 Kn- I I
Level 217 Kn—
Wing Incidence +10° Tip Speed 72U fps Sea Level Standard Day Gross Weights9,800 Lbs
160 180 200
True Airspeed - Knots
Figure 6. Total Power and Distribution - Level Flight
33

CM I O r-i
X
X 00
U QJ
O c.
■p 4-1
00
CO LO
8
Wing Incidence +10° _Tip Speed 72k fps Sea Level Standard Day Gross Weight=9,800 Lbs
0
Jet Thrust 2k00 Lbs
Jet Thrust 2900 Lbs
Blades
Standard Tapered Tip
5rV o 160 180 200
True Airspeed - Knots
220
Figure 7. Shaft Horsepower Required Test and Calculated
3k

i ■'
I
CO XJ
c g i
S r-l
c •r-l W
C J 0) I CQ C M
a)
o
60 i—Beam
40
20
0rV 0 160 180 200 220
UH-IB Blades Tapered Tip Blades
,— Chord
0 v160 180 200 220
■
True Airspeed - Knots
Figure 8. Main Rotor Yoke Moments
35
i

;
20 a. Over-all Lo
160 180 200 True Airspeed - Knots
220
00 i o
20
15
b. Reverse Flow Effect ^ ^ ~rf= "270°
S io c H
i 5
c
g o
0
c •r-l
o
•H 12 Oi
1 S CQ
o 4 -U o cd
0 HV
.4^ .48
Advance Ratio
0 v .85 .90 .95 1.00 Advancing Blade Tip Mach. No.
Figure 9 Control System Loads
36
iJ c
&
bO C(N
•H I X) O C r-l OJ
CQ X
0) jQ
CO I r-l C cq H
U +i o a-) O Pi
•■-I cO
EH
15
10
0
15
1C
3e; im
ym ^^^j^i^^lllll fjj
11 ] 1111111; tZiüiw
0
bC c e aß CVr-J cö X
r- CO
^ CM
o o O J-) a! c
a) r-) o
co a) H PL,
50
40
30
20
10
0
Flap »ping
/
+4 0 s^
+ 2 ^
y
^ -^ -2
-—^ E Fus
quiva elage
lent Drag
Ft
4
• ■Sq
160 180 200
True Airspeed - Knots
220
r7 • *'■■,■
Figure 10. Tail Rotor Loads and Flapping
37

t-i
CO c o
•H u cd
tü n-l
o Ü
cd o
•r-l 4-1
0) >
C o
•H J-J
cd J-J CO
J-J
o •H CM
160 170 180 190 200 210
True Airspeed - Knots
Figure 11. Vibration Characteristics In High-Speed Level Flight
38

f
100
■J)
a) c b0 C CJ
>, u CD
•r-l
•r-l
X
3
^r'Vo L60 180 200 True Airspeed - Knots
220
■
fe Figure 12. Airspeed Range vs Auxiliary Engine RPM
39

\
I
C o
•r-l
u 0)
r-i a) ü ü < r-l
e o
2.0
1.5
1.0
0.5
0
<^
F
fe ^^
^ 1^
z
-^1
^V
Sym % N] Jet
O □
o
8i+
87
88 90
95
98
-S3ZL ^
Z^
^
"V7
\
<■>
^^ST1 '
?■*-
\
\
^
Tip Speed 72k fps Gross Weight
8400 to 8600 Lbs
0 v140 160 180 200 220
True Airspeed - Knots
Figure 13. Test Velocity - Normal Acceleration Envelope
U0

-U c
B £ c
•r-l
c OJCO pa i
o e^ cd 0) ^
CQ CO
-d c 03 ^3 d) O
00 I xi
Q) Ci ^5 c O M
u o XJ o oi
40
20
0
-20
-40
-60
-80
-100
-L20
-140
-160
-180
-200
-220
& ^i
5 o o o ^x^LRotor RPJ
/ / 1 i
A
i // 40 00
Re
8000 I
5tor Lift I i / m 000 1
/ 1 16, 000
1 I %
1 ,
'1 V h '1 1 1
,/ '1 1
///
1
/ %
\
Figure 14, Rot^r Lift vs Steady Yoke earn Bending Moment

-U jd bO •H
^ 1 w w o u Ü
-U (4-1 •H
-U
bO •r-J 0)
w w o u Ü \ -U U-l
Component of Lift Normal Jet Thrust Airframe Rotor Total of Above Components Total (Accelerometer)
1.8
i.o
0
1
k.H. Turn y- ^ Ctr. 566
/ \ / N
_.. --—^ s^yS
^^' ■■^>
/ \
^t*
\
HM^^ ^B « _ - —.
Time-Seconds Time-Seconds 10
Figure 15. Lift Distribution During Maneuvers at L86-Knot Entry Airspeed
42

C/l 2.0
oO
1 1.8 U o 0-1 1.6 u
CO P^
l.U TD
03 O
KJ 1.2 0
n » 1.0 u
-6
e. -8 CO OJ
CO -U -10 >, 0) i
-ö e o CO 0) «
,-i -12 -U * CO b0
CÜ c
•H 3 -14 ^ id i o C c >H 0) M -16 cy 1 cd
.u CO (1) I cu g o
CO O r-A
b0 ^ C b0
•--1 C JO
X) I ■P c c cd a) M
/ V L( 3 .id : ̂ act:^ 3r
y / \
/ \J /
\
X ■^^"
-18
-20
Ik
13
12
11
10
P \ i \ 1 \ s.
M€ ian I loto] r Loc äd 1 \
j / N
y ■ y
^^MIHMim »^^^^^^ /
/
MG tan V 7ing Loac i / N \
^ ^ N "
012 345 6 7 89 10 11 12 Time - Seconds
Figure 16. Time History of Right Cyclic Turn, 95% N-j- Jet (Sheet 1 of 4)
43

L90
EH > 180
L70 330
Di 320
a.) <
bü xi <ü u Q
0-1 I •H
04
X)
o S. •H J-J f^ 00
1 < N w P^ o
c^
c jd o -U •r-l 03 XJ
PH 03 bO C QJ
a-r^ Q •r-J >—1 , H O '
a H
XJ XJ
< bO 0)
n-l p r-J O 1 a;
^ H ü cd
•r-l -U ft? C/J
4-) m 03 o -1 CU
- Air
■ ' '«• :
■• cr-\o oH ^- "t^^-^ ^
^
310
L0
5
0 90
80
^ ^"
^
Ro :or 1 RPM 1
'
1 1 1 Pitch Attitude
■ i i i ^
«^
S*
70
60
0
— — —. ^
p /A C ycli — -^
/ S
C
"" — y
>v
Tip Path Plane I nclination With Resoect to Mast 1
\ —
4 5 6 7 8 Time - Seconds
Figure 16. (Sheet 2 of 4)
10 11 12
4U

a P
CJ •H I OJ
o
d CO o
I M O C n-l
•H ^1 ^
Xi X) o J u •r^ +1 P4 .
4-) C Q) S
bO C
•r-ICO -d I c o a) n-i a a) X JO o HJ
>H i c
^ H O
■U +1 o cd »
c •l-l
CO
50
kO
30
20
L2
II
10
9
8
100
80
60
kO
20
80
60
kO
20
1 1 Gc 5lle( ztivi i Po siti on
—- -_ -^. „
■^
^N
v^ — \
^ a in Rote r \ r ̂ A Co ntro I Lc ad. \r
1 Main Rotor \
Gh ord Mo me nt
/ \,
/
\
\ , - — N
Main Rotor .s\ B earn Mo me nt
. ̂
/' >
1 1 ^-
01 2 3^56 789 LOLL 12
Time - Seconds
Figure L6. (Sheet 3 of U)
45

C •r-l
r-l
60
40
20
0
T1^ il Rotor Fla 13. pnin g "
^^ — ^-. --
bO CCN
•H 1 -d o C n-l 0)
CQ X
m JD . hJ
f-l I CvJ C
H CO
■P +1 00 I
(Ü c -d a) co ß
CQ S
LO
0 Tail Rotor Chord Moment
I,, I I l i L_
w o
CM
r-i a! co
a) CM
i
90|—
80
70 Rudder PeaaL Position
j-i c i
O bün-J c
•H ^ -d C XI >D J
CQ I C
-U H 0 I O '
Figure 16. (Sheet 4 of k)
46
"T

!
U O XJ o 03 tu
-d co o
a a
i a) pq 4J
>, a) i x) 6 o
CO O r-) a) S ^ 00 bO
a) -H ^ ^ -d i o c c >H QJ M
PQ I
I 4J
d Q) i a) S o cq Or-i
bo ^ C bO
■u c c Od 0) H
1.8
1.6
IA
1.2
1.0
0.8
-10
-12
-14
-16
-18
-20
14
13
12
11
10
Lo ad. F acto r / "N
/] /
\ V
^ ^ ■ — . . — """ ^J
/ ^N v
Me an R otor Loa d y /
\ v 1
H /- —■ ^
r ^J
0
Mean Wing Load
4 5 6 7 8
Time - Seconds
10 11 12
Figure 17. Time History of Right Cyclic Turn, 98% N-j- Jet (Sheet 1 of 4)
47 ■
■i^'S^^J "~_ ■• ' - •" l~
\
Qi
4.» 4-)
■ss 4-) •i-l
I
XJ
■< w \ o
C x! o 4J -r-l CO -1-1
CM cd c
(X'rA •H r-l En u
c H
4-1 XJ <; to
a) r-l Q
b0 Q) Q I
O Pti
I
210
200
190 330
320
5'
0
-5 90
80
70
0
-5
40
20
hH —■— ——.
-- Airspeed i . . •
o oi •r-l 4-) 6? CO i
4-1 W CO O hJ PM
F/A Cyclic _J I L_
Rotor RPM -^■ "^ ^
___
P
■
itch Att i
itude i . i
I
^- —
Tip Path PI With Res
ane Inclination pect to Mast ^^
"^
Ro II A ttit ude ^ ^ -^
■
■^
^
8 9 10 II 12
Time Seconds
Figure 17. (Sheet 2 of 4)
48

P
a
o
60
50
30
1—1 1 Cc Dllet :tiv(
1 1 i Position
i i
]
X) CO O
i^l CN I
X O C r-l
•H
X! X) ü hJ OJ •H +1 a. ,
8 i Main I
1 lotor
T 3 1 U X. u. U J-lU au.
/• ̂ N. y ^
NJ r^ / \ V— y V. ̂ ^sJ
c a) B
i c
•r-ICO V I c o QJ ,-1
oq
a) r« X)
^ i c H u
o ■U +1
c
DU
/+o
i i i Main Rotor
Chord Moment. /
— *y "H
20
n
'
10 11 12
Time - Seconds
Figure 17. (Sheet 3 of 4)
49

bü c
•r-l
a i CO '
r-J
bO C(N
•H I 'Ü o
0) PQ ^
(N
CO i-) +1 CO i
OJ c -d a) cd S
r-) o
w o
CO
a) . P4 '
4-1 C a) S 0(N S I
o c
tJ C XI a) .J
eq i c ■u H O I
5
10
0
10
0
90
80
70
0
-20
-40
-60
-80 0
—i r i 1 1 1— Tail Rotor Beam Moment
—i i i i 1 1—
Tail Rotor Chord Moment
—1 1 1 1 1 r Rudder Pedal Position
Fixed (Fin Mounted)
i—I—t Elevator-Stabilizer Moments _J _J 1 1 I l I
4 5 6 7 8 Time - Seconds
10 11 12
■
■
■
■
Figure 17. (Sheet 4 of 4)
50
7

o3
ü
.2
0
"■\ \
T1H -LB S IN
trunturalJ v uvmm^^m^mm ^*^ D (
amonstration .J Reference 9)
i i \ \ N
\
I Maneuver (Tapered
i
Test Tip B
Progr iades
am HP ) - u
0 .2 .3 Advance Ratio, //
.4 .5
Figure 18, Maximum Rotor Thrust Coefficients
51

'-44-
2.5 w
I
^ 2.0 ü cd
cd o
1.5
1.0
Right Turn - 189 Knots Jet Thrust -2500 Lbs
Pilot's Seat (Mean)^,. H I I I I- «£.
sX
C.G.(Mean)
w b0
+i I w c o
•t-l J-)
cd
CD r-l 0) o o
<J n-j cd ü
•H -P U
§ c o
cd 4-) oo
-U o
r-l
.4
.1
0
.3
.2
.1
0
0 0
2-Per-Rev Component \ I _J I L_
i—i—r~i—r- 6-Per-Rev Component
^68 Time - Seconds
^
^ ^^
X \
OVG 1 1
ir-all Vibrat i i
ion
^ _
4- -Per- ■Rev Com sone nt /
/
\
. -—
i
^
>
■
S :
Figure 19. Vibration Characteristics During a High Speed Maneuver
52
T

w
bO
+ i I
m c o
•H J-)
CO U a)
n-l Q) o a <
o •H ■U
a) >
c o
•H 4J CO 4J 00
JJ o
r-l •H CM
,0k .08 .i2 .16
Rotor Thrust Coefficient, t
Figure 20, Vibration Level vs Rotor Thrust Coefficient
53

I O
M
+ 1
I
01
C •H
o
•r) 04
Sym VFi-Knots
16 O 192 196 199 203 209
D
|>
<
15 <
<
Ik 0 <
1
j > i Ij > I
13 E> | >
P
12
z > >
[
]
> t 1
> r 1
11
\
C ( >
V / V
0 \
10
v. ) 0( )
4
0 r 0 .02 ,0k .06 .08 .10 .12 .14 .16 .18 .20
Rotor Thrust Coefficient, tc
Figure 21. Control Load vs Rotor Thrust Coefficient 98% Nj Jet
5k
.JL ■ ■
■
■
T S ' r .'it i
. ^ -..:.-
80
CO i o n-l
I c
+ 1
I
c e
C •H
C
pq
e
PQ
QJ
O
70
60
50
40
30
20
l
Sym . y. -Knots
o o
151 163
D 169
D 3
O Q C
LJ
< < >l; ̂ !
3 < >*
1 ' O ( ) c n r
C C ) (
> <
3
[>
< b> < p
1
1 -
0 .02 .04 .06 .08 .10 .12 .14 .16 .18 .20 Rotor Thrust Coefficient, tc
Figure 22. Main Rotor Bearawise Load vs Thrust Coefficient 84% N-j- Jet
55
WW "F •"
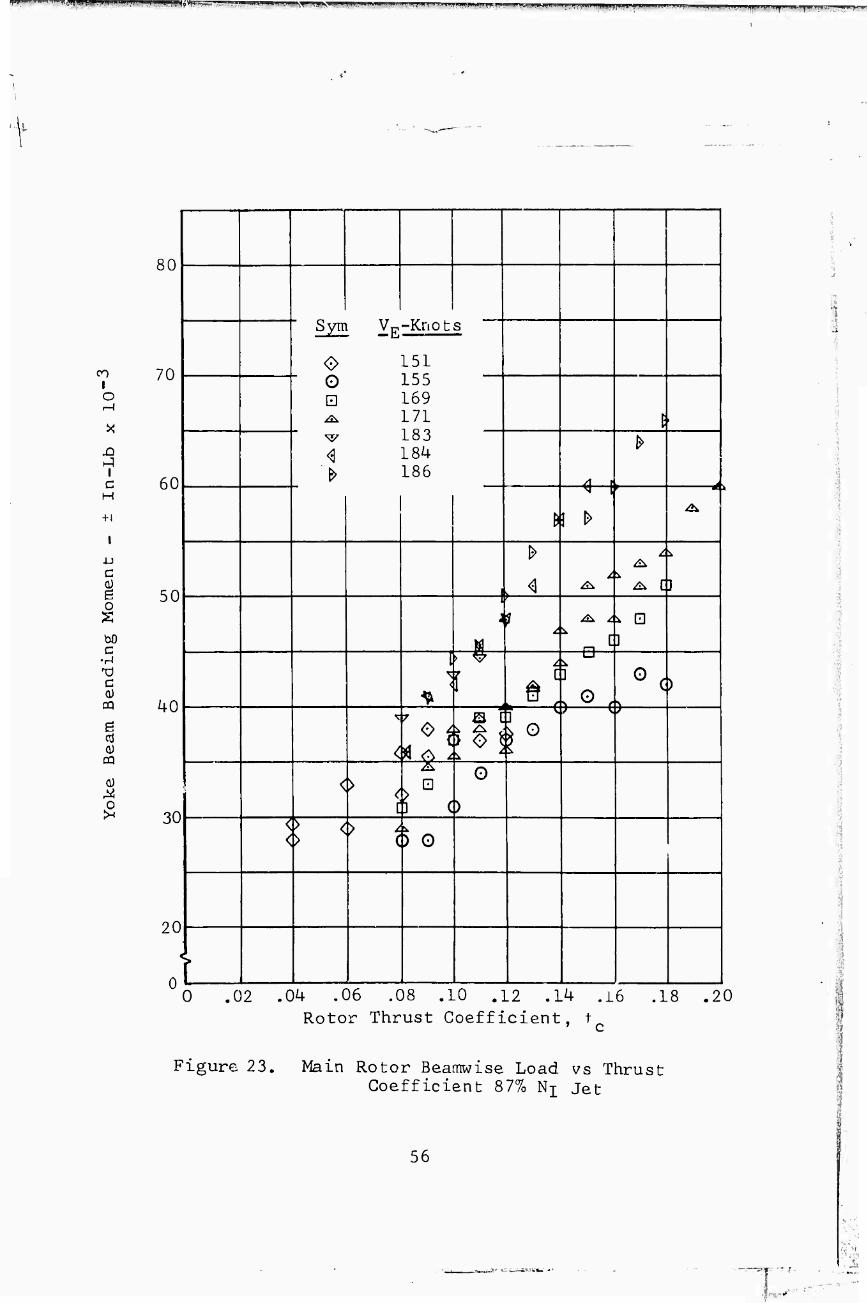
UI^BI i ■!. !■ n^pn^n^f^^ppp. i iiuwt.U'iUpasss- ■ ■i ii>iiv»i iiaMi( wmMm. i^, U..11 .i^,,»..,i,-.,., niimpmn mpHnpii
CO I O
I c M
+ 1
c a) e o
c •H
c CD
PQ
s 0)
CQ
a)
80
70
Sym VE-Kriot
<•> 151 " O 155
H 169 ^ 171
" v 183 ^ 184 > 186
s j
*
fiO <fl r
^
^
&
N I
3 > A
50
I>
l <1 3 1
a ? ^
£± /.
]
40
I
<
> &
r .»!
]
) 0 (
Gc )
< o
30
<
\ i ̂ c O
) < < f ' i ) 0
i
20
< r 0 .02 .04 .06 .08 .10 .12 .14 .16 .18 .20
Rotor Thrust Coefficient, t
Figure 23. Main Rotor Beamwise Load vs Thrust Coefficient 87% Nj Jet
56
.
■

• fumv i fnuii'i i iiAn.iwtmmpmmmemimfmim*' l"1" ' — »- ■ ......... .... , "-■
• '■•■■>-•>>• m mm
-■
CO 1 o r-J
Ä X ■
JD J
1 C M
+ 1
I
4-) c 0) 6 o S
-■
b0 c
•H TJ
■■ c 0) m e CO a)
CQ
0) ^ 0
!H
■
v.
■
80
70
60
50
40
30
20
Sym VE-Knots
0 \J7
169 L87
ol
/.\
[]
^
V ^ ^
H ^7 ^ []
Q
Q
^
-v
-B—EJ
f3-
^57 ^
^?
^7
■^7-
-E}
^-nr
H
0 .02 .Ok .06 .08 .10 .12 .14 .16 .18 .20 Rotor Thrust Coefficient, t
Figure 2k, Main Rotor Bearawise Load va rhrust Coefficient 90% N-,- Jet
57
FWff
CM»!
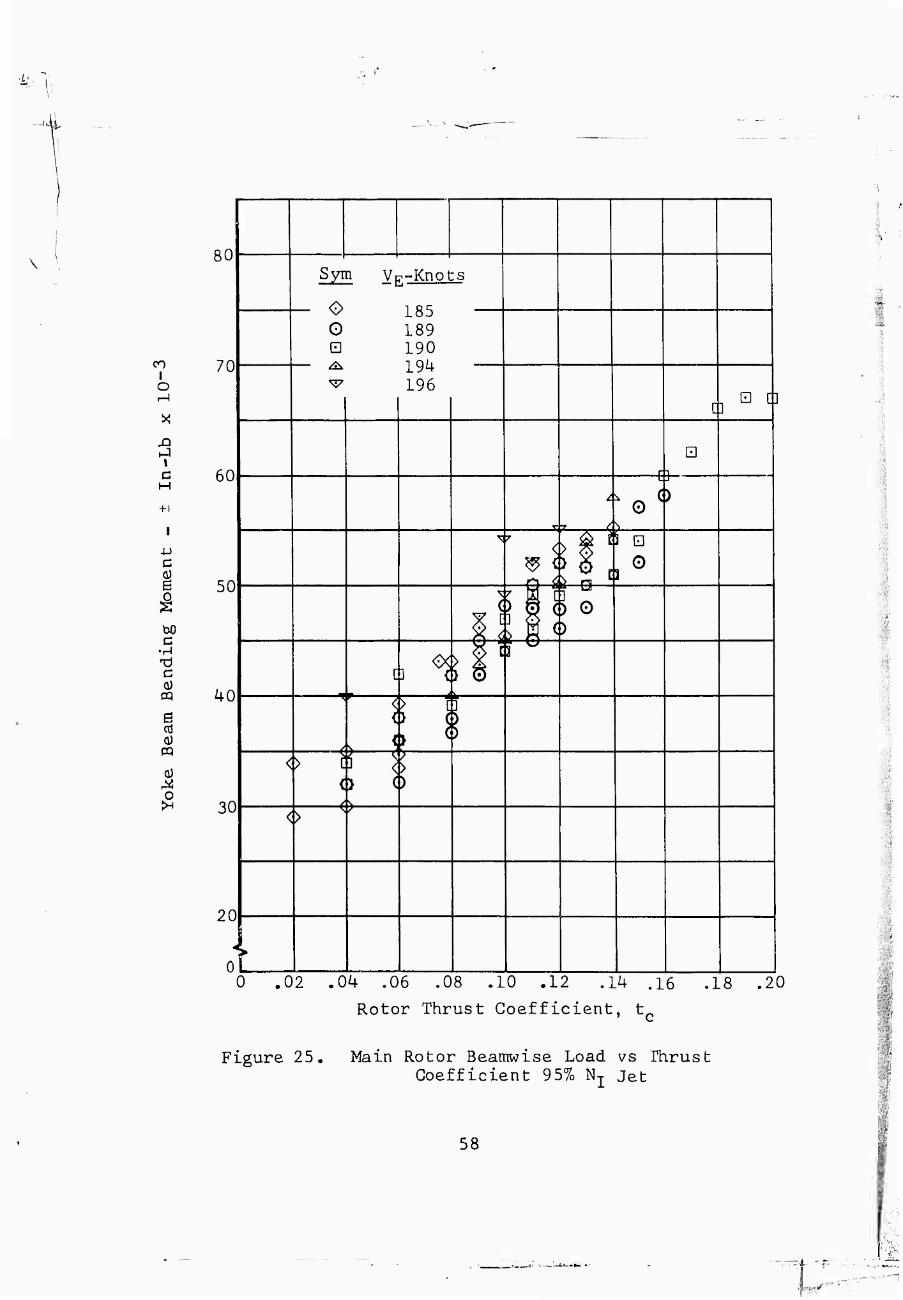
- c
\
CO I o
X)
I c
+1
c
c •H -d c a)
PQ
s cd 0)
PQ
0)
o
80
70
60
50
^0
30
20
i
<>
Sym
<^ 185 o 189 B 190 ^ 194 ^7 196
ir
[] m []
o []
ci
^^
^^
<> § ü—e- o o
o -E3- ()
□
C] H []
0 .02 .0k .06 .08 .10 .12 .14 .16 .18 .20
Rotor Thrust Coefficient, t
Figure 25. Main Rotor Beamwise Load vs rhrust Coefficient 95% N-j- Jet
58
fym n

CO I Q
XI
I c H
+ 1
4J d
o
c •rl
C a)
ß
pq
QJ
o
90
80
70
60
50
40
30
n 1 1— Syrn V^-Knots
O H
<]
192 196 199 203 209
I O
[]
>
< I>
I ^
1$ o
() 0 <)
l>
0 .02 .04 .06 .08 .10 .12 .Ik .16 .18 .20 Rotor Thrust Coefficient, tc
Figure 26. Main Rotor Bearawise Load vs Thrust Coefficient 98% N-j- Jet
59

Ai
140
\
I O
X)
I c H
-U c
C •H
c 0)
DQ
O XJ U
0) ^5 O
L20
100
0 .02 .04 .06 .08 .10 .12 ,14 .16 .18 .20 Rotor Thrust Coefficient, tc
Figure 27. Main Rotor Chordwise Load vs Thrust Coefficient 84% Nj Jet
60

CO I o
I c
+1
4-) c 0) B
bO C
•r-i
c 0)
cq
X) U o
O
140
120
LOO
80
60
i+0
20
0
Sym VE-Knots
o o □
<>
151 155 169 171 183 184 186
<> <>
„it
1L_4L
O
^
Y ^
M
"f
it 4 ^r
n
1"
>-
^
/^
Tftl-
-^^ -m- 0 $
^ /£>.
m
[] O
^
</»
0 .02 .04 .06 .08 .10 .12 .14 .16 .18 .20 Rotor Thrust Coefficient, t
Figure 28. Main Rotor Ghordwise Load vs Thrust Coefficient 87% Nj Jet
61
"W

^■V ■
140
CO i o
I c H
+ i
u C
Ü i b0 C •H t) C a) CQ
o 6
O
120
100
80
60
40
20
0
Sy] EL YE -Knots
169 187 •<; 7
\7
•*7
7
V7
^7
r
□
[ ]
T H r
7 L
] H
J
[ P ]
0 $\
0 .02 .04 .06 .08 .10 .12 .14 .16 .18 .20 Rotor Thrust Coefficient, t
■
Figure 29. Main Rotor Ghordwise Load vs Thrust Coefficient 90% N-j- Jet
62

CO I o
JO
I c H
+ 1
C
e
bO C •H
c PQ
O
o
O
0 .02 .04 .06 .08 .10 .12 .14 .16 .18 Rotor Thrust Coefficient, tc
Figure 30. Main Rotor Chordwise Load vs Thru* Coefficient 95% Nj Jet
::•■, 63
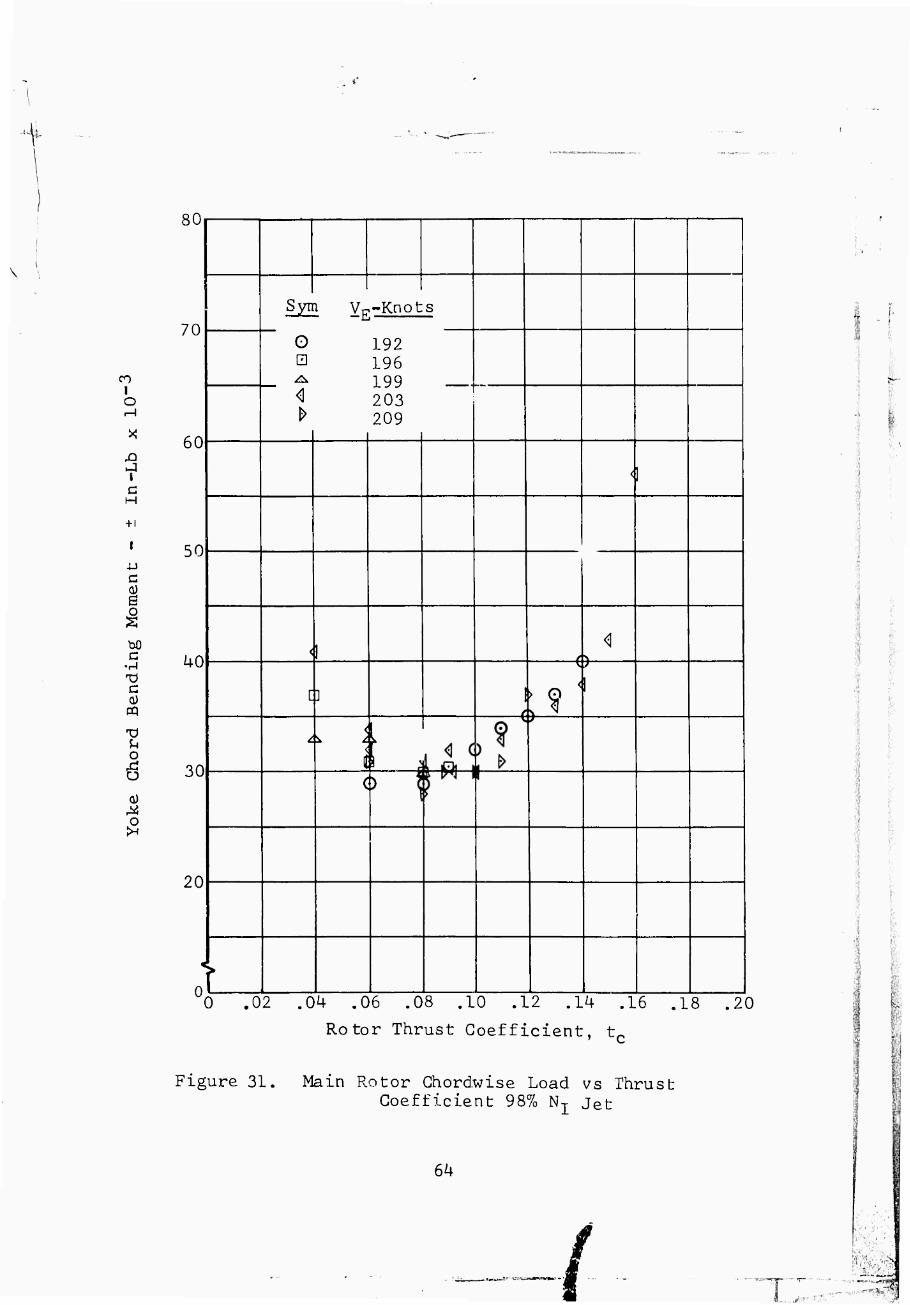
V
80
CO I o
+1
4J C
i i bO c
•H X) c a) cq
o 6 a)
70
60
50
40
30
20
at
Sym vE-Knots
O
<1
L92 196 L99 203 209
/^
()
t <l
0 .02 ,0k .06 .08 .10 .12 .Ik .16 .18 .20
Rotor Thrust Coefficient, tc
Figure 31. Main Rotor Ghordwise Load vs Thrust Coefficient 98% N-,- Jet
6k
■ ■
■
■ I
—..l«.^.!- vi^-
"T

o
-P C 0) •H Ü •H
4-1 (U o o -p m
u
^ 0 4-) O
Oi
0 '—V 0 v .3if .38 .42 .46
Advance Ratio, /x
Figure 32. Limiting Rotor Thrust Coefficients
65
T.T

~ ?m&
66
.
,
.38 .42 Advance Ratio, M
.50
'
Figure 33. Limiting Rotor Thrust Coefficients '■?•

■•■ «i i:- r
20
c H
u 0)
\ bO Q) Q
o •H 4-) 00
CO U a) XJ cö
o c M \
a)
o
15
10
0
Wing Incidence 10° / 0° -
/
/
y /
r
-130C ) Lbs ^
/
n ^+00 L :)S/ —
-160C i Lbs
/
»
s
,/
/
1600
v
*
L \ - Jet Thrus t
0 160 170 180 190 True Airspeed - Knots
Figure 34. Roll Control Response
67
-—r;~ ...fix-**

1.0 o
•r-l n-l O
05 c •H id
j-)
•H bO C o
Ü c H \ U o 4J Ü cd
cO o
o
8
.2
0 I—V 0
Max. Acceleration
Wing Incidence
Initial Acceleration
160 170 180
True Airspeed - Knots
190
Figure 35. Load Factor Control Sensitivity
68
L

o
■-I -U ox:
4J
< bO
S
0) JJ u a a)
^ DO
rt o o2 o)
W x:\ O bO iJ Q) •rJ Q a*
a) u u nl tt)
erf M \ U bO nl a) X Q
X u
•H iJ M
a • =>
o (UBS
nJ r-4 0 u
LOO
90
80
70
1.2 ^-i <u 0
L.O o < r-l
0.8 m
o 0.6 z
bO
o
r-J • uxi
u
< JC bO o <u U Q
tn O •"
CM x: bO
to cd
(UBS
4-)
< bO
8 nl
L2 16 Time - Sec
20 24 28
Figure 36. Longitudinal Response, L52 Knots, Forward Pulse
69
:^.^ -r
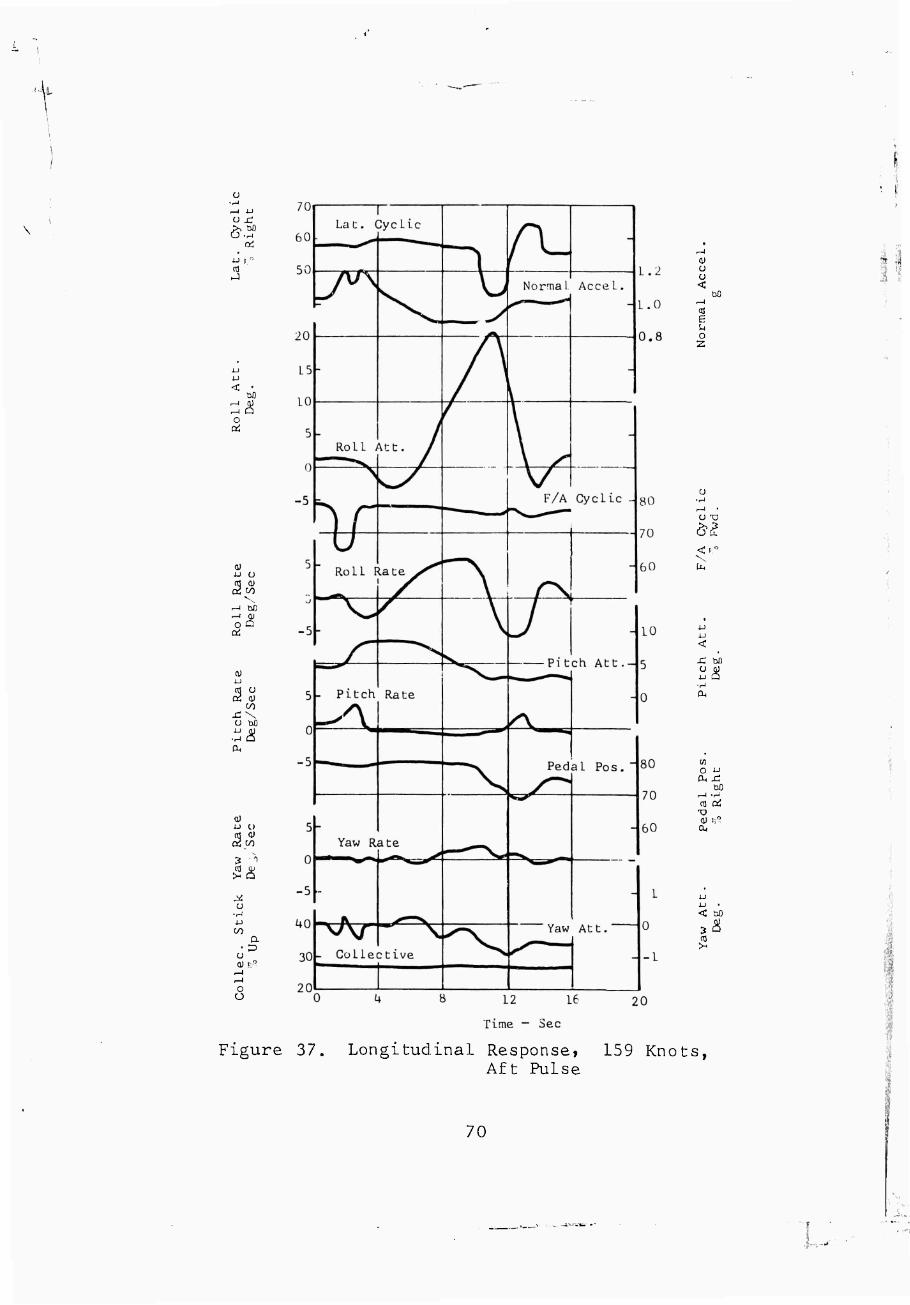
ü
o x;
oi
<
o
01 i-> u (fl 4)
r-l M
o Q cd
CO
n) o Di OJ
ü bO
0)
ni <ü
u ■r-l
C/7 a
• P o 0) s"
o o
0) ü u <
bO
S U o 2
O X)
<
OH
w O -l-i a, x!
bO
nl oi x> a) r," cu
< bO
2ä
Figure 37. Longitudinal Response, 159 Knots, Aft Pulse
70
J-.--- •

o 60 ^- 4-J
ox: 50
XJ r 0 uo
o cd
1-1 o «1 a) rrf 'O \
^-i bll ^-i a) o a cd
a)
ni u o2 Ql
on x:\ u w) u aj
•rJ Q
iJ u tfl <u oi r/3
x ^ bü m ft) >i Q
^ u
■rJ i-1
171 a • p
O a) ft?
o o
(1) o o <
oo
E t
o 2
90 r-4
^^ 80 <■"
\ DL,
70
4-1
< £ bC
Sä
80 w O iJ fcx:
bC /o ^-1 -rJ cd oi
X) ale?
bU cu
JJ
< bC
cfl
Figure 38. Longitudinal Response, 169 Knots, Forward Pulse
71
ft
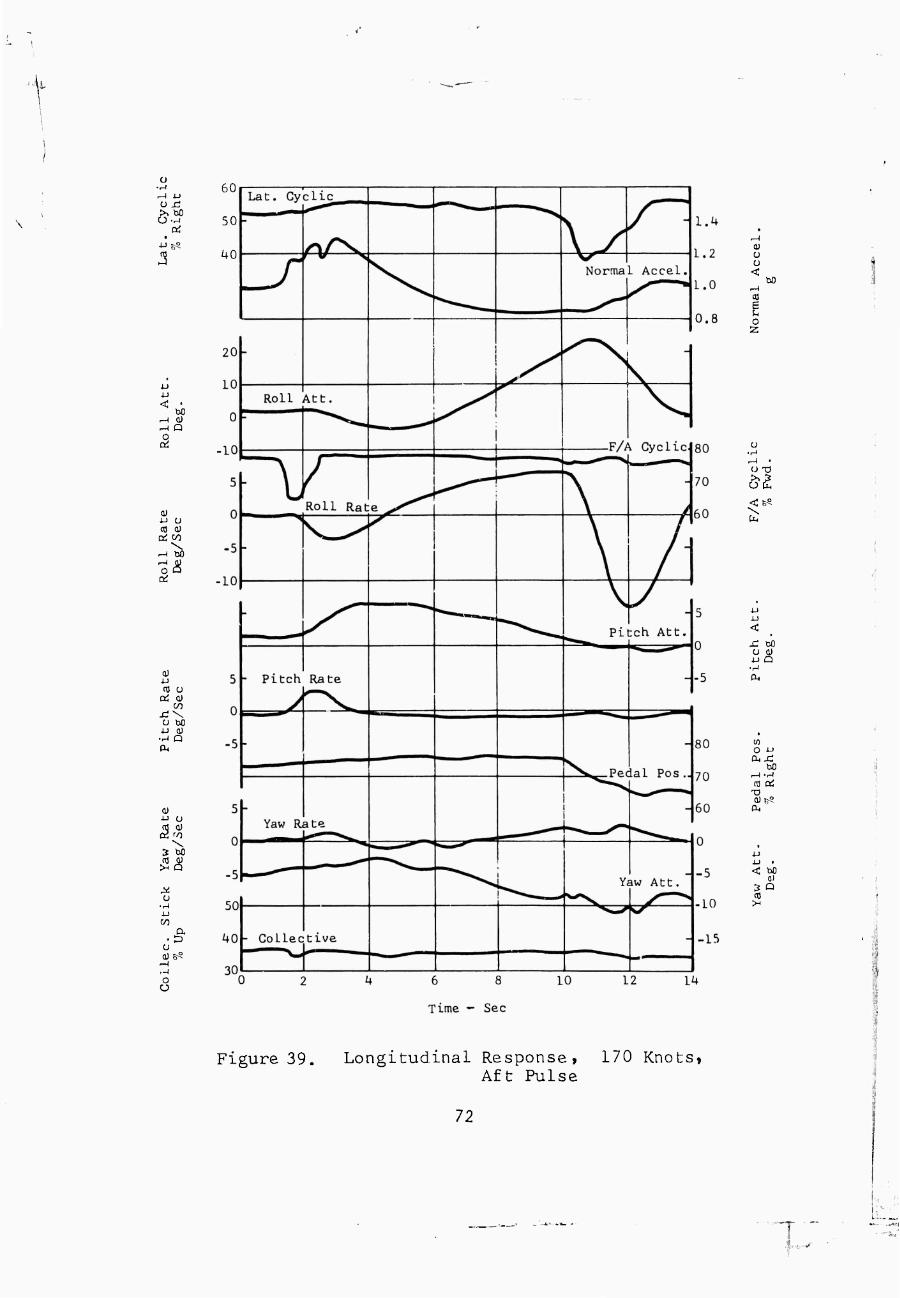
■rJ 60 r-J J-) U JC
^ 50 at
■UB5
.3 kO
r-l 0) r-l Q o a!
a) 4J u a) a) a! on
^ bb
JJ (0 O
cd a) on
O b0 jj a) •rJ Q
ä u a)
3 W)
5S
u
oo a
• 3 u
o o
a) o o <
to
B u o z
(J X)
fa
JJ JJ
< x; bo u a) JJ Q
a,
O JJ OUX!
bO ^J -rJ to Qi
■a
fa
<: bo 0)
(Tl
Figure 39. Longitudinal Response, Aft Pulse
170 Knots,
72
T -

o •rJ ^-1 -U b(' o x: ^
d 50 l->y°
►J uo
< (II Q
C cd
a) u o to a) cdco
a) 4-) n] u ai a)
X:VN. o bO
a) 5 ■u o ni a)
S M U
to a» >H Q
-b
60
a) o a 50
O r/) B5
O 40
L.i+
1.2
L.O
0.8
-|0.6
90
80
- 70
-1
0) a ü <
00
u o 2
a -a
L0 i-) u
5 < ■ UO
■sa 0 i-l
a,
-5
80 , U) 0 i-i a^
/() bO —1 TJ nj cd
60 X) 0) 6S cu
u • < bO
5
6 8 Time — Sec
Figure 40. Longitudinal Response, 183 Knots, Forward Pulse
73

•r-l 60 U JC
so
U t° i+0
4-1
ÖD
O a;
a) 4J Ü nl a)
S r-J 'OO
O Ö Cd
a) JJ n) ü a! a)
on
U bO
(1) 4J O
(0 0) >- Q
u i-l oo
a • 3
o
- l.h
1.2 a; Ü o <
1.0 r-4
CD F=
0.8 o
0
-L
H -2
bO
90 u •rJ ^-1 • O X)
80 0^ <:fio
70 ^r
5 j-i u <
0 £ bO
US 5 •r-*
80 co 0 JJ c^x:
M 70 —i -ri
en oi ■a
60 a,
< bO a)
3 Q
'
Figure i+L. Longitudinal Response, 184 Knots, Aft Pulse
74
T;

—1 XJ /()
ox: >> 00
60
JJ ,9
50
< bO
o cd
a) JJ o
erf c/j \
r-4 W) r-( a) o Q
Di
a) u ni ü a a) x:\ O bO u a)
•rJ Q
a J-> o q a) a oo \
3 bO ni a) >- Q
u
a • 3
u
o u 2U 32 kO
Time - Sec
Ü o <
bO
O 2
OX)
ÖS
\ tu
10 u 4.)
5 < x: bo o a)
0 cu
to o JJ cux:
0)6?
u 4J • < Ü0
&
Figure 42. Lateral Response, 161 Knots, Right Pulse
75

70
ü •rJ 60 ox; >. bO US 50
■ÜB? m k() iJ
u <
bO
5
<U J-i ü tfl 0)
cd M \ --i bO -i 0) oa cd
4-1 m u o2 o) x;\ o bO
•H Q 04
0) u u m tt)
3 bO
u •rJ iJ
a • 3
o
o u
12 L6
Time - See
L.2
Hl.O
0.8
Figure 43. Lateral Response, 159 Knots, Left Pulse
0) ü o <
bO
U o z
90 o •H ^-1 • O T)
80 O S,
70 ^ fc
< bO
■g^
w O -U
bO
(0 cd ■a
i-S i-l .
< bO 0)
3Q :
76
JU-w

70 u
•rJ
^-1 -LI 60 o x: >. bO O—'
a: 50 ■Ufr0
uo
J-J
J-J
<
o cd
a) u u n! a) a! en \
r-l bO
a:
Cfl CJ ai QJ
fO x;\ a w;
•r-l & a,
a) u o ffl (i)
OS w
^ bO cfl (l) >. a
^ u
•H iJ W a
p
Ü s? a) ^
^-4 n o
4) O O <
bO
6 u o 2
o •rJ ~l • O XJ
u S.
4-1
< x: bO
•rJ 0^
90 • O u CUJC
80 bO ^1 TJ
Cfl Oi T)
70 a) &s a.
< bO
>4
r, i
Figure 44. Lateral Response, 174 Knots, Right Pulse
77
mmm mm— -—^—-— ■MM«

u 60 ■r-l
^ u Ü £ 50 >. Ö0 UTJ
Qi • u J
<13 J
o cd
a) Q
■u o nj a)
Di r/1
^-J (1) O Q cd
JJ
cd a)
x;\ o bo
a,
a) u o « 0) cd w
3 bO
>> a
o •H u 00
a • P
ü
a) F^
o o
L.2
0
0.8
Figure 45. Lateral Response, 174 Knots, Left Pulse
(U Ü Ü <
so
E
o 2
9J •w r-t • o -u
80 u £ ^r"
7;) U.
£ bO
04
O i-i
bO r-l TJ m cd
T3 a) RS
cu,
< oO
cfl
■
■
78
- if ■ iLniiff'iMVii'n -iiV-'-iVniif-

•r-i 60 r4 i-> ox: >, bO U'W 50
a: J-) 1 "
CD 40 J
bO
o cd
(1) 4J U
^-i a) o a oi
a)
K a)
4J a) •H Q Pn
a) J-i o n) a) cd "3 \
3 bO
ü
V) a
• 3 o a) 65
o U
o o <
bO
O 2
\
< x: bo US •rJ
90 Ul O i-> a.x:
80 bO
(0 Oi •o
70
JJ • < bO
5
Figure i+6. Lateral Response, 185 Knots, Right Pulse
,«r^r-
79
i .
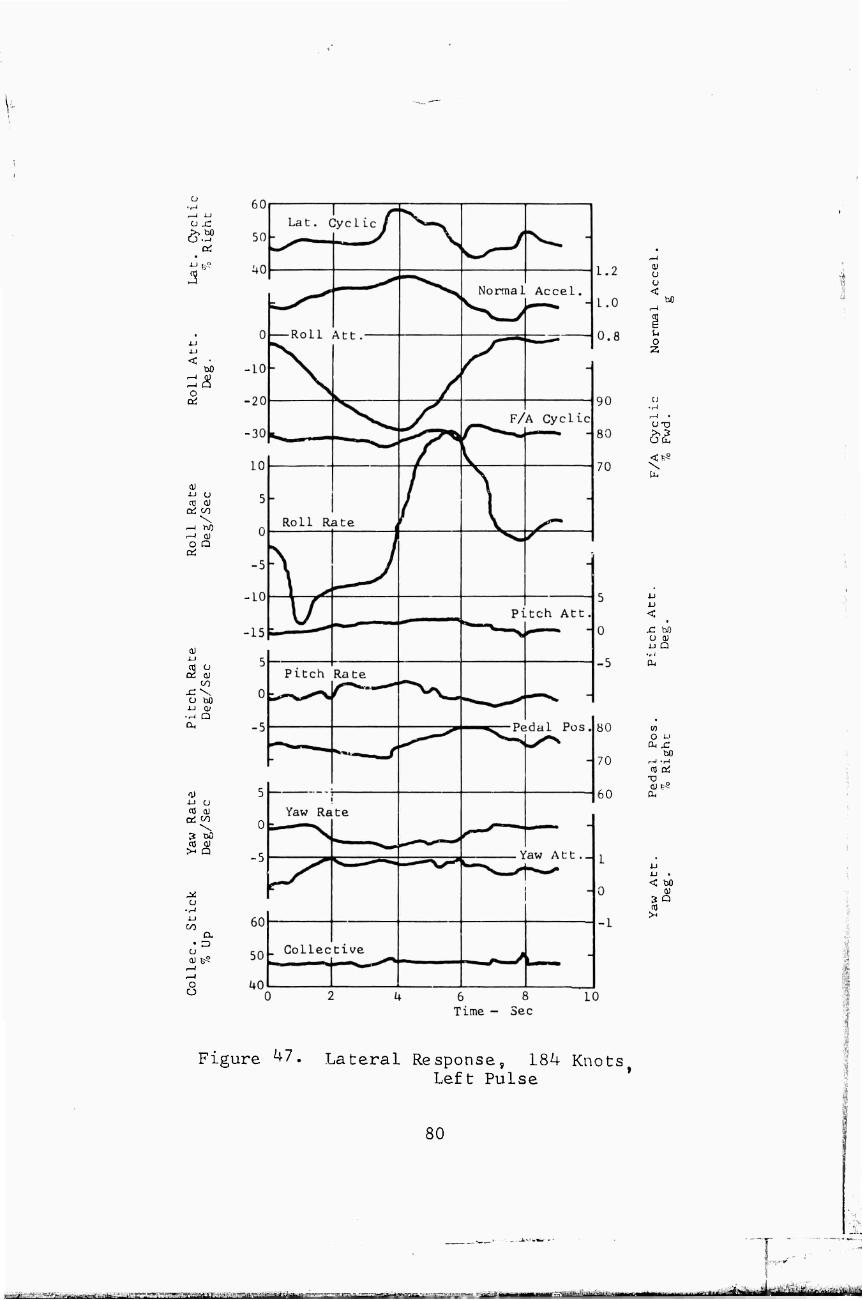
a:
3
o
a) i-i o en ai
cd oo \
,—i W) r-l a) o Q a!
0)
m o d a)
oo
o bO
■rJ Q a,
1) 5 i-l o (fl OJ
OJ 00 0 s 3 bO ca <u
>H Q -5
o u
CO a • 3
o a) &s
o o
Figure ^7. Lateral Response, L84 Knots, Left Pulse
o o <
bO
o 2
OT)
u
< £ bO Ü QJ JJ Q •rl
O u CUJ:
bO 70 r-l T-l
nl oi •o 0)^
bU fc
i-l u • < bO
4
80
!"'.--
— ----.-■-^^- '-:. ...«a.- * "—T • ITiiif ■ MM ■ ^—"r. 'i... L_i ü ; ■■-^*- ' ■" — ■' ' ^ " ^^^^

•r-l 60 ü Ji >, DO
50
4J , o
« UO J
i-J L0
U
< • 60 0
^ 0 a! -L0
a) u u nl a)
cd C/5 \
r-l QO
Cd
(1) J-i n) ü
cd <U on
u bo u n)
•rJ Q
a) •u u cfl a) cd i-o
u
u 00
a • P
u a)&5
o u
a) ü ü <
bO
o z
Ö tu
J u j-j
< 0 Sl bO
u a) i-> a
•rJ
b d,
90 U) 0 4J Okx:
80 bo
r-l TJ n) cd
X) <U fr0
/U a.
< bO a)
Figure 48. Directional Response, 162 Knots, Right Pulse
81
*"■■'■■ -'■"■•"■•■ ■ ■.■.-,., | ,.......:„■..^ Ml—1——■—«MI I mmiiiiii.mi—^—Mi—wilMa« ■«—.*?■*■!■

'rJ 70 ^-1 i-1 or >> M U-^ bO rt U f,0
m 50 J
J-l
bß
O
0) J-) o rt 0)
\ .-I W)
O Q
a) j-> nl ü
Dd a) oo
ü t>0
•rJ Q
a) XJ Ü n] a)
? bO
o •r-l XJ on
a ■ D
o 0)6«
5
o a <
bO
CO
e u O 2
o •rJ r-l •
O TD
x; bo o a)
■u Q
a.
w o J-> pLix;
bO
nl od ■o
< bO
en
Figure 49. Directional Response, 162 Knots, Left Pulse
i
82
3aeBK^----i»---""-.-rwT«u«M!BTii««i^A. ir-- i ^^Imy^gn M.faiKH

o .d >, u
<u Q
O
a) ■u o a! a) cd '/]
—i bO
o Q ai
a)
co a ix a)
CJ bO j-) a)
•rJ Q Oi
J-l o co a) a; ro \
3 bO co a) >> a
u •H 0-1
a • P o
OB«
5
QJ
CJ
Ü
< DO
o 2
(J
SI
< Jd bO
^^ •rJ
80 en 0 iJ Oix:
70 bO ^-1 TJ co cd
■o
60
< bO
Time - Sec
.
Figure 50. Directional Response, 171 Knots, Right Pulse
83
T.X-V
'
«-^"°*-°~—^■' -*-"■-■- wm>mmmaKKie~fr—~ZBzrr?~:~,-r-

\l
•f-l 60 r-i u O £
fr$ 50 ct
<5 40
u u <
00
& o
0) u o m o) oi in s
a) u a] u a a)
d W) u a)
•rJ a a*
Q)
ni a) cd w
3 bfl
u
TO a
• 3 o
o c
a) u u <
bO
u o z
u -a
s u i.1
< 0 x; t>o
ü^ •H
-b a,
O iJ
bO
-d (UBS
CU
J-i .
< bO
Figure 51. Directional Response, 171 Knots, Left Pulse
8k

•r-' 60 u x: >. b£
a: 50
j-i 1,0
a) ■■ ) J
i-J <
bO
O oi
a) 5
cd 00 \ 0
.—i bO
^S a; -5
a) 0-1
OS 4) on
x:\ o to jj <u •H a
a) •u o <« a)
? b0
5^
u 4-) CO
a • =>
ü (ÜB?
o
o o <
bO
o z
o
Ö1 u -o
s JJ JJ
< 0 £ bO
z& ■rt
-b a.
w o ■"
oO
Cfl Di
< bO
Figure 52. Directional Response, L80 Knots, Right Pulse
85
.

>, to u ■-'
cd
u <
0) a c
a) u o
ctf on
r-4 00
o ö cd
(1) i-1 m o cd a)
O bO
o ■r-l
a • 3 o
DB«
o o
u ü ü <
u z
ü XI
o £
(JL,
4-1
<: • bO
CM
O i->
bO
cfl rd
0)155 tu
< M
Figure 53. Directional Response, 182 Knots, Left Pulse
86
brf
Unclassified • Security Classification
DOCUMENT CONTROL DATA - R&D (Security ctaaaitlcatton ot titlo, body ot abstract and mdextntf annotation muat be entered when the ovtralt report in c lassilied)
1 ORIGINATING ACTIVITY (Corporate author)
Bell Helicopter Company Fort Worth, Texas
2« REPORT 5ECURI TY CLASSIFICATION
Unclassified b CROUP
3. REPORT TITLE
High-Performance UH-1 Compound Helicopter Maneuver Flight Test Program
4 DESCRIPTIVE NOTES (Type ol report and inclusive date»)
Final 5 AUTHORCS; (Last name, lint name. Initial)
Van Wyckhouse, James F.
6 REPORT DATE
February 1966 7a TOTAL NO. OF PACES
88 76 NO OF REFS
10 8a CONTRACT OR GRANT NO.
DA44-177-AMC-162(T) 6. PROJECT NO.
1P121401A14311
9a ORIGINATOR'S REPORT NUMBERfSJ
USAAVLABS Technical Report 66-17
9 6. OTHER REPORT NOCS.) (A ny other numbers that may be maaigned this report)
BHC Report 533-099-025 10. AVAILABILITY/LIMITATION NOTICES
Distribution of this document is unlimited.
11 SUPPLEMENTARY NOTES 12 SPONSORING MILITARY ACTIVITY
U. S. Army Aviation Materiel Laboratories, Fort Eustis, Virginia
is. ABSTRACT xhis report presents the results of flight tests conducted with the USAAVLABS-Bell High Performance Compound Helicopter to extend its flight envelope, particularly with respect to maneuvers. Rotors with standard UH-1B and tapered tip blades were evaluated. With the tapered tip blades, the compound helicopter was flown to a true air- speed of 221 knots and the rise in power required and rotor controls load associated with compressibility was delayed by about .05 Mach number. Approximately 55 maneuvers, encompassing a velocity-normal acceleration envelope exceeding 2g's at 190 knots, were accomplished. The distribution of lift between the wing and rotor is defined and it is shown that the rotor provides the largest increase of normal load factor during the maneuver. The rotor and control loads and cockpit vibration data are evaluated and used for trends to define rotor limits. The chord load is characterized by an "abrupt rise" after which a small increase in load factor would have resulted in struc- tural damage. This characteristic of the chord load is used as a basis for defining the maneuver limits of the test helicopter. Normal maneuver and structural limited rotor thrust coefficients are defined as a function of advance ratio and rotor propulsive force. Although rotor system dynamics, blade twist, planform, airfoil, etc., will in- fluence these values of limiting thrust coefficients, it is believed that with proper interpretation the limits shown herein are generally applicable to all rotorcraft.
DD FORM 1 JAN 0< 1473 Unclassified
Security Classification
.-■

\
4
Unclassified Secunlv Chissificilion
KEY WORDS
Compound helicopter High speed helicopter Tapered tip main rotor blades Maneuver capability
LINK B
WO.. E AT
LI NK C
"OL L
INSTRUCTIONS
1. ORIGINATING ACTIVITY: Enter the name and address of the contractor, subcontractor, Rruntee, Department of De- fense activity or other organization (corporate author) issuing the report.
2a. REPORT SECURITY CLASSIFICATION; Enter the over- all security classification of the report. Indicate whether "Restricted Data" is included. Marking is to be in accord- ance with appropriate security regulations,
2b. GROUP: Automatic downgrading is specified in DoD Di- rective 5200. 10 and Armed Forces industrial Manual. Enter the group number. Also, when applicable, show that optional markings have been used for Group 3 and Group 4 as author- ized.
3. REPORT TITLE: Enter the complete report title in all capital letters. Titles in all cases should be unclassified. If a meaningful title cannot be selected without classifica- tion, show title classification in all capitals in parenthesis immediately following the title.
4. DESCRIPTIVE NOTES: If appropriate, enter the type of report, e.g., interim, progress, summary, annual, or final. Give the inclusive dates when a specific reporting period is covered.
5. AUTHOR(S): Enter the name(s) of authoKs) as shown on or in the report. Enter last name, first name, middle initial. If military, show rank and branch of service. The name of the principal author is an absolute minimum requirement.
6. REPORT DATE: Enter the date of the report as day, month, year; or month, year. If more than one date appears on the report, use date of publication.
7a. TOTAL NUMBER OF PAGES: The total page count should follow normal pagination procedures, i.e., enter the number of pages containing information.
76. NUMBER OF REFERENCES: Enter the total number of references cited in the report.
8a. CONTRACT OR GRANT NUMBER: If appropriate, enter the applicable number of the contract or grant under which the report was written.
86, 8c, & 8d. PROJECT NUMBER: Enter the appropriate military department identification, such as project number, subproject number, system numbers, task number, etc.
9a. ORIGINATOR'S REPORT NUMBER(S): Enter the offi- cial report number by which the document will be identified and controlled by the originating activity. This number must be unique to this report.
96. OTHER REPORT NUMBER(S): If the report has been assigned any other report numbers (either by the originator or by the sponsor), also enter this number(s).
10. AVAILABILITY/LIMITATION NOTICES: Enter any lim- itations on further dissemination of the report, other than those imposed by security classification, using standard statements such as:
(1) "Qualified requesters may obtain copies of this report from DDC "
(2) "Foreign announcement and dissemination of this report by DDC is not authorized."
(3) "U. S. Government agencies may obtain copies of this report directly from DDC. Other qualified DDC users shall request through
(4) "U. S. military agencies may obtain copies of this report directly from DDC Other qualified users shall request through
(5) "All distribution of this report is controlled. Qual- ified DDC users shall request through
If the report has been furnished to the Office of Technical Services, Department of Commerce, for sale to the public, indi- cate this fact and enter the price, if known.
11. SUPPLEMENTARY NOTES: Use for additional explana- tory notes.
12. SPONSORING MILITARY ACTIVITY: Enter the name of the departmental project office or laboratory sponsoring (pay- ing tor) the research and development. Include address.
13. ABSTRACT: Enter an abstract giving a brief and factual summary of the document indicative of the report, even though it may also appear elsewhere in the body of the technical re- port. If additional space is required, a continuation sheet shall bo attached.
It is hinhly desirable that the abstract of classified re- ports be unclassified. Each paragraph of the abstract shall end with an indiratmn of the military security classification of the informal ion in the paragraph, represented as fTS), CS), (C). or (U).
There is no limitation on the length of the abstract. How- ever, the suggested length is from ISO to 225 words.
14. KEY WORDS; Key words arc technically meaningful terms or short phrases that characterize n report and may be used as index entries for cataloging the report. Key words must be selected so that no security classification is required. Iden- fiers. such as equipment model designation, trade name, -nili- tary project code name, geographic location, may be used as key words but will be followed by an indication of technical context. The assignment of links, rules, and weights is optiona'
Unclassified Security Classification
1138-66
" '.U