· Background Report Reference AP-42 Section Number: 12.15 Background Chapter: 4 Reference Number:...
84
Background Report Reference AP-42 Section Number: 12.15 Background Chapter: 4 Reference Number: 26 Title: Source Sampling Report for Johnson Controls, Inc., Tampa, FL, CVS #2 Environmental Testing, Inc. 1988
Transcript of · Background Report Reference AP-42 Section Number: 12.15 Background Chapter: 4 Reference Number:...

Background Report Reference
AP-42 Section Number: 12.15
Background Chapter: 4
Reference Number: 26
Title: Source Sampling Report for Johnson Controls, Inc., Tampa, FL, CVS #2
Environmental Testing, Inc.
1988
EPA
Text Box
Note: This is a reference cited in AP 42, Compilation of Air Pollutant Emission Factors, Volume I Stationary Point and Area Sources. AP42 is located on the EPA web site at www.epa.gov/ttn/chief/ap42/ The file name refers to the reference number, the AP42 chapter and section. The file name "ref02_c01s02.pdf" would mean the reference is from AP42 chapter 1 section 2. The reference may be from a previous version of the section and no longer cited. The primary source should always be checked.

mlronmenfial tiesfilng ink
SOURCE SAMPLING REPORT
FOR
JOHNSON CONTROLS, INC.
Tampa. Florida
CVS #2 (East). Stack #l58B. Permit #AC29-121704
Performed by: EWVIR0"TAL TESTING, INC. Charlotte, North Carolina
Paul R. July 198

eiivlronmential testring ink
TABLE OF CONTENTS
INTRODUCTION
SUMMARY OF RESULTS
PROCESS DESCRIPTION
LOCATION OF SAMPLING POINTS
SAMPLING AND ANALYTICAL PROCEDURES
APPENDICES
A.
B.
C.
D.
E.
F.
Summary of Results
Field Data
Process Data
Test Participants
Sampling and Analytical Procedures
Calibration Data

envlronmenbal besbisg ink
INTRODUCTION
Source sampling was performed for the Johnson Controls, Inc.
Tampa, Florida, plant to determine lead emissions from CVS
#2 (East), Stack #1588. Permit #AC29-121704. Three sampling
runs were made on July 13, 1988. A typical sampling
location is shown in Figure 1.
The measurements of stack gas flow rate and pollutant
concentrations were made according to U.S. Environmental
Protection Agency and the Florida Department of
Environmental Regulation (FDER) recommendations.
RepresenQtives from the local regulatory agency ,were
invited to observe the test proceedings.
The following sections of the report treat the summary of
results, the process and its operation, the location of the
sampling points and the sampling and analytical procedures
used.
1

To Atmosphere
FLOW DIAGRAM CVS STACK
Figure 1
Sampling Location
- 2 -
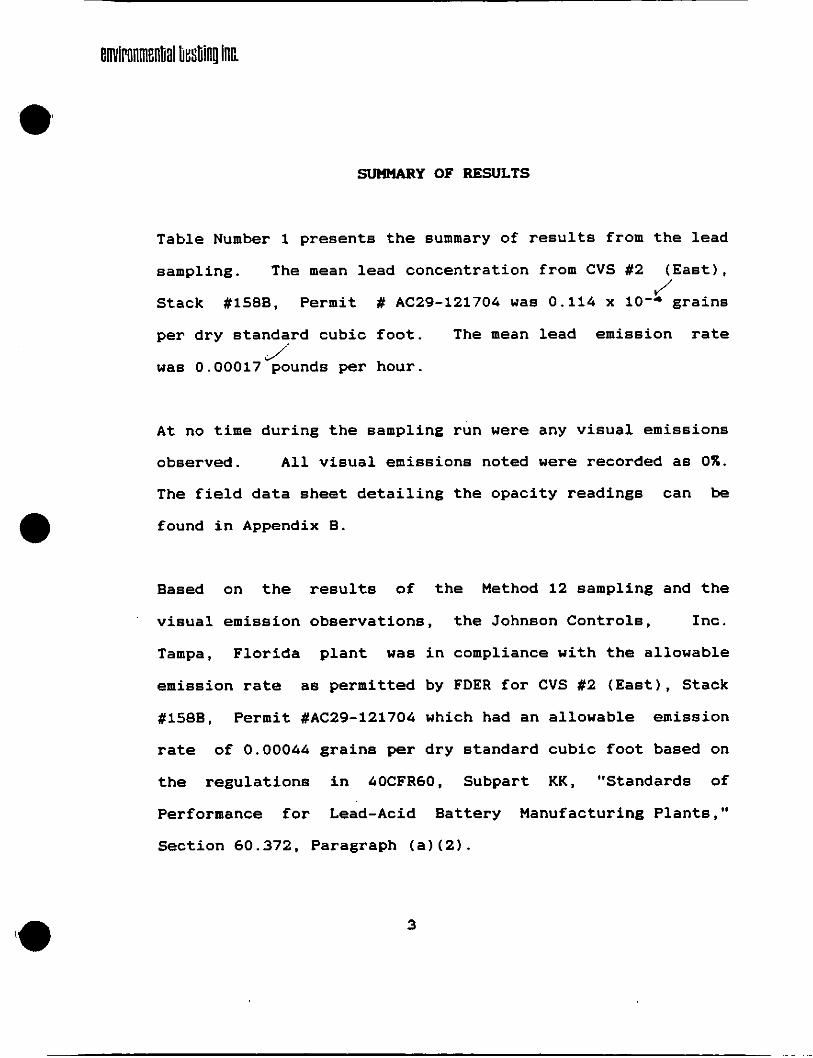
SUMMARY OF RESULTS
Table Number 1 presents the summary of results from the lead
sampling. The mean lead concentration from CVS #2 (East),
Stack #158B. Permit # AC29-121704 was 0.114 x lo-* grains
per dry standard cubic foot. The mean lead emission rate
was 0.00017 pounds per hour.
J
J'
At no time during the sampling run were any visual emissions
observed. All visual emissions noted were recorded as OX.
The field data sheet detailing the opacity readings can be
found in Appendix B.
Based on the results of the Method 12 sampling and the
visual emission observations, the Johnson Controls. Inc.
Tampa, Florida plant was in compliance with the allowable
emission rate as permitted by FDER for CVS #2 (East), Stack
#158B, Permit #AC29-121704 which had an allowable emission
rate of 0.00044 grains per dry standard cubic foot based on
the regulations in 40CFR60, Subpart KK, "Standards of
Performance for Lead-Acid Battery Manufacturing Plants,"
Section 60.372, Paragraph (a)(2).
3

TABLE 1
SUMMARY OF RESULTS. LEAD SAnPLING
CVS 12 (East), STACK #lSEB. PERMIT #AC29-121704
Run Number
Date
9. Isokinetic
Volume of Gas Sampled, SCF l Dry
SCFM * Dry Stack Gas Flow Rate,
Stack Gas Flow Rate, ACFM
Lead :
Catch, mgrams
Concentration, grains/ SCF * Dry
Emission Rate, lbs/hr
1
07/13/88
100.79
52.641
1361.4
1697.6
0.0160
2
07/13/88
103.11
51.798
1318.2
1651.3
0.0470
3
07/13/88
101.21
51.812
1370.3
1712.7
0.0520
0.00000468 0.0000140 0.0000155
0.0001 0.0002 0.0002
'68'F, 29.92 in. Hg **Nozzle, probe, filter, impingers

environmenbal hedin! ink
PROCESS DESCRIPTION AWD OPERATION
The Johnson Controls, Inc. Tampa, Florida, plant has a
central vacuum system that serves the COS machines. For CVS
#2 (East), Stack #1586, Permit #AC29-121704 a central vacuum
system is used to clean the COS machines and the area around
the machines. The resulting emissions are collected by two
baghouses in series and then discharged to the atmosphere as
shown in Figure 1.
No unusual conditions were noted during sampling. The
process was continuous and ran in a normal manner.
5

environmenbal ljesbing ink
-ATION OF SAMPLING POINTS
The dimensions of the stack and the location of the sampling
points are shown in Figure 2. The stack cross section was
divided into 8 equal areas. The ports were labeled A and B.
Each point was sampled for a period of 7.5 minutes per point
which yielded a total test time of 60 minutes per run. The
number of sampling points was determined by the distance
from the last disturbance in the gas flow as outlined in
Method 1, Federal Register, Volume 48, No. 191. 30 September
1983.
6

I 7-
LOCATION OF SAMPLING PORT3 AND POINTS Figure 2
- 7 -

emironmential bestilnr] in8
SAHPLING AND ANALYTICAL PROCEDURES
~ l l sampling and analytical procedures used were those
recommended by the U.S. Environmental Protection Agency and
the FDER. Complete details are found in Appendix E which is
a copy of the Federal Register, Volume 42, Number 160. dated
18 August 1977, the Federal Register, Volume 48. No. 191, 30
September 1983, and the Federal Register, Volume 47, Number
74, 16 April 1982 and the Code of Federal Regulations, 40
CFR Ch. 1, Pt.60. App. A. dated 01 July 1986.
Sample point locations and velocity measurements were made
by Methods 1 and 2. Gas composition was determined by
Fyrite and Method 3 on continuous bag samples. Method 9 was
used for the visual emissions. Method 12 was used for the
lead concentration determination.
8

APPENDICBS
9

6 ' . Q ' I .I . * I I ' Appendix A I .
Summary of Method 12 Lead Results
Johnson Controls Tampa Florida CVH2 (East) Stack %158B
Run Number 1 2
Date 7/13/88 7/13/88
DN Sample nozzle dia., in. 0.306 0.303
TT Net time of test 60 60
PB Barometric pressure, in. Hg. 29.95 29.95
PI4 Average orifice pressure 2.846 2.729 drop, in. H20
vn Volume of dry gas sampled, 56.19 55.61 cu. ft. at meter conditions
TH
VMSTD
vw
VPN
Fnv
MD
Pc02
eo2
FCO
m2
Average gas meter temp. in degrees F.
Volume of dry gas sampled at standard conditions., SCF
Total uater collected in impingers t silica gel, Pa.
Volume of uater vapor at standard conditions', SCF
Percent moisture by volume
Mole fraction dry gas
Percent CO2 by volume. dry
Percent 02 by volume, dry
Percent CO by volume, dry
Percent N2 by voluae. dry
107.88 111.00
52.641 51.798
30.8 35.8
1.450 1.686
2.681 3.152
0.9732 0.9685
0.00 0.00
20.90 20.90
0.00 0.00
79.10 79.10
MUD Molecular wight-dry stack gas 28.836 28.836
MN Molecular wight-stack gas 28.545 28.494
CP Pitot tube coefficient 0.84 0.84
DPS Average velocity head of 0.5769 0.5608 stack gas, inches water
TS Average stack temperature, P 180.38 180.25
Permit # AC29-121704
3
7/13/88
0.300
60
29.95
2.864
55.65
111.44
51 .E12
32.8
1.545
2.895
0.9711
0 .00
20.90
0.00
79.10
28.836
28.522
0.84
0.5818
180.50

PSI
0 PS
vs As OS
QSW
QA
PER1
FMF
CAN
CAII
CAI
Static pressure of stack gas. inches Hg.
Stack pressure, absolute
Average stack velocity, FPM
Stack area, inches sqrd.
Stack flow rate, dry, standard conditions, DSCFM
Stack flow rate, wet, standard conditions, WSCFM
Actual stack flow rate, ACFM
Percent isokinetic
Lead, &.
Lead, GR/DSCF
Lead, GR/WSCF
Lead, CR/ACF
CAW Lead, LWHR
0 FNP Net sampling points
RW Process weight,
'68 Degrees F. 29.92 Inches Hg.
-0.034 -0.034 -0.034
29.916 29.916 29.916
2152.6 2093.9 2171.8
113.1 113.1 113.1
1361.4 1318.2 1370.3
1398.9 1361.1 1411.2
1697.6 1651.3 1712.7
100.79 103.11 101.21
0.0160 0.0470 0.0520
0.4688-05 0.140E-04 0.1553-04
0.4818-05 0.144E-04 0.1593-04
0.3758-05 0.112E-04 0.1243-04
0.0001 0.0002 0.0002
8 8 8
46.9 46.9 46.9

kthod 12 Lead Calculations Test Number 1
Johnson Controls Tampa Florida CVsT2 (East) Stack tl58B Permit # AC29-121704
Volume of Dry Gas Sampled at Standard Conditions 17.64 I VM I (PB t PM / 13.6)
52.641 WSTD E ................................ E
TH t 460
Volume of Water Vapor at Standard Conditions WV E 0.04709 * VU = 1.450
Percent Moisture in Stack Gas
pMv I --------------- 100 I VEN
VllSTD t W
Mole Fraction of Dry Gas 100 - PMV
100 P ----------- 5
2.681
0.9732
Average Molecular Weight of Dry Stack Gas MUD = 0.44 pcO2 t 0.32 * Po2 t 0.28 (PN2tPCO) = 28.036
Molecular Weight of Stack Gas MU E MUD MD t18 * (1-MD) E 28.545
Stack Gas Velocity at Stack Conditions VS E 5129.4 CP DPS ' SQRT(TS t 460)/(PS I MU) = 2152.6
Stack Gas Volumetric Flou at Standard Conditions, Dry 0.123 VS * As I PS I HD
TS t 460 1361.6 QS ............................ D
Stack Cas Volumetric Flou at Stack Conditions QS (TS t 460)
17.64 PS MD = .................... E 1697.6
100.79
' e

" . . ... . '
Lead Loading -- Probe, Cyclone, Filter, Impingers ( At Standard Conditions ) CAN = 0.0154 FMF / WSTD = 0.4683-05
Lead Loading -- Probe, Cyclone, Filter, Impingers ( At Stack Conditions 1
17.64 ' CAN PS MD CAT = ............................. = 0.3753-05
TS t 460
Lead Lb/Hr -- Probe, Cyclone, Filter, Impingers ( At Standard Conditions 1 CAM = 0.00857 CAN QS = 0.0001

RPG'blJ 0 TRAVERSE POINT L O C A T I O N FOR C I R C U L A R DUCTS
/ / Plant C d b L S . I /+.*PA
Sampling Date Inside o f location 7& f r wall to C ~ S outside *a (6 st) ~ ShuKa Perm'# I* (98 AU9-/3/7051 >311 o f nipple Q 1) Inside of near wall to outside o f nipple (nipple length) (P) 5h,'
Stack 1.0. (x-1) 12" Nearest upstream disturbance 3.6 dd Nearest downstream disturbance 20.7 dd Calculated by V K f
I 7 &" 248"
SCHWATIC OF SAMPLING LOtAlION
:- e I I I I I I I 1 I 1 1 I

NETEOD 2 GAS VELOCITY AND CTCLONIC FLOW DBTEBHINATION
Bar. Press., in. Ag 29. 9 5
Stack Press., in. I& 3-9,9/,5
Stack Dimension, In. - Dim. or side 1 side 2
Pitot Tube (C,) 0 , fl Pitot Tube Leak Check <0.1 @ 9 9
Static Press., in. A20 -6.
Static Press., in. Hg - 0. 0 3 q 4 /.?o
in. E20
0
I 1 I I I I I I I I 1
Averagc of ( 6 ) must be < 10 degrees to be 8CCeptable. J N e&
IIOIIAGBAPH DATA


-9 ..'I. .. :_.,-. .. . .
T z
i


. . , ,. . .
. , . MhlmEmIW& METBOD 3 - OBSAT AND DRY UOLECULAB UEIGET DETERHIRATION
s+g 1s a Permr+ P AcJ4 - 1x1 7 9 Sample Location C S*A --kH / Plant /-JArnd Q r n ' S ; /An/.
Sample Type - Continuous r/ Pump Leakfree @ 10" 7 Oxygen Check 20.9% f 0.1% 2 . 9 Fuel Type /vA Orsat Leak Check @ 4 min.:
0
(f Pipet Levels - Leakfree ? Buret - 14.q - fY.L/ - C0.2 ml ? J
Run No. 1 Sample Date $</fg Ambient Temp. OF p ? Sampling Time (24 - hr clock) ,!2K - /3W Analysis By pk3'
Run No. Y Sample Date Ambient Temp. O F
Ambient Temp. OF
imo-i.im iool-(.im
!mm. !mmm

.. “ ~ e a v u o n m e n t r a l h ~ i n o
METHOD 12 SAMPLE RECOVERY AND INTEGRITY SHEET
e
e
3
r G + + $3/6% 5 k r 6
Run Number Sample Date Sample Box Number Probe Number
MOISTURE DETERMINATION AND SAMPLE RECOVERY - IMPINGERS Impingers Cont. Number 6 *I 6-2
clwv Description of Water ClDPr Liquid Level Marked /
Final Volume (wt.). ml 21s 0 2 7 0 Initial Volume (wt.). ml 20.0 b Net Volume (wt.), ml (8) I <O /so
Silica Gel Cont. Number 6 - I 6 -% Silica Gel X Spent Ye” - Final Weight. g 3 1 ~ 5 216 8 Initial Weight, 8 ib.0 m.0
Total Moisture, g 3 .g q(;e
/
Net Weight. g /Kt3 /6.8
SAMPLE RECOVEBY - FILTER
6 - 3 A
Filter Cont. Number Particulate Description rsibh3 Filter Cont. Sealed I / /
4-1 Probe Rinse Cont. Number 6 -2- Liquid Level Marked < AA
b - / . Ws*, .e . .
-
SAMPLE WEIGHT CALCULATIOI
Run # Conc.. mn/l x Vol.. 1 - Blank, m g - Total m x Lead x 0.250 - <O,O/O P O . O l 6 r n - 0.0sa00 x 0.250 - <o.otO
P O , O q 7 @ 1 0 . t O Y
2 0.218 x 0.250 - qo.ofo 0.24t8 3
BLANK CALCULATIONS
Conc.. mxll x Volume, 1 = Total m g < r . c s o X 0.100 = < O . f f O 5
<o.osa X 0.100 P i o . m 4 HN03 Blank
Filter Blank 3 Filter Blank 4 0 . e50 X 0.100 P <0.005
Total Blank <O.OlO
LABORATOKY CUSTODY
if Date Received Remarks :
Received By: Pu( l!b> Stored and Locked.

envlronmentral bestiin! ink
a METHOD 12 ATOMIC ABSORPTION DATA
CYS 12 (East) Stack 11-B Permit CAC29-121704
CALIBRATION DATA
0.020 Standard No. 1 = 0.250 mg/l Absorbance = Standard No. 2 = 0.100 mg/l Absorbance = 0.009
Standard No. 3 = 0.050 mg/l Absorbance = 0.004 0.037 0 .070
Standard No. 4 = 0.500 mg/l Absorbance = Standard No. 5 = 1.000 mg/l Absorbance =
-LE CONCENTRATION DATA
Mean Concentration Run No. 1 - - 0.104 mg/l Mean Concentration Run No. 2 e 0.228 mg/l Mean Concentration Run No. 3 i 0.248 mg/l Mean Concentration Run No. 3 Spike = 0.464 mg/l Mean Concentration Filter Blk. - - < 0.050 mg/l Mean Concentration Filter Blk. - - co.050 mg/l
- - < 0.050 mg/l Mean Concentration 0.10N HNOJ
Analyzed by PRJ Date Julv 20. 1988
Remarks Run #3 spiked with 0.250 me/l for matrix check Spiked recovery: 93.2% EPA QC #386 used for calibration check: true = 0.250
obtained = 0.251 Calibration recovery: 100.4% Precision check at the 0.125 m d l conc. = 15.5% diff. Precision check at the 1.250 mn/l conc. = 0.16% diff.

41R O@SERVA?lONS p. 0. Box 11204 [*I Tampa, FL 33680 (81 3)985- 3285

I
COMPANY NAME J o h n s o n Cont rol s. I n c . . G l o b e B a t t e r v D i v i s i o n
ADDRESS P. 0. Box 1 6068. TamDa. F l o r i d a 3 3687
SOURCE I0ENTIF ICATION;c1 /S t t=2 (gasel *Ck’ /58& ~ f m 1 Y b A C * - l ~ 7 0 ~
10215 N o r t h 3 0 t h S t r e e t . TamDa. F l o r i d a SOURCE LOCATION
DATE h , / j 3 6 8 SAMPLING TIHE:! fa5 TO! 1420
DATA ON OPERATING C Y C L E TIME;
START OF OPERATION, TIME
END OF OPERATION, TIME
ELAPSED TIME 8 hrr IDLE TIME DURING C Y C L E
D E S I G N PROCESS RATING;
PROCESS WEIGHT RATE ( INPUT) ’
BA MATERIAL RATE
MATERIAL- RATE
MATERIAL RATE
JOTAL PROCESS WEIGHT RATEL 1
PRODUCT In/a$.f.. . cu I (eckA
PRODUCT (OUTPUTY
.. w F U N
RATE 3 ~ 5 I b s l B h r s
I c e r t i f y t h a t t h e a b o v e s t a t e m e n t i s t r u e t o t h e b e s t o f my k n o w l e d g e ant b e l i e f .
S i g n a t u r e
T i t l e

.

environmential Destiini Ink
e APPEN’DIX D
TEST PARTICIPANTS
Paul R. Jenkins, Jr.
Richard E. McCain
Vice-president Environmental Testing, InC.
Environmental Scientist Environmental Testing, InC.

THURSDAY, AUGUST 18, 1977 PART II
ENVIRONMENTAL PROTECTION
AGENCY
A i
STANDARDS OF PERFORMANCE FOR NEW STATIONARY SOURCES
Revision to Reference Method 1-8

IUUS *ND IEGUU'IIONS
have pruLtde mmplnrla thrt rin atm ermneowly huh lulluric r l d rnlmmsu- Urnnmm. a tat fa -him m hamrc- pmol haa b e n lneludal In the methad.
4. ' m e # r s n m e ~ c lechnlque for mol*- turn content l rs ther than volumetdr) hsll been Lpd-ted bccauw a mlxture of isopropyl alcohol M d water rill have a volume le% than the sum of the volirrne< ~
of llb cnntenl. 5. A closer corrrspndencc has been
made between s m i l n r parts of Methods R nnd 5 .
~
MISCTLI.ANEOlIS
&vera1 mrnmenlers questioned the memint7 ol the term "SUbJeCt 1 0 lhe 30- proval of t h e Adminlslmlor" in relation to us- alternate tcst methods and pm- cedures. Aa denned ln IoO.2 of subpart A. the "Admlnlstratof' Includes any au- thorlzed represenfallve of the Admlnb- t ra tor of the Environmental Protecllon Apency. AuthoNed representatlves are EPA o m c ~ a h m EPA Regional o m c e or State. local. and reglonal govunmental olllclals who have bem delesated t h e re- spon~lblllly of enforcing regulation4 un- der 10 CFFt80. Thcse omclaLr In consults- Won wlth other slaU members 1Prrmlar mth lechntcal 8bPcLs of source t-%Ttmg wlll rcndcr dcclslons regarding wccpl- able allernale lc~l p m c e d u ? ~
IF. nrc#)PAn(:c c:x, ?'-'.:or. I 1 7 of the
DnLcd: A u n i s t 10. 1917. DOUGLAS M CoJrLr.
Admintrtralor part 60 of Chapter I of nue 40 of me
Code of Kderal RcgulaUm Is amended
0
R D l U l ~ I G I 1 T f I . YO1 4>, NO. IbO- IHUISDAY. AUGUST 18. lP77

- Federal Regis le r / Vol. 48. No. 191 / Friday, September 30. 1983 / Rules and Regulations 45035
Dated Seplrmber Y 1983. amended by revising h!ethod 1 as 2 By adding Citations 7 through 12 to William D. Ruchclshaus, follows: Section 3 (Bibliography) as follows:
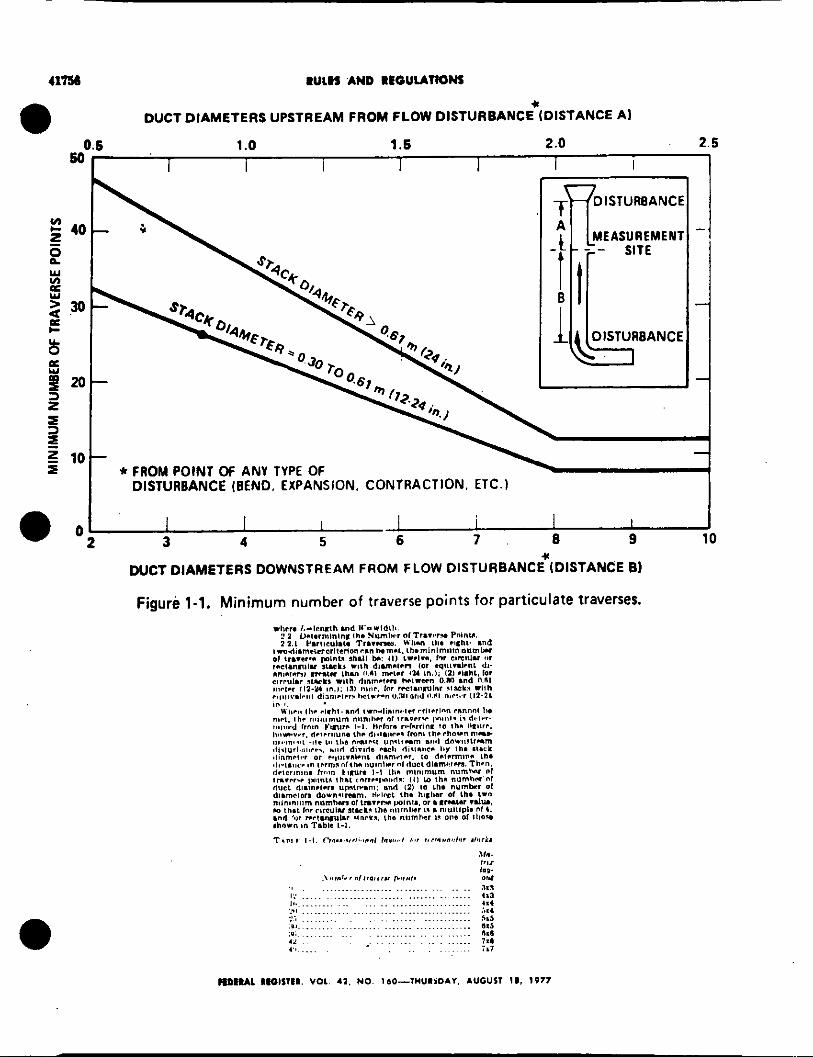
Figure 1-1 and Figure 1- APPCndir A--R~&QQ Melb* . . . . . ..
Sistionary So--ea , . . . . . .. D U C T D I A M f T E R S UPSTREAM F A O H FLDW 0lSTURSbNC:lDlnbNCf A I
1.0 1.1 . 2.0 2.6 I I I I I I 1
0.6 SO
3. ' * * 7 , Hanson. H A R.I. Devini. 1.V- htO50h
and AA. Ivenen. Paniculate Sampling Stratcgieo lor Large Power Planb Including Nonvnifom Flow. U.S. Enrironmenlal Protection Agency. Rercsmh Triangle Perk. N.C hblicatioa No. EPA-Gm/2-76-170. lune 1878.350 p.
Ce6 Samnlinn Manual. U.S. Lwironnenlal 8. Brooks. E.F. and R.L Williams. Flow end
Rolecuon Agency. Research Trangie Park N C. Publicatlor. No. EPA-saO/2-:&2nol l d y 1976.93 p.
Point Study. EPA Conbsct No. f&0%317Z 9. EnMpy Envimnnenlalirls. lnc. Travcne
lune 1w.i~ p 10. Bmwn J. and K. Yu. Teat &port
Particulate Sampling S2alrgy in Circular Dun,. Fmission Mea$mment Branch Emission Standards and Engineering Diviiion. US. b v i m m e n t a i Protection Aaency. Research Triannie Park N . t 27711. . ." . juiy 3i. 1980. 12 p.
11. Hawksley. P.C.W.. S. Ra2doch and J.H. DUCI D I A M E T f R S DOWNSTREbM FROM FLO'.Y O l S T U R ~ A N C E IDISTANCE 8)
Figure 1-1. Minimum n u m k of irawone pcinu (01 p*niculate waver- Blacken Measurement of Solids in Flue Gases. Leatherhead. England. The Brilirh Coal Utilisstion Reararch Arrocmtion. 1961. D. 129-133. DUCiOII* IETERS UPSTREAM FROM FLOW DISTURBANCE LOISTbNCE A I
0.6 1.0 1.6
1 1 i I I 50
'HIGHFR N U U S E R I S FDR R E C I A N G U U R S l b C U OR DUCTS I *
? 40r 2.0 2 .1
L I I
IO - I
I I I I I I I I t o 0
2 1 I 6 6 7 I 9
D C C l D I A M f T E R S 0OWNSTRiA.H FROM F i O W O l S T U R B A ~ C E IDISTANCE BI
12. b a p p . KT. The Nuaber of Sampling Poinu Seeded Icr Reprcwntative Sowce Sampling. Ln: Proceediqs o! the Founh Kational Conference on h . q y end the EnvirvnmcnL Theodorr. L. et nl. led.). Dqlon Dayton Section of *e American Lnr!itutc of Chemical Engineen. Ociaber 3-7, 1876. p. 5 6 3 5 6 8
(SCCI. 111.114. and solla1 of the Clem Air Ad. a6 amended (42 U.S.C 741i.7414. snd 7wl;dl f
41m RULH AND RCOUUTIOMS
+I
DUCT DIAMETERS UPSTREAM FROM FLOW DISTURBANCE (DISTANCE A I
0.5 1.0 1.5 2.0
I I I I I I I
e
a
1 I I 3 4 5 6 7 8 9 0
2 4l
DUCT DIAMETERS DOWNSTREAM FROM FLOW DISTURBANCE (DISTANCE 8 )
Figure 1-1. Minimum number of traverse points for particulate traverses.
l.1. . \ . , , IC? o,,ra,,r., C,,,,,. O l d
'I .................................. 1.3 1.. ........................ I 4 ...................... 3 I ......................... 'li ...................... VI^ ..................................... 8x5 : " i ~ ......... ..................... ns4
. . . . . . . . . . . . . . . . . . 7.4 7.1
4 1 . . ~ ~
(.,..... . . . . . . . . . .
2.5
R D S U L #MlSl€~. VOL. 4Y. NO. IbO--IWU~PDAY, AUGUST 1). 1977

I
8UUS AMD 8€OUUliONS 4in1
W C T DIAMETERS UPSTREAM FROM FLOW,DISTUREANCE (DISTANCE A)
0 5 1 .o 1.6 2.0 2.b 601 I I I - I I I I
I I I I I I I 2 3 4 5 6 7 8 9
0
DUCT DIAMETERS DOWNSTREAM FROM FLOW MSTUREANCE (DISTANCE R)
Figure 1-2. Minimum number of traverse points for velocity (nonparticqlate) traverses.
41758 R U M S A)(D M U T l o H S
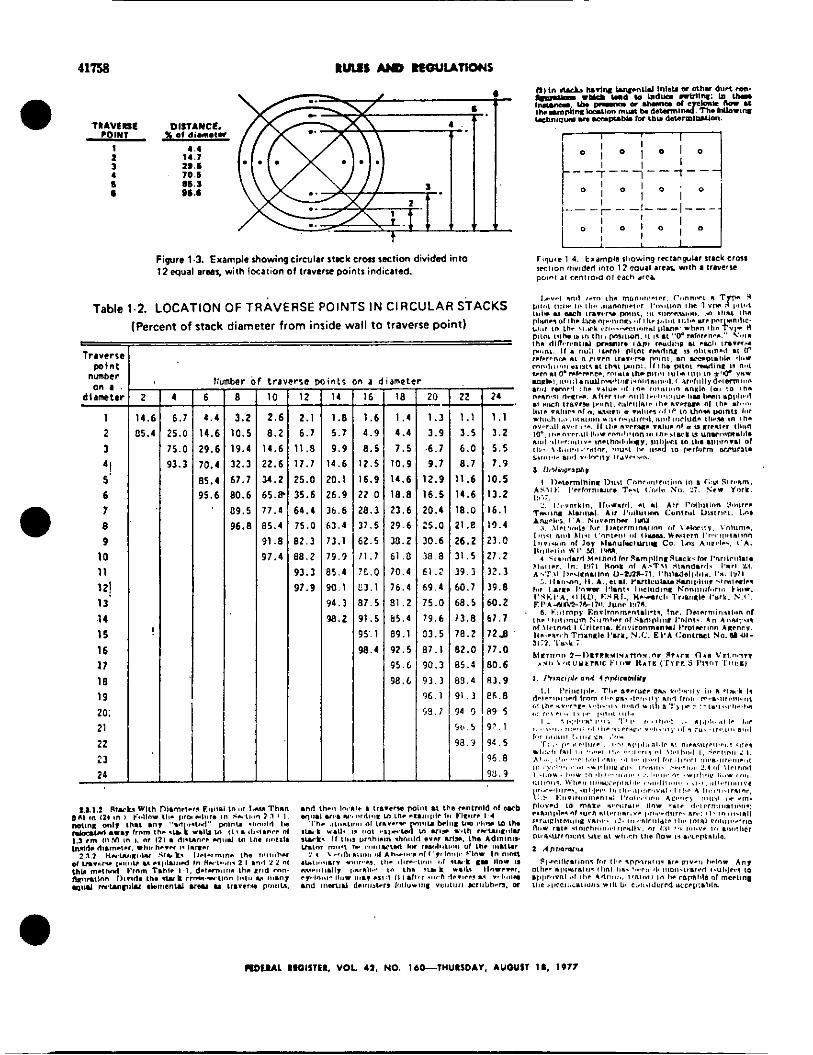
DIS14NCC. 'n4VcnsE POINT % .I dim.,"
I 4.4 2 94.7 3 2Y.S 4 70.6 s 8S.3
9s.s
Figure 1.3. Example ahowing circular s t r k c r m section divided into 12 equal arms, with localion 01 t n ~ c r s e points indicated.
Table 1.2. LOCATION OF TRAVERSE POINTS IN CIRCULAR STACKS (Percent of stack diameter from inside wall to traverse point) -
Trrvrrst mlnr
an a dlimetei
1
2 3
nmbe?
7
4! 5 ' 6 7 8 9
10 11
13 14
15 16 17 18 19
20: 21
22
23 24
It!
-
11 - 6
4 . 4
4 . t
9 . t
0.4 ,5.4 5.6
- 3.2 2 . 6
0 .5 8 . 2 9.4 14.6 12.3 22.6
i7.7 34.2 10.6 65.8 19.5 77.4 16.8 8 5 . 4
91.8
I 97.4
2.1 1.8 1 . 6 6.7 5 . 7 4.9
11.8 9 .9 8.5 17.7 14.6 12.5
25.0 20.1 16.9 15.6 26.9 22 0
64.4 1 6 . 6 28.3 75.0 61.4 17.5
82 .3 73.1 62.5 88.2 79 .9 11.7
93.3 8 5 . 4 7E.0 97.9 90.1 E1 . l
94 .1 8 7 . 5
98.2 91.5 95'. 1 98.1
1 . 4 1 .3 4 . 4 1 .9
1 . 5 .6 .1 10.9 9.7 14.6 12.9 18.8 16.5
23.6 20.4 29.6 25.0
10.2 10.6 61.0 18 8 70.4 6 1 . 2 76.4 69.4
E1.2 75.0
b 5 . 4 79 .6 89.1 0 3 . 5 92.5 T 87.1
59.7
I
1 . 1 1 .1 3 .5 1 .2 6.0 5 .5 8.7 7.9
11.6 10.5 14.6 13.2 18.0 16.1 z1.e 19 .1
26.2 21.0 11.5 27.2
19 .1 3 2 . 3 60.7 19.8
68 .5 60.2 13.8 67.7
78.2 7 2 B
02.0 77.0 85.4 80 .6
B 9 . 4 R3.9 91.1 eK.8 94 9 R9 5 $ 0 . 5 9'.1
98.7 94.5 96.8
13.9

M I S hN0 RIOUU- U764
c-
A. BOTTOM VIEW; SHOWING MINMUY PITOT.NOULE SEhRATlON.
L SIDE VIEW; TO PREVENT PITOT TUBE FROM IYTERfERlNG WITH GAS FLOW STREAMLINES AWROACHING THE NOZZLE. THE lYACT?RESSURE WENING ?LANE O f THE ?IT01 TUBE SHALL BE EVEN WITH OR ABOVE THE NOZZLE ENTRY PLANE.
I
Figure 2.6. Proper pitot tube sampling nozzle configuration to prs(rht rerodynamic interference; buttonhook - type nozzle; centers of nozzle and pitot opening aligned; Dt between 0.48 and 0.95 cm 13/16 and 3/8 in.).
ammi I I Q I I ~ I . VOL. 42, NO. I-IUUWDAV, AUOUII 11. 1977,

Figure2.7. Proper thermocouple placement to prevent interference; Dt between 0.48 and 0.95 cm 13/16 and 3/8 in.).
I
TYPE S PITOT TUBE
Figure 2-8. Minimum pitot-sample probe separation needed to prevent interference; Dt between 0.48 and 0.95 cm (3/16 and 3/8 in.).
4 . 1 t 1 14.d M d W O th. m.nala.ln Turn nil !I#.
TIMUL tECISlH. VOL 41, NO. I b L l W ~ S O A Y , AUGUST I # , 1977

uI68 m e s AND wuum PITBTTUDC IOtNllflCATIOW NUMBER: DATE: ,
CALIBRATED BY: - I 'A"L1DL CALIBRATION 1
1
2
a lSlDE AJ
h r l n l "r(imUon:
Dcvinlion =e..,,- E,( h or B) Equalion 2-3
RMUI UOII111. VOL 41, NO. IW-IMUIIDAY. AUOUII 18, 1P77

I
I
ESTIMATED SHEATH * [ 1'' 1 x 1 0 ) BLOCK,AGE OUCT
Figure 2-10. Projected-area models for typical pitot tube assemblies.
R o l t A l 1101111. VOL. 42, NO. 16O-IHUISDAI. A W S I IO. 1977


4 1 0 RULES AND neauuwms
e
1
i
AVERAGE I
Figure 3-3. Sampling rate data.

R D l U 1Wnni. VOL 4a, NO. ~ ~ ~ U U D A I , AWI? i a , im

FILTER A, vktK CONOENSER-ICE BATH SYnEM INCLUDING IElTUFR IN C T A P U SILICA GEL TUBE 7
, PROBE
.--...-...._-.--.. - OR OUT OF STACK)
I
THERMOMETERS VACL
Figure 4.1. Moisture sampling train-reference nielliod.


lULl!¶ AND lMUUTlONS

41776 RULES AND REQUUTIONS
R . . = - - - V.. ----*E- v.. f v. ,.-,
10.025

IMPINGER TRAIN 0PTIONAL.YAV BE REPLACED BY AN EPUIVALENT CONDENSER
CHECK VALVE
VACUUM LINE
ILTER HOLDER
PITOT MANOMETER BY PAMVALVE
THERMOMETERS
DRY GASMETER AIR TIGHT PUMP
Figure 5 1. Part icul~tc.sarnpl ing train.

4. Rwrdrr,
0
a

41129 RULH AND R R O U U l l W
PLANT
L O C A l l O N
orf n i lon OAlE
RUN NO.
SAH*Lf I O : NO,
Y f T f R A H ~ C FACTOR PITOT TUBf COEFFlClfNT, E, -
YfTIR moa no. El SCnfUI l IC Of I l A C l ClOSS S l t l l f f l
I. I I
D I f f f I f N l l U
Figure 5-2. Parliculale lield data.

41780 mUS AND M W U T t O N S
R n hll
Rlra Ne. Film No.
Amount liquid lost during transport
Acetone blank volume, ml
Acetone wash volume, ml
Acetone blank concentration. mdmg (equation 54)
Acetone wash blank, mg (equation 5.5)
CONTAINER NUMBER
WEIGHT OF PARTICULATE COLLECTED,
I I 1
I 1 Less acetone blank
Weight of particulate matter
VOLUME OF LIOUID I WATER COLLECTED I I I
IMPINGER I SILICAGEL I I VOLUME. 'WEIGHT,
I FINAL
I INITIAL I 1
CONVERT WEIGHT OF WAER TO VOLUME BY OlV lOl f f i TOTAL WEIGHT INCREASE BY OENSITT OF WATER llg/ml).
INCmEASE* 0 a v a w WATER. mi 1 p/ml
Flgum 5-3. Analytical data.
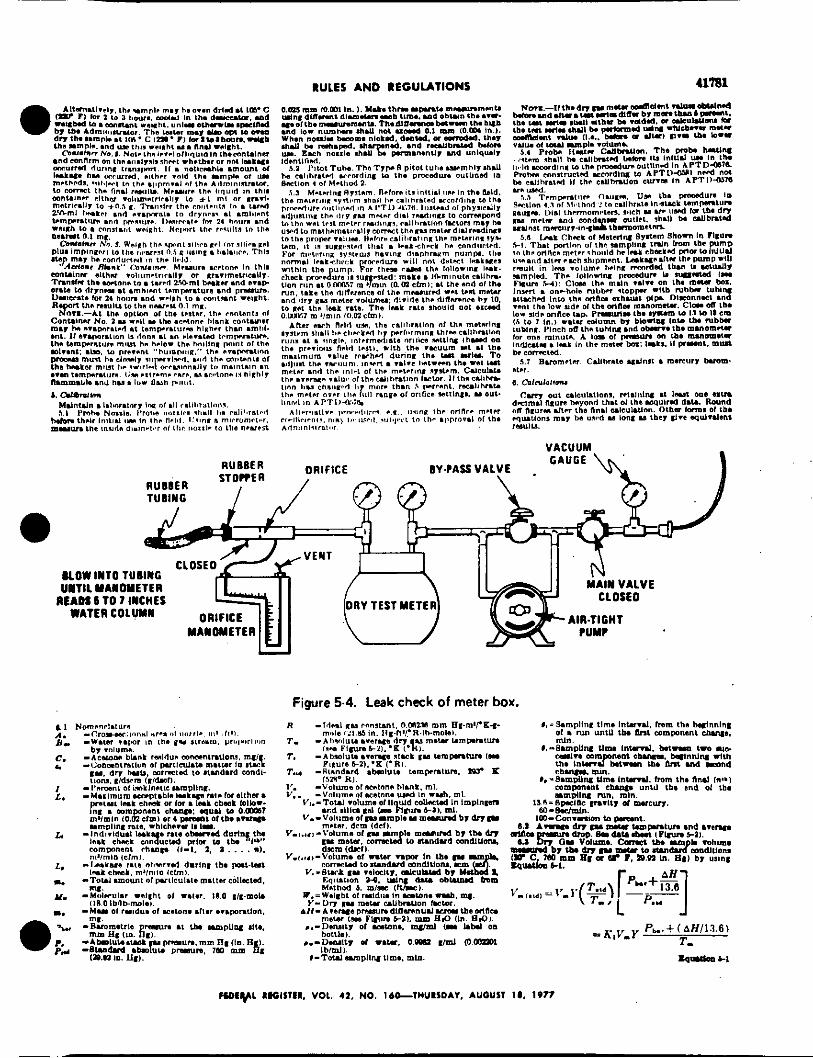
RULES AND RECUUTIONS 41781
a
u o w INTO TuaIWG UNTIL UANOUETER
R E A M 6 TO 7 INCHES WATER COLWN
Figure 5.4. Leak check of meter bow.

RULLS AND REGULATIONS 4113
-1L.- 1 L.18.
.h....

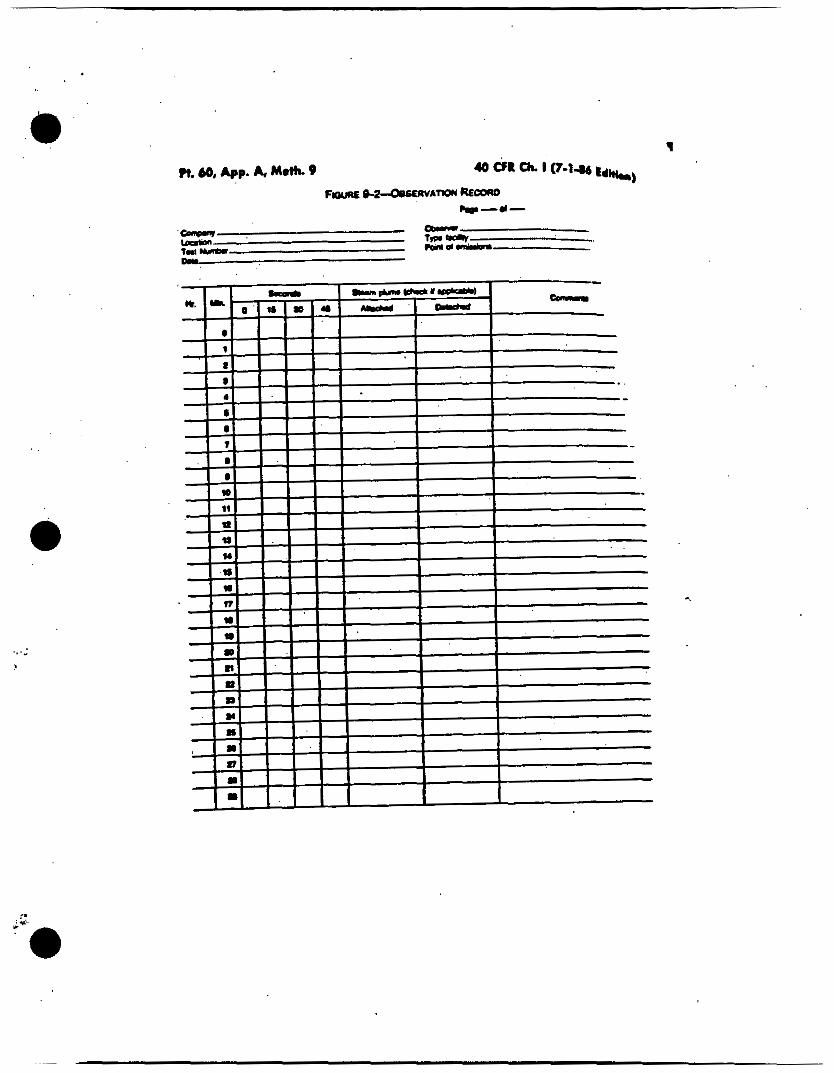
"3 )IETHOD 9--VISUAL DETEFXNATION OF THE
OPACITY OF EUSSSIONS P m n GTATIONARY SOURCES

e
i

i-,
. .
. .
cent incrementa to different black pluma urd 25 dlfferent a t e pluma. wllh an error not IO exceed 15 -t opYlty on w one rr.rllnr and an averwe error not to e x m d ?.E wmnt o W l y In a e h atesor~. Euldtd8La.h.U be tested .oconup. IO l h e
40 CFR th. I(7-1-86 Edition)

. . t;- . .
I
I. :-
re

. , ... , .
. . . . . ? .? . .
..:. . . . . 1 . . .
. . .
.


9' I . * .. . i .~ . : . ! . * f
i i
: . ; .! .
Federal Repistar Vol 4 r . cbo" rrqulred by atandardr d
'I6 i n t emitston limits than tbow *y&hed under Section 111 or thore 0 prccrsnry to attairi or malntain tbe s . u ~ s under Section lllr Accordingly.
s D ~ c e s may in aome cases be @*ect 10 limitations more slrlngent PA', atandardr ofperfonnancr
-aa, section 111, and p m s p d v r
'
for new aource8. raslly. State. are free under Section
of the Act to eatabliab even more
.".- ---- an from the dale ofpromulgation a# '
'*d by the Uean Air Act sh* ??-tW will Lndude an assessment of Fa,... -~ ,.,& facton as fie need for integdion
other programs. the exlstencc of ,!temstive method:. enfoneabiiily, '
i. mremenb In emlssion conbvl &noiogy. and m p d a requhmenb.
r e p o w requirementa In tba ,+lion will be reviewed as required AI^ EpA'a sunlet poliq for reporting
-
Y.." -.-. F..JIt judge whether a regulation b. %fafir" urd thenfore aubjed lo the ,puirernent,of a Regulatozy lmpacl h a l y ~ t a . This regulation I s not Major h a u s e : (I) Tbe national mual ized rompiiance COBIS. Inndudi~ a p i t d &age6 r e s u l h g from tbe rtandardr
test than SIW &ow (21 tbc r:andards do 001 cause a major lncreaae
prices or pmduction c o s 6 m d 13) 16s standards do not cause 8ignifi-t - .dreme elleela on domeatic.mmpctition, emp1o)ment Investment p d u d ~ J @ h m a t i o n or com etition io loreign . : markets.'lhirJationL.aa aubmltted IO the Office of Management m d Budgel [ O ~ ) f o r r e v k w a a r e q u L a d b g ~ _... e Etecutire Order1228L .'.... :.c 3'. . #?quires tbe Admlnislntor lo repare M
new aoune standard ofperformance .. promulgated imder Section 111(bJ of tba Ad. An economic impad assessment war prepared lor tbe rcguletions and for oEm$:$ alttrnativea. All of tho . aacssment were conaidered b &a lormulation of tbe promulgated . . akndardu IO Insure chat the s t a n d a d t add represenf the bed arslem of *zission reduction d d e r i n g cosb. he econodc impact usestmen1 b Wuded In the bechground Monnation kunu?nL b l o l S u b j a i s k & C + R P a ~ & . .
~ f r po~~utlon c o d a AI+& h.aontum sulfate plmb. Cement '
~ u r l r y , Cod Chpper,~ectric pow=
- . kction s17 of the Clem AlrM
' rconomlc Impact assessment P or MY
.
~. 47. NO. 74 / Friddty.'AprO m, 1082
. planta. Clair and ~ass'p~nducla, Crab, --
M e overnmenta B ~&tions.ton. t a d . MetIa. Motor vehlder Nibic a d d planta. Paper and paper produar . . indualry. Pelroteurn. Pborphate. Sewage disposal SleeL Sulfdurlc add plan& W'aste treatment and dispoad ZiDr
Dsled:ApfflS,lPar. . . . Nolr.-Tbe htld doer not lhvoln a
'mllection of In T ormation-aa derued u n b the Papiwork Redudon A d dim l%erefom.'Lhe pmvlsioru of tbe P a p 4 Reduction Acl applicable to s o l l ~ o n a d Wormation do no1 apply to &I r e p l a t l a hneM.GonuQ. . .~ . . Adm;m.slrolor. . ,. ' . . . : - . ... . .. . ' . _ . ,
. .. . . . , , . _ ' PART 6O-STANDARDS OF . PERFORMANCE FOR NEW ' .
STATIONARY - SOURCES . '_ a CFR Part Bo Is amended by adding
* new Subpart KK and by adding a new reference method lo Amendix A u
[a) 'Ibe pm~-ldona 01 tbla abbparl-ars applicable lo the decled facilities Usled b paragraph [b] of this a d o n at any . lead-acid battery manulaavring plant . that pmduces or baa the design capad@ to produce in one day (24 boun) batteriea containingan amount oflead equal to or greater than 6 9 Mg (6.5 tona).
p) 'Ibe pmilsrons oftbis aubpart uc applicable to the foDoning dec led lacilities used in &e manufacture of 1end.acid rtoragc batteriu:
(1) Grid casting facility. (2) Paste mix& facility. f3) Tbree-procma operation facility. (41 L a d oxide manufadlrrfns fadlify.
(6) Other lead+mitthg opsraUo.nr [e) Any facility under pnragraph [b) d
this aection the cons(ruction 01 modification of which t commenced
(51 L a d redamation fadllty. . ..-
- -
/ Rules 3nd Repulations ;€.!in after January 1 4 . 1 ~ ~ 0 . in aubject to Ibe requirementa of thia aubparl. '
~ 6 0 ~ 1 Dennnluoro. Aa used In lhis rubpah all lemr ool
defined herein shall have the mean@ given them in the Act and IO SubpnrtA of thin part
[a) 'Grid casting facility" meana the facility which includer all lead meltin#. pots and machiier used for wstinglbs grid used In battery manufacturing.
. .@I "Lead-acid battery mandacturins plant-means any plant that p m d u m a rtorage battery using lead and lead compounds for the later and aulfvriC '
acid for the electm yie.
facility" means a facility that pruduea lead oxide €room lead, including pmducl recovery. .. . .
(d) %ad redamation faci1ity:meaM the facility that remelts lead scrap aod u l i t i It Info lead hgolr for usein h e battery manufacturing proceca, and whicb Is not a furnace affecled unda Subpart L of this parL
[e) "Other leed+mitling operation- meanr any lead-acid battery I
manufacturing pleat operation Inmi . ahlch lead emissions are conrcled and ducted lo the atmosphere and whlcb b. not parl of a gn'd carti ,lead oxide
mixing, or Chree-process operation . . facility. or a furnace affected under Subpart L of this part.
[fJ "Pasle mixing fadlity" means (bs' facility Indudi lead oxide aloragr.
charglng operations; parte blending, bandling. and cooling operations: and plate pasting. taleoff, cooliag. and
. drylog operations. :. . : le) %e-p-s opmation faci l iv
means tbe facility Indud- those w s s e a involved. with plate stacking
of elemenfs &IO tbe battery cam
f 60dn Standards for b d
perfomance test required to be conducted by 5 m.8 is completed, no owner or operator aubject I6 the' '. .'"
rovlriona of this subpar( ahaD wwc IO !e discharged into &e atmosphem . :.
(11 From any @id cas- facility may gases that contain lead in excess of 0.40 milligram of leadper dry atandard mbic meter of exhaust ( o m 7 6 v/dscQ
(2) Fmm m y paste mi+ facility my pasea Lhaf conlain b excess of I.W ,
of lead per dry etandard cubic meter of exhaust lo .000~ gr/dsd).
@!From any h e - p r o c e s s operation famlty MY gesea that contain in excess .OfI.W milligram of lead per dry
P . _ [c) %ad oxlde manufacturiM . . ,
- .
manufachrrlng. lead rec 7 amatloe p a 9
conveying. weig Yl ing. metering. and
. E umlng or atrap casllng. and assembly
[a) On and after tbe date on which the
. I . . .

16571 Federal Register / Vol. 47, No. 74 / Friday. April Y 6 . 1982 / Rules and Regulation8
alandard cubic meter of exhmust lO.o.mwC grldscr). I .
manufactwiq facility any gases that contain in excent of 6.0 milligrams of lead per k f l o p m of lead feed (ODJO lb\- ton) . (5) Fmm any lead reclamation fadlily any gases that contain In excess o f 4 3 . milligrams of lead per dry rtandard cubic meter of exhaust ( O . W l 9 8 p/dsdl
(6) From any otheilead-emitting ._ operation any gases that contain in excess of 1.m milligram per dry . trandard cublc melei or exhaust lO.wcwC F / d 4 (7J From any affected fadlily olbw
than a lead reclamation fadily sny geser with greater than 0 percent opadty [measured adording lo Melbod s a n d rounded lo the nearest whole percentage)
(e] From an lead reclamation faeflily
opacity [measured according to Melbod a and rounded lo the nearertwhole percentage)
PI \h%en two or more fac1Iities at (be ' name plant (except the lead oxide mmulachuisg fndity) we ducted lo a cornoh wnbd device. an equivalent tcandsrd for the Iota1 exhaust h m lbe commonly conlrolled fadilies shall be determined as IoUom . ._ ..
(4) Fmm any lead oxids
any sasw wi ti greater (ban 5 prcenl
*
_. . . I . . . N ._ - . b-x.%19qW . . , - * ?
a-1 . ." . .. , .__. . , .__. . a-1 . ." .
j 60.¶74 TM! mClhOdl and PrOecdUrrr [a) Reference methods in Appendix A
of this part. exapt as mvidrd under
compliance mecording to 8 60.0 8s . ' ' foU0w- . ...
(1) Method 12 fd the measurement of lead concentration*
(2) Method 1 for sample and ve1odt)i traverse& .
(3) Method 2 for veloclly and volumetric flow rate. and
(4) Method 4 for s l a J gas moi'sturr~ @)For Mehod I Z the tampling lime
for each run rhall be at least W minulcs and &e rampling rate shall be at least 0.85 dsEm/b (0.53 dsd/min). erqepl lhal shorter sampling timer. when . . . . nevssitsled by procesi vatiables or other factom may be approved by I b C Admini8lrelor.
(c) When different operations In 8 three- locess operacon fadlity are
lead emission fancenhration from lhe fadlily shall be determined using lhe
a eo-). shall be use B to determine
ducle x lo separate c o n h l devices. the
a-1
foUollOrvl: .. 11) 6lculale the total imount of lead
C,.-ts thc crmocntration of lend in iht erhaust s h a m in rnlllkrams PI dry tcandard cubic meter as delemined sssodiq toprrasraph IaJlljoflhi? itcUon
in d q ttandsrd cubic mrtcn per hour81 dctcn$ned according to parngraph IaWI of this Usticm. -
F-is thelead Iced rale to the fdl l ly la .. kilogram per hour as determined ~ ~ ~ r d i n p lo paragraph (d) of rhlr
; , . . . . .
.
.a,-il (he dry smdlrd voilumelric n& Ate .
. . > . s e c t l o o lSec. I I4ol~eClcsnAirAcfarsmmded(r~ U.S.C. 7414)J . . - . 2. Appendix A IO Part @ ' i s amended by adding'new Reference Mehod 12 aa
_.. .
. . fOIlOHT ' ., ' . , .
A p p n d u A-Rafcreoa Me&& . . ' ,* . . ... , . Melbod l2 LklermibaUk oftnorgaak Lud . GniDtloo. From slrtiony. &uM
1. AppliiwbilityondPci$& . '
1.1 Applicability. ?hi& mclhod applk. lo Ihe drterrdmtion dlnoqandc kad (Pb) emissions bcm tpcdficd stationay 10~100
O*. 12 Pdndpk.Rllidale .nd parmut'Pb
emisslom uc rllhdnrn ItokIneticaUy fmm lhc n o m and Concded on a lilter and la
' dilute dwcadblbe mnected rarnglea a~ digested to acid . ~ l t ~ t i ~ and analyzed b~ atomic &wrption rpnbornetry uring an air acetylene Oama
Jnnle.ferenoa Zl R.ns. FOI a mlnimum mnalytiul
a r ~ . y d & I O p v c c n L (bclurw B m i t d B e r q r i t t w ~ n c u p p u I L n l t c a o b e umsiderably exlmded by dilution ,
. nnrtuivlun IOI a 3. absorption ( ~ ~ ~ M a ~ a n c . u n l ~ l a m U
' ~ d O 5 ~ ~ / ~ l o r ( b e n 7 ~ a n d z s U m . ' 'Unehrrspicuvdy..' ' .- . e .
w Fitdtlqnlbewllhin-kbOra~ prrdsiou u measwed by Ibc Cnllident d o.riatioo ruy born 0 2 to 05 pu~nl .. ~ l s t i ~ ~ l o a ~ m e ~ wncencrstiop'lbns values WM bssed on IcsU sonducled at 8 . ,
- p n y Lon foundrl;. lead storage bettug . manufactwing p BL a src0ndm-y lead tmdter. mda kadrrcmuy fumaccdm alkyl lead ~ d m c t u r i n g plant. 'Iba conccolrstirmr mcountemd during lhns
' 2.4 I n t e r l m n a . Sample ma* cflecu. may htdm 4th (he analysis for Pb by
.. flame alanis ~btorption U thli Interference b s u s p c ~ c d Lhe analyst may cmrhrm &e presenceoflh.emrrix.ellectr and hqucnlly e ~ t c the Interfercncc b$ us- lbe Method afSfandd Addltionr
High conantrationr of copper may interfen I& Ow wlys i t of Pb at 2170 nm l%Is inlerf- u n be avoided by - analyring the bunplea at a 3 lllp
S.1 bampliTmnln. A schematic of &e umpNnp h t n h a h o m in Fern 1 2 4 H b nlmliu lo the Mclhod 6 lrain. ?he mmpling lnin consists dtbe lonowing wmponentr
.
, '.. 2 lh.Qc S e d t i Y I t y . Mia ond
1l Andjliul ~crUitivl1y. Typical Bl & a q e In
terk ran@ born om io IZ)J q P b / d
a. AP-
.

Federal Register / Vol. 47, So. 74 / Friday. Aprll 16. lea: / Ruler and Replalions 16575
S.1.i pmk N o d e . h k Liner. Pi101
Holder. nitcr Heding System. Mele* Syrlerr. hmmrtrr. mnd Car Dendw Drtcnnlnation EpulpmenL Same as Mclhcd h Sections 2.1.1 IO Zld and Zld lo zl?a n p r c t i n l p
a.12 Implnps. FOUJ impingen connected In rcrier with leal-fm pmund~glnaa nlciw or any simllnr leak-free noncdntrminnlillp fittings. For the lint. third, and low& Impingen. we !he Crccnburg-Smith desi- modified by mplaclng the tip with a 13 6m 1% in.) Ul glass tube extending Io nboul ld cm 1% In.) Imm (he bmom of lhe llask. For . ' . ' .. . the second impingcr. w r the Cmenbq. . .. Smlth design r l ih lhc standard lip. Place thcnnometrr. capable of measuring . - Icmperhtum to m!ithin 3.C (TO at the outlsi
purposes
TU^ DiRrrenlisl R C S W ~ caw. mlcr
. '.
. of the Iowih impingn for monitorillp ..
. _ . . ..
. .
. .
. - .
- . .
. .
%
. . ..
. .
. . .
. . . . . . . - . -
. . , .
.. . .
. .
.
.. . . . . . .
. . , . . ._ . .
. . f . . -. . .
i
. . ' '.I,, - .
e
. . . -
. . . -_ - .
. _ - 2 . _
I
i

36576 Federal Reglslcr / Vol. 47. No. 74 / Friday. April 16.1982 / Rules end Re&lationt
!
! i ! i .
. . .
i . 1
t
/ Rdes and R e p ~ s l i o n s 16577
b woltq domn -I lhir would mile a vamum In the filler holder. thus dm-iq llqdd from the Imptryen into the Wter. &fm moving Ibe sampling (nin IO cbc .
dcanup sile. mmmv tbc pmbc f m m IIU aapling trah nip. on tbr rflicont pease. and u p h e o y n oullct of the pmbe. E+ cmrrful not lo lose any wndcnsste &at mkhl b preicnL Wipe OR the sllicDne greamr bom cb glarrwan Inlet where the pmbe war fastened and csp the lnlcL Rcnovc the umblliclll ad ' born the last Implngcr and u p Ihe lrnphgu. f
inge lesler may use p7und+,aa s toppm . plartic "pa. or serum cepi to c10.e &NO
Transfer the probe and fillcr4nplngn .: msrembly to a c l c ~ u p ana. whlch Is cle? and pmledcd fmm the wind so thai the dunces dwnlamlnaltq or losing (be , , nmple an mlnfmlred. .
hrpecl tbe lraln prlor lo and dwhq -, dirarsemlly and note any abnormd wnditionr. Tmai UIC samples ar rdlowr:
mnme Ihc Wter fmm the filler holder and '
plnce I1 In Its IdcotllicdpeM dirb mnlsinn.U It is oearsy, lo fold the filler. do so .ucb &a1 the umple+apored ride Is lnrldc (be fold. Canfully transfer to the peU disb "9 visible aamplc mallu andlor fiiter liben Ch.1 ad he^ 10 lhe filler holder psskel by using a dr$ Nylon brhllc brush andlor a sharp ldpd bled& &d the mntsha:
6 U Gnbincr Nn 2 Ipmbe]. T a k h a m Ql dust on the oulridc of the pmbe or o h cilcrior d a c e s dner not pel into (be sample quaotiutively recover sample matter or aoy wndemale tom tbe probe n o d s
be filling p m k linu. and ton1 baU of Ihc Ker b d d u by washing these components nitb OJ N WO. and placing tbc rasb into a g h r S J I I I ~ I ~ slorrp conlalner. M c a r w md m r d [Io &e nearnit 2-ml) the total amoua( of ai N "0, u r d for each rinse. Perfom Q ai h' KNO*rLuer i s followe
Cl~fuRy remow lhe pmbe o o d e mnd rinse the Lnrlde surfacer mith 0.1 N "0' .
stainless sledNylon-briskbrur Twitha Bnub h a wash bolllc while b
, mwl tbe ai N EL" rlnre s b o w no vhlbh prtlda. &EI make a f i i h e oftbe hid.' SldaOr ,__ *Brush and &e kith 01 N &O. &E hid. parts of lbe Swagelok fitting lo a slnr l lu way d l no sislble articles remala .
~ n r c the p m L lher njth 0.1 N ~ C C Wbllr mlsung the pmbe DO that ill h l d a vurfasu ultl be r i ~ c d with 0.1 N "0, QI IbcprDbeandqulrILll h.HNLhinlolb. uppu end Le1 the 0.1 h' "0. drain from cb. Imer end Inlo #IC aamplc a n l d n a . n m 1e1lu m y OIC a glssi funnel lo .Id la hndurlugliqdd rashes IO tbc container. Fonow lbe 8inse with a probe brush Hold tbc pmbeIn.rr indindpori t iohaq~R1N' WO. fnlo the upper end of the pmbe u (be pmbe bnnb h be& purbed with a hrir- adion l h u g h Ibc p m k bold the sample cantliner mdemealh the lowu end of cb probe wd akl~ my 0.1 N "0, and umpk mallu that h h h r d fmm the pmhe. Run the b s b l h v h the pmbe Uvec l l m ~ Q ; mmt MW no d s M e rample matter b wed wl m4tb (be 0.1 N HNO. and none remnlns oo the pmbc lina on vhual inspection With
. . . - wcnlnF.
6Zl &n&;narh'o. J ~ l i l r r ~ Canfully "
.
/. . -,' - <
. ..

,,.>
. : i 16579 Federal Rcgislm / Vol. I?, NO. 74 / Friday. April 16. 1982 / Ru!er and Replalions e .
i
- ._ . .
a l n o b n o c unlin. for i n c o ~ ~ '
Pmpamd ntandards and for NrdyI h* ulibration ~ n a . To delemine atabillfy of lh camklm' :.
Catwe. run a blank and a n l m d d aflerer.* five r tnp lc r and reuUbn(r. a$ n r a r r y . .
this I ~ S L ulculate V.u the Iota1 volumed dry gar metered m m c t c d lo nlandsrd .; . condiUonn [ZOO'C i nd 780 mm Hg). by u r l q Equalion bl ol Method h Unecermy. adjust Vmbt for kalages an outlined io Scdion 63 of Method 5. See Ibc field dolo sheel for Ute average dry gam meter temperalum and ". ._ average o G c e presaum drop-
12 Volume of Waler Vapor and Molrhus C6nlcnL Uring d a b obtained In thir leal and Eguatlonn b 2 and €4 of Melhod 5. cnlculmle the volume of water vapaV.w) and Ihe mqiriwe wntent B, 01 the r laJ p a . . . * 13 Total L a d In S o m Sample. For em&
SOUKC nnmple m m c l the werap ab.odmnce for the conlriiutian of the filler. b l a d and Ibc 0.1 N "0, blunl. Use (br ulibril ion m e and thh mded abrorbmse lo delenninr Ibr pg Pb consenbalion in the nampk aspirated Inlo * the npcciropholomeler. W c u l a ~ e Un IdaIPb mnlcnt C, [in pg) in (he oriaind .om : .ample; somct for dl the dilutions that were made i o b* the Pb concentntion ofthe
7. c O l C " ~ 0 l l ~ 7.1 cas Volume. uning the data it& -
-
,
.ample Inio the linear range of Ibr . . . rpclrophotomelcr. . .
<n-P.'am.' . . 9.4 ~ i i s h e U . W.]. and M.R. Midsen
Lklermining Inorganic and Alkyl L a d &missions from SIaUonnry S o w n . U.S Ennuironmental Froledton Agency. Emirdon Monitoring and Suppo~I Lsboraloq. Rewar& 5riengl;ParL. N.C (Pnen l rd a1 Nallonml APCA Mecling. Houston. lune m. 1978).
'
~ os Same as Melhod 5, Wlalionn 2 lo 5
.
mnd 7 of Seclian 7. - . . . . . . - - (Sea. in. 114. and Jm(a) of the Ocan Air As( as amended [U U.SC 7411.7414. .nd 7rmiai)) p n k r - m m r ~ e x ~ n s ~ ] . ~ l l ) * c m o t n n c - w , . ..._ .

\ . .
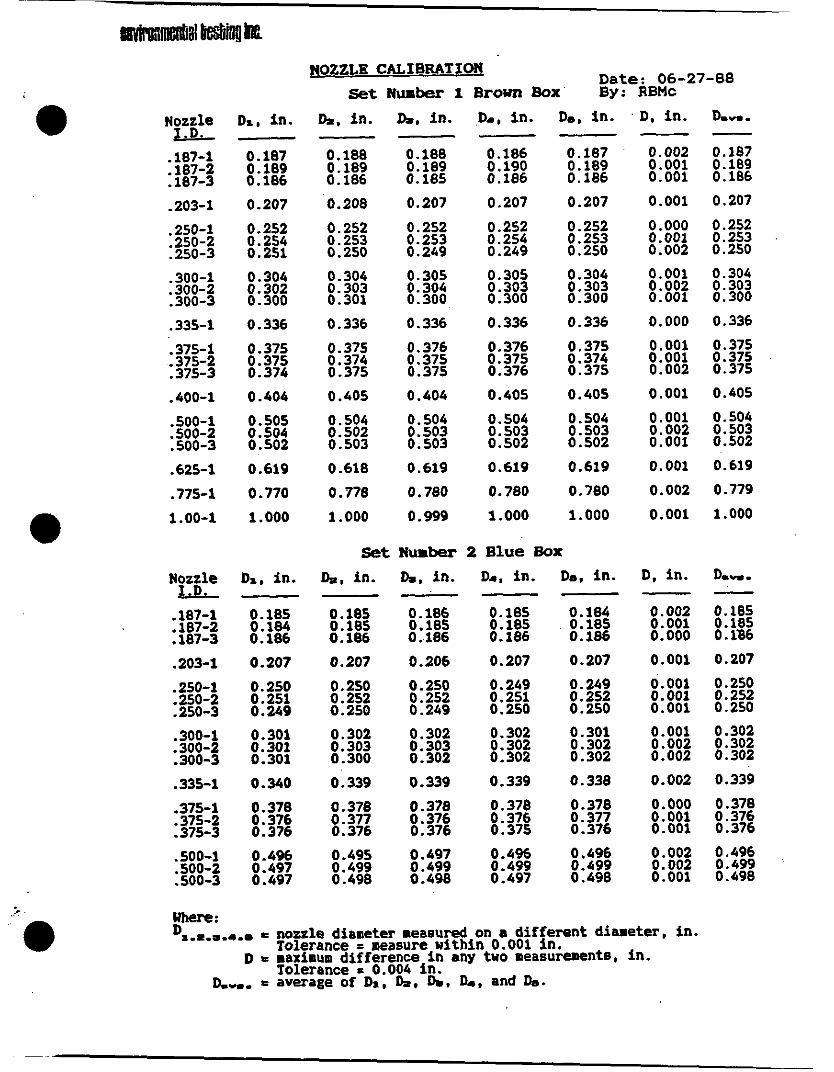
NozzIs Each new set of nozzles vurchased bv ET1 are first machined and ~~
calibrated before being put into field use. Thereafter, whenever it becomes apparent that a nozzle has been damaged, it is again machined and recalibrated. A set of three is matched to within' 0.002 inches (Mfference betveen high and lw readings). Nozzles are checked prior to each source test.
PrroT TWES All pitot tubes used by ETI whether seuarate or attached to a samDlinn pro& vere made by )TI-personnel. Pribr to being put into field'use; they are calibrated. In general, if a type "S" pitot tube is constructed properly, and not positioned too closely to the probe nozzle or any other obstruction, it will have a Cp of 0.83 - 0.87. As long as the pitot tube is not damaged its calibration should not change. All ETI pitot tubes are made to have a Cp of 0.84. If a pitot tube does not initially have a Cp of 0.84, it is altered until a reading of 0.84 is obtained. Pitot tubes are checked before each source test and receive a complete calibration once a year.
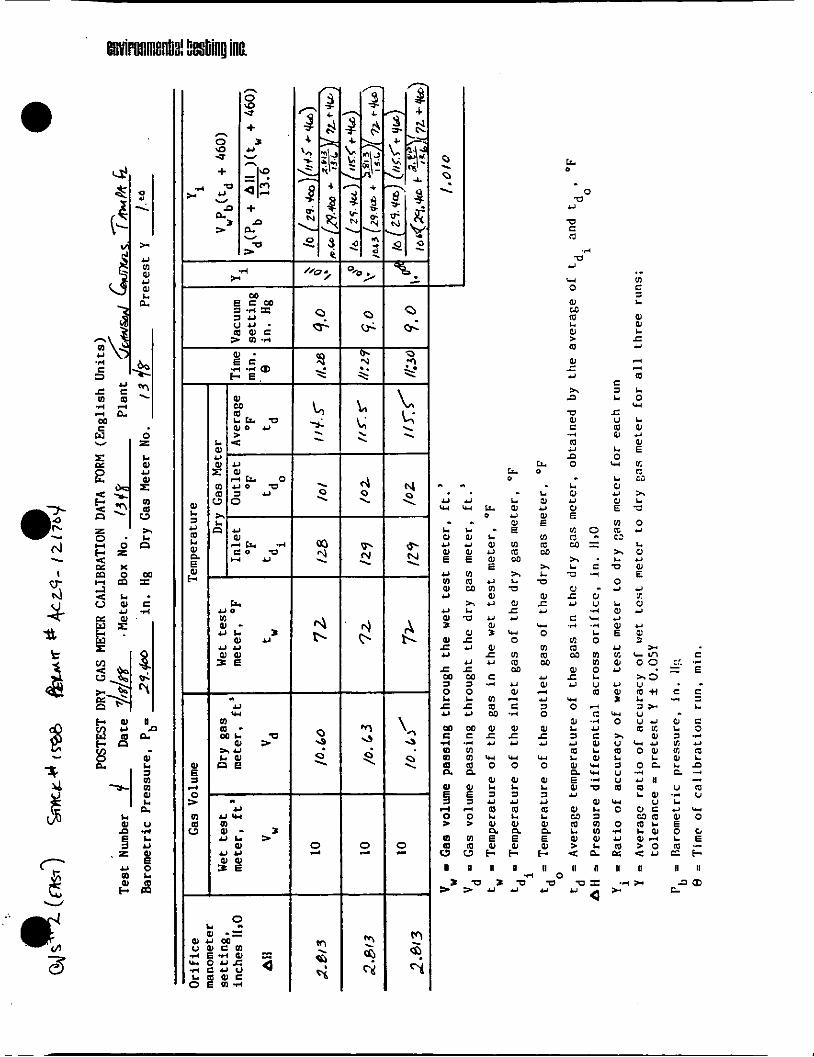
DBI GAS lIEw AND m a HEmR Complete meter box calibrations are performed annually. One point calibrations at the average orifice meter and maximum vacuum readings encountered during the compliance test are performed after each source test. If the dry gas meter calibration factor differs from 1.00 by more than *0.02 then the dry gas meter is repaired and given an annual calibration.
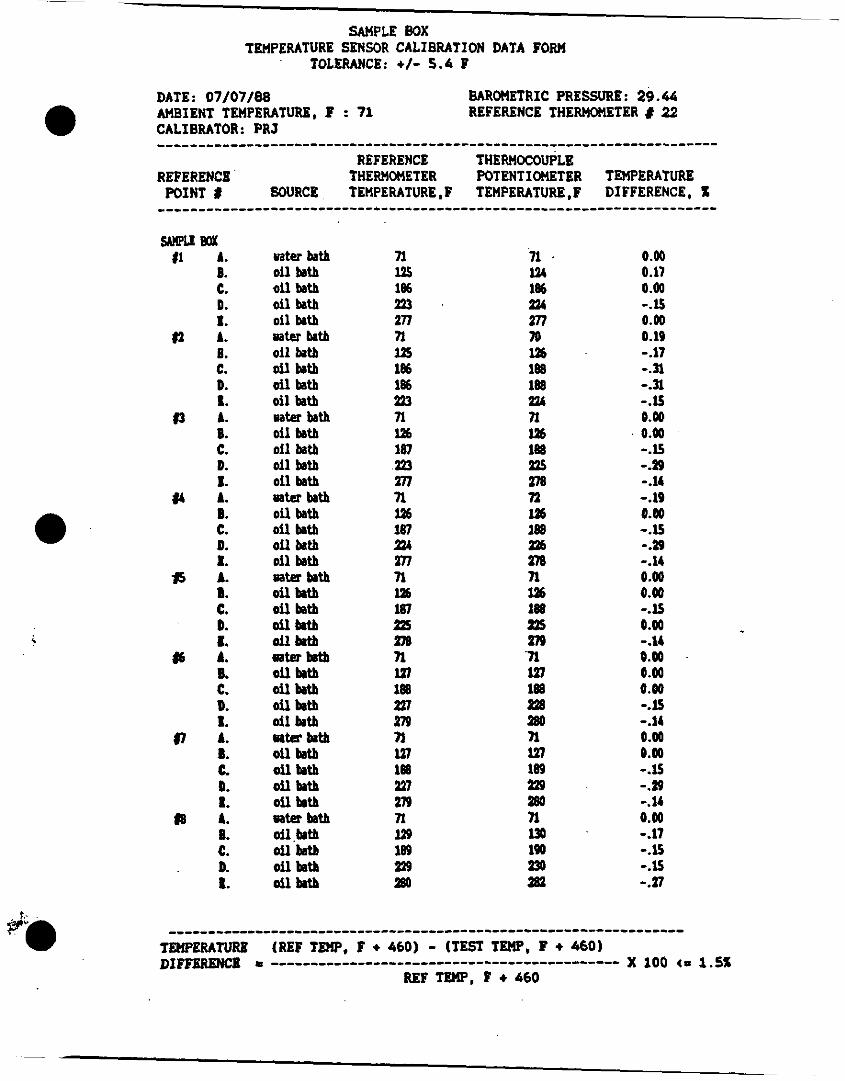
-. m. 03SAT AIiD ORSAT BAtS Each new thermometer, uyrometer and thermocouDle nurchased or ..
manufactured by ElT is- ch&iked and calibrated before biing put into field use. After each source test each temperature sensing device used on the test receives a one point calibration check according to U.S. EPA guidelines.
Fyritee, oraat and orsat bags are checked before and after each source test. If they do not function according to U.S. EPA protocol that piece of equipment is either repaired or replaced.
LABoRAmY mllmeNT ET1 has a written quality assurance document that covers calibration and maintenance of laboratory equipment. This includes calibration of the analytical balance against Class S veights, and service contracts to maintain traceability to N.B.S. Calibration of thermometers, barometers, stopwatches and vet test meters are traceable to N.B.S. A copy of our quality assurance document may be obtained by written request.

llEIBoD 5 PRFTEST - POSTEST CALIBRATION CEECKS
P h h l %, L., 7a, PL FI Calibrated by $ Plant Meter box number /3& Date 7-8-@/ 7-1888
Dry Gas Ueter Pretest meter calibration factor, Y =
Recalibration required? Circle one: If yes new Y = - Postest meter calibration factor, Y =
Lower cal. factor. Y =
(within f 2%) (within f 5% of pretest)
(pretest or postest)
Dry Gas Meter Thermometers Was a pretest temperature correction used? Circle one: yes or@ If yes
Postest comparison with mercury-in-glass thermometer? (within i10.8'F at
Recalibration temperature correction? If yes, no correction necessary for calculations if meter thermometer temperature is higher; if calibration temperature is higher, add correction to average meter temperature for calculations
Stack Temperature Sensor Was a pretest temperature correction used? Circle one: yes or @ If yes
Average stack temperature of compliance test, 6 4 OR
Temperature of ref. thermometer for recalibration #1 82 6r/( OR Temperature of stack thermometer for recalibration 81 82 A o R Diff. between ref. and stack thermometer temps. Do the ref. and stack values agree within f1.5%? Circle one:
temperature correction
ambient temperature) Recalibration required? Circle one: yes or @
(within f 5.4OF over range)
(within f5.4'F over range
temperature correction 2 OF (within f1.5% in OR over range)
(within f 10% of the average stack temperature)
If yes, no correction is necessary for calculations If no, calculations must be done twice-once with the recorded values and once with the average stack temperature corrected to correspond to the reference temperature differential; both final result values must be reported since there is no way to determine which is correct
Barometer Was the pretest field barometer reading correct? Circle one: @x no Postest comparison? ,oO< in. Hg (i0.l in. Hg) Recalibration required?
Circle one: yes or no If yes, no correction necessary for calculations when the field barometer has a lower reading; if the mercury-in-glass reading is lower, subtract the difference from the field data readings for the calculations. Retest Postest
Hg in glass 2 9 . o d #.67( Field Difference
Nozzle Was the nozzle calibrated to the nearest .001 in.? Circle one: yes or no Nozzle #1: .sod .304 ,30< .go< .3d : Average 9 4 Nozzle 82: .302 .& -304 ,303 ,303 : Average 3 3 Nozzle 83: ,300 .MI ,300 -300 ,300 : Average 300
ImuinRer Thermometer Was a pretest temperature correction used? Circle one: yes or@ If yes temperature correction = (within f5.4'F over range)
-ft t
t
L Y O
a - Y l . 3 U U
m
a u
g 2
I Y
I Y
u w a - 3 Y L . > a Y Y
m
g 2
L , L - i L ; . . - . -+ . . 7 . 0 ? \ d
I; 0 " " . .
k D
0 U
Y
W C n
.rl U
Y
4 0 W co L U > m 01 .c u x D
U W C
m
.4
Y 9
m
L O


Date: 03-15-88 Calibrator: RBnc
SpeCifiC*tiOM: 1.) Pitot tube assembly must be level. 2.) If pltot tube is damaged explain under comments section. 3.) z E A s i n T (~0.125) and Y = A sin B (~0.03125) 4.) a ~10. and 6 (5.
36"- 1 36"- 2 40"- 1 54"- 1 66"- 1 96"- 1 4 - - 1 4' - 2 4' - 3 4' - 4 4' - 5 4' - 6 5' - 1 5' - 2 5' - 3 5' - 4 6' - 1 6' - 2 6' - 3 6' - 4 8' - 1 8' - 2 8' - 3 8' - 4 8' - 5 8' - 6 8'9" 9'7*'-1 9'7"-2 12'6"
2.0 1.0 1.0 1.0 2.0 0.5 2.0 0.5 1.0 2.0 0.0 0.5 1.0 1.0 1.0 1.0 0.0 0.5 3.0 3.0 1.0 1.0 1.0 1.5 1.0 0.0 4.0 0.0 0.0 1.5 2.0 0.5 3.0 2.0 2.0 0.5 1.0 3.0 1.0 4.0 0.0 0.5 2.0 1.0 1.0 1.0 0.0 1.0 4.0 2.0 2.0 3.0 0.0 1.0 1.0 4.0 4.0 1.0 0.5 0.0 0.0 2.0 2.0 1.0 0.5 0.0 2.0 1.0 1.0 0.0 1.0 0.5 2.0 1.0 0.0 1.0 1.0 1.0 1.0 3.0 0.0 0.0 0.0 1.5 1.0 1.0 1.0 1.0 2.0 0.5 0.5 2.0 1.0 0.0 2.0 1.0 0.0 0.0 1.0 0.5 0.0 1.0 1.0 1.0 0.0 0.0 2.0 1.5 1.0 1.0 0.5 1.0 1.0 0.5 1.0 0.5 1.0 0.0 2.0 1.0 1.0 1.5 3.0 2.0 3.0 1.0 0.0 1.0 2.0 2.0 0.0 1.5 4.0 6.0 3.0 0.0 0.0 1.5 1.5 2.0 1.5 1.0 0.0 0.5 2.0 1.0 0.0 0.0 1.0 1.0 0.0 0.0 0.5 3.0 1.0 0.5 1.0 2.0 0.5 0.5 0.0 2.0 2.0 2.0 0.0 2.0 0.0 1.0 1.0 3.0 1.0 2.5 1.5 1.0 1.5 1.5 2.5 2.5 0.0 0.5
0.778 1.151 1.100 1.006 1.040 0.910 0.966 0.891 0.878 0.839 0.866 0.955 1.001 1.045 1.048 1.038 0.995 1.004 1.009 1.000 0.845 0.905 0.932 1.017 0.985 0.925 0.895 0.918 0.960 0.809
0.027 0.000 0.000 0.018 0.000 0.032 0.000 0.000 0.000 0.007 0.007 0.017 0.017 0.000 0.037 0.036 0.000 0.035 0.018 0.035 0.044 0.000 0.000 0.000 0.017 0.016 0.000 0.000 0.025 0.000
cornento: Only minor filing and cleanlng required.
Pitot tubes requiring further calibration: None.
0.00679 0.01 004 0.00960 0.02633 0.02722 0.00794 0.00843 0.01555 0.01532 0.00000 0.00000 0.00833 0.01747 0.02735 0.00915 0.01812 0.01737 0.02628 0.00881 0.01745 0.01475 0.02369 0.02440 0.00887 0.01719 0.00807 0.03124 0.01602 0.01675 0.00705
0.389 0.575 0.550 0.503 0.520 0.455 0.483 0.445 0.439 0.419 0.433 0.477 0.500 0.522 0.524 0.519
0.502 0.504 0.500 0.423 0.452 0.466 0.509 0.492 0.462 0.447 0.459 0.480 0.404
0.498
0.389 0.376 0.576 0.377
0.503 0.380 0.550-. 0.388
0.520 0.455 0.483 0.446 0.439 0.420 0.433 0.478 0.501 0.523 0.524 0.519 0.497 0.502 0.505 0.500 0.422 0.453 0.466 0.508 0.493 0.463 0.448 0.459 0.480 0.404
0.386 0.376 0.378 0.371 0.375 0.375 0.372 0.376 0.375 0.377 0.376 0.380 0.380 0.378 0.377 0.375 0.378 0.380 0.376 0.379 0.379 0.378 0.380 0.382 0.375 0.377
k
')ate: 06-27-88 y m
Nozzle L L -187-1 .187-2 .187-3 -203-1 .250-1 -250-2 -250-3 .300-1 .300-2 -300-3 .335-1 .375-1 -375-2 .375-3 .400-1 -500-1 .500-2 .500-3 .625-1 .775-1 I. 00-1
Nozzle
.187-1
.187-2
.187-3
.203-I
.250-1
.SO-2 -250-3 .300-1 -300-2 .300-3 .335-1 .375-1 -375-2 -375-3 .500-1 .500-2 .500-3
D., in .
0.187 0.189 0.186 0.207 0.252 0.254 0.251 0.304 0.302 0.300 0.336 0.375 0.375 0.374 0.404 0.505 0.504 0.502
0.619 0.770 1.000
-
D., in .
0.185 0.184 0.186 0.207
0.250 0.251 0.249 0.301 0.301 0.301 0.340 0.378 0.376 0.376 0.4% 0.497 0.497
Set Number 1 Brown Box i r ~ : -RBMC
0.188 0.188 0.186 0.189 0.189 0.190 0.186 0.185 0.186 0.208 0.207 0.207 0.252 0.252 0.252 0.253 0.253 0.254 0.250 0.249 0.249 0.304 0.305 0.305 0.303 0.304 0.303 0.301 0.300 0.300 0.336 0.336 0.336 0.375 0.376 0.376 0.374 0.375 0.375 0.375 0.375 0.376 0.405 0.404 0.405 0.504 0.504 0.504 0.502 0.503 0.503 0.503 0.503 0.502
0.618 0.619 0.619 0.778 0.780 0.780 1.000 0.999 1.000
set NW- 2 B l u e BC b, in. h. in. i n .
0.185 0.186 0.185 0.185 0.185 0.185 0.186 0.186 0.186 0.207 0.206 0.207 0.250 0.250 0.249 0.252 0.252 0.251 0.250 0.249 0.250 0.302 0.302 0.302 0.303 0.303 0.302 0.300 0.302 0.302 0.339 0.339 0.339
0.378 0.378 0.376 0.377 0.376 0.376 0.376 0.376 0.375 0.495 0.497 0.496 0.499 0.499 0.499 0.498 0.498 0.497
De, i n .
0.187 0.189 0.186 0.207 0.252 0.253 0.250 0.304 0.303 0.300 0.336 0.375 0.374 0.375 0.405 0.504 0. SO3 0.502 0.619 0.780 1.000
IX
De. in .
0.184 0.185 0.186 0.207
0.249 0.252 0.250 0.301 0.302 0.302 0.338 0 378 0.377 0.376 0.496 0.499 0.498
D. in. h-. - - 0.002 0.187 0.001 0.189 0.001 0.186 0.001 0.207 0.000 0.252 0.001 0.253 0.002 0.250 0.001 0.304 0.002 0.303 0.001 0.300 0.000 0.336 0.001 0.375 0.001 0.375 0.002 0.375 0.001 0.405 0.001 0.504 0.002 0.503 0.001 0.502 0.001 0.619 0.002 0.779 0.001 1.000
D. i n . h,. - 0.002 0.185 0.001 0.185 0.000 0.186 0.001 0.207
0.001 0.250 0.001 0.252 0.001 0.250 0.001 0.302 0.002 0.302 0.002 0.302 0.002 0.339 0.000 0.378 0.001 0.376 0.001 0.376 0.002 0.496 0.002 0.499 0.001 0.498
o,.P.P.I.I I nozzle diameter measured on a different diameter, in. Tolerance = measure uithln 0.001 i n . Tolerance 6 0.004 in.
D t maximum difference in any two measurewnte, in. D.*.. = average of Ds, Ib. h. De. and De.

RAC STAKS"LR CUIBRATION SHEET Mter Box Serial Number: 1348 Bar~tric Pressure (pb): 29.763
Calibrated by: PRJ Leek Check 0 6.8 In. W : OK Dste: 01-29-88 Rup: OK Rup 011: OR Clean Quick Connects: OK
Llghte: OK Electrical Check: OR Variac: OK
Man. Orifice CP- . CFa T- IT- OTa Ta -v-- T1.e t
nanometers: OR Dry Test et-: OK rherwaetera: OK
Vacuum Gauge: OK teek Check 8 27' Hg.: ~ 0 . 0 0 1 CFM'
0.5 5 5.33 68.3 108.0 96.0 102.00 12.70 1.0 5 5.34 68.4 115.0 97.5 106.25 9.32 1.5 10 10.73 68.5 119.5 99.5 109.50 15.46 2.0 10 10.76 68.5 124.0 101.5 112.75 13.45
4.0 10 10.71 68.5 126.0 103.0 114.50 9.68 3.0 10 10.75 68.5 126.0 103.0 114.50 11-14
Calculate Y and -H. aa follous:
0.0317 4 (1. + 460) t )* 8 . . I . & CT' R (1. m 4 rso) 1 . __------------------ .1.m Ch IR -Iu13.6)IL + 46060) R (1. * 460) Q.
IOlWanCH: 1 * 0.W - !& - 1.10 1 t/- O.(M! * 1.6 - !& - 2.1 &a t/- 0.15 10.
UWTIQI e b ~ ~ l f m KIP UQ ana LWIP
Delta B 0.5 1p. Iw 0.01SBs 168.3 + 460) 12.79 *
0.997 = -___-__________ +-------- ) s1.706 1 ,--------------------- = 5 I 29.763 f102.00 t 460)
5.33 (29.761 + 0.0#8)1€4.3 + 460) 29.763 f102.00 t 460) 5

.
IHPINGER TEMPERATURE SENSOR CALIBRATION DATA FORM
TOLERANCE: +/- 2.0 F
DATE: 07/07/a0 BAROMETRIC PRESSURE: 29.44 AMBIENT TEMPERATURE, 0 : 71 REFERENCE THERMOMETER # 22 CALIBRATOR: PRJ ......................................................................
REFERENCE THERMOCOUPLE REFERENCE THERMOMETER POTENTIOMETER TEMPERATURE POINT I SOURCE TEHPERATURE.P TEMPERATURE,F DIFFERENCE, %
IWJW fl A.
8. C.
II A. 8. C.
f3 A. B. C.
H A. B. C.
15 A. B. C.
ice bath uater btb oil bath ice bath vat- bath oil bath ice bath Wter bath oil bath ice bath wter bath oil bath ice bath uater bath oil bth
35
111 35
111 35
111 35
112 35
ll!k
n
n
n
n
n
35
112 36 n 111 35
111 34
112 36
1U
n
n
n
n
0.00 0.00 -.18 -.m -.19 0.00
-.19 0.00 0.20 0.00 0.00 -.a 0.00 -.17
0.00
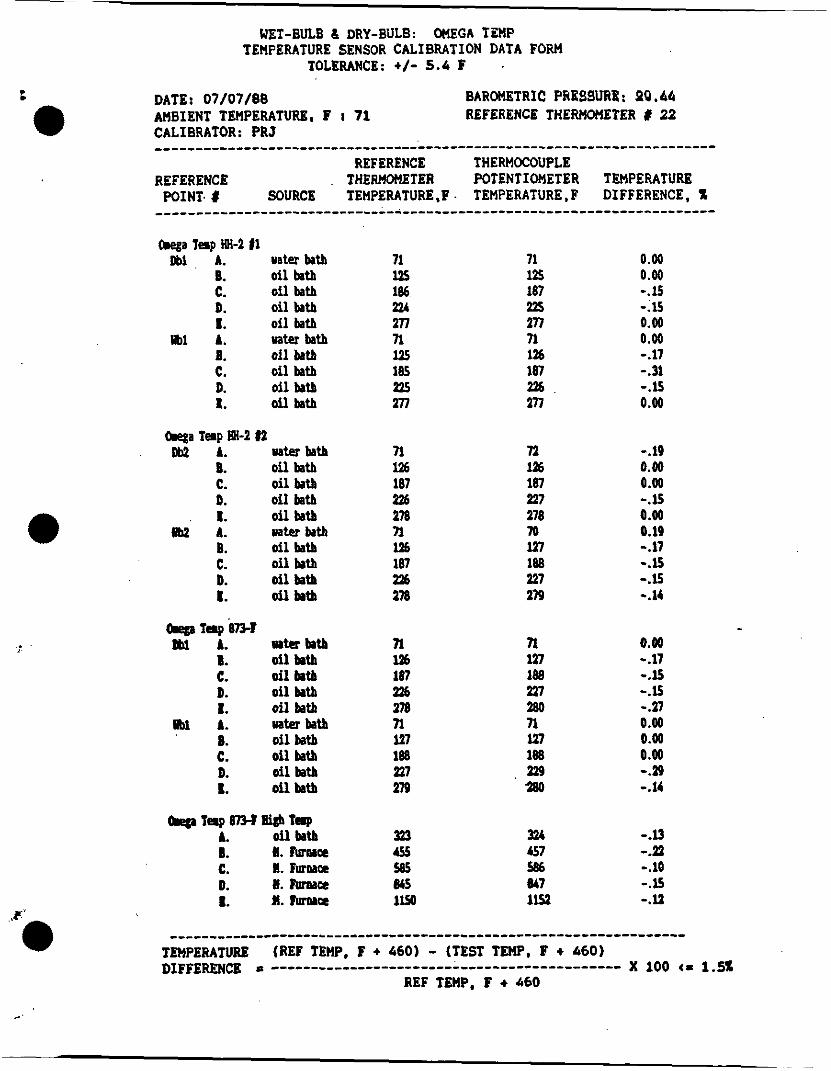
WET-BULB & DRY-BULB: OMEGA TSMP TEMPERATURE SENSOR CALIBRATION DATA FORH
TOLERANCE: +/- 5.6 F .
e
..
(bega T ~ s p W-2 11 Dbl A. uater bath
B. oil bath C. oil bath D. oil bath 1. oil bath
B. oil bath C. oil bath D. oil bath I. oil bath
Ut11 A. mter bath
begs Temp MI-2 12 W2 A. wter bath
8. oil bath C. oil bath D. oil bath 1. oil bath
B. oil bath C. oil bath D. oil bath 1. oil bath
Cmz A. w t e hth
Tap 8 7 u obl A. mta bath
8. oil baa C. oil bath D. oil bath 1. oil bath
8. oil bath C. oil batb D. oil bath 1. oil bath
fbl A. mter bath
71 125 186 2% zn n 1% 185 225 zn
71 126 187 226 zm n 116 187 Y4b ne
n 116 187 226 ne 117 188 227 279
n
71 125 187 225
71 1% 187 2%
271
2 n
72 126 187 227 278
117 188 227 279
7o
n 127 188 227 280
127 188 229 a00
n
0.00 0.00 -.15 -.15 0.00 0.00 -.17 -31 -.is 0.00
-.19 0.00 0.W -.s 0.00 0.19 -.17 -.El -.is -.14
- 0.00 -.17 -.El -.is -.n 0.00 0.00 0.00 -.a9 -.14
3% -.13 457 -2 % -.lo 847 -.s 1152 -.la

t
, .*
Robe-# 4'-1 A.
E. C.
4 ' 4 L. E. C.
5 ' 4 L. E. C.
3 ' 4 A. E. C.
6'4 A. 8. C.
6 ' 4 A. E. C.
8 ' 4 A. E. C.
8. C.
0 ' 4 A. E. C.
8' Q 4. E. C.
1. C.
8'-a A.
9' r A.
oil batb oil baa oil batb 011 batb oil batb oil bath oil bath oil tatb oil bath oil baa oil batb oi l batb oil batb oil batb oil batb oil $tb oil bath oil bath oil btb oil batb oil btb oil batb oil btb oiltstb oil btb ollbab oil btb oil wb oil btb oil batb oilbath oilwb oil btb
% ab5
% a6 n % a6 518 % 266 ne % 261 ne 97 l6e 376 91 l6e 379 QI 260 379 98 ab9 519 100 no m 100 no 380
371
95 a66 378 % 266 518 % ab5 m % 261 379 97 mi 371 97 261 m 97
ne 98
380 9e a68 380 101 m9 m 9B
m
mi
mg
am
0.00 -.14 -.12 -58 0.00 -.la 0.00 0.14 0.12 0.00 -.14
-.la 0.00 0.12 0.00 0.14 -.la 0.00 0.14 0.12 -.la -.14 -.la 0.00 0.14 -.la -.18 0.14 0.12 0.18 0.00 0,5
-.la

mBQX l%6A A.
C. D.
l266B A.
C. D.
l348l1 A.
C. D.
l34en a.
C. D.
140lA A. 0. C. D.
l40lE A.
C. D.
196511 A.
C. D.
1- A.
C. 0.
n.
n.
n.
n.
n.
n.
n.
ice bath uater bath oil bath oil bath ice bath mter bath oil bath oil bath ice bath mter bath oil bath oil bath ice bath wter bath oil bath oil bath ice bath mter bath oil bath oil bath ice bath mter bath oil bath oil bath ice brtb star bath oil bath o i l bath ice bath mtu bath o i l brtb oil bath
35
125 149 35
ils 149 35
lm 150 36
116 150 )6
l!46 w 36
116 1so 36
in 1U 96
117 151
n
n
n
n
n
n
n
n
35
l% 149 36 10 lm 150 36 la u 1% 36 la 116 151 35 la lm 150 2b )? 117 149 37 la 117 w 36 70 lm 151
la 0.00 -.19 -.17 0.00 -.a 0.19 -.17 4 6 -.a -.19 0.00 -.16 0.00 -.19 0.00 -.16 0.20 -.19 0.00 0.00 0.00 -.19 4 1 0.16 -.a -.19 0.00 0.16 0.00 0.19 -.17 0.00
i
SAMPLE Box
TOLERANCE: +/- S.4 F TEMPERATURE SENSOR CALIBRATION DATA FORn
DATE: 07/07/00 BARWEIRIC PRESSURE: 29.44 AMBIENT TEMPERATURE, P : 71 REFERENCE THERWMETER # 22 CALIBRATOR: PRJ ......................................................................
REFERENCE THERHOCOUPLE REFERENCS THERMOMETER POTENTIOMETER TEMPERATURE POINT # SOURCE TEMPERATURE.F 1EMPERATURE.F DIFFERENCE, X
A. 8. C. D. 1. A. B. C. D. 1. A. 8. C. D. 1. A. B. C. D. 1. A. B. C. D. 1. A. B. C. 0. 1. 1. E. C. D. 1. A. B. C. 0. 1.
water bath oil bath oil bath oil bath oil bath mter bath oil bath oil bath oil bath oil bath mater bath oil batb oil bath oil batb oi l bmth mter bath oil bath oil bath oil bath oil batb mter bath oil brtb oil bath oilbatb oilw water batb oil bath oilbrtb oil bath oil bath olter bath oil bab oil btb oil bath oil bth mter bath oil.btb oil baa oil baa oilbatb
n us 186 113 zn n In 186 186 113
la6 187 123 m la6 107 a4 m la6 187 as ne in 188 m 179
127 188 121 279
l29 109
2Bo
n
n
n
n
n
n
m
11 '
1u 186 1u m 70 la6 188 188 924
la6 188 125 ne la I26 188 116 ne 116 188 lE IIQ
117 188 128 380
in 189 a 380
I30 190 2 9 aa
n
n
.n
n
n
0.00 0.11 0.00 -.ls 0.00 0.19 -.11 -.a -.a -3 0.00 0.00 -.Is
-.14 -.19 0.00 -.Is -.a9 -.14 0.00 0.00 -.ls 0.00 -.14 0.00 0.00 0.00 -.ls -.14 0.00 0.00 -.ls -.a -.M 0.00 -.11 -.Is -.Is
-.m
-.n

February 1. 1979
Ruther to our tdepbone convarsatioa om January,lS. 1979 bevm
association to measure DOP. listed in the Federal Wister. Part 11, Thursday. August 18. 1977. Envhn- -tal P m t e c t i o a ' ~ e a c y , standards of Performance for tiw stationw Souras-
eade OooAP w i l l meet the EPA DOP rquirements of 0.05s parcurt penatration on a 0.3 laic- dioctyl phthalate smoke particles u listed on page 41778 of t lm Federal Rsgistar, Vol. 42. No. 160. Thursday, August 18, 1977
Grad. SOoAl iS tOOtad d t h 8 Ql2e DOP Pmetrowtar manufactured by th. Afr %hnOlw
mis is a wre sophisticatd unit than th.t
3- Illlagmt. 3.1.1 P i 1 t . t ~ .
. I hop. this w i l l u t i s f y your inquiry. If n can k of 8ny further W Y i C . 8 p1.a~ conact US 8t your cawan.luIcI.

i
ii
c.
WEIGHT TRACEABILITY CERTl Fl CATE
The balances listed below have been sewiced by our tqmsentative on Oecemher 2 \ > tq2-I
This is to certify that the test weights used are lraceable to the National Bureau of Standards.
\
1

OOA 10 GCA
February 2, 1984
De91-W. J- :
~n lieu of any printed aerttfiaaticn f m ax mrpany, we offer as fo- cur staterent on the r e f d subject.
I Ybe Wet lkst catdlog nuuber 63123, has been tested at cur plant facilities using a I4ter Prover Bottle NBS registratian M. 4897.
of plus or mfnus l/2% ermr in flau rate and om- fonm bo specifications of AslM D1071.'
lbe Meter was f03d bo plxfom to alr advertised spgificatiolls
-Y*

I
WALTER H. KESSLER COMPANY, INC.
MANUFACTURERS CERTIFICATE OF CALIBRATION This is to certify that the instrument listed below hnr been tared in our tempenture calibration laboraloy
in accordance with the l a t a procedures in the finest constant temperature equipment available. @hn National Bureau of Standards certified master Standards.
Fisher Scient i f ic Company
Thermometer 115-04lD -1/2Ol0C h 0.2. Div T o t a l Immersion Gttikod (on
Doscriptioar
lnstruunt k r i o l No. 811 007 Dok Conifimd: January 30, 1981
Roadins d lhh Inltrument
+o .02c
20.00c
40.00C
59.96C
79.98C
100. OZC
119.92C
139.9 8C
160. OOC
180.00C
199.86C
Reading d N.B.S. 9 a n d . d ( TIY. Tenp.rab~m)
0. ooc 20. ooc
40.0OC
60.00C
80. OOC
100. ooc
120.00c
140. O O C
160.00C
180. OOC
200.00c
The tabulated readings apply provided the ice-point reading taken after exposure for nc days to a temperature of abolt 25' C (77.F) h . If the ice-point ruding i! higher(or lower) chan stated. dI other redings will be higher (or lower) by tbe YN amount.
+o. 02c lcss than 3 Dud to k
Serial & Tat numbers of National Bureau of Standards certified instruments referenced in certification of the thermometer listed above:
-& NBS Standard M 4 4 1 6 5 ~ 7 8 A - 2 2 7 ~ U 4 4 4 5 1 ~ 7 8 A - 2 2 0 ~ ~ ~ - 6 O l / 6 0 2
NBS T e s t No 176240,219883,176240,219883~219606

. a DATE: 12-16-85
*
CERTIFICATE OF CALIBRATION
- CUSTOMER: ENVIRONMENTAL TESTING INCCustooer Purchasi Order: 2861R0 .
1 7 0 0 UNIV COWMERICAL PL OMEGA Work Order NO: SO 511268760
’ CHARLOTTE N‘C 28213 MODEL: “-2
SERIAL NO: 14403
OMEGA ENGINEERING c e r t i f i e s t h a t ‘ the above ins t rumenta t ion has been c a l i b r a t e d and t e s t e d t o meet o r exceed t h e publ ished specf f fca- t ions . inst rumentat ion and standards t h a t a re t raceab le t o t h e U.S. Nat iona l Bureau o f Standards.
Reference:
Th is c a l i b r a t i o n and t e s t i n g was performed us ing
NATIONAL BUREAU OF STANDARDS TEST NO(s): 36320
, Ins t rumenta t ion . CAL-3
..
. ..

November 18, 1986
Hr. Paul Jenkins Environmental Testing InC. 1700 University Commercial Place Charlotte, NC 28213
Dear Mr. Jenkins:
I
Confirming our telephone conversation, our volumetric apparatus is calibrated in conformance with ASTM Standard E 542.
Very truly yours, . I Allen R. Fuller
Product Engineering Supervisor
blOOl2
.

December 11, 1986
Mr. Peul R. Jenkins h v i r o m e n t a l Testing, InC. 1700 University Cunnercia1 Place Charlotte, North Carolina 28213
REF: Calibration of vollrmetric glassware Hr. P. Jenkins letter 12-5-86
Dear MI’. Jenkins,
i
Volumetric standards, utilized by Kimble for ca l ibra t ion c. class A and B laboratory glassware, are designed to meet applicable cal ibrat ion requirements of Mlt4 Standard E 542.
Accuracy of balances, weights and thermaneters employed for cal ibrat ion of volumetrio standards le traceable to National Bureau of Standards.
, @ Sincerely,
Lew b r a n Standards Dept .
b l i t y Control
CC: Ik. N. De&l10 - M.0. W. E. Trasoras - Q.A.