· Andrés F. Santander-Syro from the Université de Paris-Sud stayed 6 months as a visiting...
33
Transcript of · Andrés F. Santander-Syro from the Université de Paris-Sud stayed 6 months as a visiting...


HiSOR
ACTIVITY REPORT
2017
Hiroshima Synchrotron Radiation Center, HiSOR
Hiroshima University

Edited by Y. Izumi
The annual report is available from
Hiroshima Synchrotron Radiation Center, Hiroshima University
Kagamiyama 2-313, Higashi-Hiroshima 739-0046, JAPAN
Phone: +81-82-424-6293
Fax: +81-82-424-6294
e-mail: [email protected]
URL: http://www.hsrc.hiroshima-u.ac.jp/

Preface
The Hiroshima synchrotron radiation center is the only one synchrotron radiation facility
attached to a national university in Japan. It was established in 1996, as part of the academic
policies of the Ministry of Education, Culture, Sports, Science and Technology (MEXT). A
compact 700MeV electron-storage ring, called HiSOR (this center is often referred as HiSOR),
produces synchrotron radiation in the ultraviolet and soft x-ray range. The mission of the center
is to promote advanced research in the field of condensed matter physics including
interdisciplinary fields using synchrotron radiation, as well as to develop human resources
making the most of the international research environment in this center.
In 2010, the center was authorized as a “Joint Usage / Research Center” by the MEXT. In
2016, the authorization was extended for next 6 years with the grade “A” in the term-end
evaluation in 2015. To prepare for the mid-term evaluation in FY2018, we have asked
assessments of the scientific achievements to the International Review Committee chaired by
Prof. Ingolf Lindau (Stanford University), and assessments of the activities as the Joint
Usage/Research Center to the External Review Committee chaired by Prof. Hidetoshi
Fukuyama (Tokyo University of Science). The review reports clearly outlined the present status
of the center, and included many constructive and helpful recommendations for our future
directions.
This fiscal year, Dr. Baojie Feng joined the center as an assistant professor and actively
promoted high-resolution ARPES studies on topological materials and in situ grown novel thin
films. Prof. Andrés F. Santander-Syro from the Université de Paris-Sud stayed 6 months as a
visiting professor to promote international collaborative works on the two-dimensional
electron gas on oxide surfaces and some topological materials. We also hosted the international
workshop on strong correlations and angle-resolved photoemission spectroscopy (CORPES17)
which was held in July, 2017. 117 participants from 20 countries attended the workshop and
actively discussed the latest scientific results.
In FY2017, 221 researchers including undergraduate and graduate students conducted 131
proposals including 30 proposals from outside Japan. Detailed scientific results are reported in
this volume.
In closing, I would like to thank all of the staff members for their great efforts to operate
HiSOR, and to maintain and advance experimental stations. I also want to thank our
– ⅰ –

students and collaborators for their excellent scientific achievements, making full use of
our facilities. Finally, I deeply appreciate the continued supports by Hiroshima University
and the MEXT.
July 2018
Kenya Shimada
Director of Hiroshima Synchrotron Radiation Center
– ⅱ –

Table of Contents
Preface
Current Status of HiSOR
Status of the HiSOR storage ring ................................................................................................................. 1
Beamlines ............................................................................................................................................................. 6
Research Activities
―Accelerator Studies―
Construction of a two-photon interferometry measurement system for the evaluation of
the bunch length in the electron storage ring ........................................................................................... 9
S. Notsu, K. Kawase, S. Matsuba
―Instrumental Developments―
Ultimate spatial resolution in LASER based μ-ARPES....................................................................... 11
E. F. Schwier, H. Takita, W. Mansur, A. Ino, M. Hoesch, M. D. Watson, A. A. Haghighirad,
K. Shimada
Beam focusing and sample-volume reduction using Schwarzschild objective at
VUV-CD spectrophotometer ........................................................................................................................ 13
Y. Izumi, K. Matsuo
―Synchrotron Radiation Experiments―
The electronic structure of O-Fe(001) thin films grown on MgO(001) studied by
angle-resolved photoelectron spectroscopy and density functional theory ................................... 15
M. Zheng, E. F. Schwier, K. Shimada
2-Dimensional surface bands in Pb1-xSnxTe thin films ......................................................................... 17
R. Akiyama, Y. Otaki, Y. Tomohiro, K. Miyauchi, R. Nakanishi, R. Ishikawa, T. Yamaguchi,
H. Sato, A. Kimura, E. F. Schwier, K. Miyamoto, K. Shimada, S. Hasegawa, S. Kuroda
Observation of the Eu 4f6 multiplet structure in EuPt2Si2 by angle-resolved
photoemission spectroscopy ......................................................................................................................... 19
H. Anzai, E. F. Schwier, K. Shimada, H. Namatame, M. Taniguchi, A. Matsuda, H. Wada,
K. Mimura
Low-energy heavy-fermion bands in YbCdCu4 revealed by angle-resolved
photoemission spectroscopy ......................................................................................................................... 21
H. Shiono, S. Ishihara, K. Mimura, H. Sato, E. F. Schwier, K. Shimada, M. Taniguchi,
S. Ideta, K. Tanaka, T. Zhuang, K. T. Matsumoto, K. Hiraoka, H. Anzai
Disturbance influence on conduction pathway for electron carriers doped near anatase
TiO2 surface....................................................................................................................................................... 23
Y. Aiura, K. Ozawa, E. F. Schwier, K. Shimada
– ⅲ –

Angle-resolved photoelectron spectroscopy study of Ce1-2-10 systems III................................... 29
H. Yamaoka, E. F. Schwier, Y. Yamamoto, K. Ohno, T. Nishioka, K. Shimada, J. Mizuki
Electronic structure of Pr1-xYxCoO3 in comparison with copper delafossites studied
by resonant photoemission spectroscopy ................................................................................................. 31
D. Kanai, R. Takayanagi, K. Takahashi, M. Okawa, Y. Kobayashi, T. Saitoh
High resolution probing of the energy levels in carbon nanotubes .................................................. 33
G. Andersson, C. Shearer, J. Shapter
ARPES study of multi-band Bi chalcogenides ....................................................................................... 34
T. Mizokawa, Y. Matsuzawa, T. Morita, N. L. Saini, T. Asano, T. Nakajima, R. Higashinaka,
T. D. Matsuda, Y. Aoki, E. F. Schwier, K. Shimada, H. Namatame
Laser ARPES study on surface-doped black phosphorus .................................................................. 36
W. J. Shin, K. S. Kim
Growth and ARPES measurement of hydrogenated silicene on Ag(111) ..................................... 38
Y. Feng, B. Feng, S. He, K. Shimada
Photoemission study of the Dirac cone state splitting at the Dirac point for
Gd-doped topological insulators ................................................................................................................. 40
D. Estyunin, A. V. Koroleva, A. M. Shikin, S. Kumar, E. F. Schwier, A. Kimura
Resonant photoemission study of Mn-doped topological insulators ............................................... 42
A. M. Shikin, D. Estyunin, A. V. Koroleva, I. I. Klimovskikh, S. Kumar, E. F. Schwier,
A. Kimura
Probing correlated topological phase in CeBi ........................................................................................ 44
P. Li, Z. Wu, Y. Liu
ARPES study of Gd: Bi2Se3 topological insulators ............................................................................... 47
R. Singh, S. Kumar, E. F. Schwier, K. Shimada, A. K. Ghosh, S. Chatterjee
ARPES study on the new Fermion in ZrTe and the electronic structure of monolayer
MoTe2 .................................................................................................................................................................. 49
Q. Gao, W. Zhao, W. Zhu, G. Chen, Y. Huang, Y. Feng, E. F. Schwier, K. Shimada, G. Liu,
X. Zhou
XPS study of boron-doped diamond films covered by V2O5 .............................................................. 52
Y. Muraoka, T. Wakita, T. Yokoya
Photoelectron spectra of lutetium encapsulated fullerenes ................................................................ 53
T. Miyazaki, T. Wakita, T. Yokoya, H. Shinohara, S. Hino
Current activities of research and education on BL-5 (FY2017) .................................................... 54
T. Yokoya, T. Wakita, Y. Muraoka, K. Terashima
The electronic states of D/L amino acid absorbed on WO3 ................................................................ 55
Y. Nakao, H. Ito, Y. Ohno, H. Yoshida, K. Adachi, Y. Horikawa
Development of an apparatus for soft X-ray absorption experiments of solid and
liquid samples under atmospheric helium gas environment .............................................................. 56
Y. Nakao, H. Ito, Y. Ohno, H. Yoshida, T. Tokushima, Y. Horikawa
Soft x-ray absorption measurement of hybrid organic-inorganic perovskite, a material
for dye-sensitized solar panels, under atmospheric pressure He environment ............................ 58
T. Tokushima, M. Niibe, S. Yokouchi, Y. Horikawa, Y. Nakao, H. Yoshida
– ⅳ –

Electronic structures and impurity cluster features in Mg-Zn-Y alloys with a
synchronized long-period stacking ordered phase ................................................................................ 59
S. Hosokawa, K. Maruyama, K. Kobayashi, J. R. Stellhorn, B. Paulus, A. Koura, F. Shimojo,
M. Yamasaki, Y Kawamura, S. Yoshioka, H. Sato
The seeds of Zn6Y8L12-type clusters in amorphous Mg85Zn6Y9 alloy investigated
by photoemission spectroscopy ................................................................................................................... 61
S. Hosokawa, J. R. Stellhorn, B. Paulus, K. Maruyama, K. Kobayashi, H. Okuda,
M. Yamasaki, Y. Kawamura, H. Sato
Photoemission study of Sr-Cu-O compounds with multi CuO2 layer ............................................. 63
S. Tsuda, H. Yamaoka, H. Sakurai, H. Sato, K. Shimada
Elucidation of electronic band structure of monolayer germanium film ...................................... 65
O. Kubo, S. Endo, H. Sato, T. Okuda
Photoelectron spectroscopy of thin-film beta tungsten ........................................................................ 67
H. T. Lee, H. Yamaoka, A. Nagakubo, H. Sato
Angle-resolved photoemission study of WTe2 ......................................................................................... 69
R. Matsumoto, T. Sugimoto, T. Mizokawa, N. L. Saini, M. Arita, H. Namatame, M. Taniguchi,
R. Jha, R. Higashinaka, T. D. Matsuda, Y. Aoki
Angle-resolved photoemission study of SnSe and Na-doped SnSe................................................... 71
M. Maeda, S. Suzuki, K. Yamamoto, T. Mizokawa, N. L. Saini, M. Arita, H. Namatame,
M. Taniguchi, G. Tan, L. D. Zhao, M. G. Kanatzidis
Photon energy dependence of photoelectron intensity angular distribution of
topological surface states ............................................................................................................................... 73
D. Matsumaru, K. Kuroda, J. Cheng, A. Kimura, M. Arita, S. Shin, T. Kondo
Temperature dependence of the pseudogap in Bi2Sr2Ca2Cu3O10+δ studied by
angle-resolved photoemission spectroscopy ............................................................................................ 75
S. Kunisada, S. Adachi, M. Nakayama, S. Akebi, M. Arita, T. Watanabe, T. Kondo
Self-energy in the superconducting states of the high-Tc cuprates Bi2Sr2CaCu2O8+δ ................ 77
T. Yoshida, D. Ootsuki, K. Yamawaki, D. Shimonaka, D. Shibata, H. Eisaki, T. Sasagawa,
A. Fujimori, M. Arita, H. Namatame, M. Taniguchi
Low-energy photoemission study on the effects of electron doping on the Kondo
insulator YbB12 ................................................................................................................................................. 79
A. Rousuli, H. Sato, M. Arita, F. Iga, K. Shimada, H. Namatame
Discovery of 2D anisotropic Dirac cones in borophene ....................................................................... 81
B. Feng, J. Zhang, S. Ito, M. Arita, C. Cheng, L. Chen, K. Wu, F. Komori, O. Sugino,
K. Miyamoto, T. Okuda, S. Meng, I. Matsuda
SARPES study on IrTe2 ................................................................................................................................. 83
T. Mizokawa, Y. Okamoto, S. Iwasaki, K. Takubo, H. Ishii, K. Kudo, M. Nohara,
K. Miyamoto, T. Okuda
Spin-resolved ARPES experiment on chiral semiconductor tellurium .......................................... 85
M. Mulazzi
Local Rashba effect in PtSe2 thin film grown by molecular beam epitaxy ................................... 86
M. Yan, K. Zhang, W. Yao, S. Wu, T. Yoshikawa, K. Miyamoto, T. Okuda, S. Zhou
Rich surface electronic structure of group-X transition-metal dichalcogenides ......................... 88
O. J. Clark, J. M. Riley, J. Feng, P. D. C. King
– ⅴ –

Experimental observation of node-line-like surface states in LaBi ................................................. 90
B. Feng, J. Cao, M. Yang, Y. Feng, S. Wu, B. Fu, M. Arita, K. Miyamoto, S. He, K. Shimada,
Y. Shi, T. Okuda, Y. Yao
Spin texture of topological surface states on the Kondo insulator SmB6(111) ............................ 92
Y. Ohtsubo, Y. Yamashita, K. Miyamoto, T. Okuda, W. Hirano, F. Iga, S. Kimura
Spin polarized surface state derived from d-electrons on W(100) ................................................. 94
K. Miyamoto, T. Matsuda, T. Okuda, H. Sato, J. Henk
Signature of hidden order in spin resolved photoemission spectra of Sr2IrO4 ............................ 96
S. H. Kim, Y. K. Kim, B. J. Kim
Direct experimental verification on spin-resolved valley structure in two-dimensional
MX2 (M = Mo, W; X= S, Se) semiconductors ......................................................................................... 98
W. Zhao, Y. Huang, S. Wu, K. Miyamoto, T. Okuda, G. Liu, X. Zhou
Sulfur compound formed at surface of granulated coal ash capped in organically
enriched sediment .......................................................................................................................................... 100
K. Kim, T. Yamamoto, S. Hayakawa
Identifying sulfur species in marine sediments collected from Seto Inland Sea, Japan
using XAFS ...................................................................................................................................................... 102
S. Asaoka, Y. Ushihara, A. Umehara, K. Takeda, H. Sakugawa, S. Hayakawa
Electrochemical desorption of stored iodide onto organo-MnO2 and XAFS
characterization ............................................................................................................................................. 104
M. Kondo, M. Nakayama, A. Munoz-Noval, K. Komaguchi, S. Hayakawa
Mechanism phosphate removal by pyrolyzed oyster shell ............................................................... 106
K. Kim, S. Hayakawa
Highly-active layered titanosilicate catalyst with high surface density of isolated titanium
on the accessible interlayer surface ......................................................................................................... 108
N. Tsunoji, H. Nishida, S. Hayakawa, M. Sadakane, T. Sano
XAFS characterization of thermal denaturation of sulfur crosslink in rubber ......................... 110
T. Mori, S. Mineoi, T. Oshita, H. Sumida, K. Komaguchi, S. Hayakawa
Depth selective and polarization dependence measurements of sulfur K edge XAFS
spectra from polythiophene film under total reflection condition ................................................. 112
Y. Hamashima, T. Kai, K. Komaguchi, J. Ohshita, S. Hayakawa
Structural analysis of lysine-4 methylated histone H3 using VUV-CD spectroscopy .............. 114
Y. Izumi, K. Matsuo
Structural analysis of wheat gliadins by vacuum ultraviolet circular dichroism
spectroscopy .................................................................................................................................................... 116
R. Urade, Y. Higashino, F. Arisaka, K. Gekko, K. Matsuo
Conformations of myelin basic protein interacted with membrane revealed by
vacuum-ultraviolet circular-dichroism spectroscopy ......................................................................... 118
M. Kumashiro, Y. Izumi, K. Matsuo
A preliminary study of vacuum-ultraviolet circular dichroism of hydroxypropyl cellulose . 119
Y. Maki, K. Matsuo
Characterizations of structural dynamics and hydration structures of D-glucose
using vacuum-ultraviolet circular-dichroism spectroscopy ............................................................. 121
K. Matsuo, H. Namatame, M. Taniguchi
– ⅵ –

Secondary structural analysis of XRCC4 protein using HiSOR-VUVCD .................................. 122
K. Nishikubo, Y. Izumi, K. Fujii, K. Matsuo, Y. Matsumoto, A. Yokoya
Structural analysis of lysozyme by using VUVCD spectroscopy .................................................... 124
T. Kawasaki, Y. Izumi, K. Tsukiyama, K. Matsuo
Optical activity emergence in amino-acid thin films by circularly-polarized light
irradiation ........................................................................................................................................................ 126
J. Takahashi, Y. Izumi, K. Matsuo, M. Fujimoto, M. Katoh, Y. Kebukawa, K. Kobayashi
Investigation of the structural change during the enzymatic activation of a
prophenoloxidase by vacuum-ultraviolet electronic circular-dichroism spectroscopy ........... 128
T. Masuda, K. Matsuo
Structural changes of histone core proteins by chromatin remodeling in DNA damage
response of Arabidopsis thaliana ............................................................................................................... 130
J. –H. Kim, T. H. Ryu, Y. Izumi
Secondary structural analysis of hyaluronan synthase interacted with membrane by
vacuum-ultraviolet circular dichroism spectroscopy ......................................................................... 132
S. Suenaga, M. Kumashiro, Y. Izumi, K. Matsuo
Vacuum-ultraviolet circular dichroism (VUVCD) for absolute configuration
determination of chiral allenes .................................................................................................................. 133
T. Nehira, Y. Tokunaga, T. Umezawa, K. Matsuo
Soft X-ray absorption measurements for thin organic materials by means of partial
electron and fluorescence detections at BL13 ....................................................................................... 134
S. Wada, Y. Taguchi, Y. Iyobe, A. Hiraya
Magnetic state of Co layers interacted into h-BN/Ni(111) studied by soft X-ray
magnetic circular dichroism....................................................................................................................... 136
Y. Ohashi, N. Ichikawa, M. Sawada
Antiferromagnetic interlayer coupling of Co/h-BN/Ni(111) studied by soft-X-ray
magnetic circular dichroism....................................................................................................................... 137
N. Ichikawa, Y. Ohashi, M. Sawada, A. Kimura
X-ray magnetic circular dichroism study of Eu2Ti2O7 and hybrid Eu2-xTMxTi2O7
pyrochlore ........................................................................................................................................................ 138
A. Pal, S. Kumar, E. F. Schwier, M. Sawada, K. Shimada, A. K. Ghosh, S. Chatterjee
XAS, XMCD and ARPES studies of Co and Co40Fe40B20 ultrathin films on Bi2Te3
for spintronic applications .......................................................................................................................... 140
A. K. Kaveev, N. S. Zhiltsov, M. Sawada
XMCD study of Mn-doped topological insulators .............................................................................. 142
A. V. Koroleva, D. Estyunin, A. M. Shikin, M. Sawada, A. Kimura
X-ray magnetic circular dichroism study of 0.7(BiFeO3)-0.3(TbMnO3) composite ................. 144
P. Gupta, A. Pal, R. Singh, A. Singh, S. Kumar, E. F. Schwier, M. Sawada, T. Matsumura,
K. Shimada, A. K. Ghosh, S. Chatterjee
―Off-line Experiments―
Tracking charge-density wave formation and detangling dichroic signatures in VSe2 ........... 147
O. J. Clark, J. M. Riley, P. D. C. King
– ⅶ –

Observation of d electron quantum-well states in Pd(100) ultrathin films ................................. 149
H. Tanabe, S. Sakuragi, E. F. Schwier, K. Shimada, T. Sato
Micro-ARPES study of a Weyl semimetal candidate MoTe2 ........................................................... 151
Y. Nakata, K. Kasai, E. F. Schwier, A. Ino, K. Ueno, N. Aoki, K. Sakamoto
Appendices
Organization ..................................................................................................................................................... 153
List of publications .......................................................................................................................................... 158
List of accepted research proposals ............................................................................................................. 162
Symposium ....................................................................................................................................................... 170
Plan of the building ......................................................................................................................................... 171
Location ............................................................................................................................................................. 172
– ⅷ –

Current Status of HiSOR


Status of the HiSOR storage ring
1. Introduction
The HiSOR is a synchrotron radiation (SR) source of Hiroshima Synchrotron Radiation
Center, Hiroshima University, established in 1996. It is a compact racetrack-type storage ring
having 21.95 m circumference, and its natural emittance of 400 nmrad is rather large
compared with those of the other medium to large storage rings. The most outstanding
advantage of the facility lies in good combination with state-of-the-art beamlines (BL’s) for
high-resolution photoelectron spectroscopy in the photon energy ranges between VUV and
soft X-ray. The principal parameters of HiSOR are shown in Table 1.
Table 1: Main parameters of the HiSOR Storage ring.
Circumference 21.95 m
Type Racetrack
Bending radius 0.87 m
Beam energy at Injection 150 MeV
at Storage 700 MeV
Magnetic field at Injection 0.6 T
at Storage 2.7 T
Injector 150 MeV Racetrack Microtron
Betatron tune (x, y) (1.72, 1.84)
RF frequency 191.244 MHz
Harmonic number 14
RF voltage 200 kV
Stored current (nominal) 300 mA
Natural emittance 400 nmrad
Beam life time ~10 hours@200 mA
Critical wavelength 1.42 nm
Photon intensity (5 keV) 1.2×10¹¹ /sec/mr2/0.1%b.w./300mA
Fig. 1 shows an example of typical one-day operation. Beam injection for HiSOR is
executed twice a day, at around 9:00 and 14:30.
- 1 -

400
300
200
100
0
Rin
g c
urr
ent
[mA
]
09:00 12:00 15:00 18:00
Time
600
500
400
300
200
100
0
Beam
life time [m
in]
Fig. 1: Typical daily operation status.
HiSOR has two 180-deg. Normal-conducting bending magnets which generate a strong
magnetic field of 2.7 T. This storage ring is equipped with two insertion devices, a linear
undulator and a quasi-periodic APPLE-II undulator which replaced to the previous helical
undulator in summer 2012. Major parameters of these undulators are listed in Table 2. The
photon energy spectra of the SR from HiSOR are shown in Fig. 2.
Table 2: Main parameters of the undulators.
Linear undulator (BL-1)
Total length 2354.2 mm
Periodic length u 57 mm
Periodic number 41
Pole gap 30-200 mm
Maximum magnetic field 0.41 T
Magnetic material Nd-Fe-B (NEOMAX-44H)
Quasi-Periodic APPLE-II
undulator (BL-9A,B)
Total length 1845 mm
Periodic length u 78 mm
Periodic number 23
Pole gap 23-200 mm
Maximum magnetic field 0.86 T (horizontal linear mode)
0.59 T (vertical linear mode)
0.50 T (helical mode)
Magnetic material Nd-Fe-B (NEOMAX-46H)
- 2 -

1011
1012
1013
1014
1015
1016
Bri
llia
nce
[P
ho
ton
s/se
c/m
rad
2/m
m2/0
.1 %
b.w
.]1101001000
Wave length [nm]
1 10 100 1000 10000
Photon energy [eV]
Ring current = 300 mA
Bending magnet
BL-1 Linear undulator
BL-9 QP-APPLE2(helical mode)
BL-9 QP-APPLE2(linear mode)
1st3rd
7th peak5th
BL1BL3
BL5BL6
BL7BL9A
BL11BL12
BL13BL14
BL15
Fig. 2: Photon energy spectra of the SR from HiSOR.
2. Operation status in FY 2017
Fig. 3 shows monthly operation time of HiSOR storage ring in FY 2017. HiSOR has a long
term cease period to have routine inspections in summer every year. The total user time of
FY2017 achieved 1519 hours. Fig. 4 shows bar graph of total operation days in each fiscal
year. It shows that days for user run in FY2016 was recovered those before occurring the
trouble on vacuum (see “HiSOR Activity Report 2014” in detail). Operation times of the
storage ring and the Microtron from FY 2008 to FY 2017 are shown in Fig. 5.
Most remarkable thing in the maintenance of the storage ring is that we have started to
replace the microwave amplifier for the accelerating cavity from that using vacuum tubes to
solid-state one. Comparing with the vacuum tube, in general, the solid-state amplifier has a
good stability and reproducibility for a long term operation and it has a high cost performance
for the maintenance because it consists of bundling small amplifier modules. The
commissioning of the solid-state amplifier was finished in early 2017 and it was used in
normal operation. Therefore, the operation times of storage ring were about the same level as
in the FY 2016.
- 3 -

250
200
150
100
50
0
Op
erat
ion
Tim
e [h
ou
rs]
04 05 06 07 08 09 10 11 12 01 02 03
Month in FY2015
User Run (1519hr) Machine Tuning (550hr) Others (18hr)
Fig. 3: Monthly operation time in FY 2016.
250
200
150
100
50
0
Op
erat
ion
Day
s [d
ays]
2008 2009 2010 2011 2012 2013 2014 2015 2016 2017
Fiscal Year
User Run Machine Tuning Others
Fig. 4: Operation days of HiSOR storage ring.
- 4 -

2500
2000
1500
1000
500
0
Oper
atio
n T
ime
[hours
]
2008 2009 2010 2011 2012 2013 2014 2015 2016 2017
Fiscal Year
HiSOR Storage Ring User Run Machine Tuning, Others
150 MeV Microtron Injection to HiSOR Injection to REFER (Shutdown in 2010)
Fig. 5: Annual operation time of Storage ring and Microtron.
- 5 -

Beamlines
A total of 13 beamlines has been constructed so far; three normal-incidence
monochromators, seven grazing-incidence monochromators, two double crystal
monochromators and apparatus for white beam irradiation (Fig. 1). Table 1 lists the beamlines
at present together with the main subject, energy range and monochromators.
Table 1: List of Beamlines
Beamline Source Monochromator Subject Energy range
(eV) Status
BL-1 LU GIM Polarization dependent
high-resolution ARPES 22-300 In use
BL-3 BM DCM Surface XAFS 1800-3200 In use
BL-4 BM White beam irradiation Closed
BL-5 BM GIM ARPES and PEEM 40-220 In use
BL-6 BM GIM Gas-phase photochemistry 200-1200 In use
BL-7 BM GIM ARPES 20-380 In use
BL-8 BM Beam diagnosis In use
BL-9A HU/LU NIM 5-35 In use
BL-9B HU/LU GIM High-resolution
spin-resolved ARPES 16-300 In use
BL-11 BM DCM XAFS 2000-5000 In use
BL-12 BM NIM VUV-CD of biomaterials 2-10 In use
BL-13 BM GIM Surface photochemistry 60-1200 In use
BL-14 BM GIM Soft-XMCD of
nano-materials 400-1200 In use
BL-15 BM NIM VUV-CD of biomaterials 4-40 Closed
BL-16 BM Beam profile monitor In use
At present, nine beamlines BL1, BL3, BL6, B7, BL9A, BL9B, BL11, BL12, BL13 and
BL14 are opened for users. Furthermore, three offline systems, resonant inverse
photoemission spectrometer (RIPES), low-temperature scanning tunneling microscope
(LT-STM) system, high-resolution angle-resolved photoemission spectrometer using
ultraviolet laser (Laser ARPES) are in operation (Fig. 2).
- 6 -
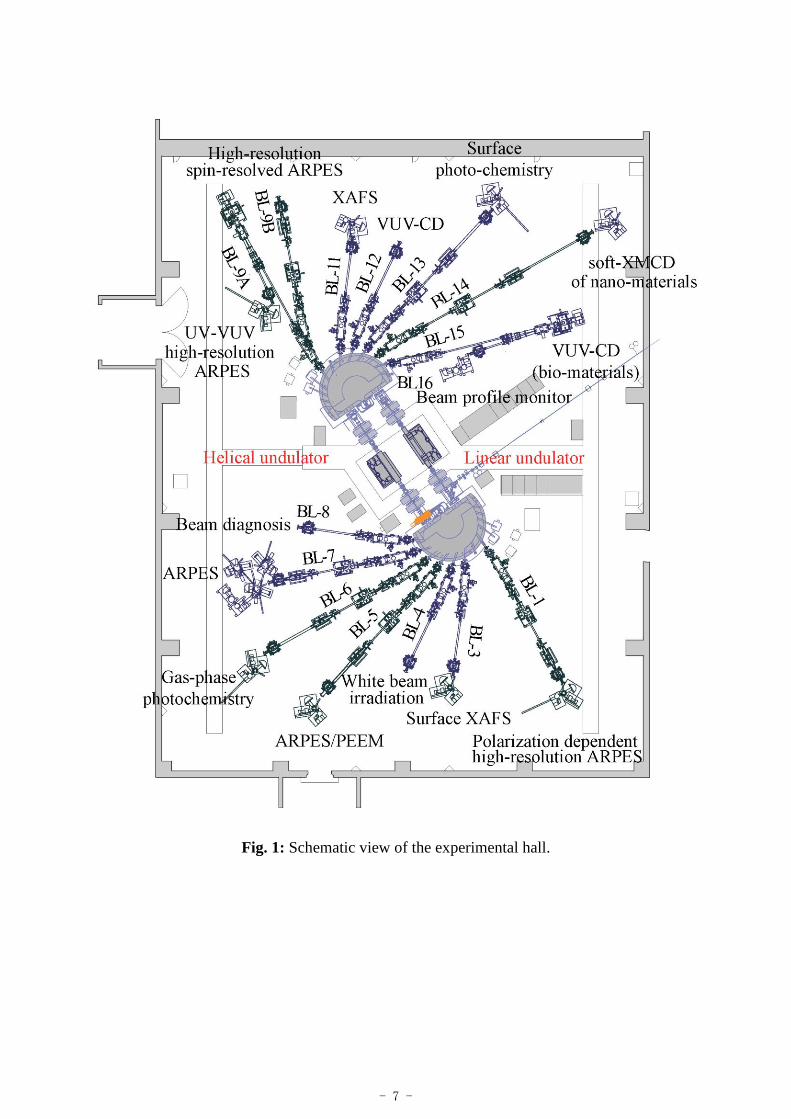
Fig. 1: Schematic view of the experimental hall.
- 7 -

Fig. 2: Experimental stations on the beamline and offline: (a) BL-1, (b) BL-3, (c) BL-6, (d)
BL-7, (e) BL-9A, (f) BL-9B, (g) BL-11, (h) BL-12, (i) BL-13, (j) BL-14, (k) RIPES (offline),
(l) LT-STM (offline), (m) Laser ARPES (offline), (n) Laser spin-ARPES (offline).
- 8 -

Research Activities
– Accelerator Studies –


Construction of a Two-Photon Interferometry
Measurement System for the Evaluation of the Bunch
Length in the Electron Storage Ring
Shohei Notsua, Keigo Kawaseb, and Shunya Matsubab
aDepartment of Physical Science, Faculty of Science, Hiroshima University, Hiroshima, Japan bHiroshima Synchrotron Radiation Center, Hiroshima University, Japan
Keywords: electron bunch length, two-photon interferometry.
A radio frequency (RF) accelerating cavity is installed in the storage ring, and when electrons passing
through the cavity at a specific phase are well balanced between acceleration energy and emission energy as
the synchrotron radiation, the storage ring can keep the electrons turning steadily inside. The group of
electrons formed around the stable phase is called "bunch".
In this research, we aim to evaluate the bunch length in the storage ring of HiSOR, and have constructed
a two-photon interference measurement system. We will try the two-photon interference experiment of
synchrotron radiation by making the Michelson’s type interferometer with prisms and mirrors. Since
photomultiplier tubes are used for photon counting, a new high voltage power supply unit is fabricated and
calibrated. For the sake of comparison, we also consider the electron bunch length measurement by the streak
camera.
At present, an interferometer is constructed and the alignment with a He-Ne laser is performed. A
schematic illustration of the interferometer is shown in the Fig.1. As the result of the alignment, we confirm
the interference fringes. In the future research, it is necessary to make the two beams into parallel waves that
the interference fringes are not observed. Also, since the photomultiplier tube have to work at the photon
counting mode for the synchrotron radiation, it is necessary to construct a reliable shading system of stray
light. After the light shielding system is constructed and the alignment of the two beams are completed, we
will perform the two-photon interferometry with the synchrotron radiation.
FIGURE 1. A schematic illustration of interferometer. (a): He-Ne laser. (b): Lens. (c): Mirror. (d): Beam
splitter cube. (e): Prism mirror. (f): Photomultiplier tube. (g): Linear stage.
- 9 -


Research Activities
– Instrumental Developments –


Status Report LaserARPES
Ultimate spatial resolution in LASER based µ − ARPES
E. F. Schwiera, H. Takitab, W. Mansurb, A. Inoa, M. Hoescha,c,d, M. D. Watsonc, A. A. Haghighirade,f and K. Shimadaa
aHiSOR, Hiroshima University, 2-313 Kagamiyama, Higashi-Hiroshima 739-0046, Japan bGraduate School of Science, Hiroshima Univ., 1-3-1 Kagamiyama, Higashi-Hiroshima 739-8526, Japan
cDiamond Light Source, Harwell Campus, Didcot OX11 0DE, United Kingdom dDESY Photon Science, Deutsches Elektronen-Synchrotron, D-22603 Hamburg, Germany
eClarendon Laboratory, Department of Physics, University of Oxford, Parks Road, Oxford OX1 3PU, UK fInstitute for Solid State Physics, Karlsruhe Institute of Technology, 76021 Karlsruhe, Germany
Keywords: Angle Resolved Photoelectron Spectroscopy, Photoemission Microscopy, domain twinning
We report on the performance of the µ-LaserARPES machine, which has been recently commissioned at the Hiroshima Synchrotron Radiation Center (HiSOR) [1]. We present a summary of measurements of the twinned domain structure within the nematic phase of FeSe [2]. These measurements highlight the potential of the µ-LaserARPES method to not only produce high energy and angle resolution [3] but also profit from high spatial resolution, compared to conventional ARPES systems.
Using the combination of the focused light spot (3-5 µm) and the precise movement of the "nano-stage" manipulator motion control, it is possible to obtain ARPES one-shot measurement on the sample surface with extremely high resolution and reproducibility in space. In Figure 1 a) such an example of a one-shot ARPES spectrum is presented. If the total intensity regardless of emission angle and kinetic energy is integrated a quasi-topographical map can be obtained (Figure 1 b). The intensity in this map is a convolution of several effects. Among which are the real topography and sample orientation, sample cleanliness and order, as well as matrix elements and local electric fields deflecting the very low energy photoelectrons. Nonetheless, this type of map was found to be able to identify regions of high spatial homogeneity on the sample for analysis. In the present case however, a more sophisticated analysis has to be performed to extract meaningful information from the current dataset.
FIGURE 1: a) Example ARPES spectrum taken at each point of the xz-mapping. Four Regions of interest are defined to correspond to the inner and outer hole pockets crossing the Fermilevel. b) Total ARPES intensity c) Using ratio of hole band intensity to judge regions of constant orientations. Only area within the dashed line is considered to be cut along Γ-point. d) Determining domain population by comparing intensity ratio from both hole pockets. Points A and B correspond to highest density of either of the twinned domains.
- 11 -

In particular one has to define a "quality parameter" which distinguishes regions of different sample
orientation or photoelectron emission angles. This can be sufficiently done, by defining regions of interest (ROIs) as marked in Figure 1 a), and quantitatively reevaluating the previously obtained data. In the case of FeSe it is assumed based on mechanical [4] and polarization based detwinning [5] as well as tight binding calculations [6] that the two outermost bands 1R and 1L represent emission from one of the twinned domains, while the two innermost bands 2R and 2L represent contribution from the other domain. Using this assumption, regions of constant orientation are defined as having a identical 1L/1R ratio (Figure 1 c). Using this assumption regions that differ in orientation can be excluded from further analysis.
Again, using the already obtained data, we now calculate the "population density" corresponding to domain population (1R/2L ratio). This ratio is plotted (Figure 1 d) and two points (A and B) are chosen as representatives of regions with dominance of one of the two twinned domains, respectively. At this point high quality measurements of two points with high domain asymmetry can be obtained. In Figure 2 a+b) the ARPES spectrum at the two points is shown. The strong asymmetry in intensity of the outer heavy hole-like bands and the inner light hole-like band is indicative of the dominance of each of the two domains in within the illuminated area. One the other hand it is clear by the residual intensity, that neither position has a 100% domain population and that both domains always contribute to the APRES spectrum.
FIGURE 2: a) ARPES spectrum obtained at point A with outer hole pocket domain dominating. b) ARPES spectrum from point B with inner domain dominating. c) Numerical detwinning to estimate the contribution to the ARPES spectrum from the heavy hole pocket domain. d) Same as c) but for the inner light hole pocket.
Since the orientation of the sample at the two points was previously verified, it is possible to perform a
"numerical detwinning" under the assumption that the ARPES spectrum of each point is created by a linear combination of identical emission from the respective domains. I.e. A = flat + h*light and B = light + k*flat. By using this assumption, we can subtract each spectrum from its pair choosing the normalization parameters h & k in such a way that the intensity in the resulting spectra does not becomes negative at any point. (flat = A - n*B and light = B - m*A). These spectra are plotted in Figure 2 c+d. While numerically extracted from the measured data at A and B the simple subtraction leads to a very pronounced effect, effectively detwinning the spectra at the Fermi level. At higher binding energies the degeneracy of the fully occupied hole bands is not lifted by the nematic phase and spectral weight remains visible in both numerical detwinnings.
In conclusion, the investigation of the domain population within the nematic phase of FeSe is a realistic example of the performance the µ-LaserARPES machine. The present study demonstrates the possibilities of combining high spatial resolution with high energy and angular resolution.
REFERENCES
1. H. Iwasawa, E. F. Schwier et al., Ultramicroscopy 1–7june (2017). 2. E. F. Schwier et al., preprint: https://arxiv.org/abs/1806.08132 (2018). 3. M. D. Watson et al., J. Phys. Soc. Jpn. 86, 053703 (2017). 4. M. D. Watson et al., New Journal of Physics 19, p.103021 (2017). 5. L. C. Rhodes et al., arXiv p.1804.01436 (2018). 6. M. D. Watson et al., Phys. Rev. B 94, p. 201107 (2016 ��
-0.10 0 0.10
wave vector (1/Å)
-120
-100
-80
-60
-40
-20
0
20
bind
ing
ener
gy (
meV
)
A - mixed Pol
-0.10 0 0.10
wave vector (1/Å)
-120
-100
-80
-60
-40
-20
0
20
bind
ing
ener
gy (
meV
)
B - mixed Pol
-0.10 0 0.10
wave vector (1/Å)
-120
-100
-80
-60
-40
-20
0
20
bind
ing
ener
gy (
meV
)
detwinned: outer pocket
-0.10 0 0.10
wave vector (1/Å)
-120
-100
-80
-60
-40
-20
0
20
bind
ing
ener
gy (
meV
)
detwinned: inner pocket
a) b) c) d)
- 12 -

BL-12
Beam focusing and Sample-Volume Reduction Using
Schwarzschild Objective at VUV-CD Spectrophotometer
Yudai Izumia and Koichi Matsuoa
aHiroshima Synchrotron Radiation Center, Hiroshima University, Japan
Keywords: beam focusing, Schwarzschild objective
1. Introduction
At a vacuum-ultraviolet circular dichroism (VUV-CD) spectrophotometer in BL12 of HiSOR, it has been
desired to reduce sample-volume with increasing the interest in rare proteins, such as human origin. A major
bottleneck to hinder the achievement was large spot size of BL 12 (ca. 6×6 mm2 at the sample position),
because whole beam should pass through the sample area in CD spectroscopy. Recently, we installed a
Schwarzschild objective in front of the sample position to focus incident beams and newly developed a
small-volume sample-cell. As a result, we succeeded in reducing the sample volume down to 1/10. Here, we
report some performances of VUV-CD spectrophotometer obtained by use of the Schwarzschild objective.
2. Beam focusing
The Schwarzschild objective (Infinite Conjugate, DUV Coated, 15X/0.28NA ReflX Objective) was
purchased from Edmond Optics and installed to the CD measurement chamber (Fig. 1). The focal spot size
of zeroth light was measured using a knife-edge method.
Fig. 1. (top) Top view of CD measurement chamber after installation of the Schwarzschild objective. (bottom) Schematic view
of the optical components.
Figure 2 shows the focal beam profiles. Overall spot size was about 0.025×0.025 mm2 (25×25 μm2).
Since the FWHM of the beam intensities was 1.9 (H) and 2.7 (V) μm, effective spot size would be much
smaller.
- 13 -
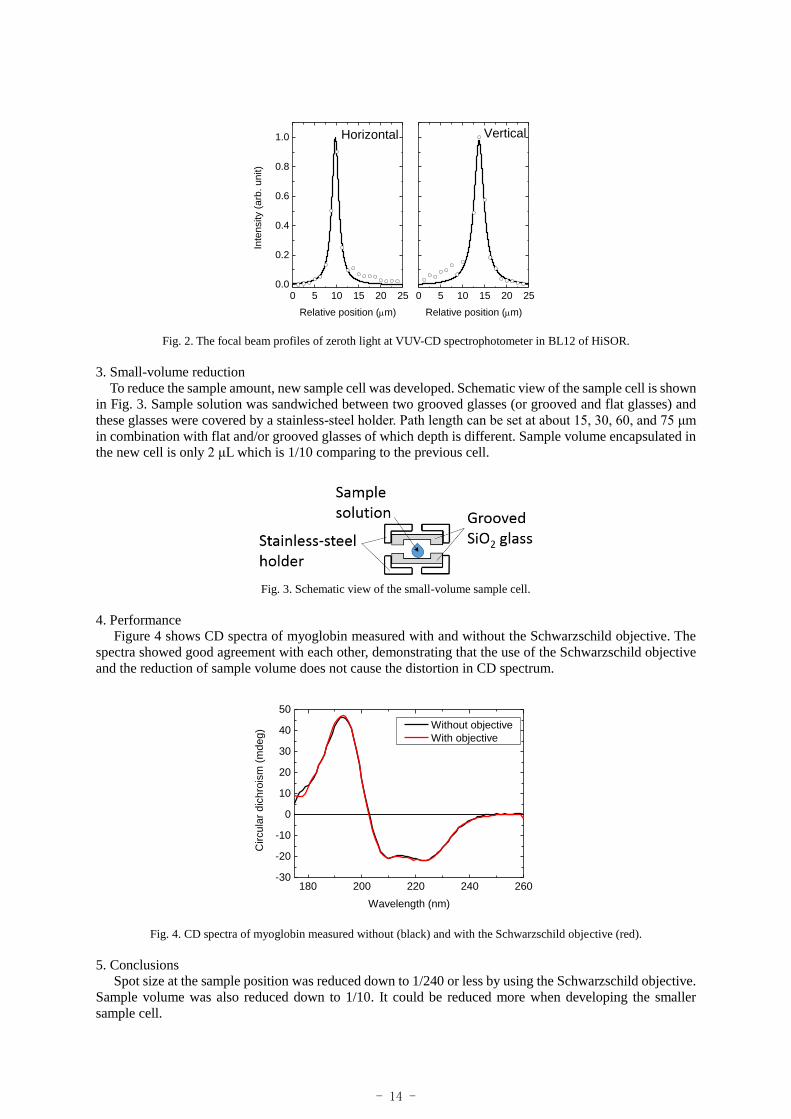
Fig. 2. The focal beam profiles of zeroth light at VUV-CD spectrophotometer in BL12 of HiSOR.
3. Small-volume reduction
To reduce the sample amount, new sample cell was developed. Schematic view of the sample cell is shown
in Fig. 3. Sample solution was sandwiched between two grooved glasses (or grooved and flat glasses) and
these glasses were covered by a stainless-steel holder. Path length can be set at about 15, 30, 60, and 75 μm
in combination with flat and/or grooved glasses of which depth is different. Sample volume encapsulated in
the new cell is only 2 μL which is 1/10 comparing to the previous cell.
Fig. 3. Schematic view of the small-volume sample cell.
4. Performance
Figure 4 shows CD spectra of myoglobin measured with and without the Schwarzschild objective. The
spectra showed good agreement with each other, demonstrating that the use of the Schwarzschild objective
and the reduction of sample volume does not cause the distortion in CD spectrum.
Fig. 4. CD spectra of myoglobin measured without (black) and with the Schwarzschild objective (red).
5. Conclusions Spot size at the sample position was reduced down to 1/240 or less by using the Schwarzschild objective.
Sample volume was also reduced down to 1/10. It could be reduced more when developing the smaller
sample cell.
0 5 10 15 20 250.0
0.2
0.4
0.6
0.8
1.0
0 5 10 15 20 25
Inte
nsity (
arb
. u
nit)
Relative position (m)
Vertical
Relative position (m)
Horizontal
180 200 220 240 260-30
-20
-10
0
10
20
30
40
50
Cir
cu
lar
dic
hro
ism
(m
de
g)
Wavelength (nm)
Without objective
With objective
- 14 -