· Abstract This study documents a pilot study of two candidate methods of imparting roll motions...
52
Pilot Study Of Recreational OffǦHighway Vehicles (ROV) Active Safety Engineering LLC June 21, 2010
Transcript of · Abstract This study documents a pilot study of two candidate methods of imparting roll motions...

Pilot Study
Of
Recreational Off Highway Vehicles (ROV)
June 2010
Active Safety Engineering LLC
June 21, 2010

Abstract
This study documents a pilot study of two candidate methods of imparting roll motions to Recreational Off-Highway Vehicles. The two methods examined were static roll motions using the FMVSS 301 test device and using the HYGE accelerator sled to input energy to cause roll motion. The two candidate methods were employed using two vehicles, two roll angles and two occupant sizes. The test approaches and results are documented in this report.
Executive Summary
This study was conducted to give guidance to further research aimed at improving the rollover safety of recreational off-highway vehicles (ROV’s). Two vehicles, a and a
were subjected to two methods of rollover testing, and each with two test angles and two occupant sizes. It was found that either method could discriminate the difference in ejection potential of the two ROV’s. Both methods were found to be relatively repeatable in measuring dummy excursions beyond the protective roll cage of the vehicle. The static roll approach resulted in a coefficient of variation (CV) in head excursions of around 12% and the HYGE sled testing resulted in CV’s of head excursions of around 9%. More impressive were the repeatability of accelerations in the HYGE sled induced rollover motions. The sled input CV was much less than 1%, and the CV’s in head accelerations of the dummy were about 1%. This is excellent repeatability, and coupled with the ability to select from a range of input energies from the sled, this appears to be a promising approach for measuring the safety level of ROV’s.
As an example, a pair of tests was conducted with the with the acceleration peak of the sled set low to around 1 g and the driver dummy unbelted (all other tests were conducted with dummies belted). The first test was in the baseline condition and the 2nd test utilized an “enhanced restraint”, consisting of a tubular structure mounted to the roll cage that provided restraint for the dummy torso. In the baseline test, the driver dummy was nearly fully ejected, and in the enhanced restraint test, no head or torso excursion beyond the roll cage occurred. It was noted in other tests that such a torso restraint may not be effective at roll motions with peak inputs beyond 2 g’s. This information will help guide future testing.
It was found that there was little dummy interaction, and occupant size had minimal effect on outcome. Future testing might utilize only one occupant size and only one occupant per test. The importance of angles was confounded in the pilot study and should be further examined. It was found that using a tool such as the HYGE sled to impart rollover motions is a novel and highly repeatable approach to producing rollover environments for ROV safety.
i

Table of Contents
1.0 Objectives
2.0 Vehicle Selection and Documentation
3.0 Test Type and Methodology
3.1 Static Rollover Test
3.2 Dynamic HYGE Sled Induced Rollover Motion
3.3 Loading Conditions and Occupants
3.4 Data Acquisition
3.5 Enhanced Restraint Condition
3.6 Unbelted Test Set-up
4.0 Analysis of Data
4.1 Test Results
4.1.1 Static Test Results
4.1.2 Dynamic Test Results
4.2 Test Repeatability
4.3 Analysis of Main Effects
4.4 Enhanced Restraints
4.5 Discussion of Results
4.5.1 Static vs. Dynamic Test Procedure
4.5.2 Sled Test Discussion
4.5.3 Occupant Protection Approaches
5.0 Observations, Conclusions and Recommendations
ii

List of Figures
2.1 Front Oblique
2.2 Side View
2.3 Front Seat Removed
2.4 Belt Hardware
2.5 Oblique View
2.6 Side View
2.7 Seat Removed
2.8 Belt Hardware
2.9 Torso Bar
2.10 Containment Webbing
3.1 FMVSS 301 Static Rollover Test Fixture
3.2 Grating on 301 Test Fixture
3.3 Mounting to Static Fixture
3.4 Mounting and Camera Placement
3.5 Vehicle Mounting to Static Fixture
3.6 Vehicle Ready for Static Testing
3.7 Vehicle Beginning Test Rotation
3.8 Vehicle at 90 degrees Static Roll
3.9 Vehicle Mounting Hinges on Sled
3.10 Vehicle Rotated for Tether Adjustment
3.11 Camera Placement for Sled Testing
3.12 Enhanced Restraint Mounted in
3.13 Upper Mounting of Enhanced Restraint in
iii

3.14 Lower Mounting of Enhanced Restraint in
3.15 Padding Added for Unbelted Dummy Tests
3.16 Driver Dummy Tethers for Unbelted Tests
4.1 Two-way Comparison of Head Excursions in Static Tests
4.2 Excursion Repeatability in in 90 degrees Static Tests
4.3 Comparison of Head Excursions in 90 degree Static belted and Enhanced Restraint Tests
4.4 Static Test of Baseline at 90 degrees Rotation
4.5 Static Test of with Enhanced Restraint at 90 degrees
4.6 Sled Test at Time = 0
4.7 Sled Test at Time = 200 m.sec.
4.8 Sled Test at Time = 400 m.sec.
4.9 Sled Test at Time = 600 m.sec.
4.10 Head Resultant Accelerations from Repeatability Tests
4.11 Main Effect Comparisons for Sled Testing
4.12 1 g at Maximum Roll Angle
4.13 Maximum Excursion in Baseline, Unbelted Condition
4.14 Comparison of Excursions in (90 degrees) Under Unbelted and Enhanced Restraint Conditions
iv

List of Tables
3.1 Test Matrix – Static Tests
3.2 Test Matrix – Sled Tests
4.1 Excursions in Static Tests
4.2 Excursions and Peak g’s in Sled Tests
v
vi
List of Appendices
Appendix 1: Vehicle Documentation Report for and
Appendix 2: Dummy Positioning Report for Sled Testing
Appendix 3: Sled Pulse for The trial Test

RECREATIONAL OFF-ROAD VEHICLE OCCUPANT PROTECTION
EVALUATION
Introduction
Recreational off-road vehicles (ROV) are becoming more popular in the U.S., and accidents, injuries and fatalities in ROV use are on the increase. ROV’s are available in many configurations, from 2-passenger to 4 or 5-passenger capacity and a variety of cargo configurations. ROV’s are designed with a shorter wheel-base and a narrower track width than highway vehicles to enable traverse on narrow off-road trails and rugged country where all terrain vehicles (ATVs) are also used. Both of these features result in low static stability factors (SSF) that are less than normal passenger vehicles resulting in poor stability and control characteristics relative to highway vehicles and a higher risk of rollover crashes. In addition, the vehicles are designed with open compartment configuration and different seating heights that give great versatility, but increases the likelihood of complete and partial ejections, and contact with surrounding objects in the event of a rollover or crash event.
An obvious protection concept is to improve occupant containment and retention of occupants within the confines of the ROV. In a rollover event, which is the most common type of crash event that produces serious injuries, any part of the occupant body that traverses outside of the protective periphery of the vehicle, is likely to receive injuries from contacts with the ground or obstacles outside the vehicle. The Consumer Product Safety Commission does not impose design standards, but instead improves safety by adopting appropriate performance standards. In considering approaches which might be adopted to improve the containment of ROV occupants, a variety of test approaches are being considered. Among these test approaches are: 1) A simple quasi-static turntable test (as specified in Federal Motor Vehicle Safety Standard (FMVSS) 301 Fuel System Integrity), and 2) One or more dynamic rollover test approaches. It is believed that the most simple test approach that is repeatable and that adequately reproduces occupant excursions outside of the vehicle is the most desirable.
1

1.0 Objectives
This work was sponsored by the Consumer Product Safety Commission (CPSC) in response to accidents, injuries and fatalities occurring in Recreational Off-Road Vehicles (ROV’s). Most of the injuries and fatalities occur in rollover accidents. In response to this the CPSC is looking both at the handling characteristics and the occupant protection capability of ROV’s as a class of vehicles. This project was initiated as a pilot study to look specifically at two potential test methodologies which could be used to investigate occupant protection strategies in ROV rollovers. The two methodologies are 1) quasi-static testing with the FMVSS 301 rollover platform and 2) a novel new strategy using the HYGE sled as an energy source to initiate realistic rollover motions. Both approaches were investigated at two angles, two dummies using two models of ROV’s. The test approaches, results and observations are contained herein.
2.0 Vehicle Selection and Documentation
The vehicles selected for the study were provided by the Consumer Product Safety Commission (CPSC). The following vehicles were provided:
1. MY 2009 4X4 VIN: PP402BF2
2. MY 2009 VIN: 65055B
Each vehicle had a weight just over 1000 lb as received, and had a wheel base of around 75 inches and a track width of about 42.5 inches. The did not have a door, and the had a step-through type door. Both were equipped with two removable bucket seats, which were not adjustable for different positions. Both had roll bars capable of withstanding substantial loading in a rollover situation.
2.1 2009
The was received on May 6. The odometer reading indicated 199 total miles. The vehicle was in excellent condition with very little wear on the tires and no observable vehicle damage. The inspection sheet is contained in Appendix 1. Photos of the vehicle are shown in Figures 2.1 – 2.2.
The was outfitted with cushioned plastic seats. Each seat is easily removed by depressing a lever under the forward edge of the seat and pulling the seat forward and upward. There was no provision for adjusting the seat for different occupant sizes. Occupants have to make the adjustment by varying their position on the seat or the position of their legs. Figure 2.3 shows the driver seat removed from the vehicle.
2

Three point seat belts were available for both driver and passenger positions. The belts are attached to the floor (retractor and buckle stem) and outboard roll-bar. Figure 2.4 shows the belt hardware.
2.2 2009
The was received on May 10. The odometer reading indicated 115 total miles. As with the the arrived in excellent condition with little wear on the tires and no observable damage. The inspection sheet is contained in Appendix 1. Photos of the vehicle are shown in Figures 2.5 – 2.6.
The was also outfitted with cushioned plastic seats. Each seat is easily removed by depressing a lever under the rear edge of the seat and pulling the seat rearward and upward. There was no provision for adjusting the seat for different occupant sizes. Occupants have to make the adjustment by varying their position on the seat or the position of their legs. Figures 2.7 shows the driver seat removed from the vehicle.
Three point seat belts were available for both driver and passenger positions. The belts are attached to the floor (retractor and buckle stem) and outboard roll-bar. Figure 2.8 shows the seat belt hardware.
In addition to the 3-point belt systems, the also contained two additional features which could provide further help in occupant containment. The first is a side structural contact surface mounted to the roll bar and aligned laterally just outboard of an adult torso. This feature was not mentioned in the promotional literature of the
web-site, so it is not clear whether it was designed to aid the passengers from getting injured due to side-to-side jostling on rough terrain, or for retention of occupants from partial ejection in rollovers or for side crash protection. A photo of the feature is contained in Figure 2.9.
Lastly, the contained a system of nylon webbing which was attached to the vehicle in 3 locations, 1) the side panel in the foot well, 2) the seat structural tubing, and 3) the roll bar.
A Photo of the webbing is contained in Figure 2.10.
3.0 Test Type and Methodology
3.1 Static Rollover Test
3.1.1 Test Apparatus
The FMVSS 301 test apparatus was originally designed for fuel system integrity testing. In the standard, passenger cars and light trucks are first subjected to a frontal crash test, then mounted to the rollover fixture and rotated slowly through 360
3

degrees 90 degrees at a time, pausing at specified times. For this application, the rollover fixture was a means of imparting roll motions to ROV’s. The intent is to observe the dummy positions and excursions outside the protective roll cage during rotational motion of the vehicle. Figure 3.1 shows the FMVSS 301 static roll fixture.
3.1.2 Vehicle Mounting
The roll fixture will accommodate vehicles of varying weight, size and wheelbase. Wheelbase adjustments are accomplished by sliding steel channels to achieve the wheelbase dimension. The steel channels are sufficiently wide to accommodate track widths up to large vans and SUVs’. One change that was needed for this application of rollover testing of ROV’s was to provide a means of securing the ROV at 60 degrees to the roll direction in addition to the lateral, 90 degree roll orientation. This was accomplished by adding steel grating to the top surface of the FMVSS 301 rollover fixture. The grating allows essentially infinite adjustment of vehicle angular orientation relative to the roll axis. Figure 3.2 shows the grating mounted to the roll fixture. The ROV’s were placed atop the platform with a forklift, as shown in Figure 3.3. The vehicle was secured to the platform with chains. Figure 3.4 shows the first vehicle secured for testing.
3.1.3 Test Measurements
No test instrumentation was included in the static testing. Excursions were recorded with two real-time HD video cameras. One camera was secured to the roll platform, forward of the ROV looking aft. A second video camera was secured to the roll cage of the ROV, above the driver-side dummy, looking downward. The camera placements are also visible in Figure 3.4.
3.1.4 Test Procedure
The vehicle was placed atop the 301 platform with a forklift as described earlier. The dummies were then positioned in the two seating positions of the ROV. Each test contained either two 50th percentile dummies or two 5th percentile dummies in the driver and passenger seating positions of the ROV. Appendix 2 contains the dummy seating procedure and the table of measurements of the positioned dummies in the static tests. The camera views were then checked, and the cameras were set to begin recording. The platform was then rotated at a rate of 45-75 degrees per second, such that the driver dummy leaned outward first. Figures 3.5 – 3.8 show the vehicle and dummy motions through the first 90 degrees of roll motion of the vehicle.
4
3.1.5 Static Test Matrix
The test matrix is shown in Table 3.1. The matrix differs slightly from that in the earlier proposal. Originally the static tests were planned to be conducted first, followed by the dynamic tests. Due to scheduling issues at the TRC facility, the sled tests were conducted first and the static tests done later. Due to changes that were made to the dynamic test matrix at the request of the COTR, corresponding changes were also made to the static matrix, to allow one-to-one test comparisons between the static and dynamic tests.
3.2 Dynamic HYGE Sled Induced Rollover Motion
In an ROV rollover event, either on-road or off-road, lateral forces are applied to the tires as the vehicle begins to slide sideways. When the lateral forces reach 60-70% of the vehicle weight, roll motion is initiated. The roll motion can be simulated by using the HYGE sled as an input device to apply lateral forces to the tire-road interface of the ROV. To eliminate variability due to tire flexion, the tire/wheel assemblies were removed from the driver side of the ROV’s and the bolt pattern matched to a metal plate, which was attached to a hinge on the sled platform, supported the vehicle. As with the static fixture, steel grating was mounted atop the sled base to accommodate both 90 and 60 degree orientations relative to the sled motion. Figure 3.9 shows the steel grating, the hinge plates, and the mounted for testing at 60 degrees.
The HYGE acceleration pulse is varied by the shape of the metering pin and the pressures in the propulsion and snub chambers. The pin selected for this application was a long stroke (about 60 inches) triangular shape pulse pin used for other applications at the TRC. Appendix 3 shows an example plot of acceleration vs. time produced by the pin. The accelerations desired for this ROV rollover program were in the range of 1-3 g’s. The ideal acceleration level is dependent upon various factors, and identifying the appropriate acceleration level was one of the outcomes of the program. In order to prevent excessive damage to the ROV’s, and to produce more pronounced excursions of the occupant, the roll motion of the ROV’s were arrested with heavy nylon straps at the maximum desired level of roll angle of the vehicle. The length of the straps was adjusted to allow approximately 45 degrees of free roll motion before the straps drew taught and abruptly stopped the roll motion. Figure 3.10 shows the vehicle rotated from the sled platform with a crane to adjust the length of the tethers.
5

3.3 Loading Conditions and Occupants
Loading of ROV’s is more critical than loading of cars and light trucks. By nature of their design, ROV’s are relatively high to provide clearance of off-road obstacles, and relatively narrow to allow traverse of a variety of trail conditions. Because of this, occupant and cargo weights can significantly affect the stability of the vehicle. As this program was limited to factors related to occupant containment, the static-stability factor (SSF) was not measured or controlled. Two occupant sizes were included in the pilot study for investigating issues related to occupant containment and excursion propensity, not for the effect on SSF.
One of the major issues in any type of rollover program with on-board occupants is the lack of dummy biofidelity in roll motions. Current dummies are all designed for evaluating frontal and side crash protection in vehicles. The motions are reasonable in high g environments for frontal or lateral loading. Typical rollover events are much lower in acceleration levels, and do not produce pure frontal or lateral loading of the occupants. In such low-g environments, the current dummies are not nearly as flexible or compliant (biofidelic) as a human occupant would be. Whereas a human has a spine that is flexible in frontal, side and oblique directions, the dummy is nearly rigid. The human shoulder has a ball/socket joint; the dummy has articulation about 2 separate axes. However, the dummies do perform consistently in the type of tests that were planned for ROVs and are considered the best tools available to evaluate occupant containment potential.
Hybrid III frontal dummies were selected for this program because of their availability, price and representation of average male and small female sizes. The average male size is designated 50% male and the small female, 5th% female. The average male is about 5’ 10 inches and 170 pounds whereas the small female is about 5’, 100 pounds. The dummies were used in pairs, either both average male or both small female.
6

3.4 Data Acquisition
The pilot program was conducted with real-time digital video coverage of the static rollover tests and high speed digital video coverage of the sled tests. The cameras were placed in order to see the motion in 2 planes. For the static rollover tests, one camera was placed on the FMVSS 301 platform forward of the ROV, aligned with the driver’s side of the vehicle and looking rearward. It was assumed that the first 90 degrees of roll motion would cause the driver side dummy to lean laterally out of the vehicle, and that was of most interest in this study. The camera placement would result in the best view of the lateral motion outside the periphery of the vehicle.
A second camera was placed on the ROV, above the driver side looking downward. This placement provided a good top view of the motion, but was difficult to use this view for excursion measurement since the distance from the camera changed as the dummy leaned outward.
A similar camera placement was used for the HYGE-sled induced dynamic rollover events. In these tests, digital video was captured at 1000 frames per second. A ground camera was positioned with a longitudinal view of the ROV as the driver side of the vehicle passed by the camera. As with the static tests, a 2nd camera was placed on the ROV above the driver side, looking downward at the driver-side dummy. This provided a view of the driver-side excursions outside of the vehicle.
Acceleration measurement was not called for in the RFQ and was not included in ASE’s proposal. Two accelerometers (head Y and head Z) were subsequently added to the driver side dummy head for the 3 repeat tests with the In 90 degree testing, there is negligible acceleration in the X direction, so it was believed that Y-Z accelerometers would capture the head accelerations in the lateral and vertical directions during dummy motions, and provide valuable insight to the repeatability of the head accelerations in these low g tests. All electronic data was collected using the Kayser-Threde self contained Minidau units. The data was then be uploaded to TRC’s network immediately following the test, filtered with a class 1000 digital filter and provided to ASE in Microsoft Excel format.
Figure 3.11 shows the high speed cameras in a typical HYGE sled test.
7

3.5 Enhanced Restraint Condition
The two vehicles used in the program were the r and the These vehicles were owned and provided for this program by the CPSC. The
as received had 3 pt. belts and two additional features that would help retain occupants in low severity rollover events. The first was a tubing structure, covered with a plastic trim, adjacent to the occupant torso. In addition, the vehicle was provided with a nylon webbing system which attaches in the foot well, the seat structure and the roll bar near the belt D-ring. No owner’s manual was in the vehicle, and it is not clear what the webbing was designed to provide. The attachments are similar to clips on a back-pack. At the direction of the CPSC, the webbing was not used for these tests.
The RFQ called for two tests (one static and one sled test) utilizing an enhanced restraint in the It was desirable that the enhanced restraint be structural and passive (no action required by the operator), rather than webbing that must be installed (or could easily be removed) by the occupants. The tubing system of the
seemed to provide reasonable containment at low speeds, so fixturing was prepared to mount the torso restraint in the The fixturing allowed more substantial mounting directly to the roll bars, rather than the bottom end mounting to the seat tubing. Figures 3.12 – 3.14 show the enhanced restraint mounted to the
and the mounting fixtures at the top and bottom of the tubing.
3.6 Unbelted Test Set-up
In consultation with the COTR, two tests were conducted with the driver dummy unbelted. Changes were made to the test matrix, to conduct a pair of tests with a peak acceleration of the sled near 1 g and the driver dummy unbelted. To prevent the driver dummy receiving damage from impact to the sled base or the concrete surface, two modifications were made to the test set-up. First, a foam pad was attached to the sled base outboard of the driver-side of the ROV. Secondly, nylon ropes were attached to the shoulder and waist of the driver dummy to limit the amount of excursion the dummy could undergo. The rope length was set to allow the dummy to barely exit the vehicle.
Figure 3.15 is a photo of the padding added to the sled base and Figure 3.16 shows the nylon ropes attached to prevent the driver dummy to limit it from going too far outside the periphery of the vehicle.
8

4.0 ANALYSIS OF THE DATA
4.1 Test Results
4.1.1 Static Test Results
Table 4.1 presents the excursions from the static tests. The setup on the static fixture was relatively straightforward. The dummy joints were loosened from the normal 1 g settings used for crash testing. As the platform slowly rotated, the dummies reacted to the changing direction of gravity.
Figure 4.1 presents the comparison of excursions between the two vehicles at the two angles and between the two dummies. The largest difference occurred between the two vehicles, primarily due to the torso bar on the There was close to a 3 inch difference in excursion attributable to the angle and only an inch on average attributable to the dummy size.
Figure 4.2 presents the repeatability results, based on tests 4, 5 and 6. The repeatability tests were performed with the 50th percentile male dummy, at 90 degrees orientation of the The coefficient of variation (CV) for the head excursion values is 12.4%, which seems acceptable for this type of low-energy testing. The CV for the hand excursions is 10.2%.
Figure 4.3 presents the pair of tests conducted to evaluate the enhanced restraint. The conditions are belted, 90 degree with the 50th percentile male dummy. The baseline test value shown is the average of the 3 repeatability tests, for head and hand excursions. There was no excursion of the head and hand for the enhanced restraint test. Photos of the baseline and enhanced-restraint tests at 90 degrees of rotation are shown in Figures 4.4 - 4.5.
4.1.2 Dynamic (HYGE Sled) Test Results
The dynamic tests were conducted on June 2-4, 2010. The concept of replacing the tire/wheel assembly with a metal plate, hinged at the sled base to produce roll motions worked as planned and produced realistic and repeatable roll motions of the ROV’s. Figures 4.6 - 4.9 show a sequence of the motion of the at 0.2 second intervals until the straps tighten.
Sled tests were run at different peak g levels. As mentioned earlier, the HYGE metering pin selected for this testing was about 60 inches in length and resulted in a somewhat triangular acceleration pulse shape. The first test conducted was at about 2 g’s peak acceleration, and was a trial to verify the structural integrity of the set-up. The test was conducted with dummies onboard. The test went well, and verified the test set-up. No data were obtained from this test, other than the printout of the sled acceleration pulse. Appendix 4 contains a printout of the 2 g trial pulse.
9

The trial test resulted in full rotation of the vehicle, little jerk in the arresting straps, and in minimal dummy motions in the Accordingly, the acceleration level was increased to approximately 2.5 g’s peak acceleration for most of the remaining tests. This produced smooth roll motions during the acceleration phase, and robust jerks when the tethers arrested the roll motion. Dummy motions were noted in two distinct time phases of these tests, 1) Free motion phase, or from the time of initiation of roll motion until the tethers tightened, and 2) Arrested motion phase, the exaggerated motions resulting from the sudden stop of the roll motion. The realism of each phase will be discussed later.
The dummy excursions are presented in Table 4.2. The table describes the conditions corresponding to each test number, and the resulting excursions of the head and hand. Head excursion is an estimate of the maximum distance outside of the roll cage that the head reached. Since the head rotates as the dummy leans out of the vehicle, the region of the head with maximum excursion is constantly shifting. It would be difficult to use automated software to track this motion by analyzing the film, so this was done manually, frame by frame. It is estimated that the resolution of this analysis is about 0.5-1 inch. Accordingly, excursion values are shown to the nearest inch. In almost all instances, the ground based camera was used to estimate dummy excursions. The hand markers were placed just above the articulated wrist, on the back of the hand. So hand excursion levels did not include the fingers. “Head 1 and Hand 1” refer to the corresponding excursions during the free-motion phase. “Head 2 and Hand 2” refer to the maximum excursion that occurred during the arrested-motion phase.
4.2 Test Repeatability
Three sled tests were performed specifically to estimate the degree of repeatability of sled testing in this manner. An overlay of the resultant head accelerations is shown in Figure 4.10. Table 4.3 presents the peak sled g’s, the peak head g’s during the arrested-motion phases, and the head and hand excursions. The test repeatability can be examined at the “input” and “output” level. The input for the sled tests is the sled acceleration pulse. The CV (standard deviation divided by the mean value as a percent) for the sled peak g’s is 0.23%, which is excellent repeatability. The CV’s for the peak head accelerations is 1.2%for the arrested motion phase. This is also excellent repeatability.
The excursion level measurements are more subjective than the acceleration measurements. CV’s were computed for the head and hand excursions during the free motion and arrested motion phases, and are on the order of 10% as shown in Table 4.3, which is reasonable.
10

4.3 Analysis of Main Effects
The main variables in the test program were model of ROV, test angle, test dummy, acceleration level, belt use and presence of an enhanced restraint. If these tests were to be conducted in a full factorial fashion, the matrix would contain 64 tests. The pilot program was confined to a total nine sled tests, so limited conclusions can be drawn from the factors involved, and limited statistical conclusions can be drawn from the limited data set.
Figure 4.11 shows the main effects of ROV, angle and dummy. Since the two, 1 g tests were performed without belts, the effect of g level and belt use cannot be determined because all tests at 2.5 g’s had the dummies belted.
4.4 Enhanced Restraint – Unbelted Test Results
A pair of tests was conducted to demonstrate the effectiveness of the enhanced restraint. For these tests, the driver dummy was unbelted and tethered to limit the degree of ejection, as described in Section 3. The sled pulse was set to around 1 g.
The tests resulted in about 10-15 degrees of vehicle roll motion, indicating that the 1 g pulse was not sufficient to cause the full 45 degrees of tip-up. Figure 4.12 shows the front view of the at maximum roll angle.
In the baseline unbelted test, the driver dummy leaned out the side of the vehicle to over 90 degrees. The only thing preventing the dummy from full ejection was leg interference with the vehicle. The maximum head excursion was 28 inches. The dummy position at maximum excursion is shown in Figure 4.13. The comparison dummy excursion would be that of Figure 4.12, which shows that with the torso bar, the head excursion was zero.
4.5 Discussion of Results
4.5.1 Static vs. Dynamic Test Procedures
This limited pilot test series was very useful to assess the advantages and disadvantages of the two test approaches. The reader is cautioned in making some comparisons, because of the lack of total comparability in the test types. The static tests were conducted as originally planned, with two angles, two dummies, two vehicles and 3 repeats with one vehicle. In sled testing, one of the 5th female dummy tests was dropped in order to do the enhanced restraint pair of tests at 1 g, so as not to exceed the number of tests included in the plan and stay within the scope of the pilot program. Both static and dynamic test types indicated that there was little difference in results due to the large and small dummy sizes. Both showed that the excursions were significantly less than those of the Both test types resulted in
11

significantly less head excursion in the with the enhanced restraint than in the baseline vehicle.
In comparing the tests, the advantage of the static test is the simplicity of the test. Gravity is a repeatable and the rotating platform is straightforward to perform. However, its suitability for using it as a compliance test for regulatory purposes need to be further explored.
There are several advantages to the sled approach. First of all, the test is more realistic, in that the time history of a typical roll motion can be realistically simulated. Dummy motions will closely approximate those of a real rollover event. In addition, the severity of the event can be set to the level desired. The sled input g level can be higher to simulate a curb impact at high speed or lower to simulate rollover due to sliding friction forces. Whereas the static roll did not produce loading sufficient to fail the torso bar of the the sled at 2.5 peak g’s did cause such failure. This seems a valuable aspect of the test procedure - realism and the ability to simulate a range of severities that are found in real-world situations.
4.5.2 Sled Test Discussion
It was observed that the HYGE sled, as an energy device to produce rollover motions, resulted in very repeatable roll motions. In considering the realism of the sled test approach, consider an ROV rollover wherein the operator loses directional control at 20 mph, resulting in a lateral velocity of near 20 mph. The Static Stability Factor (T/2h) for ROV’s is in the rage of 0.6 to 0.7. So when the lateral forces on the tires reach this level (.6-.7 g’s) the vehicle will begin to roll. Since it takes time for the roll motion to occur, the vehicle linear velocity decreases as the roll velocity increases. By the time the vehicle has undergone ¼ turn, the vehicle velocity is reduced, say to 5 mph, and the vehicle slams onto its side, arresting the roll velocity. As the vehicle slides sideways in soil, the deceleration starts out low and increases due to soil buildup against the leading tires. So, in this example, the loss of control occurred at 20 mph, the velocity change (delta-v) during the event was 15 mph (20 mph to 5 mph), the event occurs over 0.5 to 1 second of time, and the deceleration pulse starts out low, and increases to 2.5 g peak as soil builds up on the leading tires. The deceleration would be equivalent to a triangular in shape.
The sled simulation of the event duplicates the vehicle/occupant dynamics, but the vehicle/ground motion occurs in reverse. Whereas in the actual event, the vehicle started out at 20 mph and underwent a 15 mph delta-v laterally, in the sled, the vehicle starts out at 0 mph and is pushed to a max velocity of 15 mph, duplicating a 15 mph delta-v. The vehicle/occupant dynamics are the same. The sled could be permitted to reach ¼ turn and slam onto its side, arresting roll motion, or the arresting
12

forces can be applied earlier than ¼ turn to prevent damage to the vehicle itself. In this series, the sled roll motion was arrested at 45-55 degrees of roll motion of ROV, which is also realistic in investigating ejection potential of ROV occupants.
It is the opinion of the researchers that the sled tests performed in this pilot study were realistic and typical of roll dynamics. Since the rollovers that produce occupant injury in the field will span a range of initial velocities, a range of terrain (flat to steep slopes) and a range of obstacles (none to large rocks and trees), one can argue that arresting the roll motion with tethers also simulates realistic occurrences in the field.
Because the lateral forces on the tires must be applied over a sufficient time period to produce rollover, both velocity and distance of sideway travel are involved in the event. In this pilot series, the 1 g acceleration pulse resulted in a velocity change of about 9 mph, the 2 g trial pulse, a delta-v of about 13 mph and the 2.5 g pulse, a delta-v of about 17 mph.
The pulse shape is important in sled simulations of frontal crashes because the occupant is coupled to the vehicle with belts/air bags, and the ability to meet injury criteria is highly dependent on the peak decelerations of the vehicle pulse. In rollover tests, occupant decelerations due to the rollover motions, are very low, and the sled pulse is only a means of initiating roll motions. Basically, the sled is an energy input mechanism to build up roll velocity. The acceleration profile is not nearly as important as the energy input during the acceleration phase. And since the ability to vary energy and roll velocity has been demonstrated, it is the opinion of the researchers that the pulse shape is of little significance for evaluating ejection potential of occupants in ROV rollovers.
4.5.3 Occupant Protection Approaches
This pilot study was conducted mostly with belt-restrained occupants, and focused totally on occupant excursions. In field rollover accidents, injury occurs from contact with the ground (rocks, trees etc), from contact with the roll bars, and from the occupant being crushed between the roll cage and the ground. The torso bar of the
was sufficient to prevent ejection of an unrestrained occupant at 1 g. It was not of sufficient structural strength to restrain a belted occupant in the arrested motions at 2.5 g. It would not likely survive the roll dynamics of many field-injury accidents. Additional protection such as a 5-point belt harness integrated into the vehicle seat might prevent head excursions in more violent collisions, but only if the occupant took action to wear the belts. In addition, energy absorbing padding of the roll cage and adjacent hard points where the occupants’ head might strike may be necessary to prevent head injury due to head contact with the upper interior surfaces, especially for those occupants who will not wear a helmet.
13

5.0 Observations, Conclusions and Recommendations
Observations:
Either the static rollover approach or the HYGE sled approach could be considered as a test tool for ROV rollover safety. However, as a compliance test tool the sled approach has clear advantages
The HYGE sled produced highly repeatable input accelerations to the ROV, even at low g levels
ROV rolls and dummy responses on the HYGE sled were repeatable and realistic in motion
HYGE sled approach allows variable severity through adjustment to input g’s and pulse width, and the tether allows arresting of roll velocity as encountered in some rollover events
The HYGE sled approach produced realistic results in belted and unbelted applications
The HYGE sled was able to distinguish between a vehicle with a passive torso restraint and one without
Angle (90 deg vs. 60 deg) had a small effect, but both angles may be necessary in distinguishing performance of superior passive torso restraints from inferior ones
From an excursion/ejection perspective, the small female did not add much to the information gathered from the 5oth percentile adult male sized dummy
There was little interaction between the driver and passenger dummies. Unless it is necessary to simulate interactions between a belted and an unbelted occupant, the passenger dummy could be eliminated in future tests
The range of g’s tested demonstrated a range of output responses: i.e., a 1 g peak produced sufficient input to initiate the roll of the vehicle to about 15 degrees, and cause nearly full ejection to an unbelted 50th male occupant; 2 g’s produced full 45 degree rotation, but not sufficient energy to significantly distort the passive torso restraints of the 2.5 g’s produced full 45 degree rotation and significant distortion of the passive restraints
14

Conclusions:
The HYGE sled appears to be a very promising compliance tool to assess ejection potential of ROV’s
The HYGE approach is more realistic than the static roll procedure
Recommendations:
The HYGE approach should be used to evaluate a larger subset of the ROV population in the fleet
Further development of the HYGE approach for unbelted occupants is recommended, and refinements in the acceleration levels for unbelted tests explored
The effectiveness of a passive torso restraint should be further evaluated, and the limits of practical acceleration levels established
Additional ejection protection measures such as 5-point belt harness or more robust torso restraint approaches should be considered
The occupant safety in ROV rollovers should also consider head protection from impact against the upper interior surface. Cushioning of such head impacts against the roll cage and other upper interior surfaces may be necessary to prevent serious head injuries. Such countermeasures should be considered, and a test procedure similar to FMVSS 201 explored for added head protection.
15

Figures

Figure 2.1 Front Oblique
Figure 2.2 Side View

Figure 2.3 Front Seat Removed
Figure 2.4 Belt Hardware

Figure 2.5 Oblique View
Figure 2.6 Side View

Figure 2.7 Seat Removed
Figure 2.8 Belt Hardware

Figure 2.9 Torso Bar
Figure 2.10 Containment Webbing
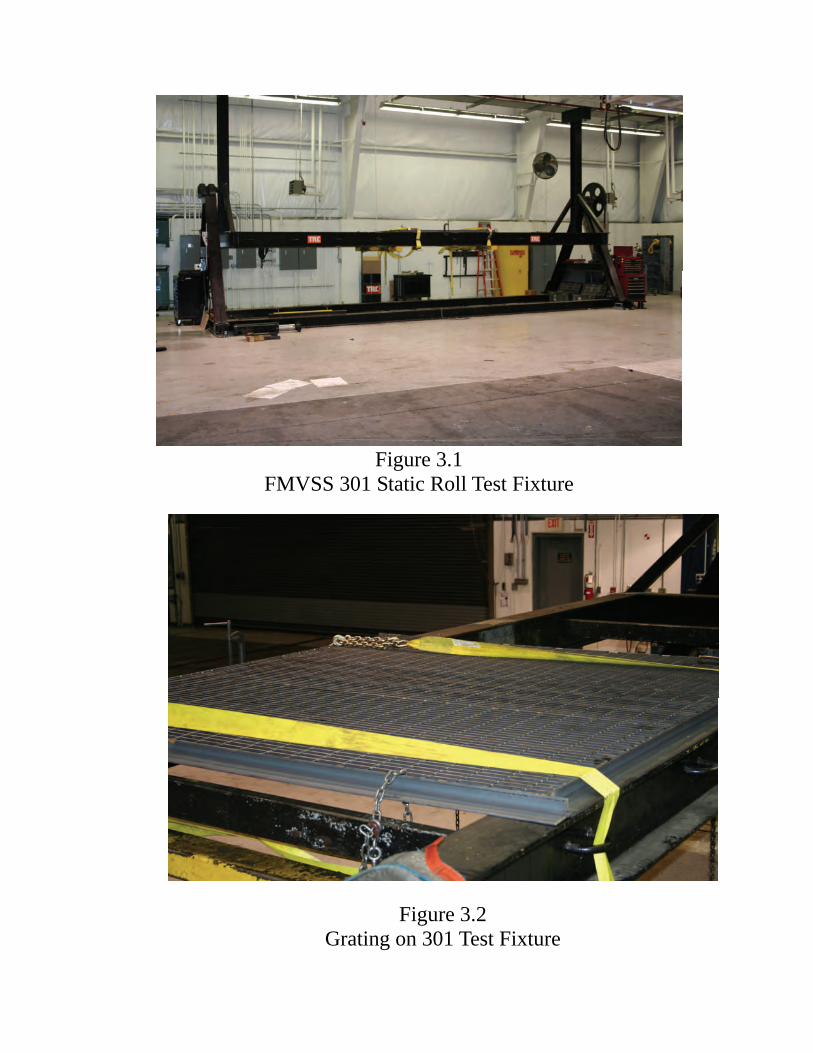
Figure 3.1 FMVSS 301 Static Roll Test Fixture
Figure 3.2 Grating on 301 Test Fixture

Figure 3.3 Mounting to Static Fixture
Figure 3.4 Mounting and Camera Placement

Figure 3.5 Vehicle Mounting to Static Fixture
Figure 3.6 Vehicle Ready for Static Testing

Figure 3.7 Vehicle Beginning Test Rotaton
Figure 3.8 Vehicle at 90 degrees Static Roll

Figure 3.9 Vehicle Mounting Hinges on Sled
Figure 3.10 Vehicle Rotated for Tether Adjustment

Figure 3.11 Camera Placement for Sled Testing
Figure 3.12 Enhanced Restraint Mounted in

Figure 3.13 Upper Mounting of Enhanced Restraint in
Figure 3.14 Lower Mounting of Enhanced Restraint in

Figure 3.15 Padding Added for Unbelted Dummy Tests
Figure 3.16 Driver Dummy Tethers for Unbelted Tests
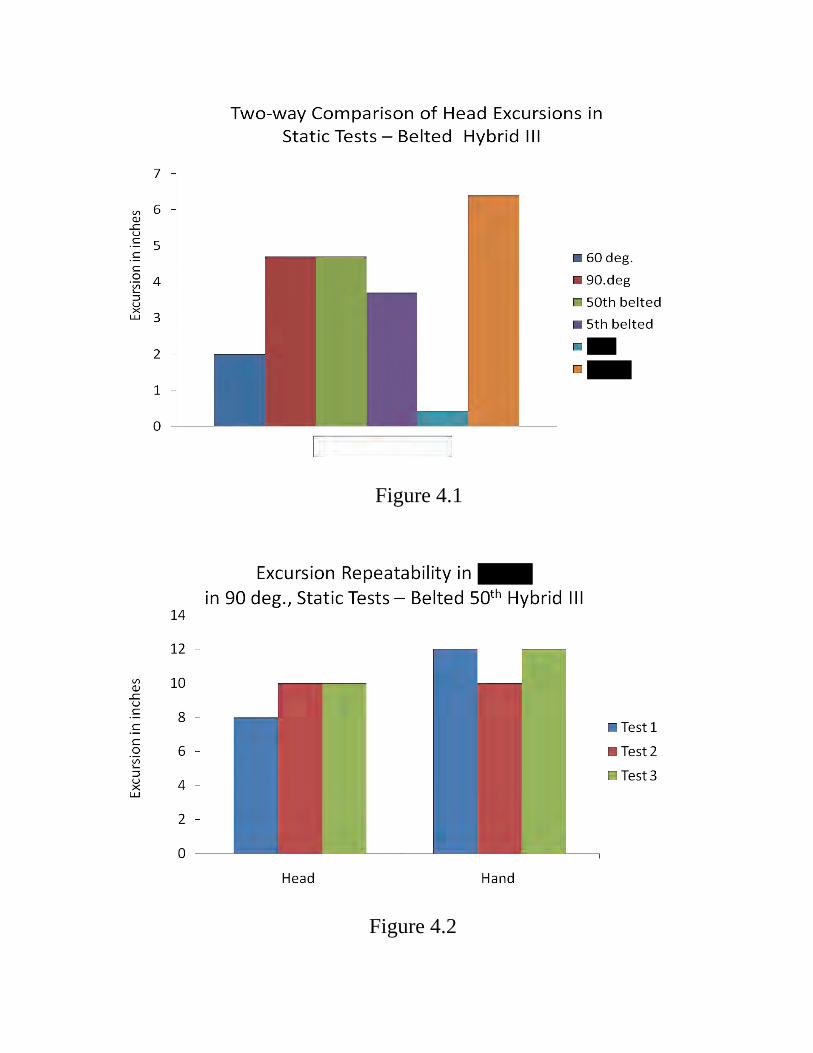
Figure 4.2
Figure 4.1

Figure 4.3

Figure 4.4 Static Test of Baseline at 90 degrees Rotation
Figure 4.5 Static Test of with Enhanced Restraint at 90 degrees

Figure 4.6 Sled Test at time=0
Figure 4.7 Sled Test at time = 200 msec

Figure 4.8 Sled Test at time = 400 msed
Figure 4.9 Sled Test at time = 600 msec

Figure 4.10 Head Resultant Accelerations from Repeatability Tests
Figure 4.11 Main Effect Comparisons for Sled Testing
0
0.5
1
1.5
2
2.5
3
3.5
4
4.5
0 20 40 60 80
Test 1 Test 2 Test 3
Time x10 m.sec
Comparison of Resultant Head Acceleration
g’s
.
0
2
4
6
8
10
12
14
16
18
Head 1 Head 1
60 deg.
90.deg
50th belted
5th belted
ZZZZZZZZZZZZZZZZZZ Head 2ZZZZZZZ
Two‐way Comparison of Head Excursions in Sled Tests – Belted Hybrid III
Excursion in inches

Figure 4.12 1 g at Max Roll Angle
Figure 4.13 Max Dummy Excursion , Baseline, Unbelted

0
5
10
15
20
25
30
Head Hand
Unbelted
Enh.Rest.
Comparison of Excursions in 90 deg) Under Unbelted & Enhanced
Restraint Conditions
inches
Figure 4.14

TABLES
Table 3.1 Static Test Matrix
Test Number Angle Vehicle Type
Dummy Type Test Date
Test 1 90 (2) HIII 50th, Un-instrumented
6/10/2010
Test 2 90 (2) HIII 5th, Un-instrumented
6/10/2010
Test 3 60 (2) HIII 50th, Un-instrumented
6/10/2010
Test 4 90
(2) HIII 50th, Un-instrumented
6/10/2010
Test 5 90
(2) HIII 50th, Un-instrumented
6/10/2010
Deleted Test 6 90
(2) HIII 50th, Un-instrumented
6/10/2010
Test 7 Enhanced Restraint
90
(2) HIII 50th, Un-instrumented
6/10/2010
Test 8 90
(2) HIII 5th, Un-instrumented
6/10/2010
Test 9 60
(2) HIII 50th, Un-instrumented
6/10/2010

Test Number
Angle Vehicle Type Dummy Type Test Date Test Time Target G Restraint Status
Test 1 90 (2) HIII 50th, Un‐instrumented
6/2/2010 9:38 2.5 OEM Restraints
Test 2 90 (2) HIII 5th, Un‐instrumented
6/2/2010 11:30 2.5 OEM Restraints
Test 3 60 (2) HIII 50th, Un‐instrumented
6/2/2010 15:02 2.5 OEM Restraints
Test 4 90 (2) HIII 50th, Instrumented 6/3/2010 13:35 2.5 OEM Restraints Test 5 90 (2) HIII 50th, Instrumented 6/3/2010 15:11 2.5 OEM Restraints Test 6 90 (2) HIII 50th, Instrumented 6/3/2010 16:04 2.5 OEM Restraints Test 7 90 (2) HIII 50th, Un‐
instrumented 6/4/2010 9:02 1 No Seatbelt
Test 8 90 (2) HIII 50th, Un‐instrumented
6/4/2010 12:11 1 Enhanced Passive
Test 9 60 (2) HIII 50th, Un‐instrumented
6/4/2010 13:55 2.5 OEM Restraints
TABLE 4.1 EXCURSIONS IN STATIC TESTS
Enhanced Test No. Vehicle Angle Dummy Passive
Restraint Head
Excursion Hand
Excursion
1 90 50th NA 0 6 2 90 5th NA 1 0 3 60 50th NA 0 1 4 90 50th N 8 12 5 90 50th N 10 10 6 90 50th N 10 12 7 90 50th Y 0 0 8 90 5th N 6 6 9 60 50th N 4 8
Repeatability
Enhanced Restraint
Table 3.2 Sled Test Matrix

Table 4.2‐ Average and Coefficient of Variation in Peak g’s and Excursion Values
Item Peak Sled g’s Head Res.(2) g’s Head Exc.(1) in Head Exc.(2)in Hand Exc.(2)in
Test 1 2.55 4.16 7.0 16.0 24.0
Test 2 2.55 4.12 6.0 15.0 29.0
Test 3 2.54 4.06 6.0 18.0 27.0
Average 2.55 4.11 6.33 16.33 26.67
C V % 0.23 1.22 9.12 9.35 9.44

Appendices


Customer: ASE
Sled Pulse Trial #S 10060 1-1
-2,5
.5
7.5
.10
-12.5
SOSLEDCYOOOOVEXC
DaiC: 06/01/2010
TiJllc: 15:26
TRC Inc. Test Lab: SLEDTest Number: Sl00601-1
.151 I~~ 0 250 500 7~ 1000
I'ill<."-("L,,, ("['e 1'Hi
SOSLEDCYOOOOACXDr'''''-I''"I
Duration = 452.78 ms
~c.:2 0.5'"tiOJuu 0-<
-0.5
-1
-1.5
-2
-2.5 .-250
Filter Class: CFC_60
o
Channel Name
250
<Min Value>
500 750
<Max Value>
1000
Time [ms]
SOSLEDCYOOOOACXD -2.02 g at 274.72 ms
SOSLEDCYOOOOVEXC -13.73 mi/hr at 453.04 ms
0.83 g at
0.00 mi/hr at
683.12 ms
0.00 ms