file
157
Research Collection Doctoral Thesis Imaging Electronic Structure and Dynamics of Molecules through Strong-Field Ionization, Rescattering and Holography Author(s): Walt, Samuel Gebhard Publication Date: 2015 Permanent Link: https://doi.org/10.3929/ethz-a-010483813 Rights / License: In Copyright - Non-Commercial Use Permitted This page was generated automatically upon download from the ETH Zurich Research Collection . For more information please consult the Terms of use . ETH Library
-
Upload
duongnguyet -
Category
Documents
-
view
218 -
download
0
Transcript of file

Research Collection
Doctoral Thesis
Imaging Electronic Structure and Dynamics of Molecules throughStrong-Field Ionization, Rescattering and Holography
Author(s): Walt, Samuel Gebhard
Publication Date: 2015
Permanent Link: https://doi.org/10.3929/ethz-a-010483813
Rights / License: In Copyright - Non-Commercial Use Permitted
This page was generated automatically upon download from the ETH Zurich Research Collection. For moreinformation please consult the Terms of use.
ETH Library

DISS. ETH NO. 22438
Imaging Electronic Structure and
Dynamics of Molecules through
Strong-Field Ionization, Rescattering and
Holography
A thesis submitted to attain the degree of
DOCTOR OF SCIENCES of ETH ZURICH
(Dr. sc. ETH Zurich)
presented by
SAMUEL GEBHARD WALT
MSc ETH Interdisciplinary SciencesETH Zurich
born on 04.03.1984
citizen ofAltstatten SG
accepted on the recommendation of
Prof. Dr. Hans Jakob Worner, examinerProf. Dr. Ruth Signorell, co-examiner
2015


Summary
This dissertation describes the design and construction of a velocity-map-imaging spectrometer (VMIS) and its application to four different experi-ments that explored the structure and dynamics of molecules by means ofstrong-field ionization (SFI). The main components of the spectrometer arean electrostatic lens system and a position-sensitive detector. Ions or electronsgenerated in the focus of the VMIS through photoionization are acceleratedby the static field of the lens system towards the detector. The initial momen-tum and the mass-to-charge ratio of the accelerated particles can be retrievedfrom the position of impact on the detector and the time of flight. As aresult one obtains a three-dimensional momentum-distribution spectrum. Inthe first experiment a mixed electronic-rotational wave packet in nitric oxidewas measured using impulsive stimulated Raman scattering as pump and SFIas probe. We found the low-energy photoelectron momentum distribution tobe very sensitive to the evolution of the electronic wave packet through holo-graphic interferences whereas the high-energy electron momentum distributionwas mainly influenced by the rotational wave packet. In a second experimentisotope effects on the tunneling-ionization and dissociative ionization rates ofH2, D2, CH4 and CD4 were measured and compared with theoretical results.A strong dependence of the tunneling-ionization rate on the nuclear dynamicsas predicted by theory has not been conclusively identified. The accuracy ofthe measurement was limited by the knowledge of the sample density in thedetection volume. However, isotope effects on the dissociative ionization ofthe molecules were observed. In the third experiment, we have attemptedto observe nuclear dynamics based on laser-induced photoelectron diffraction.To this end the angle-resolved photoelectron momentum spectra of H2, D2,CH4 and CD4 were measured and compared. Differences in the spectra of thecorresponding isotopologues were observed but we could not exclude contri-butions of laser intensity variations to the observed differences. Nevertheless,theoretical results obtained in the framework of this thesis predict observableeffects. Finally, we studied the dissociative ionization of methyl halides in aphase-controlled two-color laser field. We found that tunneling ionization lead-ing to the Coulomb explosion of CH3F is faster if the electric field amplitudepoints from the methyl group to the halogen atom. For CH3Cl, CH3Br and
iii

iv
CH3I the asymmetry is opposite when CH3+ ions with low kinetic energies are
formed. However, for the dissociative ionization leading to high-energy CH3+
fragments different asymmetries were observed.
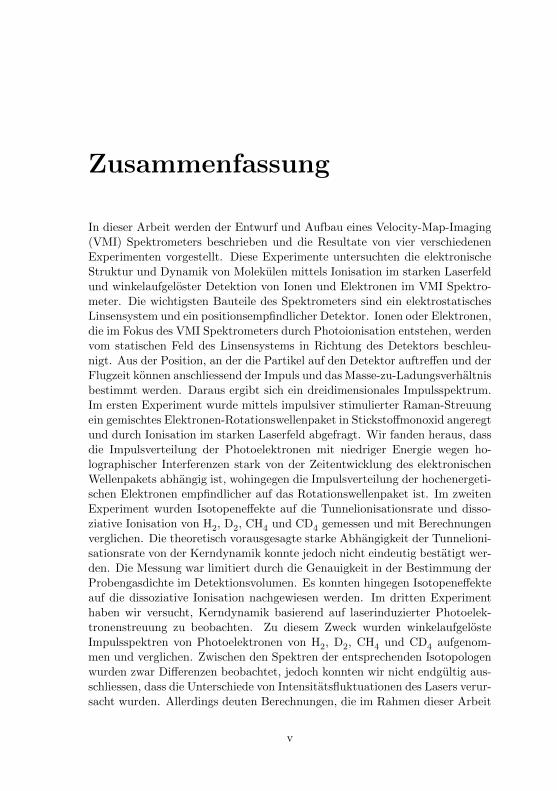
Zusammenfassung
In dieser Arbeit werden der Entwurf und Aufbau eines Velocity-Map-Imaging(VMI) Spektrometers beschrieben und die Resultate von vier verschiedenenExperimenten vorgestellt. Diese Experimente untersuchten die elektronischeStruktur und Dynamik von Molekulen mittels Ionisation im starken Laserfeldund winkelaufgeloster Detektion von Ionen und Elektronen im VMI Spektro-meter. Die wichtigsten Bauteile des Spektrometers sind ein elektrostatischesLinsensystem und ein positionsempfindlicher Detektor. Ionen oder Elektronen,die im Fokus des VMI Spektrometers durch Photoionisation entstehen, werdenvom statischen Feld des Linsensystems in Richtung des Detektors beschleu-nigt. Aus der Position, an der die Partikel auf den Detektor auftreffen und derFlugzeit konnen anschliessend der Impuls und das Masse-zu-Ladungsverhaltnisbestimmt werden. Daraus ergibt sich ein dreidimensionales Impulsspektrum.Im ersten Experiment wurde mittels impulsiver stimulierter Raman-Streuungein gemischtes Elektronen-Rotationswellenpaket in Stickstoffmonoxid angeregtund durch Ionisation im starken Laserfeld abgefragt. Wir fanden heraus, dassdie Impulsverteilung der Photoelektronen mit niedriger Energie wegen ho-lographischer Interferenzen stark von der Zeitentwicklung des elektronischenWellenpakets abhangig ist, wohingegen die Impulsverteilung der hochenergeti-schen Elektronen empfindlicher auf das Rotationswellenpaket ist. Im zweitenExperiment wurden Isotopeneffekte auf die Tunnelionisationsrate und disso-ziative Ionisation von H2, D2, CH4 und CD4 gemessen und mit Berechnungenverglichen. Die theoretisch vorausgesagte starke Abhangigkeit der Tunnelioni-sationsrate von der Kerndynamik konnte jedoch nicht eindeutig bestatigt wer-den. Die Messung war limitiert durch die Genauigkeit in der Bestimmung derProbengasdichte im Detektionsvolumen. Es konnten hingegen Isotopeneffekteauf die dissoziative Ionisation nachgewiesen werden. Im dritten Experimenthaben wir versucht, Kerndynamik basierend auf laserinduzierter Photoelek-tronenstreuung zu beobachten. Zu diesem Zweck wurden winkelaufgelosteImpulsspektren von Photoelektronen von H2, D2, CH4 und CD4 aufgenom-men und verglichen. Zwischen den Spektren der entsprechenden Isotopologenwurden zwar Differenzen beobachtet, jedoch konnten wir nicht endgultig aus-schliessen, dass die Unterschiede von Intensitatsfluktuationen des Lasers verur-sacht wurden. Allerdings deuten Berechnungen, die im Rahmen dieser Arbeit
v

vi
durchgefuhrt wurden, auf beobachtbare Unterschiede hin. Zuletzt haben wirdie dissoziative Ionisation von Methylhalogeniden in einem phasenkontrollier-ten Zweifarbenfeld untersucht. Wir fanden heraus, dass die Tunnelionisation,die zur Coulomb-Explosion des CH3F fuhrt, schneller ablauft, wenn das elek-trische Feld des Lasers vom Methylrest in Richtung des Halogenatoms zeigt.Fur CH3Cl, CH3Br und CH3I ist dies fur die entgegengesetzte Richtung derFall, wenn CH3
+ Fragmente mit geringer kinetischer Energie entstehen. Furdie dissoziative Ionisation, die zu hochenergetischen CH3
+ Ionen fuhrt, wurdenjedoch andere Richtungspraferenzen beobachtet.

Contents
Summary iii
Zusammenfassung v
1 Introduction 11.1 Outline of this Thesis . . . . . . . . . . . . . . . . . . . . . . . 4
2 Spectrometer and Laser System 52.1 The Spectrometer . . . . . . . . . . . . . . . . . . . . . . . . . 5
2.1.1 Vacuum Chamber . . . . . . . . . . . . . . . . . . . . . 62.1.2 Top Flange Assembly . . . . . . . . . . . . . . . . . . . 82.1.3 Electrostatic Lens System . . . . . . . . . . . . . . . . . 102.1.4 Bottom Flange Assembly . . . . . . . . . . . . . . . . . 132.1.5 Image Processing . . . . . . . . . . . . . . . . . . . . . . 15
2.2 The Laser System . . . . . . . . . . . . . . . . . . . . . . . . . 16
3 Electronic and Rotational Wave Packets in Nitric Oxide 193.1 Introduction . . . . . . . . . . . . . . . . . . . . . . . . . . . . . 193.2 Experimental Details . . . . . . . . . . . . . . . . . . . . . . . . 213.3 Results . . . . . . . . . . . . . . . . . . . . . . . . . . . . . . . . 22
3.3.1 Ion Time-of-flight Measurement . . . . . . . . . . . . . . 223.3.2 Observation of the Electronic Coherence . . . . . . . . . 263.3.3 Observation of the Rotational Coherence . . . . . . . . 38
3.4 Conclusion . . . . . . . . . . . . . . . . . . . . . . . . . . . . . 48
4 Isotope Effects in Strong-Field Ionization Rates 514.1 Introduction . . . . . . . . . . . . . . . . . . . . . . . . . . . . . 514.2 Experimental Details . . . . . . . . . . . . . . . . . . . . . . . . 52
4.2.1 Optical Setup . . . . . . . . . . . . . . . . . . . . . . . . 524.2.2 Laser Pulse Characterization . . . . . . . . . . . . . . . 534.2.3 Detection Efficiency and Gas Density Calibration . . . . 544.2.4 Measurement Procedure . . . . . . . . . . . . . . . . . . 56
4.3 Numerical Calculation of the Xenon Ionization Rate . . . . . . 574.4 H2 and D2 Results . . . . . . . . . . . . . . . . . . . . . . . . . 58
vii

viii
4.4.1 Dissociation Mechanism in H2 . . . . . . . . . . . . . . . 594.4.2 Momentum Distribution Spectra of H+ and D+ Ions . . 634.4.3 Intensity Calibration . . . . . . . . . . . . . . . . . . . . 674.4.4 Fragmentation Rate . . . . . . . . . . . . . . . . . . . . 694.4.5 Total Ionization Rate . . . . . . . . . . . . . . . . . . . 72
4.5 CH4 and CD4 Results . . . . . . . . . . . . . . . . . . . . . . . 744.6 Conclusion . . . . . . . . . . . . . . . . . . . . . . . . . . . . . 80
5 Photoelectron Diffraction from H2, D2, CH4 and CD4 815.1 Introduction . . . . . . . . . . . . . . . . . . . . . . . . . . . . . 815.2 Experimental Details . . . . . . . . . . . . . . . . . . . . . . . . 835.3 Calculation of Differential Cross Sections . . . . . . . . . . . . 83
5.3.1 Using Quantemol . . . . . . . . . . . . . . . . . . . . . . 835.3.2 Calculated DCS . . . . . . . . . . . . . . . . . . . . . . 86
5.4 Experimental Results . . . . . . . . . . . . . . . . . . . . . . . . 895.5 Conclusion . . . . . . . . . . . . . . . . . . . . . . . . . . . . . 95
6 Strong-Field Ionization of Methyl Halides with aPhase-Controlled Two-Color Laser Field 976.1 Introduction . . . . . . . . . . . . . . . . . . . . . . . . . . . . . 976.2 Experimental Details . . . . . . . . . . . . . . . . . . . . . . . . 996.3 Electronic and Geometric Structure of Methyl Halides . . . . . 1026.4 Results . . . . . . . . . . . . . . . . . . . . . . . . . . . . . . . . 107
6.4.1 Ion Time-Of-Flight Spectra of Methyl Halides . . . . . . 1076.4.2 Asymmetric Emission of Charged Fragments . . . . . . 112
6.5 Conclusion . . . . . . . . . . . . . . . . . . . . . . . . . . . . . 132
7 Conclusion and Outlook 133
Bibliography 137
Danksagung 147

Chapter 1
Introduction
The interpretation of the photoelectric effect based on energy quanta by AlbertEinstein was an important milestone in the development of quantum mechan-ics at the beginning of the last century [1]. The photoelectric effect was firstobserved by Heinrich Hertz in 1887. In his experiment, Hertz showed thatthe sparking between two electrodes is enhanced if the electrodes are illumi-nated with ultraviolet light [2]. This result demonstrated that electrons canovercome the Coulomb force and detach from the atomic nucleus through theabsorption of photons. For weak electromagnetic fields this process can onlyoccur if the photon energy exceeds the ionization potential. In strong fields,however, ionization is also possible when the photon energy is less than theionization potential. In this case the electron has to absorb several photonsto reach the continuum. Such transitions become only relevant if the pho-ton flux is very high. Therefore, multiphoton experiments were not possiblewith the light sources available before the invention of the laser. But withthe development of high-performance laser systems in the 1970’s multiphotonexperiments became feasible. In an experiment realized by Agostini et al. [3]in the late 1970’s it was observed that the photoelectrons can absorb morephotons than actually necessary to overcome the ionization potential. Today,this process is called above-threshold ionization (ATI). Fourteen years laterYang et al. [4] measured ATI peaks up to the 30th order from xenon andkrypton for a laser intensity exceeding 1013 W/cm2. This was an amazingresult because, according to Newton’s equation of motion, a free electron in alaser field can only gain a maximum kinetic energy of 2Up where Up representsthe ponderomotive energy (quiver energy). It is defined as Up = e2I/2cε0mω
2
with the electric permittivity of free space ε0, the speed of light c, the chargee and mass m of the electron and the laser intensity I and frequency ω. Thehighest observed ATI peaks, however, were near an energy of 9Up. Yang andco-workers have further measured the angular distribution of the high-energyelectrons and found that some electrons are emitted under an angle of ∼ 45◦
with respect to the z axis, the polarization axis of the laser beam. They con-
1
2 CHAPTER 1
cluded that the high energy as well as the angular distribution are the resultof a scattering process of the photoelectron with the parent ion.Today, the complete process is often explained using the three-step model in-troduced by Corkum [5] in 1993. The first step involves the ionization of theatom or molecule. Depending on the ionization potential, the laser frequencyand the intensity this process can be assigned to the multiphoton or to thetunneling regime. The assignment is made using the parameter γ =
√Ip/2Up
introduced by Keldysh in 1964 [6], where Ip stands for the ionization potentialof the target. For γ > 1 the ionization process is assigned to the multiphotonregime and for γ < 1 to the tunneling regime. The two regimes differ onlyin how the ionization process is described. In the multiphoton regime theelectron absorbs several photons till it reaches a continuum state. In the tun-neling regime, however, the electron reaches the continuum state by tunnelingthrough the strongly-distorted Coulomb potential. When γ < 1 it follows thatthis process becomes the most adequate description which applies to atoms ormolecules with a high ionization potential in an intense, low-frequency laserpulse. Thus, ionization induced by an intense infrared laser is well describedby the tunneling model. The second step describes the free motion of thephotoelectron in the oscillating field. In the simplest approximation one canneglect the influence of the Coulomb potential of the parent ion and describethe electron trajectories based on Newton’s equation of motion. The electrontunnels through the barrier when the field is maximal, reaches a continuumstate and is then pulled away from the ion. As the amplitude of the fieldchanges its sign the electron is slowed down and driven back to its startingposition where it arrives just one period later. For this trajectory the kineticenergy accumulated at the time of return will be zero. If the electron tunnelsthrough the barrier just a bit later it will have a nonzero kinetic energy whenit returns to the parent ion. The maximum energy is limited to 3.17Up. Uponreturn the electron can recombine with the ion under the emission of a photonor it can undergo an inelastic or elastic scattering process. Within the three-step model these processes belong to the third step.The recombination of the electron under the emission of a photon is calledhigh-harmonic generation (HHG). In the past HHG spectroscopy has provento be a versatile tool to observe nuclear and electronic dynamics even on thesub-femtosecond time scale. The high temporal resolution is achieved becausethe HHG generation process itself can be viewed as pump-probe experimentwhere the ionization corresponds to the pump and the recombination to theprobe. Therefore, a single HHG spectrum contains information about the nu-clear and the electronic dynamics. For example, the nuclear motion in H2
+
and D2+ [7, 8] or the temporal evolution of an attosecond electron-hole wave
packet in N2 [9] or CO2 [10] have been extracted from the HHG spectrum. Inthese experiments the nuclear and electronic motion is triggered by the tun-neling ionization itself. In other experiments the coherence between different

INTRODUCTION 3
states is created by a preceding pulse where the subsequent dynamics is thenprobed by HHG spectroscopy. For example the dissociation of Br2, electronicand nuclear dynamics in the vicinity of a conical intersection in NO2 or elec-tronic coherence in NO have been studied using this method [11–13]. HHG isalso a source of attosecond pulses [14–16] which again can be used to investi-gate ultrafast processes in atoms or molecules [17–19].In fact the recombination process which leads to HHG is very unlikely. It isfar more likely that the returning electron is scattered elastically at the parention. In principle the electron can be scattered in any direction. But generallyforward scattering is dominant leading to electrons with a maximum energyof 2Up. However, if the electron is backscattered it is further accelerated bythe driving field and gains an energy of up to 10Up as observed by Yang etal. in 1993. Meanwhile, the spectroscopy of the photoelectrons has been re-fined and it was shown that it can be used to investigate the structure anddynamics of atoms and molecules similar to HHG spectroscopy. A very impor-tant conclusion was that the elastic differential scattering cross section (DCS)of the parent ion can be obtained from the angular distribution of the high-energy electrons [20–23]. This observation connects strong-field photoelectronspectroscopy with the well-established X-ray, electron and neutron diffractiontechniques which are commonly used to determine the structure of molecules.It was indeed shown that photoelectron spectroscopy can also be used to ob-tain information about the structure of molecules [24, 25]. Therefore, thisspectroscopy method is often referred to as laser-induced electron diffraction(LIED). But in contrast to the standard scattering experiments LIED comeswith the advantage that the photoelectron spectrum also contains temporalinformation. Just recently Blaga et al. could show that it is possible to im-age nuclear dynamics induced by SFI with LIED [26]. Another importantdiscovery was the observation of a holographic pattern in the photoelectronspectrum [27–29]. To explain this effect the photoelectron has to be describedas a wave packet which starts to disperse as soon as it reaches a continuumstate. Therefore, only a fraction of the wave packet is scattered upon returnwhich leads to interference between the scattered “signal” and non-scattered“reference” waves. As a consequence of the interference between the two wavepackets, the holographic pattern contains information about the scatteringprocess and the initial electron wave packet after tunneling.Encouraged by these observations we further developed strong-field photoelec-tron spectroscopy and used it to study dynamics in atoms and molecules basedon LIED and photoelectron holography. A suitable tool to record a photoelec-tron spectrum is the velocity-map imaging spectrometer (VMIS) [30, 31]. AVMIS uses electrostatic lenses to guide the photoelectrons onto a position sen-sitive detector. In analogy with an optical lens where the transmissive objectplaced in the focus in front of the lens and the image obtained in the focusbehind the lens are related through a Fourier transformation, the electrostatic

4 CHAPTER 1
lenses generate a velocity map image (or momentum distribution spectrum) ofthe photoelectrons on the detector. However, this also works for ions which isa real opportunity because ionization can also lead to the fragmentation of themolecule. With a VMIS one can thus study electronic structure and dynam-ics of molecules or atoms based on the angle-resolved momentum distributionspectrum of photoelectrons and ions.
1.1 Outline of this Thesis
The thesis starts with the description of the VMIS and the laser system. Inthe subsequent chapters the results of four different experiments are presented.Each of these chapters contains a short introduction followed by the specificexperimental details. The chapters also contain further information which isnecessary for the interpretation of the results. After the discussion of theresults the chapters end with a conclusion. The content of the chapters are:
Chapter 3 In this chapter the result of a pump-probe experiment is presentedwhere a mixed rotational-electronic wave packet in NO was measuredusing angle-resolved momentum spectroscopy of the photoelectrons.
Chapter 4 Motivated by theoretical results which predict a difference of theionization rate of H2 and D2 caused by different nuclear dynamics wehave studied the ionization and dissociation rate of H2, D2, CH4 andCD4 by means of ion time-of-flight spectroscopy.
Chapter 5 In this chapter the angle-resolved photoelectron momentum dis-tribution spectra of H2, D2, CH4 and CD4 are presented and compared.The spectra were recorded for laser pulses with a center wavelength of800 nm and 1800 nm. The goal was to observe sub-femtosecond nucleardynamics using LIED.
Chapter 6 Based on the angle-resolved momentum distribution of positively-charged fragments from methyl halides we have studied the angular de-pendence of the tunneling ionization.
This thesis ends with a general conclusion together with an outlook on futureexperiments and improvements.

Chapter 2
Spectrometer and LaserSystem
This chapter describes the spectrometer and the laser system. Specific ex-perimental details are given in the subsequent chapters where the results arepresented and discussed. The design and setup of the spectrometer was onepart of this thesis. Because it was also planned to use the VMIS for pump-probe experiments with ultrashort XUV pulses, it had to fulfill some specialrequirements. XUV pulses cannot be transmitted through air and the re-flection on surfaces leads to intensity losses. Therefore, XUV pump-probeexperiments are often complex. It is thus a great advantage if the connectedspectrometer can be easily adapted to the output of the XUV setup. Besidesvelocity map imaging of electrons and ions it should also be possible to mea-sure ion time-of-flight spectra with the spectrometer. Additionally, we wantedto be able to adjust the temperature and density of the sample gas in theinteraction volume.
2.1 The Spectrometer
A simplified depiction of the spectrometer is given in figure 2.1. The con-figuration of the electrostatic lenses was identical to the setup introduced byEppink and Parker [31]. Cold molecules and atoms were formed by supersonicbeam expansion. Therefore, either a pulsed valve or a leak valve was used.The gas jet entered the electrostatic lens system through a small hole in thefirst plate of the lens system. To reduce the gas load in the flight tube thevacuum chamber was separated by a plate into two sections. Each section waspumped individually by a turbomolecular pump. On a common axis with thevalve and the lens system a skimmer was mounted on top of the plate. Thetemperature and the density of the gas could be reduced by increasing thedistance between the valve and the focus where the molecules or atoms were
5

6 CHAPTER 2
fs laser pulse
ion/electroncloud
camera
sliderturbomolecularpump
turbomolecularpump
valve
skimmer
detector
window
window windowe-lenssystem
oscilloscope
time-of-flight signal
Figure 2.1: Simplified depiction of the VMIS. Details are given in the text.
ionized by an intense laser beam. Through the static electric field of the lenssystem either the electrons or the ions were accelerated towards the detector,depending on the sign of the voltage applied to the lenses. The arrival of anion or an electron at the detector triggered an avalanche of electrons whichfinally hit a phosphor screen. The light emitted from the screen at the positionof the event was collected by a camera mounted outside the vacuum cham-ber. Additionally, one could read out the electronic response of the detectorand record it with an oscilloscope. In this way it was possible to measure iontime-of-flight spectra. In the following subsections detailed information aboutthe main parts of the spectrometer will be given.
2.1.1 Vacuum Chamber
The final design of the vacuum chamber is shown in figure 2.2. The custom-made chamber was 80 cm high and had an inner diameter of 20 cm. To achieveultra-high vacuum (UHV) all flanges were ConFlat (CF) flanges which use cop-per rings as gaskets. The chamber was vertically mounted on a metal frame(see figure 2.4). The height of the spectrometer including the metal frame was∼ 200 cm. Without the electronic devices the spectrometer occupied an areaof one square meter. All components which were inside the vacuum chamberwere either connected to the top or bottom flange (NW200CF). Only the mir-ror mount was fixed on an additional tube (NW100CF, 13 cm tube length)which could be connected to the flange opposite to the laser input flange(NW100CF). With the mirror mount inside the vacuum chamber it was possi-ble to use mirrors with focal lengths between 75 mm and 200 mm. Mirrors with

SPECTROMETER AND LASER SYSTEM 7
top flangeassembly
connectionflanges forturbomolecularpumps
bottom flangeassembly
connectionflanges forpressuregauges
tube withmirror mount
laser inputflange
detector
valve mount
e-lens
laser input
chamber mounting bracket extension boardmounting bracket
Figure 2.2: Different views of the spectrometer. The spectrometer was verti-cally mounted on a metal frame. All elements which were inside the chamberwere connected with the top or bottom flange except for the mirror mount.
a longer focal length were mounted outside the chamber. In this case the tubewas replaced with a window. A detailed image of the tube with mirror mountis given in figure 2.3. A zero-length reducer (NW100CF, NW35CF) togetherwith a window (NW35CF) was connected to the laser input flange. Usuallysapphire windows with a clear aperture of > 2 cm and a thickness of 2 mm or2.5 mm were used. Optical elements which had to be placed close to the VMISwere mounted on an extension board (40 cm x 40 cm) which was attached di-rectly to the chamber. The vacuum in the chamber was maintained by twoturbomolecular pumps (Pfeiffer TPH 450H). The pumping speed was 450l/min each. For the pre-vacuum an oil-free scroll pump (Varian TriScroll
300) with a pumping speed of 210 l/min was used. Without gas load thepressure in the spectrometer reached 10−8 mbar. The pressure of the pre-vacuum was between 3 · 10−2 mbar and 5 · 10−2 mbar. The pressure inside thechamber was first measured with two full range gauges (Pfeiffer PKR 251
in combination with the control unit Pfeiffer TPG 256A). These cold cath-ode gauges use magnets and although the magnets and the flight tube were

8 CHAPTER 2
mirror mount
mounting rail
Figure 2.3: Tube (NW100CF) with mirror mount for mirrors with a diameterof one inch. Mirrors with a focal length between 75 mm and 200 mm couldbe mounted inside the vacuum chamber.
shielded with permalloy we could observe small aberrations of the velocitymap images due to the magnetic field. Therefore, the two gauges were re-placed by hot filament gauges (Kurt J. Lesker KJLC 354) without magnets.The pre-vacuum was measured directly behind the two turbo pumps and atthe differentially pumped linear motion feedthrough with three Pirani gauges(Pfeiffer TPR 280). The gauge control unit (Pfeiffer TPG 256A) was alsoconnected to the measurement computer to monitor the pressure inside thevacuum chamber during the measurements.
2.1.2 Top Flange Assembly
The complete top flange assembly is shown in the figures 2.5(a)-(d). Thelower part of the manipulator (blue component in the figures 2.5(a) and (b),Thermionics Northwest Inc., EC-B275C-T275T-1.39-2) was directly con-nected to the flange. The upper part of the manipulator could be movedalong the x, y and z axis. A double-sided flange (NW35CF) with a weldedtube (green part in figure 2.5(a) and (b)) was connected to this part of the ma-nipulator. The tube went through the welded bellow and ended ∼ 7 cm belowthe main flange. All mechanical parts including the valve, the base plate withskimmer (Beam Dynamics Model A, 1 mm orifice) and the electrostatic lenssystem were connected to this tube. In this way the center of the lens systemcould be easily adjusted to the focus of the beam. The electrostatic lens systemwas fixed on the lower side of the base plate. A detailed description of the lenssystem will be given in the next section. The base plate had a diameter of 180mm and in the center a hole with a diameter of 30 mm. If the skimmer wasused this hole was covered by the skimmer holder. Two UHV compatible ac-tuators (Newport Ultra-High Vacuum Picomotor Actuator 8301-UHV and
8302-UHV) were used to adjust the position of the skimmer and to move it inand out (see figure 2.5(c) and (d)). The base plate separated the chamber intwo parts. To reduce diffusion of the gas through the gap between the cham-

SPECTROMETER AND LASER SYSTEM 9
turbomolecularpumps
top flangeassembly
bottom flangeassembly
tube withinternalmirror mount
samplegas supplysystem
metall frame
controlunit
CCD camera
Figure 2.4: Picture of the VMIS with the control unit and sample gas supplysystem.
ber wall and the base plate a separation tube (olive green component in figure2.5(c) and (d)) sat loose on the brim of the base plate. The tube had an outerdiameter of 196 mm and was 55 mm in height. With the separation tube apressure ratio in the order of 100:1 between the compartment of the valve andthat of the lens system could be maintained without losing the ability of freelypositioning the lens system. Three rods connected the base plate with the endof the tube which was in turn connected to the manipulator. The valve systemwas mounted on a sliding assembly which was guided by the three rods. Ei-ther a leak valve (Lenox Laser, 10µm orifice) or a pulsed valve (Even-Lavievalve, 1 kHz repetition rate, 150 µm orifice) were connected to the slidingassembly. With a differentially pumped linear motion feedthrough (Allectra613-RLD200-DP-C40, depicted as red rod and black flange in the figures 2.5(a)and (b)) the z position of the sliding assembly was adjusted from outside.Two 40 kV and two 10 kV high-voltage (HV) feedthroughs were welded in thetop flange for the connection of the electrostatic lenses. The flange had alsothree NW35CF ports which were used to connect additional electrical and gasfeedthroughs.

10 CHAPTER 2
electrostaticlens system
valve
skimmerUHV compatibleactuators
skimmermount
xyz manipulator
slider
linear motion feedthrough
a) b) c) d)
separation tube
baseplate
separation tube
Figure 2.5: (a)-(d) Different views of the top flange assembly. The electrostaticlens system, the skimmer and the valve were moved together with the xyzmanipulator. The distance between the valve and the skimmer was adjustedwith an additional manipulator. Two UHV compatible actuators were used toposition the skimmer. If the skimmer was not used it was pushed away fromthe center by the help of the actuators (c).
2.1.3 Electrostatic Lens System
A dimensioned sectional drawing of the lens system and the flight tube is shownin figure 2.6. The electrostatic lens system consisted of the repeller, extractorand ground plate. The diameter of the plates was 76 mm. The skimmed gaspulse entered the lens system through a small hole (4 mm diameter) in thecenter of the repeller plate. To reduce field inhomogeneities due to the holethe repeller plate were cone shaped. The distance between the repeller andextractor plate was 17.8 mm. The extractor plate had a concentric hole witha diameter of 20 mm. The thickness of the plate was 1 mm. The dimensionsof the ground plate were identical to the extractor plate. The two plates wereseparated by a distance of 30 mm. The distance between the point wherethe gas was ionized and the detector was ∼ 308 mm depending on the exactposition of the lens system. The flight tube was shielded by two permalloytubes. The wall thickness of the tubes was 2 mm. The inner diameter ofthe smaller tube was 80 mm whereas the larger permalloy tube had an innerdiameter of 104 mm. The active area of the detector had a diameter of 75 mm.For the sake of clarity the spacers placed between the electrodes are not shownin figure 2.6. A different view of the complete electrode assembly including the

SPECTROMETER AND LASER SYSTEM 11
76
valve
skimmer
repeller plate extractor plate ground plate
magnetic shield
detector
laser
20
1
4
17.8
306
9
2
308
78flight tube
Figure 2.6: Dimensioned sectional drawing of the lens system and the flighttube. All dimensions in the drawing are given in millimeters.
a) b)
repeller plate
extractor plate
ground plate
Figure 2.7: 3D view of the electrostatic lens system assembly. The spacersin green were made from polyether ether ketone (PEEK). The electrode stackwas kept together by three screws which passed through the spacers.
spacers is given in figure 2.7. The spacers (green parts in figure 2.7) were madefrom polyether ether ketone (PEEK). The electrode stack was kept together bythree screws inside the spacers. The ground plate was electrically connectedthrough these screws to the chamber keeping the electrical potential of theplate at zero. The repeller and extractor plates were connected with kaptonisolated wires to the high voltage feedthroughs which were welded in the topflange. When a positive voltage was applied to the repeller and extractor platethe ions which were generated in the laser focus were accelerated towards thedetector whereas for negative voltages only the electrons left the lens systemin the direction of the detector. By adjusting the voltage ratio between thetwo plates one could change the imaging properties of the lens system. Ifthe two voltages were identical one obtained an image of the spatial charge

12 CHAPTER 2
distribution in the focus (spatial imaging mode) on the detector. However,if the ratio between the extractor and repeller voltage was 0.81 one obtaineda momentum distribution image (velocity map imaging mode). The electrontrajectories for this case are depicted in figure 2.8(a). The trajectories werecalculated using SIMION 8.0. The electrons with energies of 0 eV (blacktraces), 2 eV (red traces), 4 eV (green traces) and 6 eV (blue traces) werereleased in the focus. The voltages of the repeller and extractor plate were setto -5 kV and -4.05 kV, respectively. For all electrons the initial velocity vectorpointed in positive z direction whereas the z position was varied (z = −2, . . . , 2mm). Although the starting position was different, all electrons with the sameenergy were focused onto the same spot on the detector. A figure of merit forthe quality of the imaging property is the ratio ∆E/E where ∆E correspondsto the full width at half maximum of the spot on which electrons with energyE are imaged. In figure 2.8(b) ∆E/E as a function of the energy is shown.The red line indicates the measured resolution which was calculated based onthe spectrum shown in figure 2.11(b). The spectrum was obtained from xenonionized by a 400-nm pulse. The measured resolution for an energy of 2 eVwas only 0.26. However, the width of the rings in figure 2.11(b) was mainlydefined by the spectral width of the 400-nm laser pulse and the geometry ofthe laser focus and not by the resolution of the VMIS. For comparison, theresult obtained from SIMION simulations were also plotted in figure 2.8(b) forelectrons with an energy distribution width of 0.35 eV (blue line) and 0.1 eV(green line). For the two calculations the repeller plate was kept at -5.00 kVand the extractor plate at -4.05 kV (identical to the experimental conditions).The electrons were released within a sphere with radius 0.5 mm on the axisof the lens system between the repeller and extractor plate. The obtainedresolution for an energy distribution of 0.35 eV (blue line) was close to theexperimental result. For an energy distribution of 0.1 eV the resolution was∆E/E = 0.06 at E = 2 eV which shows that the imaging properties of theVMIS were sufficient. For a repeller voltage of -5 kV electrons with a maximalkinetic energy of 40 eV were focused on the detector. Usually -10 kV wereapplied which means that electrons with energies up to 80 eV were detected.Electrical breakdowns were observed for voltages above -15 kV. Due to safetyreasons voltages higher than -20 kV were not applied. For the experimentstwo Spellman RHSR10PN60/BPS/FG/220 (±10 kV) high-voltage (HV) powersupplies were used. The resolution of the VMIS in the time-of-flight modeis given in figure 2.8(c). It shows the width of the TOF signal ∆m/q for agiven mass-to-charge ratio m/q. For m/q = 77 ∆m/q becomes one whichmeans that two peaks which differ by m/q = 1 could be clearly resolved upto m/q = 77. For higher mass-to-charge ratio the peaks started to overlap.In the time-of-flight mode the resolution was limited by the response of thedetector.

SPECTROMETER AND LASER SYSTEM 13
a)
zy
Energy (eV)
∆E/E
b)
2 4 6 8 10 120
0.1
0.2
0.3
m/q∆m
/q
c)
0 50 1000
0.5
1
1.5
2
VR VE V0
Edetector
0 eV2 eV4 eV6 eV
magnetic shields
electron trajectories
Figure 2.8: (a) Trajectories of electrons with an energy of 0 eV (black), 2 eV(red), 4 eV (green) and 6 eV (blue). The starting position varied betweenz = 2 mm and z = −2 mm. All electrons started with a momentum pointingparallel to the z axis. (b) ∆E/E as a function of the electron energy E.The red line represents the experimental result. The blue and green lines werecalculated for an initial energy distribution of 0.35 eV and 0.1 eV, respectively.(c) Measured peak width of an ion time-of-flight spectrum as a function of themass-to-charge ratio.
2.1.4 Bottom Flange Assembly
The permalloy tubes and the detector were mounted concentric on a zero-length reducer flange (NW200CF to NW100CF). On the opposite side a stan-dard glass view port (NW100CF) with a view diameter of 90 mm was con-nected. Additionally four rods were attached to the flange. They were usedto fix the camera mount. The distance between the camera mount and theflange was on the order of 20 cm. Three HV feedthroughs were directly weldedinto the zero-length reducer flange to connect the chevron microchannel platedetector (MCP) to the HV power supplies. The MCP detector was manu-factured by Photonis. The diameter of the active area of the MCP detectorwas 75 mm. The pore size was 10 µm, the center-to-center spacing 12 µmand the bias angle 8◦ ± 1◦. The thickness of the two MCP plates togetherwas 1.2 mm. The maximum electron gain was 107 at 2400 V. The detectorassembly contained a P20 phosphor screen. For electron and ion imaging thephosphor screen was kept at +3300 V. To image electrons the input of the

14 CHAPTER 2
high voltagefeedthroughs
magnetic shields
camera mountmicrochannel platedetector
viewport
Figure 2.9: Different views of the bottom flange assembly. The permalloytubes and the microchannel plate detector were mounted on top of the flange.The camera mount was fixed with four rods to the outer side of the flange.
MCP assembly (front plate of the MCP) was connected to ground whereasa positive voltage between +1000 V and +2000 V was applied to the output(rear plate of the MCP). To image positive ions the output of the MCP wasconnected to ground and a negative voltage was applied to the input. How-ever, to restrict the measurement to ions with a selected mass-to-charge ratioit was necessary to switch the input voltage such that the MCP was only ac-tive at the arrival time of the ions. A home build fast HV switch was used forthis purpose. This device was able to switch the output voltage between twoinput voltage levels. The response of the output is shown in figure 2.10 foran input trigger signal with pulse lengths of 200 ns (black line), 100 ns (greenline), 75 ns (blue line) and 50 ns (red line). For the measurement 700 V and1500 V were applied to the two HV inputs. It was not necessary to switchthe MCP input between 0 V and 1500 V because the MCP was not active ifthe input voltage was below 1000 V. The rise time of the HV switch outputvoltage was 100 ns. For trigger pulses shorter than 75 ns the output voltagedid not exceed 1000 V which means that the MCP stayed inactive. For themeasurement of ions the HV switch was essential. However, the switch wasalso used to measure photoelectrons in order to reduce the background signalof secondary electrons. For the experiments three HV power supplies wereused (Stanford Research Systems PS 350, ±5 kV). One was connected tothe phosphor screen the others were used for the HV switch. A digital delaygenerator (Stanford Research Systems DG645) was used for the distributionof the laser trigger signal. The HV switch and valve driver were connectedto this device. Images of the phosphor screen were acquired with a charge-coupled device (CCD) camera (PCO Sensicam, 1280x1024 pixel resolution, 12bit dynamic range, quantum efficiency up to 60%) in combination with a fixedfocal length objective (Thorlabs MVL16M23, 16 mm focal length, f/1.4 aper-ture). The time-of-flight signal was tapped from the MCP input. A home-built

SPECTROMETER AND LASER SYSTEM 15
Time (µs)
Am
plitu
de (V
)
0 0.1 0.2 0.3 0.4 0.5 0.6600
800
1000
1200
1400
1600
Figure 2.10: Output signal of the HV switch for input trigger pulses with pulselengths of 200 ns (black line), 100 ns (green line), 75 ns (blue line) and 50 ns(red line). For the measurement 700 V and 1500 V were applied to the twoHV inputs of the switch.
amplifier with an amplification of 33 and a band width of 410 MHz was usedto amplify the AC signal which was then recorded by the oscilloscope (LeCroyWaveJet 354A, digital oscilloscope, 500 MHz band width, 2 GS/s). The bandwidth of the amplifier and the oscilloscope were sufficient to resolve peaks witha full width at half maximum (FWHM) of ∼ 2 ns. However, the FWHM of asingle peak in the TOF spectrum was ∼ 30 ns. The reason for that was thehigh capacity (∼ 50 pF) of the MCP itself. Together with the amplifier theMCP corresponded to a RC-element with a band width of only ∼ 30 MHz.This was the reason for the limited mass resolution (see figure 2.8(c)).
2.1.5 Image Processing
The two-dimensional (2D) image obtained from the VMIS represents a projec-tion of the three-dimensional (3D) photoelectron momentum distribution spec-trum. For linear polarization the 3D photoelectron spectrum has a cylindricalsymmetry along the laser polarization axis. Therefore, the 3D distributionis fully described by f(pr, pz) where pz and pr correspond to the momentumparallel and perpendicular to the polarization axis, respectively. The 2D dis-tribution on the detector g(px, pz) is related with the 3D distribution by anAbel integral [32], i.e.
g(px, pz) = 2
∫ ∞
|px|
prf(pr, pz)√p2
r − p2x
dpr ≡ A {f(pr, pz)} . (2.1)
To obtain f(pr, pz) from g(px, pz) the inverse of equation 2.1 has to be solved.However, this is a non-trivial task and therefore an iterative inversion methodwas used where only the functional A appears. The method is closely relatedto the procedure developed by M. Vrakking [33]. The procedure starts with

16 CHAPTER 2
px (a.u.)
p z (a.u
.)a)
−1 0 1−1.5
−1
−0.5
0
0.5
1
1.5
pr (a.u.)
p z (a.u
.)
b)
−1 0 1−1.5
−1
−0.5
0
0.5
1
1.5
Yie
ld (a
rb. u
.)
0
0.2
0.4
0.6
0.8
1
Figure 2.11: (a) Electron image obtained from xenon ionized by a 400-nmpulse. The laser peak intensity was (3±1) ·1013 W/cm2. (b) Abel-inversion ofthe image shown in (a) obtained with the iterative inversion method explainedin the text.
the Ansatz given in equation 2.2. Then equation 2.3 is solved iteratively untilthe difference between the measured projection g(px, pz) and the calculatedprojection A {f(pr, pz)} is small. The parameter c in equation 2.3 correspondsto the correction amplitude.
f0(pr, pz) = g(px, pz) (2.2)
fi(pr, pz) = fi−1(pr, pz) + c (g(px, pz)−A {fi−1(pr, pz)}) (2.3)
An example of the inversion is given in figure 2.11. The 2D spectrum (rawimage) g(px, pz) obtained from xenon multiphoton-ionized by a 400-nm laserpulse is shown in figure 2.11(a) and the retrieved 3D spectrum is given infigure 2.11(b). This iterative inversion procedure leads to the accumulation ofnoise along the symmetry axis of the spectrum.
2.2 The Laser System
The laser used for the experiments was a Legend Elite Duo USX 1K HE lasersystem from Coherent. The system contained a Coherent Micra-5 Tita-nium:sapphire laser oscillator system which produced mode-locked pulses withbandwidths of 100 nm at a center wavelength of 800 nm. The repetition ratewas 80 MHz. The energy per pulse was on the order of 6 nJ. The outputof the Micra-5 passed first the stretcher before it entered the regenerativeamplifier which was pumped by a Coherent Evolution-30 diode-pumped,intra-cavity doubled, Q-switched Nd:YLF laser with a repetition rate of 1 kHzat 527 nm. The pulse energy of the Coherent Evolution-30 exceeded 20mJ. After the regenerative amplifier the pulses had an energy of 3.3 mJ at a

SPECTROMETER AND LASER SYSTEM 17
Wavelength (nm)
Inte
nsity
(arb
. u.)
a)
700 800 9000
0.5
1
Time (fs)
Am
plitu
de (a
rb. u
.)
b)
−100 0 1000
0.5
1
38 fs
Figure 2.12: (a) Spectrum of the laser output. (b) Pulse shape retrieved froma FROG measurement (blue line). The full width at half maximum of theGaussian fit (red line) is 38 fs.
repetition rate of 1 kHz. The pulses were further amplified in a single-pathamplifier stage which was pumped by a Coherent Evolution HE laser systemwhich was similar to the Coherent Evolution-30 laser system except thatthe pulse energy was 38 mJ. After the single-pass amplifier stage pulse ener-gies of 11 mJ were measured. After passing the compressor the pulses had anenergy of 8 mJ and a pulse length of 38 femtoseconds. A typical spectrumof the laser output is shown in figure 2.12(a). The pulse shape which wasretrieved from a frequency-resolved optical-gating (FROG) measurement isshown in figure 2.12(b). Additionally, an optical parametric amplifier (LightConversion HE-TOPAS-C) was used for some experiments. With the opticalparametric amplifier (OPA) it was possible to shift the center wavelength ofthe laser output to a wavelength between 1160 nm and 2580 nm. The conver-sion efficiency into signal or idler beams was between 5% and 25% dependingon the output wavelength. For a reliable operation of the OPA a pulse energyof 6.5 mJ at the input was required.

18 CHAPTER 2

Chapter 3
Electronic and RotationalWave Packets in Nitric Oxide
The observation of electronic coherence in molecules was one of the main goalsof this thesis. In this chapter an experiment is presented where an electronwave packet was examined by means of angle-resolved photoelectron spec-troscopy. The chapter starts with a short introduction summarizing resultsobtained by high-harmonic spectroscopy. In the subsequent sections the spe-cific experimental details will be explained followed by the presentation anddiscussion of the results. The chapter closes with a summary of the conclu-sions.
3.1 Introduction
Different previous experiments have shown that momentum-resolved photo-electron spectroscopy is a suitable tool to gain insights into electronic or nu-clear structure of atoms or molecules [24–26, 34]. In the angle- and energy-resolved photoelectron spectra the high-energy electrons have rescattered fromthe parent cation. Their angular distribution is directly related to the elasticdifferential electron scattering cross section of the target ion [8, 35]. Fur-thermore, also holographic patterns were observed. They were assigned tosub-laser-cycle time scale electron dynamics [27]. On the basis of this knowl-edge we have investigated an electron wave packet in nitric oxide. This wasfirst observed by means of high-harmonic spectroscopy [13] where an electronicwave packet was prepared by a first pulse through stimulated Raman scatter-ing. The subsequent probe pulse generated high-order harmonics which wereanalyzed with a spectrometer. The signal, integrated over the harmonic 9 to23 as function of the pump-probe delay (figure 3.1(a)), showed a modulationwith a period of T = 275± 3 fs. This was in agreement with the energy levelsplitting of the two low-lying electronic states 2Π1/2 and 2Π3/2 of NO whichare separated by ∼ 120 cm−1. In the limit of a low total angular momentum
19

20 CHAPTER 3
Pump-probe delay (ps)
Hig
h-ha
rmon
ic in
tens
ity (a
rb. u
.)
a) b)
∆t/T
0
1/4
1/2
3/4
1
spin state
Σ=+½ Σ=-½x
y
Figure 3.1: (a) High-harmonic intensity integrated over the harmonic orders9 to 23 as function of the pump-probe delay. The signal between 1 and 2 psmodulated with a period of T = 275 ± 3 fs. (b) Temporal evolution of theelectron density of the wave packet for the two spin states Σ = ±1/2. Figureadapted from [13].
J = L + S +R, where L stands for the total orbital angular momentum, Sthe total electron spin and R the angular momentum of the rotating nuclei,the wave packet
∣∣Ψ+(t)⟩
=1√2
(∣∣2Π1/2
⟩+∣∣2Π3/2
⟩e−i∆Et/h
)(3.1)
=1√2
((∣∣π+β⟩
+∣∣π−α
⟩)+(∣∣π+α
⟩+∣∣π−β
⟩)e−i∆Et/h
)(3.2)
can be expressed as a coherent superposition of the 2Π1/2 and 2Π3/2 states.For brevity only the wave function with positive parity is considered. For thestate with negative parity one would obtain a similar result. Equation 3.2 canbe factorized into the spin parts α and β and one obtains
∣∣Ψ+(t)⟩
=1√2
(|α〉 (
∣∣π−⟩
+∣∣π+
⟩e−i∆Et/h)
+ |β〉 (∣∣π+
⟩+∣∣π−
⟩e−i∆Et/h)
)(3.3)
where |π±〉 = |πx〉 ± i |πy〉. The spatial wave functions |πx〉 and |πy〉 representthe real-valued molecular orbitals which lie in the xy or yz plane, respec-tively. One can show that the two spin parts of equation 3.3 correspond totwo counter-rotating currents that rotate around the molecular axis. This isillustrated in figure 3.1(b) where the time evolution of the electron density|Ψ+(t)|2 is shown. Whether and how this wave packet influences the photo-electron momentum distribution was subject of this experiment and will bediscussed after the section about the experimental details.

WAVE PACKETS IN NITRIC OXIDE 21
WP 2
Laser
WP 1
VMIS
BS 1BS 2
SF
M 1
M 2
M 3M 4
L 1L 2
L 3
M 6M 5TS
Figure 3.2: Sketch of the optical setup which was used for the two-pulse experi-ments. The abbreviations stand for: half-wave plate (WP), beam splitter (BS),mirror (M), translation stage (TS), lens (L), SF11 window (SF), velocity-mapimaging spectrometer (VMIS).
3.2 Experimental Details
The setup, built for the two pulse experiments, is depicted in figure 3.2. Theoutput of the laser with a center wavelength of 800 nm and a beam waist of4.2 mm was split by a 50:50 beam splitter (BS1) into a pump and a probebeam. To increase the efficiency of the Raman transition, the pump pulse wasstretched in time by a 3 mm thick SF11 window (SF). Further, the initial beamwaist of the pump beam was reduced with a telescope (L1, L2) by a factorof 1.25 in order to increase the size of the focus of the pump beam inside theVMIS with respect to the size of the probe beam. With a second 50:50 beamsplitter (BS2) the pump beam was then recombined with the probe beam.The time delay between the two pulses was adjusted by changing the pathlength of the probe pulse. Therefore, two mirrors (M5 and M6) were mountedon a linear translation stage (TS; controller: Newport ESP 100; translationstage: Newport UTM100PP.1 with a resolution of 100 nm). Finally, the laserwas focused with a thin lens (f = 400 mm) into the VMIS. Typical intensitiesand pulse lengths of the pump and probe beams were (1.2±0.2) ·1014 W/cm2
and 145 ± 2 fs, respectively (2.3 ± 0.1) · 1014 W/cm2 and 35 ± 2 fs. A cross-correlation scan of both pulses is shown in figure 3.3(a). For the experimenta mixture of 1% NO in helium was prepared and injected into the VMIS with

22 CHAPTER 3
Time (ps)
Nor
m. e
lect
ron
yiel
d
a)
−0.1 −0.05 0 0.05 0.1
0.95
1
1.05
1.1
m/q
Nor
m. i
on y
ield
b)
50 100 1500
0.2
0.4
0.6
0.8
1
Figure 3.3: (a) The blue line shows the normalized total photoelectron yieldof a cross-correlation scan of the pump and probe pulses. The envelopingGaussian function has a full-width at half maximum of 105 fs. (b) Ion time-of-flight measurement of the He/NO/Xe mixture. Fragments or multiply-chargedparent ions of NO were not observed at the given intensities whereas very littleXe2+ ions were detected (small peak m/q ≈ 66) besides the Xe+ signal.
an Even-Lavie valve (orifice ø150 µm). A skimmer (1 mm orifice) was usedto increase the cooling efficiency of the gas jet. The distance between thenozzle and the skimmer was 5 cm. For the ion TOF measurement a smallamount of xenon (less than 1%) was added to the gas mixture to use the Xe+
ion signal as an internal reference. Figure 3.3(b) shows a typical ion TOFspectrum. For the given intensities neither multiply-charged parent ions norcharged fragments of NO were observed. In case of xenon very little Xe2+ ionswere detected in addition to the Xe+ ions.
3.3 Results
3.3.1 Ion Time-of-flight Measurement
Figure 3.4(a) shows the ion yield of NO+ as a function of the pump-probedelay. A modulation of the signal cannot be recognized at first glance. As acomparison, the ion yield of Xe+, measured at the same time as the NO+ yield,is given in figure 3.4(b). In contrast to NO the pump pulse does not excitean electron wave packet in xenon. Therefore, the Xe+ signal directly reflectedthe fluctuations resulting from the highly nonlinear laser-induced strong-fieldionization and gas-jet instabilities which, together, were on the order of 15%to 20%. By using the xenon signal as an internal reference to normalize theNO+-yield, the fluctuations could be reduced dramatically. This was done inorder to obtain figure 3.4(c) where the ratio between the NO+ and the Xe+

WAVE PACKETS IN NITRIC OXIDE 23
Time delay (ps)
Nor
m. N
O+ y
ield
a)
2 4 6 8 10 12 14 16 180.9
1
1.1
Time delay (ps)
Nor
m. X
e+ y
ield
b)
2 4 6 8 10 12 14 16 180.9
1
1.1
Time delay (ps)
Rat
io r
c)
2 4 6 8 10 12 14 16 18
0.95
1
1.05
Figure 3.4: For the ion time-of-flight measurements a gas mixture with 1%NO and <1% xenon in helium was used. The ion yield of NO+ and Xe+ fordifferent pump-probe delays is shown in (a) and (b), respectively. The ratioof the two yields is given in (c).
signal
r =nNO+
nXe+, (3.4)
where nNO+ (nXe+) stands for the normalized NO+ (Xe+) yield, is depicted.The ratio r shows a modulation with a period of 277±3 fs whereas the modu-lation amplitude decreases for increasing pump-probe delays. Further, dips at5, 10 and 15 picoseconds can be identified. From the ion time-of-flight spec-trum (figure 3.3(b) it was known that for the given intensity only NO+ ionswere produced. For that reason the integrated NO+ yield was directly relatedwith the ionization rate of NO. The modulation of the yield and thus of theionization rate was a clear indication that a wave packet was indeed excitedby the pump pulse. More information was obtained from the power spectrumof the ratio r which is given in figure 3.5(a). In the spectrum a dominant peakat 120.5 cm−1 with an amplitude of 1.6% is visible. The amplitude of theother peaks are at least three times lower and from figure 3.5(a) it is difficultto evaluate whether they can be assigned to a transition or whether they are

24 CHAPTER 3
Wave number (cm−1)
Am
plitu
de 1
0−2
a)
0 20 40 60 80 100 120 140 160 1800
0.5
1
1.5
Wave number (cm−1)
Am
plitu
de 1
0−2
b)
5/2 7/2 9/2 11/2 13/2J"=
∆Jrot
= 25/2 7/2 9/2
∆Jrot
= 43/211/2
∆Jel
= −11/2 15/2
∆Jel
= 1
∆Jel
= 0
0 20 40 60 80 100 120 140 160 1800
1
2
Figure 3.5: (a) Fourier-transformed power spectrum of the ratio r. (b) Inter-polated spectrum of (a) with calculated peak positions. The interpolation wasintroduced by zero padding of the time-domain measurement.
just artefacts. Therefore, the spectrum was interpolated by zero-padding. Theresult is shown in figure 3.5(b) together with the labeled positions of rotationaland electronic-rotational transitions. The positions of these labels were cal-culated by solving the Schrodinger equation for a Hamiltonian including therotational motion as well as the spin-orbit interaction [13]. The eigenstates ofthis Hamiltonian are labeled F1 and F2 with the eigenenergies
EF1J = B
(J − 1
2
)(J +
3
2
)
−√B2
(J +
1
2
)2
+A(A− 4B)
4+A− 2B
2(3.5)
and
EF2J = B
(J − 1
2
)(J +
3
2
)
+
√B2
(J +
1
2
)2
+A(A− 4B)
4+A− 2B
2(3.6)
where J represents the total angular momentum quantum number, A =123.13 cm−1 the spin-orbit coupling constant and B = 1.6961 cm−1 theground-state rotational constant [13]. Note that for low J numbers F1 is dom-inated by the 2Π1/2 state and F2 by the 2Π3/2 state. From the eigenenergies

WAVE PACKETS IN NITRIC OXIDE 25
Wave number (cm−1)
Am
plitu
de
a)
0 50 100 1500
Time delay (ps)
Sig
nal
b)
5 10 15
0
Time delay (ps)
Sig
nal
c)
5 10 15
0
Time delay (ps)S
igna
l
d)
5 10 15
0
Figure 3.6: Signal analysis in the time domain. (a) Spectrum of the measuredratio r (blue) and of the filter functions W1 (red), W2 (green) and W3 (black).The processed signal is given in (b)-(d) after applying the filters W1, W2 orW3.
one obtains the transition energies
∆ErotJ ′′,∆J = EF1
J ′′+∆J − EF1J ′′ (3.7)
for pure rotational transitions or
∆EelJ ′′,∆J = EF2
J ′′+∆J − EF1J ′′ (3.8)
for mixed, electronic and rotational transitions. Using equation 3.8 the peakat 120.5 cm−1 could be assigned to a transition between the F1 and the F2
state for ∆Jel = 0. This was the proof that the pump-pulse created electroniccoherence between the 2Π1/2 ground state and the 2Π3/2 excited state. Butalso pure rotational coherence was observed. The corresponding peaks ap-pear in the spectrum around 40 cm−1 for ∆Jrot = 2 and around 80 cm−1 for∆Jrot = 4. Even mixed rotational-electronic coherences for ∆Jel = −1 and∆Jel = 1 occurred and led to peaks close to the peak at 120.5 cm−1. Withoutan interpolation of the spectrum it would have been difficult to assign thesmall peaks to certain transitions. But also the analysis in the time domainshowed that a rotational as well as an electronic wave packet was created bythe pump pulse. Therefore, the signal given in figure 3.4(c) was processedby applying three different filter functions. The filter functions are depictedin figure 3.6(a). By applying filter W1 (red line) the function given in figure

26 CHAPTER 3
S1
S2
S3
S4
S5
Time delay (ps)
Nor
m. t
otal
ele
ctro
n yi
eld
a)
1.55 1.6 1.65 1.7 1.75
1
1.005
1.01
1.015
1.02
p⊥ (a.u.)
p z (a.
u.)
b)
−1 0 1
−1.5
−1
−0.5
0
0.5
1
1.5
Yie
ld (
arb.
u.)
102
104
106
Figure 3.7: (a) Normalized total electron yield versus pump-probe delay. Theexact delays of the measured spectra were: ∆tS1 = 1.56 ps, ∆tS2 = 1.60 ps,∆tS3 = 1.64 ps, ∆tS4 = 1.68 and ∆tS5 = 1.72 ps. (b) Raw spectrum S1
measured at 1.56 ps. The spectrum is not Abel inverted and represents aprojection of the real momentum distribution.
3.6(b) was obtained. It shows clear revivals at 5, 10 and 15 ps which is charac-teristic for rotational coherence induced by impulsive laser alignment [36, 37].Using filter W2 (green line) one obtains the signal traces depicted in figure3.6(c). From the spectral analysis it was known that frequencies within thetransmission range of this filter correspond to rotational-electronic transitions.The revival of the signal around 9 ps in figure 3.4(c) and figure 3.6(c) was thusattributed to the mixed rotational-electronic wave packet [13]. Finally, figure3.6(d) shows the dephasing of the electronic wave packet which becomes visi-ble if W3 (black line) is applied. This filter removes everything except for thefrequencies which correspond to the ∆Jel = 0 transitions. Dephasing occursbecause the energy level splitting between two adjacent rotational levels in-creases with the quantum number J . By selecting the proper time interval it isthus possible to restrict the observation to a wave packet which is dominatedby the electronic or rotational coherence. In the next two sections the angu-lar resolved electron momentum distributions characterizing the two differenttypes of dynamics are presented.
3.3.2 Observation of the Electronic Coherence
The angle-resolved photoelectron momentum distributions were measured un-der the same conditions as the ion time-of-flight measurements. From the timedomain analysis of the normalized NO+ signal (see figure 3.6(b)-(d)) it wasknown that the optimal delay to observe the electronic coherence was between1 and 2 ps. In this time interval the electronic coherence is still large andthe molecular axis distribution varies very little. A temporal overlap of the

WAVE PACKETS IN NITRIC OXIDE 27
p⊥ (a.u.)
p z (a.
u.)
a)
−1 0 1
−1.5
−1
−0.5
0
0.5
1
1.5
px (a.u.)
p z (a.
u.)
b)
−1 0 1
−1.5
−1
−0.5
0
0.5
1
1.5
Nor
m. d
iffer
ence
0
0.01
0.02
0.03
0.04
0.05
0.06
0.07
Figure 3.8: Normalized difference D5(p) calculated from the raw spectra (a)and Abel inverted spectra (b) of S1 and S5.
pump and probe pulse could also be excluded (see figure 3.3). To obtain amaximal signal-to-noise ratio the electron spectra were recorded at only fivedifferent delays within a half-cycle of the electronic coherence. The total elec-tron yield of these spectra is shown in figure 3.7(a). To simplify the furtherdiscussion the spectra are labeled with Sn where n = 1 − 5. As an examplefigure 3.7(b) shows the raw spectrum S1. The delay at which the spectrum S1
and S5 were measured was chosen such that for S1 the electron yield was min-imal and for S5 maximal. The data acquisition took in total 24 hours duringwhich each spectrum was repeatedly measured. The total integration time ofa single spectrum was in the end close to 4 hours. The polarization vectors ofthe pump and probe beams were both parallel to pz. The modulation depthof the total electron yield was 2% which was slightly less than what was ex-pected from the NO+ ion yield measurement (modulation depth of ∼ 3%).The total modulation of the signal was further compared with the modulationof the electron yield as a function of the final momentum p. Therefore, thenormalized difference
D5(p) = 2S5(p)− S1(p)
S5(p) + S1(p)(3.9)
between S1(p) and S5(p) was calculated for the unprocessed spectra as wellas for the Abel inverted spectra. The result is depicted in figure 3.8(a) and3.8(b), respectively. For the normalized difference we find that D5(p) ≥ 0.Further, a strong dependence of the difference on p was observed. In figure3.8(a) the maximal normalized difference is ∼ 4.7% for electrons with a finalmomentum close to px = 0 and pz = ±1 a.u.. For |pz| > 1.4 a.u. the differ-

28 CHAPTER 3
ences are D5(p) ≤ 1%. Parallel to the main structure along pz one can alsoobserve side lobes. These structures are amplified in the normalized differenceimage of the inverted spectra (figure 3.8(b)). To obtain an optimal inversionof the initial spectra the constant background (due to camera dark countsand stray light) was removed. Furthermore, the spectra were symmetrized.These corrections enhanced the differences compared to figure 3.8(a). In thenormalized difference image of the inverted spectra the limit of the transversalmomentum |px| ≈ 1.3 a.u. is clearly visible.So far only the spectra measured at the minimum and maximum of the totalelectron yield function were compared and it remains to be verified whether thepattern changes its shape as a function of the pump-probe delay. Therefore,the normalized difference
Dn(p) = 2Sn(p)− S1(p)
Sn(p) + S1(p)(3.10)
between spectra measured at different delays were compared. In the figures3.9(a)-(d) Dn(p) is shown for n = 2 − 5. One can see that the pattern onlychanges in amplitude but not in shape. We have also performed measurementsover different and longer pump-probe delay ranges. All of them led to the sameconclusions. In summary, strong modulations could only be observed withina certain momentum range whereby the maximal modulation amplitude waslarger than the modulation amplitude of the total electron yield.Similar spike-like structures, known as photoelectron holography pattern, hadbeen observed in other experiments [27, 28, 38, 39] and were attributed tothe interference of scattered and unscattered photoelectrons. There are sev-eral indications that the observed pattern was the result of interfering electrontrajectories. But before these are discussed, a short introduction to photoelec-tron holography will be given starting with the time evolution of a one-electronwave function Ψ(t) in presence of a laser-induced interaction potential VL anda Coulomb potential VC. The exact wave function, starting with a boundinitial state Ψ(0), can be written as [27]
|Ψ(t)〉 =−∫ t
0dt0
∫ t
t0
dtrUV(t, tr)VC(tr)U(tr, t0)VL(t0)U0(t0, 0) |Ψ(0)〉
− i∫ t
0dt0UV(t, t0)VL(t0)U0(t0, 0) |Ψ(0)〉
+ U0(t, 0) |Ψ(0)〉 . (3.11)
At the beginning the electron is bound and the time evolution is given bythe field-free propagator U0. The first term in equation 3.11 describes thetime evolution of the rescattered photoelectron. At time t0 the interactionwith the field VL(t0) induces a transition to the continuum. Propagation ofthe continuum electron between the time t0 and tr under the action of the

WAVE PACKETS IN NITRIC OXIDE 29
px (a.u.)
p z (a.
u.)
a)
−1 0 1
−1
0
1
px (a.u.)
p z (a.
u.)
b)
−1 0 1
−1
0
1
px (a.u.)
p z (a.
u.)
c)
−1 0 1
−1
0
1
px (a.u.)
p z (a.
u.)
d)
−1 0 1
−1
0
1
Nor
m. d
iffer
ence
0
0.02
0.04
0.06
Figure 3.9: (a) - (d) Normalized difference Dn(p) for n = 2 − 5 calculatedfrom the Abel inverted spectra.
full propagator U(tr, t0) follows, where at tr the electron is scattered by theCoulomb potential VC(tr). At time t it finally reaches the detector. Betweenthe time tr and t the propagation is described by UV(t, tr) which only includesthe potential of the laser field. The second term of equation 3.11 representsthe unscattered photoelectron. Again, the electron is bound until ionizationoccurs at t0 through the laser field VL(t0), followed by the propagation to thedetector under the action of UV(t, t0). The last term of equation 3.11 describesthe time evolution of the residual bound-state wave function. In brief, the wavefunction of the free electron can be written as the sum of a signal (scattered)wave function Ψsig and a reference (unscattered) wave function Ψref
Ψ = Ψsig + Ψref . (3.12)
The interference between Ψsig and Ψref leads to a holographic pattern in thephotoelectron spectrum. In reference [27] the interference pattern was ana-lyzed starting with equation 3.11 and using the strong-field and saddle-pointapproximations. In the following, a simplified picture based on the classicalrecollision three-step model, developed by Bian et al. [29], will be presented.Again, one starts at time t0 where the electron reaches the continuum throughtunneling ionization at a distance z(t0) = −Ip/E0 from the core. For the

30 CHAPTER 3
subsequent propagation in the laser field E(t) = zE0 cos(ωt) the influence ofthe Coulomb potential is neglected and the electron trajectories are calculatedbased on Newton’s equation of motion (in atomic units)
z(t) = −E0 cos(ωt). (3.13)
For the position of the electron at a later time t it follows [40]
z(t) = z(t0)+E0
ω2(cos(ωt)− cos(ωt0))+
(E0
ωsin(ωt0) + z(t0)
)(t−t0). (3.14)
The next assumption includes that the initial velocity parallel to the field isvz, sig(t0) = vz, ref = 0 for the scattered (signal) and unscattered (reference)electron. Additionally, the initial velocity of the scattered electron perpendic-ular to the electric field has to be vx, sig(t0) = 0. Otherwise the electron willnot return to the parent ion [5]. The time of the first return tr is thus relatedto the ionization time t0 by
cos(ωtr)− cos(ωt0) + ω sin(ωt0)(tr − t0)− γ2/2 = 0. (3.15)
where γ =√
2Ipω/E0 stands for the Keldysh parameter. Between the time t0and tr the velocity is given by
vz(t, t0) = −E0
ω(sin(ωt)− sin(ωt0)). (3.16)
At the moment when the signal electron returns to the parent ion it is elasti-cally scattered in the direction θ and one obtains for the final momentum atthe detector
pz, sig(tr, t0) =E0
ωsin(ωtr) + cos(θ)vz(tr, t0) (3.17)
parallel andpx, sig(tr, t0) = sin(θ)vz(tr, t0) (3.18)
perpendicular to the field where multiple scattering of the electron by thetarget was neglected and the vector potential A(t) is assumed to be zero atthe end of the pulse. Interference between the scattered signal electron andthe reference electron occurs only if both electrons have the same momentumdirectly after the scattering event. Therefore, the relation
vz, ref(tr, t′0) = cos(θ)vz(tr, t0), (3.19)
where t′0 stands for the ionization time of the reference electron, must bevalid. We further assume that the initial momentum distribution of vx, ref ofthe reference electron after tunneling ionization is larger compared to vx, sig sothat
vx, ref = vx, sig = sin(θ)vz, sig(tr, t0) (3.20)

WAVE PACKETS IN NITRIC OXIDE 31
is always true for all θ and t0. The phase difference between the signal andreference electron is then given by
∆Φ =
∫ tr
t0
v2z (τ, t0)
2dτ −
∫ tr
t′0
v2z (τ, t′0)
2dτ −
v2x, ref(tr − t′0)
2− Ip(t0 − t′0)
ω. (3.21)
In this equation t0 and θ are the independent variables. To obtain a phasedifference as a function of the final momentum additional restriction for t′0 hasto be introduced because different ionization times are associated with thesame final momentum. The restrictions are illustrated in the upper panel ofthe figures 3.10(a)-(d). In the first case t0 and t′0 are within the same quarter-cycle and only the forward scattered signal electrons will interfere with thereference electrons. This results in a holographic pattern depicted in the lowerpanel of figure 3.10(a) where cos(∆Φ) is plotted. For the second case thesignal electron is also forward-scattered but the reference electron is generatedwithin the next quarter-cycle. This gives than a ring pattern centered at zeromomentum which is shown in the lower panel of figure 3.10(b). In the thirdcase, the signal electron needs to be backscattered that interference with thereference electron generated within the third quarter-cycle can occur. Oneobtains the pattern given in the lower panel of figure 3.10(c). The last casewhere the signal electron is also backscattered and the reference electron isgenerated in the fourth quarter-cycle leads then to a wave pattern shown in thelower panel of figure 3.10(d). For the calculation of the holographic patternslaser parameters as given in section 3.2 for the probe pulse were used. Out ofthese four holographic patterns the one given in figure 3.10(a) is very similarto the pattern of the normalized difference D5(p). For comparison reasons themaxima and minima of the calculated holographic pattern is shown on top ofthe measured spectrum in figure 3.11. Both patterns have a wide lobe closeto px = 0 and narrow side-lobes but the position of the maxima and minimado not match. For the calculated pattern the distance between the extremalvalues are slightly larger. Both patterns end at pz ≈ 1.4 a.u.. This momentumcorresponds to a kinetic energy of 2Up where
Up =I
4ω2(3.22)
stands for the ponderomotive energy in atomic units of a free electron in a laserfield with intensity I and frequency ω. An electron which does not scatter atthe parent ion cannot hit the detector with more kinetic energy in averagethan 2Up and thus interference between a scattered and unscattered electroncan only occur below this limit. In figure 3.11 this limit is indicated by theblue horizontal line.In equation 3.20 the assumption was made that the initial momentum dis-tribution of the reference electron perpendicular to the tunneling direction

32 CHAPTER 3
2π
−1
0
1 a)
→ Sig→ Ref
E(t
)/E
0
2π
−1
0
1 b)
→ Sig
→ Ref2π
−1
0
1 c)
→ Sig
→ Ref2π
−1
0
1 d)
→ Sig→ Ref
ωt
p z (a.
u.)
px (a.u.)
−1 0 10
0.5
1
px (a.u.)
−1 0 10
0.5
1
px (a.u.)
−1 0 1
−1
−0.5
0
px (a.u.)
−1 0 1
−1
−0.5
0
cos(
∆Φ)
−1
−0.5
0
0.5
1
Figure 3.10: (a)-(d) In the upper panel the ionization time of the signal elec-tron t0 and the reference electron t′0 are illustrated. In the lower panel thecorresponding holographic pattern cos(∆Φ) calculated for the same laser pulseparameters as given in section 3.2 are shown. The figure is adapted for NOfrom reference [29]. However, until now we were not able to reproduce thestructure along px = 0 a.u. as observed in the holographic pattern (b)-(c)therein.
covers the whole range of the transversal momentum vx, sig of the signal elec-tron. Therefore, the holographic pattern shown in figure 3.10(a) goes frompx = −1.4 a.u. to px = 1.4 a.u. for pz = 0 a.u.. But in the measured spectrumthe pattern already ends at px ≈ ±0.5 a.u. although electrons with a lateralmomentum up to px = ±1.4 a.u. were detected. This is another evidencethat the observed pattern is caused by the interference of different electrontrajectories. To explain this, the transversal velocity distribution of the ref-erence wave packet after tunneling has to be taken into account. Within thetunneling approximation of strong-field ionization it is given by [41]
Ψ(p⊥) = Ψ(0) exp
(−p
2⊥τ0
2
)(3.23)
where τ0 =√
2Ip/E0 is the “tunneling time”. The wave packet has a Gaussiandependence on the transversal momentum p⊥. The 1/e2 half width of theexponential term in equation 3.23 is w = 2/
√τ0. If the electric field amplitude
E0 in the tunneling time is replaced by the instantaneous field at the ionization

WAVE PACKETS IN NITRIC OXIDE 33
√
4Up
px (a.u.)
p z (a.
u.)
−1.5 −1 −0.5 0 0.5 1 1.5
−1.5
−1
−0.5
0
0.5
1
1.5
Nor
m. d
iffer
ence
0
0.02
0.04
0.06
0.08
Figure 3.11: Normalized difference D5(p) together with the holographic pat-tern from figure 3.10(a). The black line shows w(t′0) and the blue line indicatesthe limit corresponding to the maximal kinetic energy of the direct electronsof 2Up.
time t′0 of the reference electron one obtains [42]
w(t′0) = 2
( √2Ip
E0 cos(ωt′0)
)− 12
. (3.24)
In figure 3.11 the width w(t′0), assuming an intensity of 2.3 · 1014 W/cm2, isindicated as solid black line and encloses the region of strong modulation. Itshows the maximal transversal momentum of an electron which has not scat-tered at the parent ion. Thus, outside of this boundary interference cannot beobserved because there are only signal electrons. In the normalized differenceimage a ring pattern is visible. This ring structure corresponds to the abovethreshold ionization pattern whereas the distance between the maxima is equalto the photon energy. The holographic ring pattern shown in figure 3.10(b)was not observed in the measured spectra. In contrast to the ATI pattern,the position of the maxima of the holographic ring pattern strongly dependson the electric field E0. This is depicted in figure 3.12 where the holographicpattern was calculated for two different laser intensities. For positive values

34 CHAPTER 3
E0 = 0.082 a.u. E
0 = 0.073 a.u.
p z (a.
u.)
px (a.u.)
−1 −0.5 0 0.5 10
0.5
1
1.5
Figure 3.12: Intensity dependence of the holographic pattern shown in figure3.10(b). The field strength for px > 0 is 10% smaller than for px < 0
.
of px the field strength E0 is 10% lower than for negative values of px. Theshift of the extrema is clearly visible. Due to the Gaussian intensity profile ofthe laser beam the measured momentum distribution is always intensity aver-aged. Intensity averaging would thus lead to an extinction of the holographicring pattern and could explain why it was not observed in the final spectra.Also the patterns shown in figure 3.10(c) and (d) could be strongly attenu-ated by intensity averaging. Additionally, they involve backward scatteringof the signal electron which is in general much less probable than forwardscattering at the considered energies. In case of the first holographic patternintensity averaging does not lead to complete extinction because of its longi-tudinal structure.The fact that the intense modulation of the photoelectron signal was limited
to the momentum range of the direct electrons and the striking similarity withthe calculated holographic pattern led to the conclusion that it was indeed in-terference between different electron trajectories which was observed. In thiscase the question remains why the holographic pattern was found to modulatewith respect to the pump-probe delay. One can see that within the 2Up limitthe modulation amplitude increases with the kinetic energy of the electrons.This is remarkable because electrons with high kinetic energy are ionized attimes close to the zero-crossing of the electric field where the ionization rateis small. This is visualized in figure 3.13(a) where the normalized electric fieldE(t0)/E0 is shown as a function of the final electron momentum. Although itis known from the ion yield measurements that the ionization rate modulateswith respect to the pump probe delay, it cannot explain the increasing mod-ulation amplitude as a function of the electron momentum in the holographicpattern. In contrast to the electric field amplitude, the time tr − t0 betweenionization and scattering is approximately inversely proportional to the finalkinetic energy of the electron. This is depicted in figure 3.13(b). Due to the

WAVE PACKETS IN NITRIC OXIDE 35
px (a.u.)
p z (a.
u.)
a)
−1 0 10
0.5
1
E(t
0)/E
0
0.2
0.4
0.6
0.8
1
px (a.u.)
b)
−1 0 10
0.5
1
(tR−
t 0)/ω
2
3
4
5
6
Figure 3.13: (a) Normalized electric field amplitude at the ionization time t0of the signal electron. (b) Delay between the ionization time t0 and the returntime tr of the signal electron.
dispersion of the photoelectron wave packet in the continuum, the probabil-ity that the electron scatters upon return becomes smaller the more time itspent in the continuum. This would explain the trend of the modulation asa function of the kinetic energy and indicates that the modulation amplitudestrongly depends on the amplitude of the signal electron wave function. How-ever, this effect does not explain the modulation itself.
The amplitude of the signal electron wave function further depends on theinitial lateral momentum distribution of the electron after tunneling and thescattering cross section of the parent ion. According to the quantitative rescat-tering theory (QRS) the scattering cross section can be extracted from themomentum distribution of the high-energy electrons (Ekin > 2Up) [40, 43].As already mentioned, the modulation amplitude of these electrons was muchweaker than the modulation of the holographic pattern. The phase of themodulation was the same but in contrast to the low-energy electrons, thehigh-energy electrons did not show a momentum dependent modulation am-plitude. Therefore, one can conclude that the DCS of the parent ion was notaffected by the electron wave packet and did not depend on the pump-probedelay. This in turn is only possible if the high-energy electrons, which werescattered in the time-independent potential of the NO+ molecule, were ini-tially the electrons of the wave packet.Because the DCS could be excluded as the origin of the strong modulation ofthe holographic pattern, only a delay-dependent transversal momentum dis-tribution of the electron after tunneling could explain the strong modulationof the photoelectron spectra. To analyze this, the lateral momentum distribu-tion after tunneling was calculated as a function of time for the electron wavepacket defined in equation 3.3.

36 CHAPTER 3
Figure 3.14: Partial Fourier transformation analysis of the electron wavepacket. (a) In the background the temporal evolution of the electron den-sity is plotted and in the front the electron density at z0 in the xy plane isshown. (b) Momentum distribution of the electron wave packet evaluated atz0 for the times given in the first column. (c) Relative momentum distributionA(pr, t) (see equation 3.31) calculated from the distribution given in (b).
Murray et al. [44–46] developed an algorithm to calculate the ionization ratebased on a partial Fourier transformation. In this theory the ionization rateis given by
Γ ∝∫
dxdy |Ψ(x, y, z0) ∗ g(ρ)|2 , (3.25)
i.e. it is proportional to the integral of the convolution of the bound wave

WAVE PACKETS IN NITRIC OXIDE 37
function Ψ(x, y, z) at the point z = z0 and the tunneling filter
g(ρ) = (1/τ) exp(−ρ2/2τ) (3.26)
where ρ2 = x2 + y2. We assume that the lateral momentum distribution aftertunneling is thus related to the lateral momentum distribution at the positionz0 of the initial wave function which is given by
Φ(px, py, z0) =
∣∣∣∣1
2π
∫ ∫Ψ(x, y, z0)eixpx+iypydxdy G
(p2
x + p2y
)∣∣∣∣2
. (3.27)
with
G(p2
x + p2y
)≡ G(p⊥) = e−
p2⊥τ2 , (3.28)
the Fourier transformed tunneling filter g(ρ). In this experiment |Ψ(x, y, z0)|2was time-dependent and equation 3.27 becomes
Φ(px, py, z0, t) =
∣∣∣∣1
2π
∫ ∫Ψ(x, y, z0, t)e
ixpx+iypydxdy G(p2
x + p2y
)∣∣∣∣2
. (3.29)
Together with the definition of the wave function Ψ+(t) (see equation 3.3),one can determine the time-dependent lateral momentum distribution for onespin component. Because the Raman transition rate strongly depends onthe alignment of the molecule one can simplify the problem and restrict thecalculations to the case where the molecular axis stands perpendicular to thepolarization vector (z). Furthermore, z0 was fixed at a distance of -1.83 A fromthe molecular axis (for F = 0.08151 a.u. the tunnel exit point was at -2.2 A).The result, evaluated at four different times between t = 0 and t = T/2 whereT corresponds to the period of the electronic wave packet, is summarized inthe figures 3.14(a)-(c). Figure 3.14(a) shows the temporal evolution of theelectron density in three dimensions. At time t = 0 the wave packet wasdefined as Ψ(x, y, z, t = 0) = 2 |πx〉. In the same figure the electron densityin the xy plane at z0 is depicted. The corresponding momentum distributionof the wave function in this plane Φ(px, py, z0, t) is given in figure 3.14(b).Taking into account all possible orientations of the molecule in the xy planeone obtains the averaged momentum distribution
Φ′(pr, z0, t) =
∮pr
Φ(px, py, z0, t)ds∮pr
ds(3.30)
where pr =√p2
y + p2x corresponds to the total momentum. Further, the rela-
tive, averaged momentum distribution
A(pr, t) =Φ′(pr, z0, t)
Φ′(pr = 0, z0, t = T/2)(3.31)

38 CHAPTER 3
Time t/T
A(p
r=0,
t)
a)
0 0.1 0.2 0.3 0.40
0.2
0.4
0.6
0.8
1
Time t/T
Γ(t)
/Γ(t
=T
/2)
b)
0 0.1 0.2 0.3 0.40
0.2
0.4
0.6
0.8
1
Figure 3.15: (a) Time evolution of A(pr = 0, t). (b) Normalized ionizationrate calculated using the relation given in equation 3.25.
is defined as a function of the total momentum pr and time t evaluated atz0 = −1.83 A. This function is shown in figure 3.14(c). The time evolutionof A(pr, t) indicates an increasing ionization rate between t = 0 and t = T/2and for t = T/2, A(pr, t) becomes Gaussian-shaped. In fact, at t = T/2 the1/e2 half width of the lateral momentum distribution is close to w = 2/
√τ .
According to the semi-classical theory the time evolution of A(pr = 0, t) is ofparticular importance because only electrons with an initial momentum pr = 0can rescatter from the parent ion. A(pr = 0, t), depicted in figure 3.15(a), iszero for t = 0 and one for t = T/2. In the limit of this simple model itfollows that the holographic pattern should be minimal or even vanishes fort = 0 and become maximal for t = T/2. Additionally, the relative ionizationrate, which was calculated using the relation given in equation 3.25, is alsomuch lower for t = 0 than for t = T/2. This is shown in figure 3.15(b).Considering the modulation of A(pr = 0, t) and of the ionization rate wearrive at the conclusion that a modulation of the holographic pattern as afunction of the pump-probe delay could be attributed to the time-dependentlateral momentum distribution of the electron after tunneling.
3.3.3 Observation of the Rotational Coherence
From the spectral analysis of the ion yield measurement it was known thatthe dips in the ion yield trace (figure 3.4(a) and (c)) close to 5, 10 and 15 pswere the result of rotational coherence induced by the pump pulse througha Raman transition. The time between the dips corresponds to half of therotational revival time Trev = 1/2B = 9.83 ps of the NO molecule where Bis the rotational constant. At these delays the axis distribution changes sig-nificantly. Approaching the time of the first half-revival, the axis distributionbecomes oblate-shaped. This is depicted in figure 3.16(a) where the polariza-

WAVE PACKETS IN NITRIC OXIDE 39
Figure 3.16: Axis distributions at the rotational revival. The axis distributionof the coherent rotational wave packet in NO is first delocalized in the xy plane(a) and ∼ 200 fs later localized along the z axis (b) assuming a pump pulsewhich is polarized along the z axis.
tion axis points along the z axis. About ∼ 200 fs later the axis distributionbecomes aligned along the z axis (see figure 3.16(b)). Because the ionizationrate of a molecule is in general orientation dependent, the ion yield should bedifferent for both distributions. For NO the orientation dependent normalizedionization rate is given in figure 3.21(b). For θ = 0◦ the molecule is ionizedat the oxygen atom. At θ = 100◦ the ionization rate reaches a minimum.Thus, one expects in average a lower ionization rate for the oblate-shaped axisdistribution than for the dumbbell-shaped distribution. This is exactly whatwas observed in the ion yield signal shown in figure 3.4(c) as well as in thetotal electron yield given in figure 3.17. The total electron yield was measuredfor the first half-revival at ∼ 5 ps and was obtained by integrating the mo-mentum resolved photoelectron spectra Sn where n = 1 − 15. The spectrawere recorded between delays of 4.86 ps and 5.1 ps. The integration time of asingle spectrum was 40 minutes. At 4.91 ps the axis distribution was delocal-ized in the xy plane where at 5.1 ps the axis distribution was localized alongthe polarization axis. The difference of the total electron yield between theminimum and the maximum was 2.3%. To study the effect of the rotationalcoherence on the photoelectron signal in more detail, it was again useful tocalculate the normalized difference
Dm,n(p) = 2Sm(p)− Sn(p)
Sm(p) + Sn(p)(3.32)
between two spectra, Sm and Sn, measured at different delays. The results ofthe normalized differences Dm,4 with m = 1, 8, 10, 15 are shown in the figures3.18(a)-(d) whereas in the figure 3.18(e) and 3.18(f) the normalized differenceD11,8 and D15,11 are given. As in figure 3.11 the solid line on top of the im-ages indicates the limit of the lateral momentum after tunneling. Within this

40 CHAPTER 3
S1
S2 S
3 S4
S5
S6
S7
S8
S9
S10
S11
S12
S13
S14
S15
Time delay (ps)
Nor
m. t
otal
ele
ctro
n yi
eld
4.85 4.9 4.95 5 5.05 5.1
1
1.01
1.02
1.03
Figure 3.17: Normalized total electron yield measured at the first rotationalhalf-revival. The total electron yield was obtained by integrating the photo-electron spectra.
range the pattern of the normalized difference D1,4 is similar to the holographicpattern of figure 3.11 whereas D8,4 shows several significant differences. Thepattern observed in D8,4 is even more pronounced in D10,4 and D15, 4 and itis also visible in D11,8 but not in D15,11. The latter is again similar to D1,4.Hence, we could conclude that the difference between spectra measured at thebeginning or at the end of the rotational half-revival were mainly caused bythe electronic coherence whereas the differences between spectra measured at4.91 ps and 5.1 ps were the result of electronic and the rotational coherence.In reference [47] Bian et al. presented calculated photoelectron momentum dis-tributions of oriented HeH2+ molecules. They could identify all holographicpatterns which were predicted by the semiclassical model (see fig. 3.10) for thecase where the molecular axis was parallel to the polarization vector. Theycould also show that the backward rescattering holography becomes less pro-nounced when the orientation angle was increased and even vanishes for angleslarger than 60◦. In contrast, the forward rescattering holography was observ-able for all orientations. A similar pattern as seen in the figures 3.18(a)-(e) hasnot been predicted. Of course, these images only show the differences betweentwo spectra and a direct comparison with a single photoelectron spectrum isnot appropriate. But one can argue that large differences are caused by in-terference and therefore reflect the holographic pattern. To the knowledge ofthe authors a theory to describe the effect of a mixed electronic and rotationalwave packet on the photoelectron spectrum has not yet been developed and afull numerical solution of the time-dependent Schrodinger equation would havebeen beyond the scope of this thesis. Therefore, a further more quantitativediscussion about the low-energy electrons was not possible.
But in the normalized difference D15,4 also a pattern in the region of thehigh-energy electrons is visible. This indicates that the elastic scattering DCS

WAVE PACKETS IN NITRIC OXIDE 41
px (a.u.)
p z (a.
u.)
a)
−2 0 2
−2
−1
0
1
2
px (a.u.)
p z (a.
u.)
b)
−2 0 2
−2
−1
0
1
2
px (a.u.)
p z (a.
u.)
c)
−2 0 2
−2
−1
0
1
2
px (a.u.)
p z (a.
u.)
d)
−2 0 2
−2
−1
0
1
2
px (a.u.)
p z (a.
u.)
e)
−2 0 2
−2
−1
0
1
2
px (a.u.)
p z (a.
u.)
f)
−2 0 2
−2
−1
0
1
2
Nor
m. d
iffer
ence
−0.2
−0.1
0
0.1
0.2
Figure 3.18: Normalized difference Dm,n(p) of spectra measured at the firstrotational half-revival close to 5 ps. (a) - (d) Dm,n(p) for n = 4 and m =1, 8, 10, 15. (e) D11,8(p) (f) D15,11(p). The maximal momentum of a directelectron is indicated as solid black line. Electrons outside of this boundarywere scattered at the parent ion.
had changed between S4 and S15. To prove that, calculated elastic differentialscattering cross sections were compared with the experimental result.The numerical calculations were done with the program Quantemol R©. It cancalculate the elastic scattering DCS for randomly oriented and for alignedmolecules. Using the latter option it was possible to calculate a DCS for apartially aligned sample. The output of the program included the DCS inthe xz plane for the selected orientations and scattering energies. In the pro-gram the orientation of the molecule is defined in terms of three Euler angles.

42 CHAPTER 3
O
N
x
z
y
θφ
α
DCS
e- beam
Figure 3.19: Definition of the angles which appear in the calculated DCSσxz(E,α, φ, θ). The momentum vector of the incident electron beam was anti-parallel to the z axis. The output of the program provides the DCS in thezx plane. The definition of the angles is unusual but it was chosen to avoidconfusion with the definition in Quantemol.
For a linear molecule two angles are sufficient and therefore the Euler anglesare replaced by θ and φ for the following discussion. The calculated DCSσxz(E,α, φ, θ) thus depend on the kinetic energy of the scattered electron E,the scattering angle α and the orientation of the molecule. The definition ofthe angles is depicted in figure 3.19. The momentum vector of the incidentelectron beam is anti-parallel to the z axis and a scattering angle α = 0◦ meansthat the electron is back scattered. The averaged DCS σ(α,E) is then definedas
σ(α,E) =
∑mi=1
∑nj=1 f(θj)σxz(α,E, φi, θj) sin(θj)∑m
i=1
∑nj=1 f(θj) sin(θj)
(3.33)
with φi = (i − 1)∆φ and θj = (j − 1)∆θ. The step size ∆φ = 2π/m and∆θ = π/(n − 1) depend on the number of different calculated orientationswhere in general m = 36 and n = 37. The weighting factor f(θ) = Γn(θ)A(θ)includes the normalized orientation-dependent ionization rate Γn(θ) and thealignment distribution A(θ). Note that the averaged DCS σ(α,E) is symmet-ric with respect to a rotation around the z axis. For the case where f(θ) = 1the average DCS should be identical with the DCS calculated by the programfor a randomly oriented sample. Figure 3.20 shows the two results where theaveraged DCS is given in (a) and the output for a randomly oriented sample isgiven in (b) (Quantemol; basis set: cc-pVTZ; method: Hartree-Fock; R-matrixradius: 10 a.u.; NO bond length: 1.154 A). The two results are similar whichshows that the error due to the averaging of a finite number of orientationsis small. To obtain σ(α,E) for a partially aligned NO+ sample a moderatealignment of
⟨cos2 θ
⟩= 0.5 was assumed. This corresponds to an axis distri-
bution Az(θ) =(
1 + a/√
cos2 θ + ε2 sin2 θ)/n with ε = 1.93, a = −2.40 and
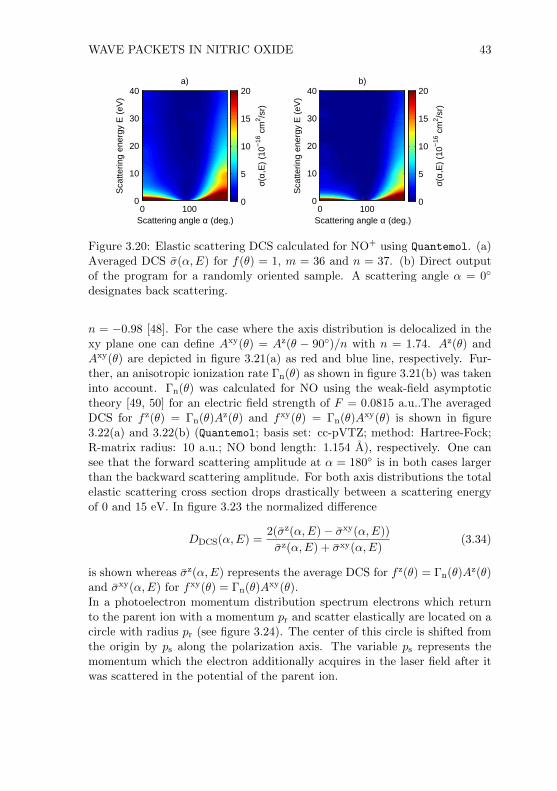
WAVE PACKETS IN NITRIC OXIDE 43
Scattering angle α (deg.)
Sca
tterin
g en
ergy
E (
eV)
a)
0 1000
10
20
30
40
σ(α,
E)
(10−
16 c
m2 /s
r)
0
5
10
15
20
Scattering angle α (deg.)
Sca
tterin
g en
ergy
E (
eV)
b)
0 1000
10
20
30
40
σ(α,
E)
(10−
16 c
m2 /s
r)
0
5
10
15
20
Figure 3.20: Elastic scattering DCS calculated for NO+ using Quantemol. (a)Averaged DCS σ(α,E) for f(θ) = 1, m = 36 and n = 37. (b) Direct outputof the program for a randomly oriented sample. A scattering angle α = 0◦
designates back scattering.
n = −0.98 [48]. For the case where the axis distribution is delocalized in thexy plane one can define Axy(θ) = Az(θ − 90◦)/n with n = 1.74. Az(θ) andAxy(θ) are depicted in figure 3.21(a) as red and blue line, respectively. Fur-ther, an anisotropic ionization rate Γn(θ) as shown in figure 3.21(b) was takeninto account. Γn(θ) was calculated for NO using the weak-field asymptotictheory [49, 50] for an electric field strength of F = 0.0815 a.u..The averagedDCS for f z(θ) = Γn(θ)Az(θ) and fxy(θ) = Γn(θ)Axy(θ) is shown in figure3.22(a) and 3.22(b) (Quantemol; basis set: cc-pVTZ; method: Hartree-Fock;R-matrix radius: 10 a.u.; NO bond length: 1.154 A), respectively. One cansee that the forward scattering amplitude at α = 180◦ is in both cases largerthan the backward scattering amplitude. For both axis distributions the totalelastic scattering cross section drops drastically between a scattering energyof 0 and 15 eV. In figure 3.23 the normalized difference
DDCS(α,E) =2(σz(α,E)− σxy(α,E))
σz(α,E) + σxy(α,E)(3.34)
is shown whereas σz(α,E) represents the average DCS for f z(θ) = Γn(θ)Az(θ)and σxy(α,E) for fxy(θ) = Γn(θ)Axy(θ).In a photoelectron momentum distribution spectrum electrons which returnto the parent ion with a momentum pr and scatter elastically are located on acircle with radius pr (see figure 3.24). The center of this circle is shifted fromthe origin by ps along the polarization axis. The variable ps represents themomentum which the electron additionally acquires in the laser field after itwas scattered in the potential of the parent ion.

44 CHAPTER 3
Angle θ (deg.)
A(θ
)
a)
0 50 100 1500
0.5
1
1.5
Angle θ (deg.)
Γ n(θ)
(arb
. u.)
b)
0 50 100 1500
0.005
0.01
0.015
0.02
Figure 3.21: (a) Alignment distribution Az(θ) (red) and Axy(θ) (blue). Thedistributions correspond to an alignment of
⟨cos2 θ
⟩= 0.5. (b) Normalized
ionization rate Γn(θ) of NO. For θ = 0◦ the molecule is ionized at the oxygenatom.
Scattering angle α (deg.)
Sca
tterin
g en
ergy
E (
eV)
a)
0 1000
10
20
30
40
σ(α,
E)
(10−
16 c
m2 /s
r)
0
20
40
60
80
Scattering angle α (deg.)
Sca
tterin
g en
ergy
E (
eV)
b)
0 1000
10
20
30
40
σ(α,
E)
(10−
16 c
m2 /s
r)0
20
40
60
80
Figure 3.22: Averaged elastic scattering DCS for aligned σz(α,E) (a) and anti-aligned σxy(α,E) (b) axis distributions of NO+ molecules. For both cases theorientation dependent ionization rate was taken into account.
Scattering angle α (deg.)
Sca
tterin
g en
ergy
E (
eV)
0 50 100 1500
10
20
30
40
Nor
m. d
iffer
ence
−1
−0.5
0
0.5
1
Figure 3.23: Normalized difference DDCS(α,E) of the calculated DCSsσz(α,E) and σxy(α,E).

WAVE PACKETS IN NITRIC OXIDE 45
ps
pr
α
px (a.u.)
p z (a.u
.)
a)
−2 0 2
−2
−1
0
1
2
Scattering angle α (deg.)
Yie
ld (a
rb. u
.)
b)
0 20 40 60 800.8
1
1.2
1.4
1.6S15
S4
Figure 3.24: (a) Experimental photoelectron momentum distribution of thespectrum S4. The circle represents the position where a scattered photoelec-tron with scattering momentum pr appears in the spectrum. An angle α = 0◦
represents an electron that was back rescattered. The circle is shifted fromthe origin by ps, the momentum which the electron additionally acquires afterit scattered off the parent ion. (b) Electron yield of the spectrum S4 (blue)and S15 (red) along the red circle shown in (a). The scattering momentum pr
was 1 a.u..
According to the QRS theory the momentum distribution along this circle ismainly dependent on the elastic scattering DCS of the parent ion. It is thuspossible to transform the calculated difference DDCS(α,E) to DDCS(p), wherep stands for the final electron momentum measured at the detector, providedthat the ratio pr/ps is known. Within the QRS theory the ratio between pr andps can be calculated using the classical equation of motion (equation 3.13). Infigure 3.25(b) the ratio pr/ps is plotted as a function of the return time ωtr.At ωtr = 180◦ the ratio pr/ps is not defined because ps = 0. The color of theline indicates the final kinetic energy Emax
kin of the electron after it was backrescattered, i. e. for a scattering angle α = 0◦. For a return time close toωtr = 262◦ the electron reaches a kinetic energy up to Emax
kin = 10Up. Togetherwith equation 3.15 one can show that an electron which returns at this time wasionized at ωt0 = 17◦. Electrons with an ionization time ωt0 < 17◦ will returnat ωtr > 262◦ and reach a final kinetic energy of Emax
kin < 10Up. But from figure3.25(b) one can see that for each time ωtr > 262◦ there is a second trajectorywith a return time ωtr < 262◦ and the same final energy Emax
kin but with adifferent pr/ps ratio. The two different trajectories are often referred to aslong and short trajectories. The transformation from DDCS(α,E) to DDCS(p)is thus only uniquely defined for either the “long” or the “short” trajectories.However, the short trajectories are suppressed due to the lower ionization rate.The relative ionization rate as function of the returning time is given in figure3.25(a). The rate was calculated based on the Yudin-Ivanov ionization model

46 CHAPTER 3
Figure 3.25: (a) Relative ionization rate as a function of the return time [51].(b) pr/ps ratio as a function of the return time. The color of the line corre-sponds to a certain final kinetic energy for the case where the photoelectronwas back rescattered by the parent ion.
for atoms [51]. The result of the transformed difference DDCS(p) is shown infigure 3.26(a) for the short and in figure 3.26(b) for the long trajectories. Forthe transformation a laser peak intensity of 2.2 ·1014 W/cm2 was assumed withz(t0) = −IP/E0 and vx(t0) = vz(t0) = 0. Specific features of the experimentalresult given in figure 3.26(d) are labeled with the letters A-F to compare themwith the transformed differences DDCS(p). The positions of these labels arethe same in all spectra. However, figure 3.26(d) does not represent D15, 4 (seefigure 3.18(d)). Instead, the normalized difference
DSh, Sl= 2
Sh − Sl
Sh + Sl(3.35)
between the averaged spectrum Sl = 1/9∑9
n=1 Sn and Sh = 1/6∑15
n=10 Sn isshown. DSh, Sl
is almost identical to D15, 4 but has a higher signal-to-noiseratio. For the pattern E, which is prominent in the spectrum 3.26(a) for shorttrajectories, one cannot identify corresponding structures in the experimentalspectrum. But unfortunately at these positions the electron yield is alreadyvery low. Because the Abel inversion increases the noise level in the spectrum,the normalized difference was also calculated for the raw data. The result isshown in figure 3.26(c). But a better agreement of the spectrum 3.26(a) withthe experimental data was also not observed. However, due to the focal volumeeffect [52] a laser peak intensity of 2.2 ·1014 W/cm2 (which was calculated fromthe initial beam parameters and was in agreement with the limit of the holo-graphic pattern) which was assumed for the transformation from DDCS(α,E)to DDCS(p) might be too high. Therefore, the normalized difference DDCS(p)was also calculated for an intensity of 1.2 · 1014 W/cm2.

WAVE PACKETS IN NITRIC OXIDE 47
px (a.u.)
p z (a.
u.)
A B
C
D
EF
a)
−2 −1 0 1 2
−2
−1
0
1
2
px (a.u.)
p z (a.
u.)
A B
C
D
EF
b)
−2 −1 0 1 2
−2
−1
0
1
2
p⊥ (a.u.)
p z (a.
u.)
A B
C
D
EF
c)
−2 −1 0 1 2
−2
−1
0
1
2
px (a.u.)
p z (a.
u.)
A B
C
D
EF
d)
−2 −1 0 1 2
−2
−1
0
1
2
px (a.u.)
p z (a.
u.)
A B
C
D
EF
e)
−2 −1 0 1 2
−2
−1
0
1
2
px (a.u.)
p z (a.
u.)
A B
C
D
EF
f)
−2 −1 0 1 2
−2
−1
0
1
2
Nor
m. d
iffer
ence
−1
−0.5
0
0.5
1
Nor
m. d
iffer
ence
−0.2
−0.1
0
0.1
0.2
Nor
m. d
iffer
ence
−1
−0.5
0
0.5
1
Figure 3.26: (a) Normalized difference DDCS(p) calculated for short trajecto-ries for a laser peak intensity of 2.2 ·1014 W/cm2. (b) Same as in (a) calculatedfor long trajectories. (c) Normalized difference DSh, Sl
of the raw spectra. (d)Normalized difference DSh, Sl
of the Abel inverted spectra. (e) Same as (a)for an intensity of 1.2 · 1014 W/cm2. (f) Same as (b) for an intensity of1.2 · 1014 W/cm2. Some specific features are labeled with letters. The posi-tions of the letters are identical in all spectra. The black circles on top of thespectra indicate the detection range.

48 CHAPTER 3
Scattering angle α (deg.)
Sca
tterin
g m
omen
tum
(a.
u.)
a)
0 50 1001
1.1
1.2
1.3
1.4
1.5
Nor
m. d
iffer
ence
−0.1
0
0.1
Scattering angle α (deg.)
Sca
tterin
g m
omen
tum
(a.
u.)
b)
0 50 1001
1.1
1.2
1.3
1.4
1.5
Nor
m. d
iffer
ence
−1
0
1
Figure 3.27: (a) Normalized difference DSh, Slas a function of scattering angle
α and scattering momentum pr assuming long electron trajectories. (b) Sameas figure 3.23.
The result for the short and long trajectories are given in figure 3.26(e) and3.26(f), respectively. One can observe a clear shift of the features in thenormalized difference calculated for short trajectories whereas the normalizeddifference calculated for long trajectories only slightly changes. The agree-ment of the calculated difference for short trajectories with the experimentalresult becomes even worse. However, the calculated normalized difference forthe long trajectories (figure 3.26(b)) has similarities with the experimentalresult. For a better comparison both results are shown in figure 3.27(a) and(b) as a function of the scattering angle α and scattering momentum pr. Theexperimental and calculated normalized difference is positive at α = 0◦ andα = 100◦ and negative for scattering angles α ≈ 50◦. For increasing scatteringmomentum the local minimum shifts to larger scattering angles in both spec-tra. However, the position of the minimum in the calculated and experimentalspectra does not exactly coincide. Nevertheless, this clearly shows that thepattern observed in the high-energy region is caused by the change of the elas-tic differential scattering cross section at the revival of the nuclear coherence.
3.4 Conclusion
In summary, we could observe the motion of an electronic wave packet im-printed on the momentum distribution of photoelectrons. Via a Raman tran-sition a coherent superposition of the 2Π1/2 and 2Π3/2 states of nitric oxidewas prepared. At the same time a rotational wave packet was excited by thepump pulse. By measuring the yield of the parent ion as a function of thepump-probe delay we could identify pump-probe delays where the ionization

WAVE PACKETS IN NITRIC OXIDE 49
rate was mainly modified by one wave packet. Therefore, it was possible toattribute the different changes in the photoelectron spectra to the differenttypes of wave-packet motion.For delays where the wave packet was mainly defined by the electronic co-herence we could observe a strong modulation of the direct electron yieldas a function of the pump-probe delay. In contrast to the rescattered pho-toelectrons, the modulation amplitude did also depend on the final electronmomentum. The pattern of this modulation was very similar to a holographicpattern known from other experiments. Using detailed simulations, we couldattribute this modulation to the motion of the electronic wave packet.At delays close to an alignment revival the structure of the rescattered photo-electrons changed. Using the program Quantemol we have calculated elasticscattering DCS for NO+ and compared the result with the pattern observed inthe rescattered photoelectrons. The calculated result was in partial agreementwith the experimental data assuming that the long electron trajectories weredominating over the short trajectories.

50 CHAPTER 3

Chapter 4
Isotope Effects inStrong-Field Ionization Rates
Within this chapter ion time-of-flight (TOF) measurements are presented.Besides the electron and ion momentum distribution measurements these ex-periments represent another attempt to gain insight into molecular dynamicson the femtosecond time scale. Compared to the imaging mode, the TOFmode has the advantage that the yield of all ions generated within a singlelaser shot can be measured simultaneously. This enables the investigation ofionization or fragmentation processes occurring when a molecule is exposed toan intense laser field. This experiment was motivated by the question whetherthere is an isotope effect in strong-field ionization.
4.1 Introduction
The main goal of these experiments was to compare the ionization rate ofmolecules with the ionization rate of their corresponding isotopologues. Tol-stikhin et al. showed in reference [53] that the ionization rate of H2 and D2
should be different. The prediction is based on the weak-field asymptotictheory (WFAT) which is explained in reference [49]. This theory includes thenuclear motion into the calculation of the tunneling ionization rate. The calcu-lation starts with the Schrodinger equation of a diatomic molecule with a singleactive electron in a static, electric field. Applying the Born-Oppenheimer ap-proximation the electronic and nuclear motion can be separated. By usingthe WFAT, the authors solved the equation for the electronic motion and de-rive the tunneling ionization rate for fields F � Fc, where Fc represents theboundary between tunneling and over-the-barrier ionization. From the equa-tion of the nuclear motion together with the result for the electronic motionthey finally derived the ionization rate which depends on the vibrational androtational state of the molecule. The result predicted an ionization-rate ratiobetween H2 and D2 which is larger than one. Although the theory is based on
51

52 CHAPTER 4
the assumption of a static electric field, it remains valid for laser fields with afrequency that is low compared to the motion of the electron.In this chapter measurements and results are presented where isotope effectson the ionization and fragmentation processes were investigated. First, a de-tailed description of the experimental setup, the measurement procedure andlaser peak intensity calibration is given. Finally, the results of H2/D2 andCH4/CD4 are presented and discussed.
4.2 Experimental Details
4.2.1 Optical Setup
Figures 4.1(a)-(c) show the optical setup. For the ionization rate measure-ments the VMIS was operated in the time-of-flight mode. The ion yield of twodifferent molecules and their fully deuterated isotopologues were measured fordifferent laser intensities. During the measurement session the laser outputwas shared with another independent measurement which included an opticalparametric amplifier (OPA). Because the OPA conversion efficiency stronglydepends on the length of the incident pulse, the compressor of the laser systemwas always optimized with respect to the OPA output and not with respect tothe TOF signal. For the H2/D2 and CH4/CD4 measurements the laser output(figure 4.1(a)) was directly guided to optical setup (figure 4.1(c)). However, forsome measurements the dispersion of the laser was additionally compensatedwith chirped mirrors (figure 4.1(b)). Details about the measured pulse lengthswill be given in the next section. To adjust the intensity a motorized half waveplate (WP 1, Newport SR50PP stepper motor together with the Newport ESP
100 controller) was used in combination with two thin-film polarizers (TFPK1 and 2). The beam was focused by a silver coated spherical mirror (SM) witha focal length f = 250 mm. During the measurement the laser intensity wasdirectly recorded by a fast photodiode (PD 3, Thorlabs DET 10 A/M) anda calibrated power meter (PD 2, Thorlabs S302C in combination with thecontrol unit Thorlabs PM100D). To monitor intensity and pulse length fluc-tuations of the laser the second-harmonic signal generated in a BBO crystalwas recorded by a third photodiode (PD 1, Thorlabs DET 10 A/M). The TOFion signal was recorded together with the signal of PD 1 and PD 3 with anoscilloscope (LeCroy Wavejet 354A). During the experiment the valve back-ing pressure was monitored with a pressure gauge (IFM PN2024). The analogoutput of the IFM PN2024 gauge and the output of the calibrated power meterwere digitized by an analog-to-digital converter (IOtech ADC 488/8 SA). Thepressure inside the chamber was monitored by two full range gauges (PfeifferPKR 251 controlled by MaxiGauge TPG 256A). A standard computer runningMatLab and LabView was used to control the stepper motor and to read outand save all measured parameters.

ISOTOPE EFFECTS IN STRONG-FIELD IONIZATION RATES 53
Laser
OPA
setup Laser
OPA
setupBS 1 BS 1
CM 1
CM 2
a) b)
c)WW
BBO
DM
WP 1
WP 2
TFPK 1
TFPK 2
BS 2
VMIS
Lasersetup
SM
PD 1
PD 2
PD 3
FROGsetup
Figure 4.1: Optical setup used for ionization rate measurements. For the H2
and CH4 experiments the laser output (a) was directly guided to the setup(c). For some measurements chirped mirrors were used to compensate thedispersion of the pulse (b). The abbreviations are: optical parametric amplifier(OPA), beam splitter (BS), chirped mirror (CM), wedged window (WW), BBOcrystal (BBO), dichroic mirror (DM), photodiode (PD), wave plate (WP),thin-film polarizer (TFPK), velocity map imaging spectrometer (VMIS) andspherical mirror (SM).
4.2.2 Laser Pulse Characterization
The laser was characterized using the frequency-resolved optical gating (FROG)method [54, 55]. The initial pulse was split into two replicas with a variabledelay. The two pulses were then spatially overlapped in a β-barium borate(BBO) crystal. This crystal is a nonlinear optical medium and emits lightwith twice the frequency of the input beam. This process is called second-harmonic-generation (SHG) and is proportional to the squared intensity. Be-cause the overlapping beams are crossed at a small angle inside the crystal,a third beam bisecting the two outcoming fundamental beams appeared afterthe BBO when the two pulses overlapped in time. The spectrum of this beamwas then recorded for different delays. To extract the complete envelope ofthe pulse from the measured spectra the program FROG 3.03 from Femtosoft
Technologies was used. It applies several different algorithms to reconstructthe electric field as a function of time from the measured spectra. The posi-tion at which the SHG FROG was measured is indicated in figure 4.1(c) ofthe optical setup. For reasons mentioned above the FROG traces were mea-sured after the output of the OPA was maximized and pulse lengths of 57± 2femtoseconds were measured.

54 CHAPTER 4
4.2.3 Detection Efficiency and Gas Density Calibration
In general, the measured ion yield is a function of the ionization rate, thetemporal and spatial shape of the laser pulse, the detection efficiency and thesample density in the laser focus. To extract the absolute ionization rate fromthe ion yield, it is essential that all the parameters are known. This would re-quire a lot of characterization measurements, especially to obtain the absolutedetection efficiency of the multi-channel plate detector. Because we were onlyinterested in relative ionization rates, the absolute values did not have to beknown and only a few parameters needed to be known.First one has to ensure that the spatial and temporal shape of the laser pulsedoes not change within the time it takes to measure both molecules. Thisturned out to be difficult. Although we observed a good stability of thespatial mode of the laser, the temporal shape and the peak intensity of thepulse changed on a time scale of hours. Therefore, we installed a photodiodewhich continuously measured the second-harmonic signal as explained in sec-tion 4.2.1. Furthermore, the measurements were repeated several times withinan hour. In this way differences due to power and pulse length fluctuations ofthe laser were addressed and minimized.A second important point is the relative detection efficiency of the ions. Thedetection efficiency of an MCP detector is a function that depends on manyparameters like the atomic number, velocity and charge of the ion as well asseveral parameters which reflect the geometry of the MCP [56]. Brehm et al.[57] have measured total detection efficiencies for protons and deuterons withkinetic energies between 0.5 and 5 keV. For all ions the detection efficiencyincreases between 0.5 and 3 keV and stays constant between 3 and 5 keV.Only a small ion mass effect was observed in these measurements. The meanvalues of the absolute detection efficiency for kinetic energies between 3-5 keVare for H2
+, (43 ± 1)%; D2+, (40 ± 1)%; H+, (40 ± 5)% and D+, (41 ± 5)%
[57]. Besides this, Peko et al. present in [58] a similar experiment for kineticenergies between 30 eV and 1 keV. Within this range they could observe anisotope effect but it decreases with increasing energy. In our case the kineticenergy of the ions was 2 keV. Based on these two papers we conclude that ionyield difference due to the detection efficiency of H2
+, D2+, H+ and D+ can
be neglected.The third parameter, the gas density in the focus of the laser, strongly de-pends on the mass because the pump rate of the turbomolecular pump andthe leak rate of the valve are both a function of the mass of the molecule. Forexample, the pumping speed for helium of the HiPaceTM 400, a comparableturbomolecular pump to the one used in the experiment, is about 10% higherthan for hydrogen. The leak rate of the sample gas through the nozzle can beestimated assuming a choked flow. Under this condition the flow rate differ-ence between hydrogen and helium (or deuterium) is 41%. Also the expansionof the gas after the valve depends on the mass. All effects together lead to a

ISOTOPE EFFECTS IN STRONG-FIELD IONIZATION RATES 55
different spatial density distribution of the sample gas in the focus of the laserand a different background pressure in the chamber. During the experimentthe background pressure was measured with a Pfeiffer PKR 251 full rangegauge. This device measures the pressure via electron impact ionization. Toobtain the absolute pressure a species-dependent correction factor is neededwhich was not known for deuterium. Using the pressure signal to calibratethe gas density is thus inaccurate.Another attempt to calibrate the density was made by measuring the third-order harmonic generation (THG). The THG signal intensity for diluted gasesis proportional to the density and the third-order nonlinear susceptibility χ(3).For H2 and D2 the microscopic second hyperpolarizability tensor γ, which isthe microscopic expression for χ(3), is very similar. In reference [59] the ra-tio⟨γH2
⟩/⟨γD2
⟩is 1.002 ± 0.001 measured at a wavelength of 1064 nm and
1.013± 0.003 for 1319 nm. 〈γ〉 stands for the isotropically averaged hyperpo-larizability. Based on this result we assume that the ratio is also very close toone for a wavelength of 800 nm. Thus, the third-harmonic signal can be usedto calibrate the gas density. Therefore, the laser was focused with a sphericalmirror with f = 100 mm in the center of the gas jet formed by a pulsed Even-Lavie valve with a nozzle diameter of 150 µm and a repetition rate of 1 kHz.With a dichroic mirror and a prism the THG signal was separated from thefundamental wavelength and detected by a photomultiplier tube. Because ofthird-harmonic generation in the air and the optical elements through whichthe laser was transmitted, the background signal was quite large. It could beimproved to a certain extent by reducing the optical elements in the path andby reducing the focal length of the spherical mirror. But it was not possibleto entirely eliminate the background. To reach a signal to background ratioof about 20% with a laser peak intensity of ∼1015 W/cm2, it was necessaryto increase the opening time of the pulsed valve and to operate it beyond thespecified conditions. The distance between the nozzle and the focus was only10 mm. The THG signal of hydrogen and deuterium was then measured un-der the same conditions. The experiment was repeated for different backingpressures between 6 and 10 bar. As expected, the THG signal ratio of the twomolecules was independent of the backing pressure. A ratio of 1.35± 0.10 wasfound. It follows that for the same backing pressure the density in the focuswas 1.35 times higher for H2 than for D2. During the THG measurements thepressure in the VMIS was around 0.01 mbar. Under this condition it was notpossible to use the MCP detector. Besides that, the valve was in contact withthe repeller plate. Due to these two reasons it was not possible to performion yield measurements under the same conditions as the THG measurements.The opening time of the valve and the distance between the nozzle and focusof the laser beam had to be adapted for the TOF measurements. Althoughit was not clear whether the density ratio was affected by these changes sev-eral attempts were made to compare the ion yield of hydrogen and deuterium

56 CHAPTER 4
assuming a density ratio of 1.35. Unfortunately, the results were not repro-ducible from one measurement to another.To improve the reproducibility the pulsed valve was replaced by a leak valvefrom Lenox Laser with a nozzle diameter of 10 µm. Additionally, 1% xenonwas added to the sample gas to use the xenon ion signal as an internal refer-ence. If the concentration of xenon is low, segregation processes in the gas jetshould be negligible and one can assume that the concentration of xenon in thegas jet is the same as in the initial mixture. Therefore, one can used the xenonion signal to calibrate the gas density in the focal volume. Because the densitycalibration based on the THG measurement did not lead to the desired result,the xenon reference was the only calibration method which could be appliedwithout rebuilding the VMIS. For the H2/D2 and CH4/CD4 experiments 1%xenon was added to the pure sample gas. The concentration of xenon couldbe determined with a precision of 4%. This was limited by the accuracy of thesample-independent pressure gauges IFM PN2009 (from -1 to 1 bar with anaccuracy of ±2 mbar) and IFM PN2024 (from -1 to 10 bar with an accuracy of±22 mbar) which were used to prepare the mixtures. Besides that, the xenonion signal can also be used to calibrate the laser peak intensity (see section 4.3).
4.2.4 Measurement Procedure
The measurement procedure was the same for all measurements presented inthe result sections. At the beginning the dispersion of the laser was adjustedsuch that the output of the OPA was maximal. As mentioned above, theOPA output was used for a second, independent experiment. The first bottlecontaining the gas mixture was connected to the system and 2 bar backingpressure was applied to the leak valve. The motorized half-wave plate wasset to the angle which corresponded to the highest intensity. Starting fromthis value 9 other angles were defined. The last one corresponded to thelowest possible intensity at which an ion signal was measurable with the MCPdetector set to the highest possible gain. For each intensity the gain parameterof the MCP was adjusted such that the ion signal was within the detectionrange of the oscilloscope. The selected intensities and corresponding MCPgain parameters were then kept constant for all following measurements. Ateach half-wave plate position 2560 TOF spectra were recorded and averaged.In parallel the signal of both photodiodes, the calibrated power meter, thebacking pressure of the valve and the pressure in the VMIS were recorded. Thisprocedure was repeated three times to address long-term laser fluctuations.After finishing, the gas system and the leak valve were evacuated and rinsedtwo times with the gas mixture of the second sample. The new sample wasthen measured for the same half-wave plate positions and MCP voltages. Thewhole procedure was repeated several times within a day.

ISOTOPE EFFECTS IN STRONG-FIELD IONIZATION RATES 57
Intensity (W/cm2)Y
ield
(ar
b. u
.)
1013
1014
0
20
40
60
80
Figure 4.2: The solid line shows the calculated ion signal from xenon ionizedby an 11 fs laser pulse with a center wavelength of 1800 nm. The beam isfocused by a spherical mirror with f = 250 mm. The red points are measureddata taken from reference [60].
4.3 Numerical Calculation of the Xenon IonizationRate
To calibrate the laser intensity the measured Xe+ ion yield was compared withthe calculated ionization rate based on the Yudin-Ivanov ionization model [51].The spatial as well as the temporal shape of the pulse were taken into account.The calculation was also compared with the result published in reference [60]where the same method was used to calibrate the intensity. In figure 4.2 thesolid line shows our calculated results whereas the red points represent themeasured yield taken from reference [60]. The calculated results are based onthe experimental conditions given in reference [60]. Both data sets overlapperfectly. In reference [61] the total ion signal for a Gaussian radial intensityprofile with a peak intensity I0 and an intensity I0/e at radius R is given by
S = απR2cl
∫ I0
0
1− e−∫∞−∞W (Irf(t))dt
IrdIr (4.1)
where W (I) is the intensity-dependent ionization rate, Ir the laser peak in-tensity at radius r, f(t) the temporal envelope of the pulse, α the detectionefficiency and c the concentration of the neutral species. The parameter l cor-responds to the length of the cylinder from which the ion signal is collected.Within this cylinder R is constant (parallel beam irradiation). This approxi-mation is only valid if the collection volume is much smaller than the Rayleighlength of the Gaussian beam. In figure 4.3(a) S is plotted for different pulsedurations as a function of I0. One can see that the ion yield becomes a linearfunction with respect to ln(I0) for intensities > 1014 W/cm2. Above this valueone can assume that ∫ ∞
−∞W (I0f(t))dt� 1 (4.2)

58 CHAPTER 4
and the function for the ion yield becomes [61]
S = απR2cl(ln(I0)− ln(Isat)). (4.3)
Isat is called the saturation intensity and is simply the intensity at whichthe linear regression intersects the x axis. The slope of the linear regressioncan be expressed as απR2cl and only depends on beam parameters and thegas concentration. It is thus possible to factor out the gas density and thedetection efficiency. Therefore, one could obtain the absolute ionization ratesfrom a single measurement. But this approach is only valid for a parallelGaussian beam. For a strongly focused beam R and I0 are no longer constantwithin the detection volume and equation 4.3 is no longer valid. The intensitydependent ion yield for different spatial beam profiles is depicted in figure4.3(b). The blue line represents the yield for a parallel Gaussian beam andthe red one the yield function for a strongly focused beam. It is obviousthat the red line does not converge to a linear function for high intensities.For both cases a homogeneous gas density within the integration volume wasassumed. If one also takes the gas density profile of the gas jet into account,one obtains the yield function represented by the green line. This functioncomes very close to the measured function and is used to retrieve the correctlaser peak intensities from the measured xenon yield. As parameters for thecalculation an initial beam waist of 4.2 mm and a focal length of 250 mmwere used. The pulse length was determined by the FROG measurement andwas set to 60 femtoseconds. For the gas jet a Gaussian density distributionwith a full width at half maximum of 2 mm was assumed. Further, the ratiobetween the maximal density in the center of the gas jet to the backgrounddensity was set to 99:1. Because the assumption of a parallel beam did nothold for this experiment, it was not possible to use the same method given in[61, 62] to measure the absolute ionization rate. In these references a time-of-flight mass spectrometer with a 0.5 mm slit aperture was used. The Rayleighlength of 3 mm was large enough that the beam could be described as aparallel Gaussian within the detection volume. However, we did not intend tomodify our experiment in this way because it would have limited us to yieldmeasurements. Angular resolved momentum measurements would not havebeen possible with a slit in the interaction region.
4.4 H2 and D2 Results
In an intense laser field molecules are not only ionized, they also tend todissociative ionization. For example H2
+ can dissociate to a hydrogen atomand a proton or it is further ionized leading to two protons. It is thus notpossible to directly extract the total ionization rate of H2 by just addingthe yields of the H+ and H2
+ ions (the neutral hydrogen atom cannot be

ISOTOPE EFFECTS IN STRONG-FIELD IONIZATION RATES 59
Intensity (W/cm2)
Yie
ld (
arb.
u.)
a)
1013
1014
1015
0
0.5
1
1.5
2
2.5
3
Intensity (W/cm2)
Yie
ld (
arb.
u.)
b)
1014
1015
0
5
10
15
30 fs, Isat
= 99 TW/cm2
60 fs, Isat
= 83 TW/cm2
120 fs, Isat
= 71 TW/cm2
Focused beam
Focused beam, gas jet
Parallel beam
Figure 4.3: (a) Calculated ion yield of xenon for a parallel Gaussian beam.The saturation intensity Isat increases for decreasing pulse lengths. (b) Ionyield as function of the laser peak intensity for a parallel (blue), a focusedGaussian beam (red) and a Gaussian beam focused into a gas jet (green).
detected with the VMIS). It is therefore necessary to measure the yield ofeach channel independently. As the final kinetic energy of the ions dependson the fragmentation mechanism several separated peaks should appear in theTOF signal close to the time where H+ is expected and it should be possible toassociate each of them to a certain dissociation channel. With this informationit would be possible to obtain the total ionization rate. However, the resolutionof our VMIS operated in the TOF mode was not good enough to clearly resolvethese peaks. Therefore, the angle-resolved momentum distribution spectra ofthe H+ ions were measured for different laser peak intensities to take advantageof the high resolution of the VMIS in the imaging mode. But before theseimages are presented, a short overview of the different possible dissociationmechanisms of H2
+ will be given.
4.4.1 Dissociation Mechanism in H2
A graphical summary of all fragmentation processes is shown in figure 4.4which is taken from Rudenko et al. [63]. It includes the potential energycurve of the ground state of H2 (black), the ground and first excited state ofH2
+ (red and green) and the potential curve of two protons (pink). Becauseall ionization or excitation processes are much faster than the nuclear motion,they follow the Frank-Condon principle and are thus indicated as verticalarrows. The most important processes are [63–65]:
• Sequential ionization (SI): H2 is initially in the vibrational ground statewith an equilibrium distance of Re = 1.4 a.u.. Because the equilibrium

60 CHAPTER 4
0 5 10-20
-15
-10
-5
0
5
10
15
20
25
30
.
2pσu
H+ + H+
H+ + H(1s)
H(1s) + H(1s)
Dressedstates
H2
H2+
1sσg
1ω2ω
SI
SDI
(CR
EI)
NSDI
3ω
Internuclear separation (a.u.)
Ener
gy (e
V)
Figure 4.4: Potential energy curve of the ground state of H2 and the twolowest electronic states of H2
+. For the latter dressed states with one upto three photons are given. The vertical arrows indicate the different frag-mentation channels. The abbreviations stand for: sequential ionization (SI),non-sequential double ionization (NSDI), sequential double ionization (SDI)and charge resonance enhanced ionization (CREI). The figure is taken fromreference [63].
distance in H2+ is larger, a multiphoton ionization of the ground state of
H2 will lead to the formation of a traveling wave packet in the 1sσg stateof the H2
+ ion. The wave packet is formed by a coherent superpositionof different vibrational levels.
• Bond-softening (BS): After ionization the residual H2+ ion can disso-
ciate into a proton and a hydrogen atom through absorption of one ortwo photons. This is possible because the 1sσg state couples with the2pσu state in the presence of an oscillating electromagnetic field. Ata certain internuclear distance the energy difference between the 1sσg
and 2pσu state is equal to the energy of a single photon and the tran-sition becomes resonant. Because the amplitude of the wave functionof the first vibrational states is almost zero at this distance only levelswith v ≥ 5 are coupled efficiently to the 2pσu state. The lower statescan only dissociate via a three-photon transition. But since the three-photon absorption is followed by the emission of a photon, the result isa net two-photon process. In the limit of the dipole coupling a directtwo photon transition is forbidden.

ISOTOPE EFFECTS IN STRONG-FIELD IONIZATION RATES 61
This fact can also be explained using field-dressed states. Dressed statesare the solution of the Schordinger equation for a molecule (or atom) ina quantized electromagnetic field. They are written as a product of themolecular states and the photon-number states (Fock states). In thiscase the 1sσg state becomes |1sσg, n〉 and the 2pσu state |2pσu, n〉 wheren stands for the number of photons associated with these states. In fig-ure 4.4 some selected dressed states are plotted as thin black lines. Closeto the 1sσg state one finds the |1sσg, n− 2〉 state and close to the 2pσu
state the states |2pσu, n− 1〉 and |2pσu, n− 3〉. Some of these statescross each other but due to the strong coupling between the 1sσg andthe 2pσu state these crossings are avoided. This leads to the adiabaticcurves depicted as light and dark blue lines. For small laser field intensi-ties the wave packet will follow the light blue curve which corresponds toa 1-photon absorption. One can see that the gap between the |1sσg, n〉curve (red) and the adiabatic curve (light blue) is small and the wavepacket is still trapped. Only states with v ≥ 5 are no longer bound andcan dissociate. For increasing intensities the 3-photon crossing becomesdominant and the adiabatic potential curve changes to the shape indi-cated by the dark blue curve. Now, also states with v < 5 are no longerbound leading to rapid dissociation of the H2
+ ion. As the internuclearseparation reaches R = 5 a.u. a second avoided crossing between the|1sσg, n− 2〉 and |2pσu, n− 3〉 forces the wave packet to follow the po-tential curve of the |1sσg, n− 2〉 state. This is the reason why a photonis emitted.
• Non-sequential double ionization (NSDI): After tunnel ionization of theH2 molecules the electrons are in the continuum and are driven by theoscillating electric field. During this oscillation some electrons scatterelastically or inelastically off their parent ion (only for linear polarizedlight). The latter process can cause the excitation or even the ionizationof the parent ion, which then leads to dissociation or Coulomb explosionof the molecule, respectively.
• Sequential double ionization (SDI): The H2+ ions in the ground or ex-
cited state can again absorb several photons (independent from the firstionization step) and reach the repulsive state.
• Charge-resonance enhanced ionization (CREI): For a certain bond lengthSDI is strongly enhanced as a result of the interaction of the 1sσg and2pσu states. In the limit of a static electric field this effect can be de-scribed in terms of localized electronic wave functions. In figure 4.5(a)the Coulomb potential experienced by the electron in H2
+ is plotted fordifferent bond lengths for the field-free case. In 4.5(b)-(d) the same po-tential curves are given including the effect of the electric field. For asmall internuclear distance the electron is delocalized between the two

62 CHAPTER 4
Ene
rgy
(arb
. u.)
Internuclear separation (arb. u.)
-6 -4 -2 0 2 4 6 8
-6 -4 -2 0 2 4 6 8
-6 -4 -2 0 2 4 6 8
-6 -4 -2 0 2 4 6 8b)
c)
d)
a)
Figure 4.5: Electronic potential energy functions of H2+ for different bond
lengths for the field free case (a) and in a static electric field (b) - (d). Abovea certain bond length the electron is localized at one proton. The figure istaken from [65].
protons. To reach the continuum it has to tunnel through the externalpotential barrier. For an intermediate bond length the electron is local-ized at one of the two protons. In the case where it is localized at the leftproton, it only has to tunnel through the internal barrier to reach a con-tinuum state. Because the internal barrier is smaller than the external,the ionization rate is increased in this situation above the correspondingatomic ionization rate. A further stretch of the bond leads to a raise ofthe internal barrier and the ionization rate decreases again towards theatomic value.
Each of these processes lead to H+ ions with a specific kinetic energy. Fromprevious experiments it was known that hydrogen ions with a kinetic en-ergy between 0 and ∼1 eV are the result of the bond softening processeswhereas kinetic energies between ∼1 and ∼5 eV arise from the CREI pro-cess [64, 66]. These two are the most dominant processes which lead to thefragmentation of the H2
+ ions. In addition, the NSDI channel is much lessprobable and leads to fragment energies up to ∼9 eV [63]. Further processes

ISOTOPE EFFECTS IN STRONG-FIELD IONIZATION RATES 63
px (a.u.)
p z (a.
u.)
1.6⋅1014 W/cm2
a)
−20 0 20−30
−20
−10
0
10
20
30
px (a.u.)
2.7⋅1014 W/cm2
b)
−20 0 20p
x (a.u.)
3.5⋅1014 W/cm2
c)
−20 0 20
Figure 4.6: (a)-(c) Angle-resolved momentum distribution spectra of H+ ionsfor different laser peak intensities. The laser was linearly polarized along thepx axis. The noise close to pz = 0 is an artifact of the Abel inversion of theraw data.
like bond-hardening, below-threshold dissociation, above-threshold dissocia-tion and zero-photon dissociation are not discussed here. They all lead tofragments with lower kinetic energies compared to the Coulomb explosionchannels. Details can be found in the review article by Posthumus et al. [64].Also the neutral dissociation of H2 can be neglected. So far this process hasnever been observed.
4.4.2 Momentum Distribution Spectra of H+ and D+ Ions
The angle-resolved momentum distribution spectra of H+ fragments for differ-ent laser peak intensities are presented in figures 4.6(a)-(c). The polarizationaxis was parallel to px. The slight distortion around the horizontal center lineis an artifact of the Abel inversion of the raw spectra. The distribution aroundthe px axis is very narrow and implies that dissociation mainly occurs if themolecular axis is parallel to the electric field vector. This is mainly causedby the fact that dissociation and enhanced ionization are much faster if themolecule stands parallel to the electric field [66]. A second reason is the ion-ization asymmetry of H2 itself which is in the order of 1.32 (ratio between theionization rate parallel and perpendicular to the molecular axis) [67]. Botheffects lead to a very strong selection of molecules which are initially alignedalong the polarization axis. The angular distribution depends further on thelaser-induced reorientation of the molecule. But this effect was not part of thestudy and will not be discussed in detail here. More information can be foundin [64, 68, 69].From the figures 4.6(a)-(c) one can calculate the yield as a function of the totalkinetic energy of the fragment. This is depicted in figure 4.7. Besides the data

64 CHAPTER 4
Kinetic energy (eV)
Nor
m. y
ield
(ar
b. u
.)
0 0.5 1 1.5 2 2.5 3 3.5 4 4.5 50
0.2
0.4
0.6
0.8
1
1.6⋅1014 W/cm2
2.7⋅1014 W/cm2
3.5⋅1014 W/cm2
Figure 4.7: Energy spectra for linearly polarized light for different laser peakintensities. The solid lines represent the H+ data and the dashed line theD+ data. These spectra are calculated using the angular resolved momentumdistribution spectra. The legend indicates the laser peak intensity.
for H+ (solid lines) also the results for D+ (dashed lines) are presented. Bothfunctions are quite similar. One can clearly identify two peaks centered at∼0.5 eV and ∼2 eV. These are the result of the dissociation of the moleculethrough BS and CREI, respectively [66]. On the low-energy side of the BSpeak a shoulder is visible which becomes less pronounced for higher intensities.This shoulder is the result of the 1ω BS dissociation whereas the main yieldcomes from the 2ω BS dissociation. For intensities above 1014 W/cm2 the 2ωBS channel is widely open and allows a dissociation of all vibrational states.Therefore, the shape and position of the BS peak reflect the initial populationdistribution over the vibrational levels of H2
+ (D2+). This distribution can be
predicted by calculating the Franck-Condon factors. For the transition fromthe vibrational ground state in H2 to the 1sσg state in H2
+ these factors, asfunction of the final vibrational state v′, have a maximum at v′ = 2 [70].The dissociation through 2ω BS of the 1sσg state with v′ = 2 leads then to afragment energy of ∼0.5 eV which coincides with the center of the BS peak[70].BS and CREI are competing processes and for high intensities CREI becomesdominant. Therefore, the BS yield decreases with increasing intensity. Incontrast to the BS yield the CREI yield not only increases with intensity,but also the mean kinetic energy of the fragments shifts noticeably to higherenergies (in [71] an intensity dependent shift of the BS peak in the rangeof 0.1 eV towards lower energies was observed). This is expected becauseCREI leads to Coulomb explosion of the molecule. The final kinetic energyof the fragment is thus the sum of the asymptotic dissociation energy and theCoulomb repulsion energy [70]. Because the latter is a function proportionalto 1/R, where R stands for the internuclear distance, the final kinetic energyof the fragments is directly related with the bond length at which the CREI

ISOTOPE EFFECTS IN STRONG-FIELD IONIZATION RATES 65
px (a.u.)
p z (a.
u.)
1.5⋅1014 W/cm2
a)
−20 0 20−30
−20
−10
0
10
20
30
px (a.u.)
1.9⋅1014 W/cm2
b)
−20 0 20p
x (a.u.)
2.5⋅1014 W/cm2
c)
−20 0 20
Figure 4.8: Same as figure 4.6 but for circular polarization. The laser peakintensity is given in each frame.
Kinetic energy (eV)
Nor
m. y
ield
(ar
b. u
.)
0 0.5 1 1.5 2 2.5 3 3.5 4 4.5 50
0.2
0.4
0.6
0.8
1
1.5⋅1014 W/cm2
1.9⋅1014 W/cm2
2.5⋅1014 W/cm2
Figure 4.9: Same as figure 4.7 but for circular polarization.
transition occurs. For increasing intensity CREI becomes significant at smallerinternuclear distances and gives thus rise to fragments with higher kineticenergies. The weak modulation of the CREI yield peak is an artifact of theAbel inversion.BS and CREI occur also if the fragmentation process is induced by a circularpolarized laser pulse. In figure 4.8, which shows the angle-resolved momentumdistribution for circular polarization, four peaks also appear. From the kineticenergy distribution given in figure 4.9 one can see that the mean energy ofthese peaks is the same as for linear polarization.The spectra for linear and circular polarization only differ much for fragmentenergies above 5 eV. The two cases are compared in figure 4.10. Above akinetic energy of 5 eV the fragment yield for circular polarization is alreadyclose to zero. The remaining signal fluctuation is mainly caused by the iterativeAbel inversion code which was used to transform the raw data. For linearpolarization the signal does not drop that fast and fragment energies up to 9

66 CHAPTER 4
Kinetic energy (eV)
Yie
ld (
arb.
u.)
1 2 3 4 5 6 7 8 9 1010
−3
10−2
10−1
100
101
linear
circular
Figure 4.10: Kinetic energy distribution spectra of H+ fragments for circular(blue) and linear (red) polarized light. The laser peak intensity was 2.5 ·1014W/cm2.
eV were detected. Such high fragment energies can only occur if the neutralhydrogen molecule is totally ionized within a very short time. It is known thatthese fragments are the result of recollision-ionization or recollision-excitationfollowed by field ionization of the molecules [63, 72]. It turned out that thelatter process dominates in hydrogen molecules [63]. Both processes cannotoccur for circularly polarized light because the electrons are not driven backto the parent ion.If the kinetic energy spectra of H+ and D+ which were measured under thesame conditions are compared, one recognizes that the ratio of the BS andCREI yield is different for both molecules and that the CREI peak of D+ ionsis shifted to higher kinetic energies compared to the corresponding H+ data.This is the result of the different nuclear dynamics of the two isotopologues.Due to the mass difference, the time evolution of the nuclear wave packet isslower in D2
+ than in H2+. Within the same time the wave packet in H2
+
reaches a larger R compared to D2+, resulting in Coulomb explosion fragments
with less kinetic energy [70]. On the other hand, the wave packet in H2+
reaches the critical distance, where the enhanced ionization is maximal, fasterand a higher fraction of H2
+ dissociates through CREI compared to D2+. This
fact explains the result shown in figure 4.11(a). It shows the CREI yield nX+
CREI
with respect to the total H+ or D+ ion yield nX+
tot , respectively for differentlaser peak intensities, i.e.
fX2CE =
nX+
CREI
nX+
tot
. (4.4)
The blue markers correspond to the ratio fD2CE measured for D+ ions and the
red markers to the ratio fH2CE for H+ ions. Each marker type represents an

ISOTOPE EFFECTS IN STRONG-FIELD IONIZATION RATES 67
independent set of measurements. The solid lines in the figure are polynomialfits which were used to determine the ratio between the H+ and D+ data sets.
This ratio rCE = fH2CE/f
D2CE is shown in figure 4.11(b). At 2 · 1014 W/cm2 the
ratio is 1.4 and decreases towards one for high intensities. This means thatthe CREI rate is larger in H2
+ than in D2+ for low intensities and the rates
become equal at high intensities. This result can be explained by the factthat the pulse duration is quite long with respect to the period of the nuclearwave packets. At high intensities, the molecules are already ionized within theleading edge of the pulse and the H2
+ as well as the D2+ wave packets have
enough time to reach the critical distance before the intensity drops below thethreshold intensity of CREI. For low intensities where ionization occurs closerto the maximum of the pulse, the time window in which CREI can occur isshort with respect to the time scale of the nuclear dynamic. More H2
+ ionsdissociate via CREI compared to D2
+ as the wave packet in H2+ reaches larger
R within the time window. Similar measurements have already been publishedin [65, 66, 73, 74] but in none of them the CREI rate of H2
+ and D2+ were
directly compared.Using this result it was possible to calculate the initial number of dissociatingH2
+ and D2+ molecules from the total H+, respectively D+ yield. Together
with the TOF spectra where the parent ions and the dissociation fragments aremeasured at the same time, one can calculate the initial number of moleculeswhich were ionized by the pulse and thus obtain the ionization rate indepen-dent from the subsequent dissociation of the molecules.
The Coulomb explosion fractions fX2CE given in figure 4.11 are plotted against
the laser peak intensity. This gives the impression that the values were mea-sured for these particular intensities. But as explained in section 4.3, one hasto take the focal volume effect into account. Therefore, the presented resultsare intensity averaged. Besides that it is also known that the Coulomb ex-plosion fraction depends on the pulse duration [65]. Therefore, the obtainedresult is only valid for the specified spatial and temporal shape of the pulse.It is thus crucial that the ion TOF spectra and the angular resolved momen-tum distribution spectra of ions are measured under the same experimentalconditions.
4.4.3 Intensity Calibration
Before the results of the ion TOF measurements are presented, it will be ex-plained how the xenon ion signal and the SHG signal were included in thedata analysis.Section 4.3 describes how the xenon ionization yield for a focused Gaussianbeam is calculated for different laser peak intensities including volume averag-ing effects as well as the density of the gas jet. By fitting the measured xenonyield to the calculated function it is thus possible to calibrate the signal of the

68 CHAPTER 4
a)
Intensity (1014 W/cm2)
Cou
lom
b ex
plos
ion
fract
ion
2 4 6 80
0.2
0.4
0.6
0.8
1b)
Intensity (1014 W/cm2)
Rat
io f C
EH
2/f C
ED
2
2 3 4 5 6 71
1.2
1.4
1.6
1.8
Figure 4.11: (a) Coulomb explosion fraction fX2CE for linearly polarized light as
a function of the laser peak intensity where red markers stand for H+ resultsand the blue markers for the D+ results. The solid lines represent polynomialfits. The ratio rCE between the two fits is given in (b).
photodiode PD 2 (see figure 4.1) and one obtains the laser peak intensity asa function of the photodiode signal. This calibration was done for each mea-surement individually. The result is given in figure 4.12 where the xenon yieldof all measurements, indicated by different marker colors, are depicted. All ofthem overlap well with the theoretical yield (black solid line, corresponds tothe green line in figure 4.3(b)) except for the points at low intensities wherethe ion signal can no longer be distinguished from the constant background.Calibrating the laser peak intensity with this method allowed us to comparemeasurements which were taken at different days under slightly different ex-perimental conditions. This was important because it was almost impossibleto maintain identical conditions for more than one day. But also the intensityand pulse length fluctuations of the laser which occurred on the time scale ofhours were taken into account. As explained in the previous section 4.2, thisproblem was addressed by measuring the SHG response of the laser pulse atthe same time as the ion signal.Using the example of the normalized parent ion yield nX2
+/nXe+ it will be
explained how the SHG signal was included in the data analysis. nX2+ and
nXe+ stand for the parent ion yield of the sample molecule and the xenon ionyield which were measured at the same time. In the figures 4.13(a)-(e) thenormalized yield is shown for H2 (circles) and D2 (triangles) of a single mea-surement session as function of the SHG signal and for different laser peakintensities. The SHG signal range was the same for all intensities becausethe SHG signal was recorded before the laser passes the optics to adjust theintensity (see figure 4.1). In the figure each marker color corresponds to anindependent measurement. During the measurement session the laser pulse

ISOTOPE EFFECTS IN STRONG-FIELD IONIZATION RATES 69
Intensity (W/cm2)
Xe+
yie
ld (
arb.
u.)
1014
10−4
10−3
10−2
10−1
100
Figure 4.12: Xe+ yield versus laser peak intensity. The solid line shows thecalculated xenon yield for a focused Gaussian beam. The markers representthe measured yield whereas each color corresponds to a certain measurement.
properties were fluctuating leading to an increase of the SHG signal and nor-malized yield. The ratio between the H2 and D2 data set was then calculatedas a function of the SHG signal to take these fluctuations into account. Asa consequence some of the measurements had to be discarded because therewere no corresponding measurements of the other isotopologue within thesame SHG signal range. Measurements of the same molecule which share thesame SHG signal value were simply averaged before they were included in thecalculation. The result, given in figures 4.14(a)-(e), was finally used to deter-mine the mean ratio (black line) and standard deviation (red lines) for eachintensity individually. Therefore, all ratios which will be presented in the fol-lowing sections are always calculated based on several data sets measured onthe same day (measurement session). The measurements were then repeatedon different days. In the figures of the following sections the ratios result-ing from measurements of the same day are usually indicated with a specificmarker color.
4.4.4 Fragmentation Rate
The analysis of the angle-resolved momentum distribution spectra of the H+
or D+ fragments in section 4.4.2 leads to the conclusion that the dissociationof the parent ion through CREI is faster for H2
+ than for D2+ with respect to
the dissociation through BS (see figure 4.11). An absolute measurement of thedissociation rate was not possible because the parent ion yield was unknown.But together with the TOF measurement this can be quantified. In figure4.15(a) the ratio

70 CHAPTER 4
a)
3.8⋅1014 W/cm2
SHG signal (arb. u.)
n X2+/n
Xe+
1 1.05 1.1 1.15 1.23
4
5
6b)
2.9⋅1014 W/cm2
SHG signal (arb. u.)
n X2+/n
Xe+
1 1.05 1.1 1.15 1.22
3
4
5
c)
2.3⋅1014 W/cm2
SHG signal (arb. u.)
n X2+/n
Xe+
1 1.05 1.1 1.15 1.21
2
3
4d)
1.8⋅1014 W/cm2
SHG signal (arb. u.)
n X2+/n
Xe+
1 1.05 1.1 1.15 1.21
1.5
2
2.5
e)
1.1⋅1014 W/cm2
SHG signal (arb. u.)
n X2+/n
Xe+
1 1.05 1.1 1.15 1.20
0.5
1f)
0.92⋅1014 W/cm2
SHG signal (arb. u.)
n X2+/n
Xe+
1 1.05 1.1 1.15 1.20
0.5
1
Figure 4.13: (a) - (e) Normalized parent ion yieldnX2
+
nXe+for H2 (circles) and D2
(triangles) as a function of the SHG signal measured for different laser peakintensities. The laser was linearly polarized. Each marker color correspondsto an independent measurement.
r1 =r
H2frag
rD2frag
(4.5)
is plotted for linear polarization where
rX2frag =
nX+
nX2+
(4.6)
stands for the fragmentation ratio including the parent ion yield nX2+ and the
fragment yield nX+ . Each marker color corresponds to a data set taken duringa different measurement session. For each session the ratio was determinedas explained in the previous section. The solid black line represents the meanvalue of all ratios. This line has a minimum between 1 · 1014 W/cm2 and2 · 1014 W/cm2. Within this range the ratio is close to one. This means that

ISOTOPE EFFECTS IN STRONG-FIELD IONIZATION RATES 71
a)
3.8⋅1014 W/cm2
SHG signal (arb. u.)
Rat
io r
1 1.05 1.1 1.15 1.21
1.2
1.4b)
2.9⋅1014 W/cm2
SHG signal (arb. u.)
Rat
io r
1 1.05 1.1 1.15 1.21
1.5
2
c)
2.3⋅1014 W/cm2
SHG signal (arb. u.)
Rat
io r
1 1.05 1.1 1.15 1.2
1.3
1.4
1.5
1.6d)
1.8⋅1014 W/cm2
SHG signal (arb. u.)R
atio
r
1 1.05 1.1 1.15 1.21
1.5
2
e)
1.1⋅1014 W/cm2
SHG signal (arb. u.)
Rat
io r
1 1.05 1.1 1.15 1.21
1.5
2f)
0.92⋅1014 W/cm2
SHG signal (arb. u.)
Rat
io r
1 1.05 1.1 1.15 1.21
1.5
2
Figure 4.14: (a) - (e) Ratio between the normalized nH2+/nXe+ and nD2
+/nXe+
yield given in figure 4.13 as function of the SHG signal for different laser peakintensities. The black line indicates the mean value and the red lines thestandard deviation of all points within a single graph.
the fragmentation ratio is equal for both molecules where for higher and lowerintensities more H+ than D+ ions are detected relative to the parent ion yield.In figure 4.15(b) a second ratio
r2 =r
H2diss
rD2diss
(4.7)
is given where
rX2diss =
nX2
+
diss
nX2
+
stab
(4.8)
represents the ratio between the number of parent ions which dissociate nX2
+
diss
and the number of parent ions which do not dissociate nX2
+
stab . nX2
+
diss is calculated

72 CHAPTER 4
a)
Intensity (1014 W/cm2)
Rat
io r
1
1 2 3 40.9
1
1.1
1.2
1.3b)
Intensity (1014 W/cm2)
Rat
io r
2
1 2 3 4
0.8
1
1.2
1.4
Figure 4.15: Fragmentation ratio r1 (a) and dissociation ratio r2 (b) as afunction of the laser peak intensity for linearly polarized light. Each markercolor corresponds to an individual data set. The black line indicates the meanvalue of all data sets.
using the result of section 4.4.2, i.e.
nX2
+
diss = (1− 0.5 fX2CE)nX+ . (4.9)
Compared to r1 the ratio r2 is close to one for intensities above 2 ·1014 W/cm2
but also increases with decreasing intensity. This shows that at low intensitiesH2
+ dissociates faster than D2+. At high intensities the dissociation rate is
equal for both molecules because the first ionization step occurs at the risingedge of the pulse. Within the duration of the laser pulse the wave packets haveenough time to either dissociate through BS or reach a position at which CREIbecomes resonant. The increase of the ratio r2 at low intensities shows againthe strong relation between the dissociation rate and the nuclear dynamicsbut it is not an indication that H2 ionizes faster than D2. The ratios r1 andr2 are independent of the ionization rate of the neutral molecules. Again, oneshould keep in mind that the presented results depend on the temporal andspatial shape of the laser pulse.
4.4.5 Total Ionization Rate
Finally, the ionization rate of hydrogen and deuterium are compared. Theratios presented in the figures 4.16(a)-(c) are calculated based on the samemeasurements which were used for the comparison of the fragmentation rates.Each marker color corresponds to an individual data set whereas the black linerepresents the mean value of all data sets. The red line shows the predictedionization rate ratio calculated using the modified WFAT [49, 53]. Figure

ISOTOPE EFFECTS IN STRONG-FIELD IONIZATION RATES 73
a)
Intensity (1014 W/cm2)
Rat
io r
3
1 2 3 41
1.5
2
2.5
3
3.5b)
Intensity (1014 W/cm2)
Rat
io r
4
1 2 3 4
0.8
1
1.2
1.4
1.6
c)
Intensity (1014 W/cm2)
Rat
io r
5
1 2 3 41
1.5
2
Figure 4.16: Total ion yield ratio r3 (a), r4 (b) and r5 (c) as a function of thelaser peak intensity for linearly polarized light. The red line indicates the pre-dicted ratio and the black line represents the mean value of all measurements.
4.16(a) shows the ratio
r3 =n
H2+
diss + nH2+
nD2
+
diss + nD2+
(4.10)
where nX2
+
diss corresponds to the number of dissociated molecules (equation 4.9)and nX2
+ , the yield of the parent ions. The ratio r3 is close to 2.5, far above the
theoretical value. This ratio does not include a correction due to the differentgas densities in the focal volume. A direct correction of the ratio r3 based onthe pressure measured with pressure gauge pX2
leads to the pressure correctedratio
r4 = r3 ∗pD2
pH2
. (4.11)
This ratio is shown in figure 4.16(b). For high intensities r4 is close to thetheoretical value but it does not show the strong increase for low intensities.As already mentioned, the density correction based on the pressure gaugesignal is not fully reliable insofar as the pressure gauge measures the densityby means of electron impact ionization. But this measurement is also species

74 CHAPTER 4
dependent which leads to a constant offset of the ratio r4. As explained insection 4.2.3 we therefore use the xenon signal to calibrate the particle density.Figure 4.16(c) shows the ratio
r5 = r3 ∗n
D2
Xe+c
H2
Xe+
nH2
Xe+c
D2
Xe+
(4.12)
where nX2
Xe+represents the Xe+ ion yield and c
X2
Xe+the concentration of xenon in
the sample gas. Although a slight increase of the mean value for low intensitiescan be observed, the ratio r5 does not decrease towards one for high intensities.From this we conclude that the density calibration with xenon may not lead tothe correct result. Also other attempts has been made to calibrate the density(see section 4.2.3), but the xenon method has delivered the most trustworthyand reproducible results. One should also keep in mind that the presentedresults include data measured on seven different days where the two moleculeswere measured multiple times each day. But finally, it turned out that thelarge differences in the leak rate, the expansion of the gas jet and the pumpingefficiency between hydrogen and deuterium made it impossible to retrieve asufficiently accurate density correction. However, the dramatic increase of theionization rate predicted by the theory has not been conclusively identified.
4.5 CH4 and CD4 Results
Methane is one of the simplest hydrocarbon molecules but its interaction withan intense femtosecond laser field is far from being fully understood. As men-tioned in the beginning of this chapter we were mainly interested in measuringthe ionization rate of the neutral methane and the fully deuterated isotopo-logue to compare it with the result of the WFAT. Like hydrogen, CH4
+ (CD4+)
can also dissociate and one observes several different products. But to com-pare the ionization rate, the initial amount of the singly charged parent ionneeds to be known as well as all fragmentation channels. This makes it dif-ficult to obtain the initial ionization rate from an ion TOF measurement ofCH4
+ (CD4+).
In figure 4.17(a) a typical ion TOF spectrum for a laser peak intensity of3.2 · 1014 W/cm2 and linear polarization is shown. The polarization vectorwas parallel to the TOF axis. At m/q ≈ 66 and m/q ≈ 130 the Xe2+ and Xe+
ions appear, respectively. As in the hydrogen experiments, the xenon signalwas used to calibrate the laser peak intensity and the gas density in the focalvolume. The figures 4.17(b) and 4.17(c) show the same spectrum for differentaxis ranges. For the given intensity one can mainly observe X+ and CX+
n
(n = 0 − 4) fragments. Besides that also a tiny amount of X2+ and doubly
charged CX2+n (n = 0, 2, 4) fragments are observed. The ion yield of the singly

ISOTOPE EFFECTS IN STRONG-FIELD IONIZATION RATES 75
a)
m/q
Nor
m. y
ield
20 40 60 80 100 120 1400
0.2
0.4
0.6
0.8
1
b)
m/q
Nor
m. y
ield
5 10 15 200
0.2
0.4
0.6
0.8
1
c)
m/q
Nor
m. y
ield
2 4 6 8 100
0.005
0.01
0.015
0.02
Intensity (1014 W/cm2)
Nor
m. i
on y
ield
d)
1 2 3 4 5 6
10−2
100
102
Figure 4.17: (a) Ion time-of-flight spectrum of CH4 (red) and CD4 (blue) fora laser peak intensity of 3.2 · 1014 W/cm2. (b) Same spectrum as in (a) withfocus on the methane fragments. (c) Same as (a) with focus on the doublycharged methane fragments. (d) Ion signal relative to the ion yield of Xe+
versus laser peak intensity. The circles represent the fragments of CH4 andthe triangles the fragments of CD4. The colors stand for: CX4
+ (red), CX3+
(green), CX2+ (blue), CX+ (magenta), C+ (gray), X+ (cyan). The black curve
indicates the expected X+ yield assuming that the only fragmentation processwould have been Coulomb explosion.
charged fragments relative to the Xe+ yield as a function of the laser peakintensity is given in figure 4.17(d). The circles represent the relative yieldsfor the CH4 sample and the triangles for the CD4 sample whereas each colorcorresponds to a specific fragment. The black lines represent the expectedH+ or D+ yield, respectively with Coulomb explosion assumed to be the onlydissociation channel, i.e.
nX+,ce = nCX+3
+ 2nCX+2
+ 3nCX+ + 4nC+ . (4.13)
The fact that doubly charged fragments can be observed shows that Coulombexplosion has to be considered. For high intensities the expected and themeasured proton yield are almost the same. Therefore, one can assume thatfor high intensities Coulomb explosion is the dominant reaction channel which

76 CHAPTER 4
Intensity (1014 W/cm2)
Rat
io r
6
a)
0 1 2 3 40.8
1
1.2
Intensity (1014 W/cm2)
Rat
io r
7
b)
1 2 3 40.8
1
1.2
Intensity (1014 W/cm2)
Rat
io r
8
c)
0 1 2 3 40.8
1
1.2
Intensity (1014 W/cm2)
Rat
io r
9
d)
1 2 3 40.8
1
1.2
Figure 4.18: Ion yield ratios rn (n = 6− 9) versus laser peak intensity. Eachmarker color corresponds to a single measurement. The black line with theerror bar shows the mean value and standard deviation of all measurements.The red line indicates the predicted ratio.
leads to the production of H+ or D+ ions (and probably also to H2+) whereas
for low intensities the dissociation of singly charged ions dominates. Becausethe dissociation of singly charged ions does not affect the total amount ofobserved ions, one could simply add up the yield of all fragments to obtainthe initial CH4
+ (CD4+) yield. But as soon as doubly charged molecules
are produced, they can Coulomb explode and the total amount of ions doesno longer correspond to the initial amount of ionized molecules. Becausethe relative rate of the two different reaction channels was unknown it wasthus not possible to obtain the exact parent ion yield. By using the previousassumption about the dominant reaction channel one can estimate the initialion yield. Therefore, at low intensities where dissociation dominates one shouldtake all fragments into account whereas at high intensities only the fragmentswhich include a carbon atom should be considered. This was done in orderto compare the initial parent ion yield of CH4 and CD4 which is depictedin the figures 4.18(a)-(d). Each marker color corresponds to an independentmeasurement and the black line with error bars shows the mean value and

ISOTOPE EFFECTS IN STRONG-FIELD IONIZATION RATES 77
the standard deviation of all measurements. The red line indicates the valuepredicted by the WFAT theory. Thereby, figure 4.18(a) shows the yield ratio
r6 =n
CH4tot
nCD4tot
pCD4
pCH4(4.14)
where nCX4tot stands for the total yield of all fragments including protons and
deuterons, respectively. Further, the ratio is normalized by the pressure pCX4
which was measured by the pressure gauge. If only the carbon containingfragments are taken into account one obtains the result depicted in figure4.18(c) where the ratio
r8 =n
CH4totC
nCD4totC
pCD4
pCH4(4.15)
is shown with nCX4totC, the total yield of the carbon containing charged fragments.
In figure 4.18(a) the mean ratio and the calculated ratio are similar for lowintensities whereas for high intensities the mean ratio depicted in figure 4.18(c)is in good agreement with the theoretical value. But due to the large standarddeviation of the mean ratio this measurement cannot be used to prove or rejectthe WFAT theory which predicts a different ionization rate for CH4 and CD4.And as already discussed also the density correction based on the pressuregauge signal is problematic. One can use again the xenon signal to calibratethe density, although we showed in the previous chapter that also this methoddoes not give the correct density. But at least one obtains a smaller standarddeviation of the mean ratio because signal fluctuations due to laser instabilitiesare reduced. The corresponding result for the ratio r6 is given in figure 4.18(b)where the ratio
r7 =n
CH4tot
nCD4tot
nCD4
Xe+
nCH4
Xe+
cCH4Xe
cCD4Xe
(4.16)
is shown. It includes the Xe+ yield measured for the CH4 sample nCH4
Xe+as well
as for the CD4 sample nCD4
Xe+. Because the xenon concentration can vary for
the two different samples also the concentrations cCH4Xe and c
CD4Xe have to be
taken into account. The equivalent to the ratio r8 is the ratio
r9 =n
CH4totC
nCD4totC
nCD4
Xe+
nCH4
Xe+
cCH4Xe
cCD4Xe
(4.17)
which is identical to ratio r7 except that only the carbon containing fragmentswere taken into account. The ratio r9 is depicted in figure 4.18(d). For high

78 CHAPTER 4
intensities the mean value of the ratio r9 is close to the predicted value whereasfor low intensities the mean value of the ratio r7 is slightly above the theoreticalresult. If both results are considered together one could conclude that there isa trend that CH4 tends to ionize faster for low intensities compared to CD4.But due to the uncertainties in the density calibration and the lack of exactknowledge of all possible reaction channels and their rate it is possible thatthe observed trend is only an artifact.Additional interesting information can be found in ratios where the parent ionyield is taken as internal reference. The resulting ratios are independent ofany density effects and therefore more reliable than the ratios of the total ionyield. In figure 4.19(a)-(d) the ratios
rj =n
CH4
CHk+
nCH4
CH4+
n
CD4
CDk+
nCD4
CD4+
−1
(4.18)
for j = 10− 13 and k = 3− 0 are depicted. Figure 4.19(e) shows the ratio
r14 =n
CH4
H+
nCH4
CH4+
n
CD4
D+
nCD4
CD4+
−1
. (4.19)
The different marker colors represent again the different measurements andthe black line the mean value of those. One can immediately see that theyield of the carbon containing fragments with respect to the parent ion yieldis always smaller for CH4 than for CD4 whereas the relative proton yield islarger compared to the relative yield of deuterons. In general one would expectthat the dissociation of CH4
+ is faster than CD4+ due to the larger mass of the
deuterons. Assuming that the fragmentation of CHn+ is a stepwise process
[75] one can focus on the dissociation of CH4+. In principle there are two
different reaction channels for CH4+:
CH+4 → CH+
3 + H, (4.20a)
CH+4 → CH3 + H+. (4.20b)
In reference [76] Wang et al. showed that CH+4 → CH3 + H+ is the preferred
dissociation channel. This prediction is based on the so called field-assisteddissociation model (FAD). Within this model only the bond which lies alongthe polarization axis is considered. The positions of the other atoms are fixed.Due to the laser field the potential energy surface is distorted which leads to thedissociation of the CH4
+ ion along the parallel CH-bond. The model predictsthat the dissociation is faster if the polarization vector points from the C to theH atom. But this prediction appears to be inconsistent with the experimental
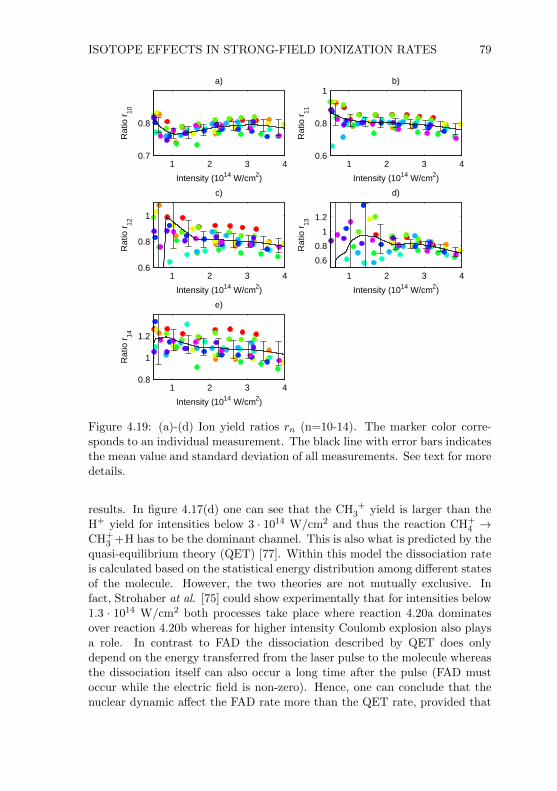
ISOTOPE EFFECTS IN STRONG-FIELD IONIZATION RATES 79
Intensity (1014 W/cm2)
Rat
io r
10
a)
1 2 3 40.7
0.8
Intensity (1014 W/cm2)
Rat
io r
11
b)
1 2 3 40.6
0.8
1
Intensity (1014 W/cm2)
Rat
io r
12
c)
1 2 3 40.6
0.8
1
Intensity (1014 W/cm2)R
atio
r13
d)
1 2 3 4
0.6
0.8
1
1.2
Intensity (1014 W/cm2)
Rat
io r
14
e)
1 2 3 40.8
1
1.2
Figure 4.19: (a)-(d) Ion yield ratios rn (n=10-14). The marker color corre-sponds to an individual measurement. The black line with error bars indicatesthe mean value and standard deviation of all measurements. See text for moredetails.
results. In figure 4.17(d) one can see that the CH3+ yield is larger than the
H+ yield for intensities below 3 · 1014 W/cm2 and thus the reaction CH+4 →
CH+3 +H has to be the dominant channel. This is also what is predicted by the
quasi-equilibrium theory (QET) [77]. Within this model the dissociation rateis calculated based on the statistical energy distribution among different statesof the molecule. However, the two theories are not mutually exclusive. Infact, Strohaber at al. [75] could show experimentally that for intensities below1.3 · 1014 W/cm2 both processes take place where reaction 4.20a dominatesover reaction 4.20b whereas for higher intensity Coulomb explosion also playsa role. In contrast to FAD the dissociation described by QET does onlydepend on the energy transferred from the laser pulse to the molecule whereasthe dissociation itself can also occur a long time after the pulse (FAD mustoccur while the electric field is non-zero). Hence, one can conclude that thenuclear dynamic affect the FAD rate more than the QET rate, provided that
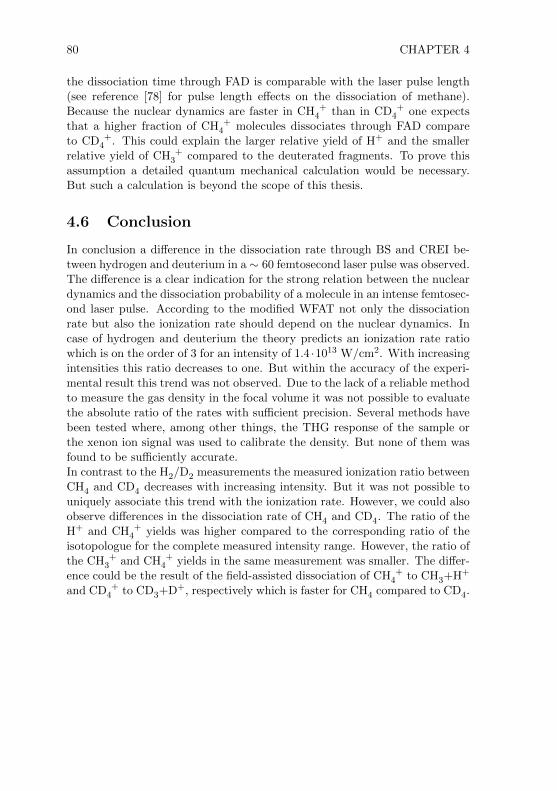
80 CHAPTER 4
the dissociation time through FAD is comparable with the laser pulse length(see reference [78] for pulse length effects on the dissociation of methane).Because the nuclear dynamics are faster in CH4
+ than in CD4+ one expects
that a higher fraction of CH4+ molecules dissociates through FAD compare
to CD4+. This could explain the larger relative yield of H+ and the smaller
relative yield of CH3+ compared to the deuterated fragments. To prove this
assumption a detailed quantum mechanical calculation would be necessary.But such a calculation is beyond the scope of this thesis.
4.6 Conclusion
In conclusion a difference in the dissociation rate through BS and CREI be-tween hydrogen and deuterium in a ∼ 60 femtosecond laser pulse was observed.The difference is a clear indication for the strong relation between the nucleardynamics and the dissociation probability of a molecule in an intense femtosec-ond laser pulse. According to the modified WFAT not only the dissociationrate but also the ionization rate should depend on the nuclear dynamics. Incase of hydrogen and deuterium the theory predicts an ionization rate ratiowhich is on the order of 3 for an intensity of 1.4 ·1013 W/cm2. With increasingintensities this ratio decreases to one. But within the accuracy of the experi-mental result this trend was not observed. Due to the lack of a reliable methodto measure the gas density in the focal volume it was not possible to evaluatethe absolute ratio of the rates with sufficient precision. Several methods havebeen tested where, among other things, the THG response of the sample orthe xenon ion signal was used to calibrate the density. But none of them wasfound to be sufficiently accurate.In contrast to the H2/D2 measurements the measured ionization ratio betweenCH4 and CD4 decreases with increasing intensity. But it was not possible touniquely associate this trend with the ionization rate. However, we could alsoobserve differences in the dissociation rate of CH4 and CD4. The ratio of theH+ and CH4
+ yields was higher compared to the corresponding ratio of theisotopologue for the complete measured intensity range. However, the ratio ofthe CH3
+ and CH4+ yields in the same measurement was smaller. The differ-
ence could be the result of the field-assisted dissociation of CH4+ to CH3+H+
and CD4+ to CD3+D+, respectively which is faster for CH4 compared to CD4.

Chapter 5
Photoelectron Diffractionfrom H2, D2, CH4 and CD4
In this chapter angle-resolved momentum distribution spectra of photoelec-trons from strong-field ionization of H2, D2, CH4 and CD4 will be presented.The spectra were measured for laser pulses with center wavelengths of 800nm and 1800 nm. The spectra of the corresponding isotopologues should dif-fer due to the different nuclear dynamics between ionization and rescattering.Also the results of ab-initio calculations of the elastic scattering cross sectionare presented. In this context a short introduction to the R-matrix programQuantemol will be given.
5.1 Introduction
In chapter 3 experimental results are presented which clearly show a changeof the angular distribution of the high-energy photoelectrons for pump-probedelays at which the axis distribution of the NO molecules changes significantly.It is argued that the change of the momentum distribution is related to thealignment dependence of the elastic-scattering differential cross section (DCS).This explanation is based on the quantitative rescattering theory (QRS) [21,23, 40] developed by C. D. Lin and coworkers. They showed that the high-energy photoelectron momentum distribution D(p, θ) can be expressed as
D(p, θ) = W (pr)σ(pr, θr) (5.1)
where σ(pr, θr) is the DCS of the parent ion as a function of the scatteringmomentum pr, the scattering angle θr and W (pr), the momentum distributionof the returning electron. The momentum p and angle θ are the laboratory-frame momentum polar coordinates of the electron. Shortly after the QRStheory was published M. Okunishi at al. [20] presented experimental photo-electron momentum distribution spectra for rare gas atoms where they showed
81
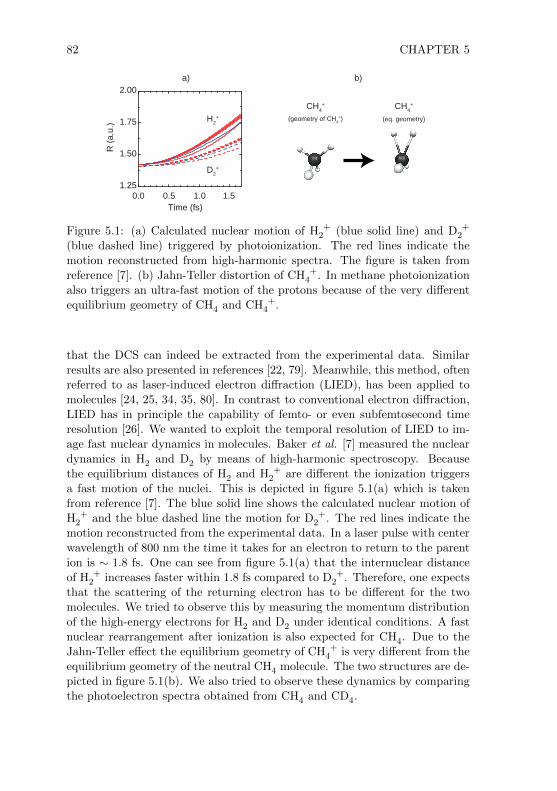
82 CHAPTER 5
Time (fs)
1.25
1.50
1.75
2.00
R (a
.u.)
0.0 1.50.5 1.0
a) b)
H2+
D2+
CH4+ CH4
+
(geometry of CH4+) (eq. geometry)
Figure 5.1: (a) Calculated nuclear motion of H2+ (blue solid line) and D2
+
(blue dashed line) triggered by photoionization. The red lines indicate themotion reconstructed from high-harmonic spectra. The figure is taken fromreference [7]. (b) Jahn-Teller distortion of CH4
+. In methane photoionizationalso triggers an ultra-fast motion of the protons because of the very differentequilibrium geometry of CH4 and CH4
+.
that the DCS can indeed be extracted from the experimental data. Similarresults are also presented in references [22, 79]. Meanwhile, this method, oftenreferred to as laser-induced electron diffraction (LIED), has been applied tomolecules [24, 25, 34, 35, 80]. In contrast to conventional electron diffraction,LIED has in principle the capability of femto- or even subfemtosecond timeresolution [26]. We wanted to exploit the temporal resolution of LIED to im-age fast nuclear dynamics in molecules. Baker et al. [7] measured the nucleardynamics in H2 and D2 by means of high-harmonic spectroscopy. Becausethe equilibrium distances of H2 and H2
+ are different the ionization triggersa fast motion of the nuclei. This is depicted in figure 5.1(a) which is takenfrom reference [7]. The blue solid line shows the calculated nuclear motion ofH2
+ and the blue dashed line the motion for D2+. The red lines indicate the
motion reconstructed from the experimental data. In a laser pulse with centerwavelength of 800 nm the time it takes for an electron to return to the parention is ∼ 1.8 fs. One can see from figure 5.1(a) that the internuclear distanceof H2
+ increases faster within 1.8 fs compared to D2+. Therefore, one expects
that the scattering of the returning electron has to be different for the twomolecules. We tried to observe this by measuring the momentum distributionof the high-energy electrons for H2 and D2 under identical conditions. A fastnuclear rearrangement after ionization is also expected for CH4. Due to theJahn-Teller effect the equilibrium geometry of CH4
+ is very different from theequilibrium geometry of the neutral CH4 molecule. The two structures are de-picted in figure 5.1(b). We also tried to observe these dynamics by comparingthe photoelectron spectra obtained from CH4 and CD4.

PHOTOELECTRON DIFFRACTION 83
5.2 Experimental Details
For this experiment the VMIS was operated in the electron imaging mode. Afraction of the laser output with a center wavelength of 800 nm and a pulselength of 40 ± 5 fs was focused into the center of the VMIS with a sphericalmirror (f = 100 mm, mounted inside the VMIS). Additionally, the laser in-tensity and pulse length fluctuations were recorded. This was done using theidentical setup as described in section 4.2.1. A sketch of the setup is givenin figure 4.1. The only difference was that for this experiment the intensitywas adjusted with an iris placed in front of the VMIS. The measurementswere also repeated using the output of an optical parametric amplifier (OPA,LightConversion HE-TOPAS-C) which was tuned to generated pulses with acenter wavelength of 1800 nm. For measurements with the OPA no otheroptical elements were used except for silver mirrors. The intensity was ad-justed with an iris. To monitor the intensity a special photodiode (ThorlabsDET10D, wavelength range 1200 - 2600 nm) was placed behind the last mirror.The light leaking through the mirror was enough to obtain a clear response ofthe photodiode. For all measurements a leak valve (Lenox Laser, orifice 10µm) was used (see section 2.1). All samples were measured pure. The voltageapplied to the repeller and extractor was -10.00 kV and -8.24 kV, respectively.The integration time was between several hours and three days. In parallel,the signals of the photodiodes were recorded.
5.3 Calculation of Differential Cross Sections
During the discussion of the NO experiment (chapter 3) it was already men-tioned that the program Quantemol was used to calculate the DCS. Before theresults of the calculations are presented a short introduction to the programwill be given. The focus will be on how a calculation is started and what theoutput file contains.
5.3.1 Using Quantemol
The program used for this work was Quantemol-N version 4.4b. The programcalculates the differential scattering cross section of atoms and molecules basedon the R-matrix method [81]. The idea behind the R-matrix method is to di-vide the space into two regions: an inner region where physics is complex andan outer region where the process can be described by simplified one-electronscattering equations. To solve the problem in the inner region Quantemol
uses quantum chemistry methods and for the outer region an asymptoticelectron-atom scattering algorithm. Quantemol has a graphical user inter-face which leads stepwise through all necessary inputs. The following inputsare requested:

84 CHAPTER 5
1. Molecule definition: Molecular formula including charge (e.g. H2+, Ne+
etc.).
2. Coordinate entry: Cartesian coordinates of each atom in angstrom.When placing the molecule consider that the calculations are done withrespect to an electron beam pointing along the z axes form positive tonegative z values. Additionally, one should know that for molecules witha specific orientation the DCS is only computed in the xz plane.
3. Symmetry definition: Select the symmetry group of the molecule. Thefollowing point groups can be selected: C1, Ci, Cs, C2, C2h, C2v, D2, D2h.Additionally, the non-redundant atoms need to be defined. The non-redundant atoms are those from which all other atoms can be generatedby applying symmetry operations of the selected point group.
4. Electronic structure: Select the electronic structure including the chargeof the molecule. If ”optimize electronic configuration automatically”is selected, no further input is required. Else the electronic structureneeds to be specified. Therefore, the number and symmetry of singlyand doubly occupied orbitals has to be known.
5. Target Model: One can either choose Hartree Fock (HF) or configurationinteraction (CI). Additionally one has to choose a basis set. There isalso the possibility to use user-defined basis sets. The basis set has tobe in the SUPERMOLECULE format. Additional basis sets can bedownloaded from http://bse.pnl.gov/bse/portal.
6. Scattering parameters: In this step the scattering parameters are de-fined. This includes the electron scattering energies and the radius ofthe R-matrix sphere with respect to the center of mass in atomic units.
7. Electron attachment: For scattering calculations this input form can beskipped.
8. Advanced settings: To enable scattering cross-section calculations a tickhas to be set for the option ”Enable advanced options”. Then one canchoose ”Calculate differential and momentum transfer cross sections”.If this option is selected the program calculates the DCS averaged overall orientations. If the DCS of a defined orientation is needed, the op-tion ”Calculate Aligned molecule cross section” has to be selected. Theorientation of the molecule is defined by the three Euler angles α, β andγ which correspond to a rotation of the molecule around the z axis, yaxis and again z axis of the initial frame. In matrix representation thefull rotation can be written as
R = Rz(γ)Ry(β)Rz(α) (5.2)

PHOTOELECTRON DIFFRACTION 85
where Rz and Ry represent the rotation matrix
Rz(α) =
cos(α) sin(α) 0− sin(α) cos(α) 0
0 0 1
(5.3)
and
Ry(α) =
cos(α) 0 − sin(α)0 1 0
sin(α) 0 cos(α)
. (5.4)
For each of the Euler angles a start, stop and step value have to bedefined. All inputs are separated by commas. The final input is:
[αstart, αstop, αsteps, βstart, βstop, βsteps, γstart, γstop, γsteps].
If the input is for example: [0, 180, 2, 0, 180, 1, 0, 180, 1], Quantemolwill only calculate the DCS for the following two orientations:
(a) α = 0, β = 0, γ = 0 and
(b) α = 90, β = 0, γ = 0.
9. Review input parameters: In the last step one can check all inputs andsave the input file. After saving has been completed one can start thecalculation.
After the calculation is finished Quantemol saves all the output data in thesubdirectory workspace/project automatically. In the project folder a file andfolder is generated with the same name as given by the user for the input file.The content of the file includes all information which is displayed during thecalculation. This file is useful if an error occurred during the calculation. Ifthe program finishes without error the calculated DCS for a randomly orientedsample is found in the subdirectory “polyDCS outputs”. The DCS for alignedmolecules is saved in the subdirectory “Aligned” whereas for each orientationa file is generated labeled by the corresponding Euler angles, i.e. “α β γ.dat”.In the output files for a randomly oriented sample 0◦ indicates forward scatter-ing whereas in the output for the aligned molecules 0◦ means that the electronis backscattered.

86 CHAPTER 5
Scattering angle α (deg.)
Sca
tterin
g en
ergy
E (
eV)
0 50 100 150
10
20
30
40
50
60
70
σ(α,
E)
(10−
16 c
m2 /s
r)
0.1
1
10
Figure 5.2: Averaged DCS σ(α,E) for H2+ as a function of the scattering
angle α and scattering energy E. For α = 0◦ the electron is backscattered.The distance between the two protons was set to 0.753 A. The result representsan averaged DCS where the orientation-dependent ionization rate was takeninto account (see text for details). The structures observed for scatteringenergies above 40 eV may be artifacts of the calculations.
5.3.2 Calculated DCS
The averaged DCS σ(α,E) for H2+ for an internuclear distance of 0.753 A is
given in figure 5.2. The averaged DCS σ(α,E) was calculated using equa-tion 3.33 where σxz(α,E, φi, θj) represents the output of Quantemol for agiven orientation of the molecule and f(θ) = Γn(θ)A(θ). The definition ofσxz(α,E, φi, θj) and the angles α, φ and θ are given in section 3.3.3. Becausethe sample molecules were randomly oriented the weighting factor was just afunction of the orientation-dependent ionization rate, i.e. f(θ) = Γn(θ). ForΓn(θ) the experimental result given in reference [67] was used. It is defined
as Γn(θ) =√w2⊥ sin2(θ) + w2
‖ cos2(θ) with w‖/w⊥ = 1.32. The calculations in
Quantemol were done using cc-pVTZ as basis set and the HF method. The R-matrix radius was set to 10 a.u.. The DCS σxz(α,E, φi, θj) was then calculatedfor θ = 0◦, 5◦, 10◦, . . . , 90◦ and φ = 0◦, 10◦, 20◦, . . . , 360◦.According to the calculation of Baker et al. [7] (figure 5.1(a)) the internucleardistance R increases from 0.753 A to 0.927 A for H2
+ and from 0.747 A to0.840 A for D2
+ within ∆t = tr − t0 = 1.8 fs after the molecule was ionized.The delay ∆t corresponds to the transit time of an electron removed from themolecules by an intense 800-nm laser field at ωt0 = 14◦. The electron will thenreturn to the parent ion at ωtr = 260◦ [40]. Due to the different internucleardistances R of H2
+ and D2+ at the time of the return the subsequent scattering
process and hence the final momentum distribution spectrum should also bedifferent. This difference can be estimated by comparing the DCS calculatedfor different R. Because R varies only little within 1.8 fs the result is very

PHOTOELECTRON DIFFRACTION 87
Scattering angle α (deg.)
Sca
tterin
g en
ergy
E (
eV)
0 50 100 150
10
20
30
40
50
60
70
Nor
m. d
iffer
ence
−1
−0.5
0
0.5
1
Figure 5.3: Normalized difference DR1, R2(α,E) calculated for R1 = 0.927 A(internuclear distance of H2
+ at ∆t = 1.8 fs) and R2 = 0.840 A (internucleardistance of D2
+ at ∆t = 1.8 fs).
similar to the result presented in figure 5.2 for R = 0.753 A. To visualize thedifferences it is useful to calculate the normalized difference
DR1, R2(α,E) =2(σR1(α,E)− σR2(α,E))
σR1(α,E) + σR2(α,E)(5.5)
where σR1(α,E) and σR2(α,E) represent the averaged DCS calculated for aninternuclear distance of R1 and R2, respectively. The obtained normalizeddifference DR1, R2(α,E) for R1 = 0.927 A (internuclear distance of H2
+ at∆t = 1.8 fs) and R2 = 0.840 A (internuclear distance of D2
+ at ∆t = 1.8 fs)is given in figure 5.3. The large differences above a scattering energy of 30 eVclose to a scattering angle α = 100◦ are artifacts. At these positions the DCSis close to zero (see figure 5.2) and small deviations in the calculation lead tolarge normalized differences. Also the oscillation of the normalized differencebetween negative and positive values is most probably due to the limitedaccuracy of the calculation. For scattering energies below 30 eV the resultdoes not show oscillations. In this energy region the normalized difference ispositive for all scattering angles. For a better view the result for DR1, R2(α,E)is shown for some selected scattering energies E as a function of the scatteringangle α in figure 5.4.To the knowledge of the author the temporal evolution of the nuclear struc-ture of CH4 and CD4 after ionization was not known in detail. It was thusnot possible to calculate the normalized difference between the DCS of CH4
+
and CD4+ 1.8 fs after ionization. Instead, one can compare the DCS for the
cation with the structure of the neutral molecule (Td symmetry) and the DCSobtained for the equilibrium structure of the cation (C2v symmetry). Due tothe Jahn-Teller distortion the two structures are completely different. For the

88 CHAPTER 5
Scattering angle α (deg.)N
orm
. diff
eren
ce
0 50 100 1500
0.2
0.44 eV
12 eV
20 eV
28 eV
Figure 5.4: Same result as shown in figure 5.3 for some selected scatteringenergies.
tetrahedral cation a C-H bond length of 1.087 A and HCH angle of 109.47◦ wasassumed [82]. The angles and bond lengths for the equilibrium geometry ofCH4
+ are given in table 5.1. The values are taken from the NIST database [83]and represent the result of an ab-initio calculation (basis set: aug-cc-pVTZ,method: coupled cluster, CCSD(T)). The given angles and bond lengths ofCH4
+ are comparable to the experimental values of CD2H2+ given in reference
[84]. The calculated structure should thus be close to the real geometry of themethane cation.
C-H1, C-H2 C-H3, C-H4 6 H1CH2 6 H3CH4 6 H2CH3(A) (A) (◦) (◦) (◦)
1.08 1.183 125.5 55.3 113.9
Table 5.1: Ab-initio structure for the ground state of CH4+. The values are
taken from the NIST database (basis set: aug-cc-pVTZ, method: coupledcluster, CCSD(T)) [83].
Because of its high symmetry, we approximate the ionization rate of methaneas orientation independent and therefore directly use the Quantemol output fora randomly oriented sample. The results for the tetrahedral and equilibriumstructure of CH4
+ are given in figure 5.5(a) and (b), respectively. For the twocalculations using the HF method the cc-pVDZ basis set was selected. Theradius of the R-matrix was set to 10 a.u.. The normalized difference of thetwo results is shown in figure 5.6. This difference image only represents anupper limit of what can be expected from the experiment. Nevertheless, thisresult shows the strong effect of the structure on the DCS, especially for lowscattering energies.

PHOTOELECTRON DIFFRACTION 89
Scattering angle α (deg.)
Sca
tterin
g en
ergy
E (
eV)
a)
0 1000
10
20
30
40
Scattering angle α (deg.)
Sca
tterin
g en
ergy
E (
eV)
b)
0 1000
10
20
30
40
σ(α,
E)
(10−
16 c
m2 /s
r)
0.0001
0.01
1
100
Figure 5.5: Calculated DCS for CH4+ with a tetrahedral structure (a) and for
the CH4+ in the ground state (Jahn-Teller distorted geometry) (b).
Scattering angle α (deg.)
Sca
tterin
g en
ergy
E (
eV)
0 1000
10
20
30
40
Nor
m. d
iffer
ence
−1
−0.5
0
0.5
1
Figure 5.6: Normalized difference of the result given in figure 5.5 for thetetrahedral and equilibrium structure of CH4
+.
5.4 Experimental Results
At first glance this experiment seemed straightforward. The optical setup wassimple and the calculations predicted large effects. However, it turned outto be very challenging. The main problem was the long-term stability of thelaser. To obtain a sufficient signal-to-noise ratio it was necessary to integratethe photoelectron signal for several hours. During this time the laser intensityand the pulse lengths were changing. Also pointing instabilities were observed.All these variations influence the momentum spectrum of the photoelectronsdirectly. Without any further information it was thus not possible to assignthe observed differences to target specific features. To solve this problemwe started recording the laser intensity in parallel and saved the photoelec-tron spectrum every second. For the further analysis only those spectra wereused for which the corresponding intensity signal was within predefined lim-its. However, we still observed difference images which were not reproducible.

90 CHAPTER 5
Mean electron energy (eV)N
umbe
r of
spe
ctra
3.6 3.8 4 4.20
200
400
Figure 5.7: Number of measured spectra for a given mean energy of the pho-toelectrons. The blue line represents the H2 data set and the red line theD2 data set. Only the spectra with a mean energy within the energy rangeindicated by the dashed black lines were used for further analysis.
Therefore, we additionally recorded the intensity of the second-harmonic lightwhich was generated with a small fraction (∼ 1%) of the initial beam. Due tothe non-linearity of the process, the second-harmonic signal was better suitedto monitor intensity and pulse-length fluctuations. But also this method didnot provide satisfactory results. Finally, we used the photoelectron spectrumitself to characterize the laser pulse. The spectra were continuously recorded(1 s integration time) and saved. For each spectrum the mean electron energywas calculated. In this way one obtains an energy distribution as shown infigure 5.7. The red line corresponds to the number of measured H2 spectra asa function of the mean electron energy. The blue line represents the D2 mea-surement. The total acquisition time of all spectra was close to eight hours.Due to the continuous change of the laser parameters the maximum of the twofunctions do not coincide and only the spectra with a mean energy between3.80 eV and 4.03 eV could be used for the further analysis.From the selected spectra the mean spectra were calculated. The result isshown in figure 5.8(a) for H2 and in figure 5.8(b) for D2, respectively. Thecenter wavelength was 800 nm and the intensity (9 ± 1) · 1013 W/cm2. Thenormalized difference of the two spectra
DH2, D2(p) = 2
SH2(p)− SD2
(p)
SH2(p) + SD2
(p)(5.6)
where SH2(p) and SD2
(p) represent the momentum-resolved spectrum for H2
and D2, respectively, is given in figure 5.8(c). In the normalized differenceimage a clear periodic pattern is visible. It follows that the position of theATI peaks in the H2 and D2 spectra are shifted with respect to each other.This is an indication that the laser intensity for the two spectra was not iden-tical despite of the applied pre-selection. Nevertheless, this method led to thebest results as compared to the pre-selection based on the intensity or second-

PHOTOELECTRON DIFFRACTION 91
px (a.u.)
p z (a.u
.)
a)
−1 0 1
−1
0
1
px (a.u.)
p z (a.u
.)
b)
−1 0 1
−1
0
1
px (a.u.)
p z (a.u
.)
c)
−1 0 1
−1
0
1
Nor
m. d
iffer
ence
−1
−0.5
0
0.5
1
Yie
ld (a
rb. u
.)
0
1
2
3
4
5
ps
pr
α
Figure 5.8: (a) Angle-resolved momentum distribution spectrum of the pho-toelectrons from H2. (b) Same as (a) but for D2. (c) Normalized difference ofthe H2 and D2 spectra. The center wavelength of the laser was 800 nm andthe peak intensity was (9± 1) · 1013 W/cm2.
harmonic signal. However, for the rescattered (high-energy) photoelectronsthe normalized difference becomes zero. As explained in section 3.3.3 theseelectrons are located on a circle with radius pr in the momentum-resolved spec-tra whereas the center of the circle is shifted from the origin of the spectrumby ps. For the photoelectrons which reach the detector with energies close to10 Up the ratio between pr and ps is 1.26 [40]. The corresponding circle forpr = 0.71 a.u. is shown on top of the spectra in the figures 5.8(a)-(c). Thescattering angle α (see figure 5.8(a)) is defined such that for α = 0◦ the elec-tron is backscattered from the parent ion. The electron yield as function ofthe scattering angle α for pr = 0.71 a.u. is given in figure 5.9(a). The red solidline corresponds to the data obtained for H2 and the black dashed line for D2.The normalized difference between the two yield functions is shown in figure5.9(b) as red solid line. For scattering angles larger than 20◦ the difference iszero. The green line in figure 5.9(b) shows the differences obtained from theab-initio calculations presented above (a scattering momentum of pr = 0.71a.u. corresponds to a kinetic energy of 6.9 eV). The theoretical calculation

92 CHAPTER 5
a)
Scattering angle (deg.)
Nor
m. y
ield
(ar
b. u
.)
0 20 40 60 800.5
1
1.5
2
2.5b)
Scattering angle (deg.)
Nor
m. d
iffer
ence
0 20 40 60 80−0.2
0
0.2
0.4
Figure 5.9: (a) Electron yield as a function of the scattering angle α for H2 (redsolid line) and D2 (black dashed line). For α = 0◦ the electron is backscattered.(b) Normalized difference of the yield functions given in (a) (red line) togetherwith the calculated normalized difference (green line).
predicts a normalized difference of 0.3 which is almost constant with respectto the scattering angle. This is not in agreement with the experimental result.However, a constant offset is difficult to observe because one has to normalizethe spectrum by the total electron yield. This is necessary because the totalyield does also depend on the gas density in the focal volume which is differentfor H2 and D2.The measurements were repeated with pulses with a center wavelength of1800 nm. In an 1800-nm laser field the high-energy electrons take 4.1 fs toreturn to the parent ion, more than twice as long as in 800-nm laser field.Therefore, one expects to observe larger differences between the photoelectronspectra. However, the normalized difference between the two spectra given infigure 5.10(c) does not show large differences (the differences close to px = 0a.u. are caused by the Abel inversion). The complete measurement took 45hours. Within this time spectra with a total integration time of 25 hourswere recorded. The spectra were again sorted and selected based on the meanelectron energy. For H2 spectra with a total integration time of 76 minutesand for D2 38 minutes were used for the further analysis. The result for H2
and D2 are shown in the figures 5.10(a) and (b), respectively. The laser peakintensity was (9± 1) · 1013 W/cm2.The spectra obtained from CH4 and CD4 ionized by 800-nm laser pulses aregiven in figure 5.11(a) and (b), respectively. The laser peak intensity was(9 ± 1) · 1013 W/cm2. The normalized difference between CH4 and CD4,given in figure 5.11(c), also shows differences for electrons with low kineticenergy as observed for hydrogen. The shape of the pattern varies for differentmeasurements. However, a distinct pattern in the high-energy region was notobserved. For the rescattered electrons with scattering energy of pr = 0.71a.u (indicated as red solid circle in the spectra) the electron yield is extracted

PHOTOELECTRON DIFFRACTION 93
px (a.u.)
p z (a.
u.)
a)
−2 0 2−2
−1
0
1
2
px (a.u.)
p z (a.
u.)
b)
−2 0 2−2
−1
0
1
2
px (a.u.)
p z (a.
u.)
c)
−2 0 2−2
−1
0
1
2
Nor
m. d
iffer
ence
−1
−0.5
0
0.5
1
Yie
ld (
arb.
u.)
0
0.02
0.04
0.06
0.08
0.1
Figure 5.10: (a) Angle-resolved momentum distribution spectra of the photo-electrons from H2. (b) Same as (a) for D2. (c) Normalized difference of the H2
and D2 spectra. The center wavelength of the laser was 1800 nm. The laserpeak intensity was (9± 1) · 1013 W/cm2.
and shown in figure 5.12(a) for CH4 (red solid line) and CD4 (black dashedline). The normalized difference between the two functions is given in figure5.12(b). The results obtained for laser pulses with a center wavelength of 1800nm are shown in figure 5.13(a) and (b) for CH4 and CD4, respectively. Fromthe normalized difference image given in figure 5.13(c) one can see that thetwo spectra are nearly identical. However, the normalized difference becomespositive for high kinetic energies which was most probably due to differentlaser conditions. The assumption is based on the fact that the sensitivity ofthe sorting method was not sufficient.For the two isotopologues we could observe differences in the low-energy regionof the photoelectron spectra recorded with 800-nm laser pulses. From the NOexperiment presented in chapter 3 we knew that the pattern in this energyregion is very sensitive to the electronic and nuclear structure due to theinference of different electron trajectories. However, it was not possible todistinguish between differences which are caused by laser fluctuations anddifferences which are the result of a different electronic and nuclear structureof the targets.

94 CHAPTER 5
px (a.u.)
p z (a.
u.)
a)
−1 0 1
−1
0
1
px (a.u.)
p z (a.
u.)
b)
−1 0 1
−1
0
1
px (a.u.)
p z (a.
u.)
c)
−1 0 1
−1
0
1
Nor
m. d
iffer
ence
−1
−0.5
0
0.5
1
Yie
ld (
arb.
u.)
0
1
2
3
4
5
Figure 5.11: (a) Angle-resolved momentum distribution spectra of the photo-electrons from CH4. (b) Same as (a) for CD4. (c) Normalized difference ofthe CH4 and CD4 spectra. The laser peak intensity was (6± 1) · 1013 W/cm2.The center wavelength of the laser was 800 nm.
a)
Scattering angle (deg.)
Nor
m. y
ield
(ar
b. u
.)
0 20 40 60 800
1
2
3b)
Scattering angle (deg.)
Nor
m. d
iffer
ence
0 20 40 60 80−0.2
0
0.2
0.4
Figure 5.12: (a) Electron yield as a function of the scattering angle α forCH4 (red solid line) and CD4 (black dashed line). For α = 0◦ the electron isbackscattered. (b) Normalized difference of the yield functions given in (a).

PHOTOELECTRON DIFFRACTION 95
px (a.u.)
p z (a.
u.)
a)
−1 0 1
−1
0
1
px (a.u.)
p z (a.
u.)
b)
−1 0 1
−1
0
1
px (a.u.)
p z (a.
u.)
c)
−1 0 1
−1
0
1
Nor
m. d
iffer
ence
−1
−0.5
0
0.5
1
Yie
ld (
arb.
u.)
0
1
2
3
4
5
Figure 5.13: (a) Angle-resolved momentum distribution spectra of the photo-electrons from CH4. (b) Same as (a) for CD4. (c) Normalized difference ofthe CH4 and CD4 spectra. The center wavelength of the laser was 1800 nm.The laser peak intensity was (9± 1) · 1013 W/cm2.
But because the result obtained with an 1800-nm laser does not show any cleandifference in the low-energy region we had to conclude that the differencescaused by laser instabilities were dominating.
5.5 Conclusion
We have measured the photoelectron spectra for H2, D2, CH4 and CD4 strong-field ionized with laser pulses with center wavelengths of 800 nm and 1800nm. The spectra of the corresponding isotopologues were then compared.We found that the differences strongly depend on the intensity of the laserpulse. To reduce this effect several different methods were applied. First theintensity was monitored with a photodiode. Based on this signal the spectrawere sorted and compared. As a further improvement we recorded the second-harmonic signal which was generated from a small fraction of the ionizingpulse. Finally, the spectra were compared based on the mean electron energywhich was obtained from the spectrum themselves. This method led to thebest results but it did not completely remove the differences which were caused

96 CHAPTER 5
by small variations of the laser pulse properties. In the spectrum obtained forH2 and D2 with 800-nm laser pulses differences in the low-energy region of thephotoelectrons were observed which were absent in the spectra measured withan 1800-nm laser pulse. Therefore, we conclude that differences are mainlycaused by intensity fluctuations of the laser during the measurements. Forthe two wavelengths the strong differences for the rescattered electrons (high-energy photoelectrons) that were predicted by calculations were not observed.These conclusions also apply to CH4 and CD4. However, these results arenot a final proof that there are no differences between the spectra of thecorresponding isotopologues. In the future, technical improvements of the lasersystem may increase the stability and eliminate the need for a preselection ofthe spectra and exclude intensity fluctuations as the source of the differences.

Chapter 6
Strong-Field Ionization ofMethyl Halides with aPhase-Controlled Two-ColorLaser Field
In this chapter an experiment is presented in which methyl halides (CH3Xwhere X = F, Cl, Br, I) were investigated by means of angle-resolved momen-tum distribution spectroscopy of ions. Dissociative ionization and Coulombexplosion of the methyl halides were induced by an intense phase-controlledtwo-color laser field. At the beginning of this chapter a short introductionwill be given, followed by the explanation of the method and the descriptionof the optical setup. In the subsequent sections the results are presented anddiscussed. The chapter closes with the conclusion.
6.1 Introduction
The understanding of strong-field ionization of atoms and molecules is of greatimportance as it describes the initial step in phenomena like laser-inducedelectron diffraction, attosecond pulse generation or high-harmonic generation.Although Keldysh presented a theory about tunneling ionization already in themid-1960s [6], it still remains difficult to describe this process with adequateprecision especially for molecules. Tong et al. [85] adapted an atomic tunnelingionization theory to molecules known as molecular Ammosov-Delone-Krainovtheory (MO-ADK, the atomic ADK theory itself is related to the theory ofPerelomov, Popov, and Terent’ev, see reference [86] for a review of the earlyworks). From the MO-ADK theory it follows that the angular dependence ofthe tunneling ionization rate is strongly related to the shape of the highestoccupied molecular orbital (HOMO) [87]. Further, it predicts that the ion-
97

98 CHAPTER 6
ization rate is maximal if the electric field points in the opposite direction ofthe highest electron density of the HOMO, i.e. for an electron escaping in thedirection of highest electron density. But for the OCS molecule Holmegaard etal. showed experimentally that this is not the case [88]. They found that theionization rate was larger for an electron escaping from the oxygen end of themolecule, although the HOMO of OCS has a higher electron density on the Satom. Based on a different theory, a highly-simplified version of the strong-field approximation (SFA) which replaced the molecular orbital with an atomicorbital, the authors were able to explain the observation when the Stark shiftof the HOMO up to second order in the electric field was included in the theory[89]. The Stark shift of the HOMO is a simple approximation for the differ-ential Stark shifts of the neutral and cationic electronic ground states. Theexperiment presented by Holmegaard et al. was performed using circularlypolarized light. However, Hansen et al. could show that for linearly polarizedlight the ionization rate has a maximum when the field vector is perpendic-ular to the molecular axis [90]. In this case even the Stark-shift-correctedMO-ADK theory failed to predict the experimental result. In the previouslymentioned experiments [88, 90] the OCS molecules were initially aligned ororiented with a laser pulse. But it is also possible to obtain information aboutthe angular dependence of the tunneling ionization rate from a randomly ori-ented sample, e.g., when the molecules are ionized by an asymmetric field.An asymmetric field can be obtained when two pulses with frequency ω and2ω are superimposed with a fixed phase relation. Using this method Ohmuraet al. [91] studied the ionization of OCS. They observed that the electronswere preferentially removed from the part of the HOMO with the highest elec-tron density (from the sulfur atom of the OCS molecule). This is just theopposite result as for the case where the OCS molecules were ionized with asingle frequency pulse [88]. Besides that, Ohmura et al. showed that theirresult is in agreement with the theoretical calculations based on the weak-fieldasymptotic theory (WFAT) [49]. In contrast to MO-ADK and SFA the WFATalready includes the Stark effect [91]. However, a theory which could explainthe result of all experiments is, to the knowledge of the author, still missing.Therefore, it is essential that more experiments are realized based on whichthe strong-field-ionization theories can be further developed.Using the phase-controlled two-color field method CO and NO were also in-vestigated [92, 93]. The conclusion of these experiments was that the shapeof the HOMO dominates in determining the asymmetry of the ionization. Forboth molecules the result was also in qualitative agreement with MO-ADK andStark-shift corrected SFA calculations. In this chapter experimental results ofthe ionization asymmetry of the methyl halides (CH3X, with X = F, Cl, Br, I)measured by the same method will be presented. A similar study has alreadybeen published by Ohmura et al. [94]. They have used a time-of-flight spec-trometer whereas we have used a velocity-map-imaging spectrometer. This

STRONG-FIELD IONIZATION OF METHYL HALIDES 99
Time (arb. u.)
Am
plitu
de (
arb.
u.) ∆φ = 0
a)
−1 0 1−2
−1
0
1
2
Time (arb. u.)
∆φ = π/2
b)
−1 0 1−2
−1
0
1
2
Time (arb. u.)
∆φ = π
c)
−1 0 1−2
−1
0
1
2
Figure 6.1: (a)-(c) Two-color (ω/2ω) laser pulse for phase delays ∆φ = 0, π/2and π.
enabled us to observe new effects in angle- and momentum-resolved spectrawhich could not be measured by Ohmura et al.. Moreover, we have system-atically studied the role of the laser intensity on the observed fragmentationpatterns.
6.2 Experimental Details
When two linearly polarized, symmetric electric fields with frequency ω and2ω are superimposed with a fixed relative phase ∆φ between the two fields,i.e.
E(t) = E1(t) cos(ωt) + E2(t) cos(2ωt+ ∆φ), (6.1)
the resulting field E(t) is not necessarily symmetric. This is depicted in figure6.1(a)-(c) for ∆φ = 0, π/2, and π. For ∆φ = 0 the maximal amplitude islarger for positive values than for negative values of E(t). For ∆φ = π/2 oneobtains a symmetric pulse and for ∆φ = π it is again asymmetric with anamplitude maximum pointing downwards.When an intense asymmetric two-color pulse is focused on a randomly orientedsample, dissociative ionization and even Coulomb explosion of the molecules isinduced. In general these fragmentation reactions are orientation dependent.Mainly because of the orientation dependence of the initial step, the strong-field ionization of the molecule. But also the rate of the subsequent processeslike bond softening, non-sequential double ionization or charge-resonance-enhanced ionization (see chapter 4) show a certain angular dependence. There-fore, one obtains an asymmetric distribution of the fragments which is illus-trated in figure 6.2. In the figure the asymmetric pulse with a large amplitudepointing upwards is focused into the center of the VMIS where randomly ori-ented CO molecules in a molecular beam are ionized. Because CO moleculesionize faster when the electric field points from the C to the O atom a larger

100 CHAPTER 6
MCP detector
two-color laser field800 nm + 400 nm
O+
O+up
downe-lenses
e-field
Figure 6.2: Illustration of the experimental setup. The asymmetric two-colorpulse is focused in the VMIS where CO molecules are ionized. Upon ionizationthe molecules can dissociate. The resulting momentum distribution of the O+
(C+) fragments shows a clear up-down asymmetry.
fraction of O+ appear with a momentum pointing in this direction. This wasobserved by Li et al. [92]. Initially, the phase delay between the ω and 2ωpulse is not known and needs to be calibrated. Li et al. solved this problemby measuring the asymmetric momentum distribution of photoelectrons fromxenon and compared it with the result of a TDSE calculation. In this waythey could calibrate the phase precisely and could show that the maximal dis-tribution asymmetry of the O+ ions of the CO molecules coincides with themaximal field asymmetry. Therefore, the O+ ion signal can be used in ourexperiments to calibrate the relative phase ∆φ of the two-color field.
The optical setup used to generate the two-color field is depicted in figure 6.3.A vertical polarized pulse with center wavelength of 800 nm, a pulse durationof 50± 10 fs and an energy of ∼ 1.3 mJ first passed a β-barium-borate (BBO)crystal. The thickness of the crystal was 300 µm. Due to second-harmonicgeneration (SHG) in the BBO one obtains an additional 400-nm pulse afterthe crystal which is horizontal polarized. To rotate the polarization of the800-nm pulse a zeroth-order half-wave plate (at 800 nm) was used. After thehalf-wave plate both pulses were horizontal polarized. To adjust the intensityan iris was placed just in front of the VMIS. The two pulses entered the VMISthrough a sapphire window (2.6 mm thickness). A spherical mirror, mountedinside the VMIS chamber, with a focal length of f=100 mm focused the beambackwards into the center of the supersonic gas jet. The gas jet was formedby a pulsed Even-Lavie valve (orifice 150 µm, 1 kHz repetition rate). Thetarget molecules were all diluted in helium to a concentration of < 1%. Tocompensate the dispersion of the BBO, the half-wave plate and the sapphirewindow, 2.6 mm calcite and two UV fused silica plates with a total thicknessof 2.5 mm were placed in the optical beam path between the BBO and the

STRONG-FIELD IONIZATION OF METHYL HALIDES 101
BBO300 μm
UVFS1 mm
CaCO32.6 mm
λ/2 @ 800 nmwaveplate
sapphire window2 mm
VMIS
800 nms-polarized
800 nms-polarized
400 nmp-polarized
800 nmp-polarized
400 nmp-polarized
UVFS1.5 mm
θ
f = 100 mmspherical
mirror
iris
Figure 6.3: Optical setup used for the two-color experiments. See text forfurther details.
half-wave plate. One UV fused silica plate (1.5 mm thickness) was mountedon a motorized rotational stage (Newport PR50PP together with the controllerNewport ESP 100). By tilting this plate, the relative phase ∆φ between the ωand 2ω pulse was adjusted. The intensity of the 400-nm pulse was (22±3)% ofthe total intensity. If the dispersion of the initial laser pulse was optimized forsecond harmonic generation a conversion efficiency of 25% was reached. How-ever, for the experiment the dispersion of the laser was optimized in terms ofion yield leading to a reduction of the conversion efficiency. The VMIS wasoperated in the ion-imaging mode. The polarization of the two-color laserpulse was parallel to the multi-channel plate detector (MCP). Usually, 4.00kV and 3.14 kV were applied to the repeller and extractor plate, respectively.The MCP gain was switched such that only fragments with a specific mass-to-charge ratio were detected. The switching time was in the range of 100 nsto 300 ns. For each fragment 100 images were recorded each at a specific tiltangle of the 1.5 mm UV fused silica plate. The tilt angles ranged from 31◦ to41◦ and were equally spaced. To obtain the momentum-distribution spectrathe measured images were Abel inverted using an iterative inversion method.However, due to signal fluctuations and MCP sensitivity inhomogeneities theretrieved spectra can deviate from the real spectra. In some cases the in-version algorithm also gives negative numbers especially for momenta wherethe signal is close to zero or which are close to the symmetry axis of thespectrum. These momenta were localized by calculating the mean spectrum.Momenta with negative values in the mean spectra were then excluded fromthe further analysis. The spectra were further convoluted with a Gaussianfilter to reduce the high-frequency noise caused by the inversion. The fullwidth at half maximum of the filter function was 1% of the momentum detec-tion range. During each measurement session the four methyl halides (CH3X;X = F, Cl, Br, I) were measured using different intensities. The iris diameterwas between (1.6 ± 0.1) mm and (3.2 ± 0.1) mm which corresponds to pulse

102 CHAPTER 6
energies between ∼ 60 µJ and ∼ 200 µJ, respectively. First, an ion time-of-flight spectrum was recorded to determine which fragments occur for the givenintensities. From these data the timing for the MCP gain was derived. Forall intensities the phase-dependent angle-resolved momentum distributions ofCH3
+ fragments and halogen ions were measured. Additionally, also CO wasmeasured to calibrate the relative phase of the two-color field.
6.3 Electronic and Geometric Structure of MethylHalides
Table 6.1 gives the adiabatic ionization potential Ip, the permanent electricdipole moment µ0, the rotational constant B0 and the length of the C-X bondfor the methyl halides. The ionization potential decreases from CH3F to CH3I.In the same order the C-X bond length increases. In an experiment where allmolecules are measured under similar conditions the ionization rate will thusincrease from CH3F to CH3I. This is no further problem because we were onlyinterested in the angular distribution of the dissociation products and not inthe absolute ion yield. The methyl halides have a rather large rotationalconstant. Hence, it is safe to assume that within a 50 femtosecond laser pulsedynamic alignment or orientation of the molecules can be neglected. Besidesthat, the permanent dipole of all methyl halides points from the halogen tothe carbon atom [94] and the absolute values of the dipole are similar for allfour molecules.
Ip µ0 B0 RCX
(eV)(a) (D)(a) (MHz)(a) (A)(b)
CH3F 12.47 1.858 25536.12 1.383CH3
35Cl 11.22 1.8963 13292.95 1.785CH3
79Br 10.541 1.8203 9568.19 1.934CH3I 9.538 1.6406 7501.31 2.136
Table 6.1: Adiabatic ionization potentials Ip, electric dipole moment µ0, rota-tional constant B0 and C-X bond length RCX of the methyl halides. (a) valuestaken from reference [94]. (b) values taken from reference [83]. Table adaptedfrom reference [94].
Most theories which are currently used to calculate the ionization rate aresingle-active electron theories which can only be applied to one orbital at atime - usually the HOMO. Contributions of the lower lying orbitals are ne-glected because they are much smaller. As starting point to understand thefollowing experimental results it is thus helpful to study the structure of thehighest-lying orbitals. These can be calculated using standard quantum chem-

STRONG-FIELD IONIZATION OF METHYL HALIDES 103
istry programs such as Gaussian or GAMESS. In figure 6.4 the isocontours ofthe HOMO, HOMO-1 and HOMO-2 for all methyl halides are shown (GAMESSVersion 11; method: restricted HF; basis sets: aug-ccpVQZ for CH3F, CH3Cland CH3Br; Def2-QZVP for CH3I). The color indicates the sign of the wavefunction. The HOMO and HOMO-2 are both doubly degenerate and are there-fore additionally labeled with a and b. From the structure of the HOMO aand HOMO b one can see that for CH3F the amplitude of the wave functionis larger on the methyl side whereas for the other three molecules the largestamplitude is found on the halogen atom. According to the MO-ADK or SFAtheory one would thus expect that the maximum of the angle-dependent ion-ization rate should point towards the methyl part for CH3F and towards thehalogen atom for CH3Cl, CH3Br and CH3I. Further due to the existence of anodal plane containing the C-X axis in the HOMO the ionization rate parallelto the C-X axis should be minimal for all molecules. This also applies for theHOMO-2 orbitals because they also have a nodal plane containing the molec-ular axis. But in contrast to the HOMO the wave function of the HOMO-2 islarger on the methyl side for all molecules. The HOMO-1 has no nodal planeparallel to the C-X axis and the asymmetry of the wave function is small. Theangle-dependent ionization rate from the HOMO-1 should thus be similar forall methyl halides.The angle-dependent ionization rate of the HOMO is shown in the figure6.5(a)-(d). The angle θ is the polar angle between the electric field directionand the C-X axis. For θ = 0◦ the electron is removed from the methyl side(in the direction opposite to the electric field). The black line correspondsto the rate calculated using the partial Fourier transform method (PFT) [45].The calculations were done by D. Baykusheva for an intensity of 1014 W/cm2.Because the PFT theory does not include the Stark effect the obtained ratewas multiplied by the Stark-corrected tunnel ionization rate [95]
w(F ) =1
2κ(F )2
κ(F )−1
[2κ(F )3
F
] 2κ(F )
−1
exp
[−2κ(F )3
3F
]
× exp
{−6
[2
κ(F )2
] [F
κ(F )3
]},
(6.2)
where
κ(F ) =√
2Ieffp (F ). (6.3)
Equation 6.2 does also include a correction term to account for over-the-barrierionization [96]. The orientation dependence of w(F ) is introduced through theeffective ionization potential including the Stark effect up to second order inthe field [89]

104 CHAPTER 6
HOMO a
HOMO b
HOMO-1
CH3F CH3Cl CH3Br CH3I
HOMO-2 a
HOMO-2 b
Figure 6.4: Isocontours of the HOMO, HOMO-1 and HOMO-2 orbitals of themethyl halides. The color indicates the sign of the wave function. The HOMOand HOMO-2 orbitals are doubly degenerate and are labeled with a and b. Theorbital wave functions were calculated using the quantum chemistry programGAMESS.
Ieffp (F ) = Ip(0) + ∆µ · F +
1
2FT∆αF , (6.4)
where
∆µ = µM − µI, ∆α = αM −αI. (6.5)
Ieffp (F ) depends on the electric field vector F and thus on the orientation of
the molecule with respect to the field. The parameter µM and µI representthe dipole moment of the molecule and of the unrelaxed cation, respectively.The parameter αM and αI are the corresponding polarizability tensors andIp(0) the field-free ionization potential. In a first approximation the differ-ence between the two dipole moments, i.e. ∆µ, corresponds to the dipole

STRONG-FIELD IONIZATION OF METHYL HALIDES 105
of the HOMO. Hence, for CH3F, for example, ∆µ points along the CX axisin the direction of the halogen atom. From equation 6.4 one can see thatthe effective ionization potential Ieff
p is increased when the field F points inthe same direction as ∆µ leading to a suppression of the tunneling ioniza-tion. But following the argumentation of the PFT theory one would expectan increase of the ionization rate for this direction because the electron is re-moved from the side of the HOMO with the largest amplitude. Depending onthe field strength, the magnitude of ∆µ and ∆α the Stark effect can thuschange the ionization preference, obtained from the PFT calculations alone,completely. However, as expected from the structure of the HOMO the cal-culated orientation-dependent ionization rates have a minimum at θ = 0◦ andθ = 180◦. But one should keep in mind that these results may be different fromthe real ionization rate due to several reasons. First, the Stark-effect is notdirectly included in the PFT theory and the way it is introduced may lead toan overestimation of the effect. Second, the mixing of the degenerated orbitalsdue to the interaction with the laser field is neglected. Third, multi-orbitaleffects were not considered. The values of µ and α used for the calculations arelisted in table 6.2 where α‖ and α⊥ represent the polarizability of the HOMOparallel and perpendicular to the C-X bond. The dipole moment µ standsparallel to the C-X bond pointing from the methyl group to the halogen atomfor µ > 0.
µ α‖ α⊥(a.u.) (a.u.) (a.u.)
CH3F 0.767 2.22 4.87
CH3Cl -0.103 3.66 7.47
CH3Br -0.122 3.70 2.84
CH3I -0.160 5.41 4.30
Table 6.2: Values for the dipole moment µ and polarizability α‖ and α⊥ ofthe HOMO used for the PFT calculations.
More accurate results were obtained from the WFAT theory. As already men-tioned in the beginning, the WFAT treats the first-order Stark effect rigorously.Further, the mixing of the two degenerate orbitals in the laser field was alsotaken into account. The results for the new eigenfunctions ΨA and ΨB, whichare orientation-dependent linear combinations of the field-free orbitals, are in-dicated in the figures 6.5(a)-(c) as blue and green solid lines, respectively. TheWFAT calculations were done by O. Tolstikhin, T. Morishita, F. Jensen andL. Madsen [97]. The results for the different molecules can be compared based

106 CHAPTER 6
a)
Angle θ (deg.)
Nor
m. i
oniz
atio
n ra
te
0 50 100 1500
0.005
0.01
0.015
0.02b)
Angle θ (deg.)
Nor
m. i
oniz
atio
n ra
te
0 50 100 1500
0.01
0.02
c)
Angle θ (deg.)
Nor
m. i
oniz
atio
n ra
te
0 50 100 1500
0.005
0.01
0.015d)
Angle θ (deg.)
Nor
m. i
oniz
atio
n ra
te
0 50 100 1500
0.01
0.02
0.03
Figure 6.5: (a)-(d) Calculated normalized ionization rate as a function of theangle θ for the methyl halide molecules CH3X (X = F, Cl, Br, I). θ is definedas the angle between the direction in which the electron is removed and theC-X molecular axis. For θ = 0◦ the electron is removed from the methylside. The black lines indicate the ionization rate calculated based on the PFTmethod. The blue and green lines are the result of the WFAT theory for ΨA
and ΨB, respectively.
on the head-to-tail ionization asymmetry, which can be defined as
a =
∫ 90◦
0◦ Γ(θ) sin(θ)dθ −∫ 180◦
90◦ Γ(θ) sin(θ)dθ∫ 180◦
0◦ Γ(θ) sin(θ)dθ(6.6)
where Γ(θ) stands for the angle-dependent ionization rate. The results for theasymmetry a for the different models are given in table 6.3. From the WFATone obtains a positive asymmetry for CH3F for the two eigenfunctions. Thismeans that CH3F is preferentially ionized at the methyl group. For CH3Cl,CH3Br and for CH3I it follows that these molecules are ionized preferentiallyat the halogen atom. In general one can conclude that for CH3F the absoluteasymmetry is predicted to be larger compared to CH3Cl, CH3Br and CH3I.The results obtained from the PFT calculations are different. The asymmetryis negative for all molecules except for CH3Cl. The largest asymmetry isobtained for CH3Cl and CH3I. The large discrepancy between the PFT andWFAT results may be due to the overestimation of the Stark effect in the

STRONG-FIELD IONIZATION OF METHYL HALIDES 107
WFAT PFT
CH3FΨA 0.69
-0.81ΨB 0.58
CH3ClΨA -0.01
0.94ΨB -0.45
CH3BrΨA -0.20
-0.22ΨB -0.46
CH3IΨA -0.39
-0.96ΨB -0.43
Table 6.3: Calculated ionization asymmetry a for the methyl halides. Theasymmetry a is calculated based on the results shown in the figure 6.5(a)-(d).
Stark-corrected PFT calculation. As explained above the Stark-effect canchange the ionization preference completely and we will see that the PFTresults indeed disagree with the experimental observations.
6.4 Results
6.4.1 Ion Time-Of-Flight Spectra of Methyl Halides
The figures 6.6 to 6.9 show the ion time-of-flight spectra for the methyl halides(CH3X, X = F, Cl, Br, I) measured for three different laser peak intensities:(5 ± 2) · 1013 W/cm2, (1 ± 0.4) · 1014 W/cm2 and (1.6 ± 0.6) · 1014 W/cm2.The blue solid lines show the same data as the red lines just magnified by afactor of 20. In the spectra of the CH3F molecule the peak which correspondsto the parent ion appears at m/q = 34. The peaks at m/q = 31, 32, and 33correspond to the fragments CHxF+ with x = 0− 2. For the lowest intensity(figure 6.6(a)) the H+ yield is very small with respect to the CHxF+ fragmentsand one can conclude that the dominant reaction leading to these fragmentswas
CHxF+ → CHx−1F+ + H (6.7)
where x = 1 − 3. This also implies that the dissociation occurs sequentially.For higher intensities the H+ yield becomes large and other dissociation chan-nels leading to CHxF+ fragments, for example the Coulomb explosion of thedoubly-charged parent ion, can no longer be excluded. CHxCl+ fragments withx = 0 − 2 were also observed for methyl chloride (figure 6.7). But becausechlorine possesses two stable isotopes, 35Cl and 37Cl, two peaks correspondingto the singly charged parent ions appear at m/q = 50 and m/q = 52. Also

108 CHAPTER 6
m/q
Yie
ld (
arb.
u.)
a)
0 5 10 15 20 25 30 350
0.5
1
m/q
Yie
ld (
arb.
u.)
a)
0 5 10 15 20 25 30 350
0.5
1
m/q
Yie
ld (
arb.
u.)
c)
0 5 10 15 20 25 30 350
0.5
1
Figure 6.6: (a)-(c) Ion time-of-flight spectra of CH3F ionized by a two-colorfield for different laser peak intensities (red line). The intensities were (5 ±2) · 1013 W/cm2, (1 ± 0.4) · 1014 W/cm2 and (1.6 ± 0.6) · 1014 W/cm2. Thespectrum magnified by a factor 20 is shown as blue line.
for methyl bromide two isotopologues exist. Therefore, the parent ion peaksappear at m/q = 94 and m/q = 96 (figure 6.8(a)) for the molecules includ-ing 79Br and 81Br, respectively. On the left side of the peak at m/q = 94one can observe a shoulder in the magnified spectrum of CH3Br (blue line).This shoulder corresponds to the C79Br+ ion. Fragmentation of the methylbromide ion similar to the reaction 6.7 can thus not be excluded. For methyliodide only a single peak centered at m/q = 142 can be observed (figure 6.9).This peak corresponds to the parent ion but there was no sign that reactionsresulting in CHx I+ fragments with x = 0− 2 occurred. Indeed, also Liu et al.[98] did not observe these fragments.Heavier ions which could have been identified as originating from clusters werenot observed for any of the methyl halides. Particular attention was also paidto space-charge effects especially if samples with a low ionization potentialwere ionized with an intense laser pulse. Because space-charge effects affectthe expansion of the ion cloud, it is important that this effect is minimized bychoosing the concentration of the sample molecule carefully. In the ion TOFspectra space charge would lead to a broadening or even to a splitting of the
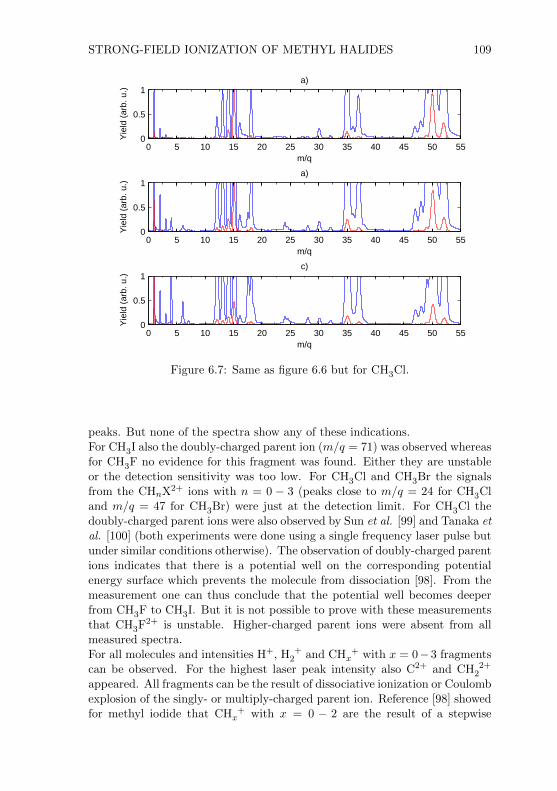
STRONG-FIELD IONIZATION OF METHYL HALIDES 109
m/q
Yie
ld (
arb.
u.)
a)
0 5 10 15 20 25 30 35 40 45 50 550
0.5
1
m/q
Yie
ld (
arb.
u.)
a)
0 5 10 15 20 25 30 35 40 45 50 550
0.5
1
m/q
Yie
ld (
arb.
u.)
c)
0 5 10 15 20 25 30 35 40 45 50 550
0.5
1
Figure 6.7: Same as figure 6.6 but for CH3Cl.
peaks. But none of the spectra show any of these indications.For CH3I also the doubly-charged parent ion (m/q = 71) was observed whereasfor CH3F no evidence for this fragment was found. Either they are unstableor the detection sensitivity was too low. For CH3Cl and CH3Br the signalsfrom the CHnX2+ ions with n = 0 − 3 (peaks close to m/q = 24 for CH3Cland m/q = 47 for CH3Br) were just at the detection limit. For CH3Cl thedoubly-charged parent ions were also observed by Sun et al. [99] and Tanaka etal. [100] (both experiments were done using a single frequency laser pulse butunder similar conditions otherwise). The observation of doubly-charged parentions indicates that there is a potential well on the corresponding potentialenergy surface which prevents the molecule from dissociation [98]. From themeasurement one can thus conclude that the potential well becomes deeperfrom CH3F to CH3I. But it is not possible to prove with these measurementsthat CH3F2+ is unstable. Higher-charged parent ions were absent from allmeasured spectra.For all molecules and intensities H+, H2
+ and CHx+ with x = 0−3 fragments
can be observed. For the highest laser peak intensity also C2+ and CH22+
appeared. All fragments can be the result of dissociative ionization or Coulombexplosion of the singly- or multiply-charged parent ion. Reference [98] showedfor methyl iodide that CHx
+ with x = 0 − 2 are the result of a stepwise

110 CHAPTER 6
m/q
Yie
ld (
arb.
u.)
a)
0 10 20 30 40 50 60 70 80 900
0.5
1
m/q
Yie
ld (
arb.
u.)
a)
0 10 20 30 40 50 60 70 80 900
0.5
1
m/q
Yie
ld (
arb.
u.)
c)
0 10 20 30 40 50 60 70 80 900
0.5
1
Figure 6.8: Same as figure 6.6 but for CH3Br.
dissociation of the CH3+ fragments. We thus assume that this is also the
case for the other methyl halides. At high intensity also the carrier gas isionized leading to the peak at m/q = 4 (He+). In all spectra peaks appear atm/q = 16 and m/q = 18 which is the result of the ionization and dissociativeionization of residual water molecules. In some spectra also traces of nitrogen(m/q = 28) and oxygen (m/q = 32) can be found. But the signals comingfrom water, nitrogen and oxygen were so small that they did not affect theactual measurements. For CH3Cl and CH3Br, H3
+ appeared at intermediatelaser intensities (figure 6.7(b) and 6.8(b)). H3
+ is the result of the Coulombexplosion of the doubly-charged parent ion whereas three hydrogen bonds arebroken and newly formed [99].In all spectra also charged halogen atoms were observed. For CH3F, F+ andF2+ could be identified in the spectrum. Unfortunately F3+ which shouldappear at m/q = 6.33 overlaps with the peak of C2+. But based on theyield ratio between F2+ and F+ one would expect that the F3+ yield is verysmall. For CH3Cl molecule the Cl+ and Cl2+ peaks are clearly visible in theTOF spectrum whereas the Cl3+ is too close to the C+ peak to be resolved.However, in the imaging mode where MCP gain can be switched as fast as100 ns it was possible to restrict the observation to either C+ or Cl3+. Formethyl chloride also very little Cl4+ ions (m/q = 8.75) have been observed for

STRONG-FIELD IONIZATION OF METHYL HALIDES 111
m/q
Yie
ld (
arb.
u.)
a)
0 20 40 60 80 100 120 1400
0.5
1
m/q
Yie
ld (
arb.
u.)
a)
0 20 40 60 80 100 120 1400
0.5
1
m/q
Yie
ld (
arb.
u.)
c)
0 20 40 60 80 100 120 1400
0.5
1
Figure 6.9: Same as figure 6.6 but for CH3I.
the highest laser peak intensity (figure 6.7(c)). For CH3Br halogen ions fromBr+ to Br4+ and for CH3I from I+ to I5+ were observed. The observationof multiple-charged halogen atoms indicates that highly charged parent ionswere produced in the laser pulse. Multiply-charged parent ions were onlyobserved up to CH3X2+. This shows that multiply-charged parent ions arevery unstable and decay rapidly to different fragments. From all the possibledecay channels we focused on those of the form
CH3X(p+q)+ → CH3p+ + Xq+. (6.8)
These reactions are usually referred to as Coulomb-explosion channels. TheCH3
p+ ions can further decay to smaller fragments and therefore we restrictedthe observation to CH3
+ and Xq+ ions. Because of the rapid dissociation ofthe multiply-charged parent ions one can assume that the angular distributionof these fragments are mainly defined by the orientation of the molecule at thetime of ionization. Hence, it is possible to obtain the head-to-tail asymmetriesof (dissociative) ionization from the angle-resolved momentum distributionspectra of the CH3
+ and Xq+ ions [92]. The result of these measurements willbe presented in the next section.

112 CHAPTER 6
6.4.2 Asymmetric Emission of Charged Fragments
For each measurement session the relative phase ∆φ was calibrated by mea-suring the asymmetric emission of the C+ and O+ ions from CO molecules.We define the emission asymmetry as
α(E) =
∫ 180◦
0◦ Y (E, θ)dθ −∫ 360◦
180◦ Y (E, θ)dθ∫ 360◦
0◦ Y (E, θ)dθ(6.9)
where E stands for the kinetic energy of the fragment and Y (E, θ) for theenergy- and angle-dependent fragment yield [92]. The emission direction θis defined such that θ = 90◦ and θ = 270◦ correspond to the emission of thefragment parallel to the polarization axis of the two-color laser field. The emis-sion asymmetry α(E) should not be confused with the ionization asymmetrya defined in section 6.3. Considering dissociative ionization of the molecule adirect relation between a and α(E) is only given if the first ionization step isthe decisive quantity and the influence of the two-color field on the subsequentdissociation is small. Because there are several different ionization mechanismswhich can lead to a doubly-charged parent ion (like non-sequential double ion-ization, sequential double ionization or charge-resonance-enhanced ionization)it is not obvious how Y (E, θ), obtained from Coulomb-explosion channels, isrelated to the first and second ionization step. For the Coulomb explosion ofhigher-charged parent ions it is even more complex. In a first approximationone can assume that Y (E, θ) is the product of the ionization asymmetry ofthe different ionization steps. Y (E, θ) was obtained from the VMIS operatedin the ion imaging mode (for further details see section 6.2).The asymmetry α(E) as a function of the phase delay ∆φ between the twofields for C+ from CO is shown in the middle panel of figure 6.10(a). A clearmodulation of the asymmetry is visible. The amplitude of this modulation isshown in the right panel whereas on the left panel the ion yield as a functionof the kinetic energy is given. The energy scale is identical in all panels. In theyield spectrum two peaks near 0 eV and 4 eV are visible which correspondsto the fragmentation of the ionized CO molecule into C+ + O and C+ + O+,respectively. Hence, one also expects a modulation of the emission asymmetryof the O+ ions which can be associated with the C+ + O+ dissociation channel.The asymmetry of the emission of the O+ ion is given in figure 6.10(b) togetherwith the yield spectrum and the modulation amplitude. As expected oneobserves the opposite modulation of the asymmetry compared to the C+ ions.The ion yield spectrum of O+ also shows two peaks. With the relation of thekinetic energies for a two-body fragmentation
mXEX = mYEY, (6.10)
where mX (mY) and EX (EY) stand for the mass and energy of the two differ-

STRONG-FIELD IONIZATION OF METHYL HALIDES 113
Kin
etic
ene
rgy
(eV
)
Yield (arb. u.)0 0.5 1
0
5
10
15
Phase delay (π)0 2 4
Asymmetry0 0.5 1
Kin
etic
ene
rgy
(eV
)
Yield (arb. u.)0 0.5 1
0
5
10
15
Phase delay (π)0 2 4
Asymmetry0 0.5 1
a)
b)
0.5
0
-0.5
Asym
metry
Figure 6.10: Density plot of the asymmetric emission α(E) (middle panel) ofC+ (a) and O+ (b) from CO as a function of the phase delay ∆φ between the800- and 400-nm fields. In the left panel the ion yield as a function of thefragment kinetic energy and in the right panel the modulation amplitude ofthe asymmetry are shown. The energy axis is identical in all panels. The laserpeak intensity was (1.9± 0.7) · 1014 W/cm2.
ent fragments, one can check whether the peaks close to 4 eV correspond tothe dissociation channel leading to C+ + O+ ions. In the figures 6.10(a) and(b) the corresponding energies are indicated in the left panels as green hori-zontal lines. The position of the green line in the spectrum of O+, calculatedfrom the peak position of the C+ yield, is very close to the peak maximum.One can thus conclude that these peaks indeed correspond to the Coulombexplosion of the CO molecule. This has been observed by Li et al. [92]. Theyhave also shown that the C+ ions are preferentially emitted in the directionopposite to the electric field maximum. Based on this result we have assignedthe phase ∆φ in the density plots of the emission asymmetry α(E).The phase-dependent asymmetry of the emission of CH3
+ fragments fromCH3F is shown in figure 6.11(a)-(c) for three different laser peak intensities.At low intensities a single peak at 1 eV is visible in the yield spectrum. Forthe highest intensity (figure 6.11(c)) a second peak at 3.4 eV appears. Theposition of this peak is marked with a green line. In the yield spectra the redlines mark the expected fragment kinetic energies assuming a dissociation asgiven in equation 6.8. The labels (p, q) indicate the charge of each fragment.

114 CHAPTER 6
(1, 1)
(1, 2)
Kin
etic
ene
rgy
(eV
)
Yield (arb. u.)0 0.5 1
0
5
10
15
Phase delay (π)0 2 4
Asymmetry0 0.5 1
(1, 1)
(1, 2)
Kin
etic
ene
rgy
(eV
)
Yield (arb. u.)0 0.5 1
0
5
10
15
Phase delay (π)0 2 4
Asymmetry0 0.5 1
(1, 1)
(1, 2)
Kin
etic
ene
rgy
(eV
)
Yield (arb. u.)0 0.5 1
0
5
10
15
Phase delay (π)0 2 4
Asymmetry0 0.5 1
a)
b)
c)
Asym
metry
-0.6
0.6
0
(1, 1)
(1, 2)
Kin
etic
ene
rgy
(eV
)
Yield (arb. u.)0 0.5 1
0
5
10
15
Phase delay (π)0 2 4
Asymmetry0 0.5 1
d)
Figure 6.11: Density plot of the asymmetry, yield spectrum and modulationamplitude similar to figure 6.10, but for CH3
+ ions from CH3F. The laserpeak intensity was (5 ± 2) · 1013 W/cm2 (a), (1 ± 0.4) · 1014 W/cm2 (b) and(1.6 ± 0.6) · 1014 W/cm2 (c). Figure (d) represents the same data as shownin (c) but the asymmetry is calculated based on the raw spectra (not Abelinverted). The green line marks the position of the peak at 3.4 eV. The
red lines indicate the kinetic energy ECH3
+
(p, q) calculated using equation 6.11 fordifferent dissociation channels.

STRONG-FIELD IONIZATION OF METHYL HALIDES 115
px (a.u.)
p z (a.u
.)
−100 0 100
−100
0
100
px (a.u.)
−100 0 100p
x (a.u.)
−100 0 100
Rel
. am
plitu
de
0
1
0.5
a) b) c)P
hase
-0.5
0
0.5
Figure 6.12: Momentum-resolved modulation amplitude (left) and modulationphase (right) of the CH3
+ ion yield from CH3F. The laser polarization wasparallel to pz. The laser peak intensity was (5±2) ·1013 W/cm2 (a), (1±0.4) ·1014 W/cm2 (b) and (1.6± 0.6) · 1014 W/cm2 (c).
The energies were calculated assuming two point charges qp and qq, separatedby the equilibrium distance Re between the C and F atom of the neutral CH3Fmolecule, i.e.
Efrag(p,q) =
mmol −mfrag
mmol
qpqqe2
4πε0Re(6.11)
where mmol is the mass of the molecule, mfrag is the mass of the fragment, e isthe electron charge and ε0 is the permittivity of vacuum [101]. The distanceRe for CH3F is listed in the table 6.1. For the (1, 1) dissociation channel oneobtains for the CH3
+ fragment a kinetic energy of 5.83 eV. This is about 2.4eV above the center of the peak marked by the green line. Corrales et al. [101]have also observed that the measured kinetic energy of CH3
+ for the Coulombexplosion of CH3I was smaller than the energy predicted by a similar estima-tion. But this is not surprising because the values obtained from equation6.11 represent an approximate upper limit since they rely on the assumptionof purely Coulombic repulsion. Corrales et al. also calculated the adiabaticpotential energy curve along the C-I bond for the neutral and doubly-chargedCH3I molecule. Based on this data they obtained kinetic energies for theCH3
+ fragments which are in agreement with the experimental results. Inthis way they could assign the peak in the CH3
+ spectrum of CH3I to the (1,1) dissociation channel. We thus assume that equation 6.11 also overestimatesthe fragment energy for CH3F and one can assign the peak at 3.4 eV to the(1, 1) Coulomb-explosion channel and the peak at 1 eV to the dissociation ofthe singly charged parent ion to CH3
+ + F. In figure 6.11(a) and (b) one cansee that the modulation of the asymmetry for the (1, 0) dissociation is large.The sign of the modulation is identical with the sign of the C+ fragment fromCO. This means that the dissociation of the parent ion is faster if the electricfield points from the methyl group to the fluorine atom. This was also ob-

116 CHAPTER 6
(1, 2)
(2, 2)
Kin
etic
ene
rgy
(eV
)
Yield (arb. u.)0 0.5 1
0
10
20
30
Phase delay (π)0 2 4
Asymmetry0 0.5 1
(1, 1)
(2, 1)
Kin
etic
ene
rgy
(eV
)
Yield (arb. u.)0 0.5 1
0
5
10
15
Phase delay (π)0 2 4
Asymmetry0 0.5 1
a)
b)
Asym
metry
-0.6
0.6
0
Figure 6.13: Similar to figure 6.11 but for F+ (a) and F2+ (b) from CH3F.The laser peak intensity was (1.6± 0.6) · 1014 W/cm2. The red lines indicatethe calculated kinetic energy for different dissociation channels. The greenline in (a) is drawn at 2.7 eV.
served for the (1, 1) Coulomb-explosion channel in figure 6.11(c) and even forCH3
+ ions with energies up to 15 eV. In the same figure one can also observea continuous shift of the modulation phase and a decrease of the modulationamplitude for energies below 5 eV. In principle these kinds of effects can becaused by an inaccurate Abel inversion of the raw spectra. This can be seenin the figures 6.12(a)-(c). They show the momentum-resolved modulation am-plitude and modulation phase of the CH3
+ fragments from CH3F for the samedata as shown in the figures 6.11(a)-(c). The polarization vector of the ω+2ωfield was parallel to the pz axis. The frequency for which the amplitude andphase was evaluated was determined using the asymmetry plots. In the figures6.12(a)-(c) the relative amplitude is shown for px < 0 and the correspondingphase for px > 0. For the highest intensity (figure 6.12(c)) one can clearlydistinguish the two patterns which correspond to the (1, 0) and (1, 1) dissoci-ation channel. For both channels the phase changes from positive to negativefor pz > 0 to pz < 0 (as expected from the evaluation of the asymmetry α(E))except for momenta close to px = 0. In this region the Abel inversion induceslarge signal fluctuations and the retrieved values can be negative. As explainedin section 6.2 negative values were not considered in the analysis. Therefore,it was not possible to retrieve the correct phase for momenta close to px = 0.

STRONG-FIELD IONIZATION OF METHYL HALIDES 117
Rel
. am
plitu
de
0
1
0.5
a) c)
Phase
-0.5
0
0.5
px (a.u.)
p z (a.u
.)
−100 0 100
−100
0
100
px (a.u.)
p z (a.u
.)
−200 0 200
−200
−100
0
100
200
Figure 6.14: Similar to figure 6.12 but for F+ (a) and F2+ (b) from CH3F.The laser peak intensity was (1.6± 0.6) · 1014 W/cm2.
These values are left white in the momentum-resolved modulation phase spec-tra. But the shift of the modulation phase is also observed if the asymmetry iscalculated based on the raw data. This is shown in figure 6.11(d). The phaseshift is less pronounced compared to figure 6.11(c). The fact that the shiftonly appears at high laser intensities for fragments with little kinetic energycould be an indication for a dissociation channel which changes its dissociationpreference depending on the field strength. It may also be due to a differentchannel which only becomes dominant at higher laser intensities. From theion time-of-flight spectrum of CH3F (figure 6.6(c)) it was known that for thehighest laser intensity F+ and F2+ ions appear. The asymmetric emission ofthese two fragments is shown in the figures 6.13(a) and (b), respectively. Theposition of the green line in figure 6.13(a) is calculated from the peak at 3.4eV in the spectrum of the CH3
+ fragment by using equation 6.10. The greenline is close to the maximum of the F+ yield at 3.0 eV. Hence, this peak cor-responds to the (1, 1) Coulomb-explosion channel of CH3F. The asymmetryis just the opposite as for the CH3
+ fragments. The shift of the modula-tion phase for energies below 1.2 eV was also observable at lower intensities.Therefore, this shift may originate from a second dissociation channel leadingto F+ fragments with kinetic energies close to zero whereby the dissociationasymmetry is opposite compared to the Coulomb-explosion channel. An evenstronger modulation was observed for the F2+ fragments which also show theopposite asymmetry compared to CH3
+. The maximum of the F2+ yield is at
7.1 eV, very close to the energy EF2+
(1, 2) which is obtained from equation 6.11
for the (1, 2) channel. This shows that the ionization asymmetry does notchange even if more than two electrons are removed. Unfortunately it was notpossible to measure the emission asymmetry for the F3+ fragments becauseof the low detection rate and the interference with the C2+ ions (due to thelimited switching speed of the MCP gain). For completeness, the momentumresolved modulation amplitude and phase for F+ and F2+ are given in figure

118 CHAPTER 6
(1, 1)
(1, 2)
Kin
etic
ene
rgy
(eV
)
Yield (arb. u.)0 0.5 1
0
5
10
15
Phase delay (π)0 2 4
Asymmetry0 0.5 1
(1, 1)
(1, 2)
Kin
etic
ene
rgy
(eV
)
Yield (arb. u.)0 0.5 1
0
5
10
15
Phase delay (π)0 2 4
Asymmetry0 0.5 1
(1, 1)
(1, 2)
Kin
etic
ene
rgy
(eV
)
Yield (arb. u.)0 0.5 1
0
5
10
15
Phase delay (π)0 2 4
Asymmetry0 0.5 1
a)
b)
c)
Asym
metry
-0.4
0.4
0
Figure 6.15: Similar to figure 6.11, but for CH3+ ions from CH3Cl. The laser
peak intensity was (5± 2) · 1013 W/cm2 (a), (1.0± 0.4) · 1014 W/cm2 (b) and(1.6± 0.6) · 1014 W/cm2 (c). The green solid line is plotted at 4.3 eV and thegreen dashed line at 7.7 eV. The dashed black line in the yield spectrum of(c) shows the magnified yield spectrum.
6.14(a) and (b), respectively.In figures 6.15(a)-(c) the asymmetric emission of CH3
+ from CH3Cl is shownfor different laser intensities. Similar to CH3F one observes a prominent peakin the yield spectrum at 0.5 eV for all intensities. Due to the low energy thispeak can only correspond to the dissociation of the singly-charged parent ionto CH3
+ + Cl. Compared to the emission of CH3+ from CH3F the asymme-
try has the opposite sign meaning that dissociation occurs preferentially if thefield asymmetry points from the chlorine atom to the methyl group. In thedensity plot of the asymmetry in figure 6.15(a), which shows the result for

STRONG-FIELD IONIZATION OF METHYL HALIDES 119
(1, 3)
(2, 3)
Kin
etic
ene
rgy
(eV
)
Yield (arb. u.)0 0.5 1
0
10
20
30
Phase delay (π)0 2 4
Asymmetry0 0.5 1
(1, 2)
(2, 2)
Kin
etic
ene
rgy
(eV
)
Yield (arb. u.)0 0.5 1
0
5
10
15
20
Phase delay (π)0 2 4
Asymmetry0 0.5 1
(1, 1)
(2, 1)
Kin
etic
ene
rgy
(eV
)
Yield (arb. u.)0 0.5 1
0
5
10
Phase delay (π)0 2 4
Asymmetry0 0.5 1
a)
b)
c)
Asym
metry
-0.4
0.4
0
Figure 6.16: Similar to figure 6.13, but for Cl+ (a), Cl2+ (b) and Cl3+ (c) fromCH3Cl. The laser peak intensity was (1.6± 0.6) · 1014 W/cm2. The positionsof the green solid and dashed line are related with the position of the greenlines shown in the figure 6.15(c) through equation 6.10.
the lowest laser intensity, one observes a clear modulation of the asymmetrybetween 0 eV and 4.2 eV. Within this energy range the phase of the modula-tion does not change. If the intensity is increased to (1 ± 0.4) · 1014 W/cm2
(figure 6.15(c)) a peak appears in the yield spectrum at 4.3 eV and a mod-ulation of the asymmetry up to 9.5 eV becomes visible. But the sign of theasymmetry changes at 4.2 eV. In figure 6.15(c) the largest modulation ampli-tude is observed at 7.7 eV and is marked as green dashed line. The width ofthe peak at 7.7 eV indicates that the energy distribution of the fragments isbroad. In the magnified yield spectrum (dashed black line) of figure 6.15(c)one can identify a shoulder at 7.7 eV. Therefore, one has to assume that at
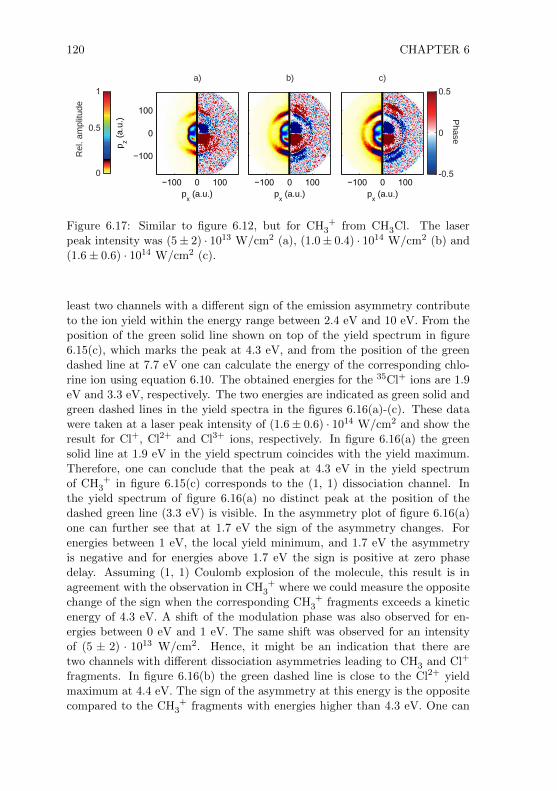
120 CHAPTER 6
px (a.u.)
p z (a.u
.)
−100 0 100
−100
0
100
px (a.u.)
−100 0 100p
x (a.u.)
−100 0 100
Rel
. am
plitu
de
0
1
0.5
a) b) c)
Phase
-0.5
0
0.5
Figure 6.17: Similar to figure 6.12, but for CH3+ from CH3Cl. The laser
peak intensity was (5± 2) · 1013 W/cm2 (a), (1.0± 0.4) · 1014 W/cm2 (b) and(1.6± 0.6) · 1014 W/cm2 (c).
least two channels with a different sign of the emission asymmetry contributeto the ion yield within the energy range between 2.4 eV and 10 eV. From theposition of the green solid line shown on top of the yield spectrum in figure6.15(c), which marks the peak at 4.3 eV, and from the position of the greendashed line at 7.7 eV one can calculate the energy of the corresponding chlo-rine ion using equation 6.10. The obtained energies for the 35Cl+ ions are 1.9eV and 3.3 eV, respectively. The two energies are indicated as green solid andgreen dashed lines in the yield spectra in the figures 6.16(a)-(c). These datawere taken at a laser peak intensity of (1.6± 0.6) · 1014 W/cm2 and show theresult for Cl+, Cl2+ and Cl3+ ions, respectively. In figure 6.16(a) the greensolid line at 1.9 eV in the yield spectrum coincides with the yield maximum.Therefore, one can conclude that the peak at 4.3 eV in the yield spectrumof CH3
+ in figure 6.15(c) corresponds to the (1, 1) dissociation channel. Inthe yield spectrum of figure 6.16(a) no distinct peak at the position of thedashed green line (3.3 eV) is visible. In the asymmetry plot of figure 6.16(a)one can further see that at 1.7 eV the sign of the asymmetry changes. Forenergies between 1 eV, the local yield minimum, and 1.7 eV the asymmetryis negative and for energies above 1.7 eV the sign is positive at zero phasedelay. Assuming (1, 1) Coulomb explosion of the molecule, this result is inagreement with the observation in CH3
+ where we could measure the oppositechange of the sign when the corresponding CH3
+ fragments exceeds a kineticenergy of 4.3 eV. A shift of the modulation phase was also observed for en-ergies between 0 eV and 1 eV. The same shift was observed for an intensityof (5 ± 2) · 1013 W/cm2. Hence, it might be an indication that there aretwo channels with different dissociation asymmetries leading to CH3 and Cl+
fragments. In figure 6.16(b) the green dashed line is close to the Cl2+ yieldmaximum at 4.4 eV. The sign of the asymmetry at this energy is the oppositecompared to the CH3
+ fragments with energies higher than 4.3 eV. One can
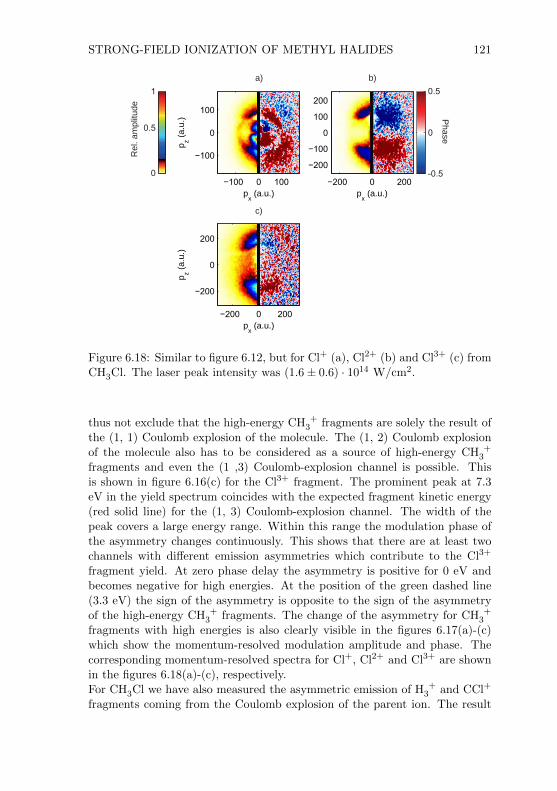
STRONG-FIELD IONIZATION OF METHYL HALIDES 121
px (a.u.)
p z (a.u
.)−100 0 100
−100
0
100
px (a.u.)
−200 0 200
−200
−100
0
100
200
Rel
. am
plitu
de
0
1
0.5
a) b)
Phase
-0.5
0
0.5
px (a.u.)
p z (a.u
.)
−200 0 200
−200
0
200
c)
Figure 6.18: Similar to figure 6.12, but for Cl+ (a), Cl2+ (b) and Cl3+ (c) fromCH3Cl. The laser peak intensity was (1.6± 0.6) · 1014 W/cm2.
thus not exclude that the high-energy CH3+ fragments are solely the result of
the (1, 1) Coulomb explosion of the molecule. The (1, 2) Coulomb explosionof the molecule also has to be considered as a source of high-energy CH3
+
fragments and even the (1 ,3) Coulomb-explosion channel is possible. Thisis shown in figure 6.16(c) for the Cl3+ fragment. The prominent peak at 7.3eV in the yield spectrum coincides with the expected fragment kinetic energy(red solid line) for the (1, 3) Coulomb-explosion channel. The width of thepeak covers a large energy range. Within this range the modulation phase ofthe asymmetry changes continuously. This shows that there are at least twochannels with different emission asymmetries which contribute to the Cl3+
fragment yield. At zero phase delay the asymmetry is positive for 0 eV andbecomes negative for high energies. At the position of the green dashed line(3.3 eV) the sign of the asymmetry is opposite to the sign of the asymmetryof the high-energy CH3
+ fragments. The change of the asymmetry for CH3+
fragments with high energies is also clearly visible in the figures 6.17(a)-(c)which show the momentum-resolved modulation amplitude and phase. Thecorresponding momentum-resolved spectra for Cl+, Cl2+ and Cl3+ are shownin the figures 6.18(a)-(c), respectively.For CH3Cl we have also measured the asymmetric emission of H3
+ and CCl+
fragments coming from the Coulomb explosion of the parent ion. The result

122 CHAPTER 6
Kin
etic
ene
rgy
(eV
)
Yield (arb. u.)0 0.5 1
0
5
10
Phase delay (π)0 2 4
Asymmetry0 0.02 0.04 0.06
Kin
etic
ene
rgy
(eV
)
Yield (arb. u.)0 0.5 1
0
0.5
1
Phase delay (π)0 2 4
Asymmetry0 0.02 0.04 0.06
a)
b)
Asymm
etry
-0.1
0.1
0
Figure 6.19: Similar to figure 6.11, but for H3+ (a) and CCl+ (b) from CH3Cl.
The laser peak intensity was (1.6 ± 0.6) · 1014 W/cm2. The position of thegreen line is 4.0 eV in (a) and 0.26 eV in (b), respectively.
is shown in figure 6.19(a) and (b), respectively. The yield maximum of theH3
+ fragments is at 4.0 eV (indicated as green solid line). The signal of H3+
shows a very weak modulation of the asymmetry. At zero phase delay theasymmetry is positive which means that the Coulomb explosion of the parention to H3
+ and CCl+ is slightly faster when the field maximum points from thehalogen atom to the methyl group. As expected for a two-body fragmentationthe modulation asymmetry of CCl+ has the opposite sign compared to H3
+.Using equation 6.10 one obtains from the peak position of H3
+ a correspond-ing energy of 0.26 eV for CCl+. This energy is indicated as green solid linein figure 6.19(b). At this position the yield spectrum of CCl+ has a shoulderon the high-energy side of the main peak at 0.05 eV. For completeness, themomentum-resolved amplitude and phase spectra for the two fragments aregiven in figure 6.20(a) and (b), respectively.The asymmetric emission of CH3
+ from CH3Br for different laser peak inten-sities are given in the figures 6.21(a)-(c) and the corresponding momentum-resolved spectra of the modulation amplitude and phase are shown in thefigures 6.23(a)-(c), respectively. Just as CH3Cl, CH3Br also tends to dissoci-ate faster to CH3
+ + Br if the field asymmetry points from the halogen atomto the methyl group.
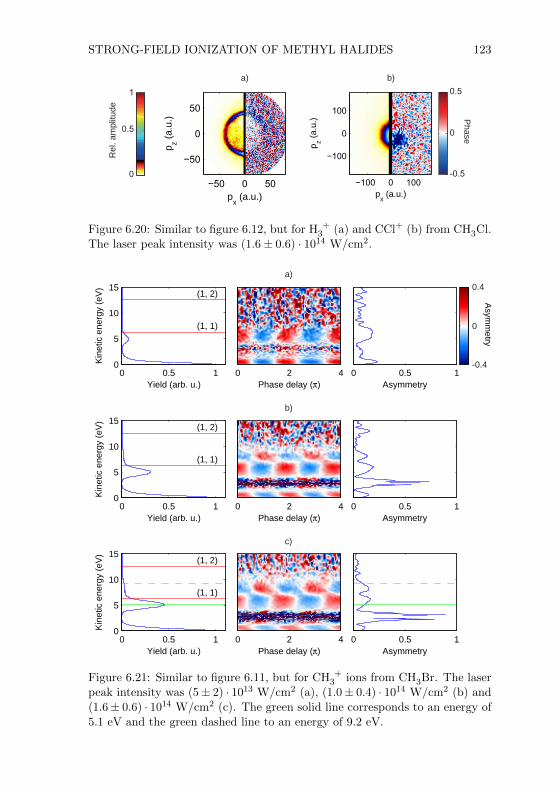
STRONG-FIELD IONIZATION OF METHYL HALIDES 123
px (a.u.)
p z (a.u
.)−50 0 50
−50
0
50
px (a.u.)
p z (a.u
.)
−100 0 100
−100
0
100 Phase
-0.5
0
0.5
Rel
. am
plitu
de
0
1
0.5
a) b)
Figure 6.20: Similar to figure 6.12, but for H3+ (a) and CCl+ (b) from CH3Cl.
The laser peak intensity was (1.6± 0.6) · 1014 W/cm2.
(1, 1)
(1, 2)
Kin
etic
ene
rgy
(eV
)
Yield (arb. u.)0 0.5 1
0
5
10
15
Phase delay (π)0 2 4
Asymmetry0 0.5 1
(1, 1)
(1, 2)
Kin
etic
ene
rgy
(eV
)
Yield (arb. u.)0 0.5 1
0
5
10
15
Phase delay (π)0 2 4
Asymmetry0 0.5 1
(1, 1)
(1, 2)
Kin
etic
ene
rgy
(eV
)
Yield (arb. u.)0 0.5 1
0
5
10
15
Phase delay (π)0 2 4
Asymmetry0 0.5 1
a)
b)
c)
Asymm
etry
-0.4
0.4
0
Figure 6.21: Similar to figure 6.11, but for CH3+ ions from CH3Br. The laser
peak intensity was (5± 2) · 1013 W/cm2 (a), (1.0± 0.4) · 1014 W/cm2 (b) and(1.6± 0.6) · 1014 W/cm2 (c). The green solid line corresponds to an energy of5.1 eV and the green dashed line to an energy of 9.2 eV.

124 CHAPTER 6
(1, 3)(2, 3)
Kin
etic
ene
rgy
(eV
)
Yield (arb. u.)0 0.5 1
0
5
10
15
20
Phase delay (π)0 2 4
Asymmetry0 0.5 1
(1, 2)(2, 2)
Kin
etic
ene
rgy
(eV
)
Yield (arb. u.)0 0.5 1
0
5
10
Phase delay (π)0 2 4
Asymmetry0 0.5 1
(1, 1)(2, 1)
Kin
etic
ene
rgy
(eV
)
Yield (arb. u.)0 0.5 1
0
2
4
6
Phase delay (π)0 2 4
Asymmetry0 0.5 1
a)
b)
c)
Asym
metry
-0.4
0.4
0
Figure 6.22: Similar to figure 6.11, but for Br+ (a), Br2+ (b) and Br3+ (c)from CH3Br. The laser peak intensity was (1.6 ± 0.6) · 1014 W/cm2. Thepositions of the green solid and dashed line are related with the position ofthe green lines in figure 6.21(c) through equation 6.10.
The same is also true for the Coulomb explosion of the doubly-charged par-ent ion which leads to the prominent peak at 5.1 eV. A change of the signof the asymmetry for CH3
+ fragments with high kinetic energies was alsoobserved. One can use again equation 6.10 to find the energy of the corre-sponding bromine ions for the different channels. For the (1, 1) channel at5.1 eV (indicated as green solid line in figure 6.21(c)) one obtains an energyof 0.97 eV for 79Br and for the second channel at 9.2 eV, (indicated as greendashed line in figure 6.21(c)) one obtains 1.75 eV. The two energies are markedwith green lines in the figures 6.22(a)-(c) which show the result for Br+, Br2+
and Br3+, respectively. The green solid line in figure 6.22(a) for Br+ is veryclose to the peak maximum at 1.1 eV. The asymmetry at this energy has the

STRONG-FIELD IONIZATION OF METHYL HALIDES 125
px (a.u.)
p z (a.u
.)
−100 0 100
−100
0
100
px (a.u.)
−100 0 100p
x (a.u.)
−100 0 100
Rel
. am
plitu
de
0
1
0.5
a) b) c)P
hase
-0.5
0
0.5
Figure 6.23: Similar to figure 6.12, but for CH3+ from CH3Br. The laser
peak intensity was (5± 2) · 1013 W/cm2 (a), (1.0± 0.4) · 1014 W/cm2 (b) and(1.6± 0.6) · 1014 W/cm2 (c).
opposite sign compared to the corresponding CH3+ peak and we can conclude
that the peak at 1.1 eV in the Br+ yield spectrum is indeed the result of theCoulomb explosion of the doubly-charged parent ion. A change of the asym-metry for Br+ at 9.2 eV (indicated as dashed green line) cannot be observed infigure 6.22(a). However, in the momentum-resolved spectrum given in figure6.24(a) one can observe a change of the modulation phase. In the spectrumthe momentum which corresponds to an energy of 1.75 eV is indicated as greendashed circle. Starting at pz = 137 a.u. and px = 0 a.u. and following thedashed circle the sign of the modulation changes from negative to positive.But the momentum range where the phase is negative is limited to momentawith small px values. Similar to Cl+ fragments from CH3Cl one can also ob-serve a shift of the modulation phase for Br+ fragments with kinetic energy< 0.5 eV. This might be the result of the dissociation of the parent ion throughchannels with different emission asymmetries. Phase shifts of the modulationwere also observed for Br2+ and Br3+ fragments. For both fragments the mod-ulation phase at the position of the green dashed line is opposite to the phaseobtained for the high-energy CH3
+ fragments. It is therefore very likely thatthe high-energy CH3
+ fragments are the result of the Coulomb explosion ofthe multiple charged parent ion. The change of the modulation phase is alsoclearly visible in the figures 6.23(b) and (c), respectively.Also for CH3Br the asymmetric emission of H3
+ and CBr+ fragments wasmeasured. The result is shown in figure 6.25(a), (b) and the correspondingmomentum-resolved modulation amplitude and phase spectra are given in fig-ure 6.26(a) and (b), respectively. The green line in the yield spectrum of figure6.25(a) marks the position of the yield maximum at 4.0 eV. This correspondsto an energy of 0.13 eV for the CBr+ fragment assuming a two-body fragmen-tation of the parent ion.

126 CHAPTER 6
px (a.u.)
p z (a.u
.)
−200 0 200−200
−100
0
100
200
px (a.u.)
−200 0 200
−200
0
200R
el. a
mpl
itude
0
1
0.5
a) b)
Phase
-0.5
0
0.5
px (a.u.)
p z (a.u
.)
−200 0 200
−200
0
200
c)
Figure 6.24: Similar to figure 6.12, but for Br+ (a), Br2+ (b) and Br3+ (c)from CH3Br. The laser peak intensity was (1.6± 0.6) · 1014 W/cm2.
The sign of the emission asymmetry of H3+ is identical to the low-energy
CH3+ fragments from CH3Br and hence also to the emission asymmetry of H3
+
from CH3Cl. However, the modulation amplitude is much larger in contrastto the amplitude obtained for H3
+ from CH3Cl. As expected, the modulationof CBr+ is opposite to the modulation of H3
+.For low intensities similar results were obtained for CH3I. Due to the low
ionization potential of CH3I the data presented in figure 6.27(a) was measuredat an intensity of (3 ± 1) · 1013 W/cm2 instead at (5 ± 2) · 1013 W/cm2 likethe other three molecules. For CH3I and intensity of (3 ± 1) · 1013 W/cm2
is enough to induce Coulomb explosion of the parent ion. This leads to thepeak at 4.7 eV (indicated as green solid line) in the yield spectrum of CH3
+.This peak was assigned to the (1, 1) Coulomb explosion channel in reference[101]. In fact, there are two peaks close together at 3.94 eV and 4.68 eV whichappear in the spectrum as a single peak. The peak at 0 eV corresponds tothe (1,0) dissociation channel [98]. In figure 6.27(a) one can see that the twochannels have the same asymmetry as observed for CH3Cl and CH3Br mean-ing that the ionization and subsequent dissociation is faster if the maximalamplitude of the field points from the iodine atom to the methyl group. Athigher intensity we could observe that the asymmetry of the CH3
+ emission

STRONG-FIELD IONIZATION OF METHYL HALIDES 127
Kin
etic
ene
rgy
(eV
)
Yield (arb. u.)0 0.5 1
0
5
10
Phase delay (π)0 2 4
Asymmetry0 0.1 0.2
Kin
etic
ene
rgy
(eV
)
Yield (arb. u.)0 0.5 1
0
0.5
1
Phase delay (π)0 2 4
Asymmetry0 0.1 0.2
a)
b)
Asymm
etry
-0.2
0.2
0
Figure 6.25: Similar to figure 6.11, but for H3+ (a) and CBr+ (b) from CH3Br.
The laser peak intensity was (1.6 ± 0.6) · 1014 W/cm2. The position of thegreen line is 4.0 eV in (a) and 0.13 eV in (b), respectively.
px (a.u.)
p z (a.u
.)
−50 0 50
−50
0
50
px (a.u.)
p z (a.u
.)
−100 0 100
−100
0
100 Phase
-0.5
0
0.5
Rel
. am
plitu
de
0
1
0.5
a) b)
Figure 6.26: Similar to figure 6.12, but for H3+ (a) and CBr+ (b) from CH3Br.
The laser peak intensity was (1.6± 0.6) · 1014 W/cm2.
changes several times within the energy range between 4.7 eV and 15 eV.The first change of the asymmetry was at 7.5 eV (indicated as green dashedline). It is less pronounced in figure 6.27(c) which shows the result measuredat (1.6 ± 0.6) · 1014 W/cm2 but it is clearly visible in figure 6.27(b). Also inthe corresponding momentum resolved spectra given in figures 6.29(a)-(c) thechange of the modulation phase can be observed. The green dashed circle ontop of the spectra marks the same energy as the green dashed line in figure6.27 (7.5 eV). Remarkable is also the change of asymmetry for the low-energy

128 CHAPTER 6
(1, 1)
(1, 2)
Kin
etic
ene
rgy
(eV
)
Yield (arb. u.)0 0.5 1
0
5
10
15
Phase delay (π)0 2 4
Asymmetry0 0.5 1
(1, 1)
(1, 2)
Kin
etic
ene
rgy
(eV
)
Yield (arb. u.)0 0.5 1
0
5
10
15
Phase delay (π)0 2 4
Asymmetry0 0.5 1
(1, 1)
(1, 2)
Kin
etic
ene
rgy
(eV
)
Yield (arb. u.)0 0.5 1
0
5
10
15
Phase delay (π)0 2 4
Asymmetry0 0.5 1
a)
b)
c)
Asymm
etry
-0.4
0.4
0
Figure 6.27: Similar to figure 6.11, but for CH3+ ions from CH3I. The laser
peak intensity was (3± 1) · 1013 W/cm2 (a), (1.0± 0.4) · 1014 W/cm2 (b) and(1.6± 0.6) · 1014 W/cm2 (c).
(< 3 eV) CH3+ fragments if the intensity is increase from (3±1) ·1013 W/cm2
to (1.0 ± 0.4) · 1014 W/cm2. If we consider the corresponding energy rangein the momentum resolved spectra (main structure in the center of the 2Dspectra) one can get the impression that a different dissociation channel withthe opposite emission asymmetry becomes dominant at higher intensities. Butit is also possible that this is the result of a field induced inversion of the emis-sion asymmetry. A contrary indication is the fact that also at an intensity of(3± 1) · 1013 W/cm2 CH3
+ fragments with the opposite modulation phase areobserved. As expected from the CH3
+ results different emission asymmetriesfor different fragment energies were observed for I+ as well as for I2+, I3+,and I4+. The results for the emission asymmetry are shown in figure 6.28 and

STRONG-FIELD IONIZATION OF METHYL HALIDES 129
(1, 3)(2, 3)
Kin
etic
ene
rgy
(eV
)
Yield (arb. u.)0 0.5 1
0
5
10
15
Phase delay (π)0 2 4
Asymmetry0 0.5 1
(1, 2)(2, 2)
Kin
etic
ene
rgy
(eV
)
Yield (arb. u.)0 0.5 1
0
5
10
Phase delay (π)0 2 4
Asymmetry0 0.5 1
(1, 1)(2, 1)
Kin
etic
ene
rgy
(eV
)
Yield (arb. u.)0 0.5 1
0
1
2
3
4
5
Phase delay (π)0 2 4
Asymmetry0 0.5 1
a)
b)
c)
Asym
metry
-0.4
0.4
0
(1, 4)(2, 4)
Kin
etic
ene
rgy
(eV
)
Yield (arb. u.)0 0.5 1
0
5
10
15
20
Phase delay (π)0 2 4
Asymmetry0 0.5 1
d)
Figure 6.28: Similar to figure 6.11, but for I+ (a), I2+ (b), I3+ (c) and I4+ (b)from CH3I. The laser peak intensity was (1.6± 0.6) · 1014 W/cm2.
the corresponding momentum resolved spectra are given in figure 6.29. In theyield spectrum of I+ (figure 6.28(a)) the position of the green solid line at 0.56eV (calculated from the position of the green solid line in figure 6.27 usingequation 6.10) almost coincides with the yield maximum at 0.65 eV. Hence,

130 CHAPTER 6
this peak corresponds to the (1, 1) Coulomb dissociation of the doubly-chargedparent ion. The sign of the asymmetry is opposite to the corresponding CH3
+
fragments. A change of the asymmetry for higher energies cannot be observed.Also the momentum resolved spectrum given in figure 6.29 shows no indicationfor a phase change of the modulation for high-energy I+ fragments. It followsthat the CH3
+ fragments with an energy of 7.5 eV (dashed green line in figure6.27(b) and (c)) cannot be the result of the (1, 1) Coulomb explosion of themolecule. However, in the asymmetry spectrum of I2+ (figure 6.28(b)) a phasechange at the position of the green dashed line (0.89 eV, calculated assuming atwo-body fragmentation where the CH3
+ fragment acquires a kinetic energy of7.5 eV) can be observed. The phase change of the modulation is better visiblein the momentum resolved spectrum of I2+ given in figure 6.30(b). One canthus conclude that the emission asymmetry of the (1, 2) dissociation channelis opposite to the (1, 1) dissociation channel.In summary, it follows from the measured asymmetry that the ionization ofCH3F is faster when the maximum of the asymmetric field points from themethyl group to the fluorine atom. For CH3Cl, CH3Br and CH3I the oppositeis the case. This observation is consistent with the theoretical result of theWFAT given in section 6.3. Although Ohmura et al. [94] have reached thesame conclusion, their measurements had a much lower kinetic-energy reso-lution. They could therefore not resolve the contributions of multiple frag-mentation channels and their opposite asymmetries. We conclude that thekinetic-energy resolution typical of VMI experiments is therefore essential toproperly analyze and interpret two-color Coulomb-explosion experiments. Wefurther observed for the first time that the Coulomb-explosion rate of CH3Cland CH3Br to CCl+ + H3
+ and CBr+ + H3+, respectively, is increased when
the field points from the halogen atom to the methyl group. From the mod-ulation amplitude of the asymmetry of CH3
+ one can further conclude thatthe ionization asymmetry is larger for CH3F compared to CH3Cl, CH3Br andCH3I. This observation agrees with the prediction of the WFAT calculations.In contrast to the WFAT, the result obtained from the Stark-corrected PFTcalculations disagree with the experimental results. For CH3F and CH3Cl thepredicted sign of the asymmetry is wrong whereas for CH3Br and CH3I thepredicted sign is in agreement with the experimental results. But for CH3Ithe absolute value of the asymmetry stands in contrast to the experimentalobservation. However, for the high-energy CH3
+ fragments which are the re-sult of the Coulomb explosion of the parent ions we could observe a flip of theasymmetry for CH3Cl, CH3Br and CH3I. To the knowledge of the authorthis was not observed until now. An explanation for this observation can begiven under the following assumptions: first, the wave functions shown in fig-ure 6.4 represent the orbitals of molecules in an intense two-color laser fieldand second, one electron is removed from HOMO-1 or HOMO-2. The latter

STRONG-FIELD IONIZATION OF METHYL HALIDES 131
px (a.u.)
p z (a.u
.)
−100 0 100
−100
0
100
px (a.u.)
−100 0 100p
x (a.u.)
−100 0 100
Rel
. am
plitu
de
0
1
0.5
a) b) c)
Phase
-0.5
0
0.5
Figure 6.29: Similar to figure 6.12, but for CH3+ from CH3I. The laser peak
intensity was (3 ± 1) · 1013 W/cm2 (a), (1.0 ± 0.4) · 1014 W/cm2 (b) and(1.6 ± 0.6) · 1014 W/cm2 (c). The green dashed circle indicates a kineticenergy of 7.5 eV.
px (a.u.)
p z (a.u
.)
−200 0 200
−200
−100
0
100
200
px (a.u.)
−200 0 200
−200
0
200
Rel
. am
plitu
de
0
1
0.5
a) b)
Phase
-0.5
0
0.5
px (a.u.)
p z (a.u
.)
−400−200 0 200 400−400
−200
0
200
400
c)
px (a.u.)
−400−200 0 200 400
−400
−200
0
200
400
d)
Figure 6.30: Similar to figure 6.12, but for I+ (a), I2+ (b), I3+ (c) and I4+ (d)from CH3I. The laser peak intensity was (1.6± 0.6) · 1014 W/cm2. The greendashed circle indicates an energy of 0.89 eV. This energy is obtained assuminga two-body fragmentation where the CH3
+ fragment acquires a kinetic energyof 7.5 eV.

132 CHAPTER 6
assumption implies that ionization from low-lying orbitals can occur althoughhigher-lying orbitals are not completely empty. If we consider the shape ofthe HOMO-2 (see figure 6.4) one can see that the wave-function amplitude islarger on the methyl side for all molecules. Due to the large asymmetry ofthe HOMO-2 of CH3Cl, CH3Br and CH3I one can further assume that theangular distribution of the fragments is mainly dominated by the ionizationstep from HOMO-2. Hence, the dissociation rate is higher if the maximalamplitude of the asymmetric field points from the methyl group to the halo-gen atom. This is the opposite direction as observed at low laser intensitiesfor the (1, 0) dissociative ionization channel in CH3Cl, CH3Br and CH3I butthe identical direction in CH3F. This is a plausible explanation. However,the question arises why ionization from HOMO-2 should dominate over ion-ization from HOMO or HOMO-1 although they still contain electrons. Butwithout the help of an extended theory which considers multi-electron ioniza-tion from multiple orbitals in a strong laser field it remains difficult to answerthis question. However, the development of such theories is an active area ofresearch.
6.5 Conclusion
We have measured the fragmentation of the methyl halides (CH3X where X =F, Cl, Br, I) in a two-color laser pulse. The field asymmetry was characterizedusing the fragmentation of CO molecules as a reference. Further, ion time-of-flight spectra were recorded for all methyl halides for three different intensities.For the highest intensity multiply-charged fragments were observed indicatingthat the parent ion was initially in a multiply-charged state. With a VMISin the ion imaging mode the angle-resolved momentum distributions of theCH3
+ and halogen ions were measured. In the kinetic energy spectra obtainedfrom these measurements we could assign fragment energies to the dissociativeionization and Coulomb-explosion channel of the singly and doubly-chargedparent ions, respectively. For CH3Cl, CH3Br and CH3I we concluded fromthe sign of the emission asymmetry that ionization was faster if the maximalamplitude of the asymmetric field points from the halogen atom to the methylgroup whereas for CH3F this situation is opposite. This observation was inagreement with the prediction of the WFAT theory. However, for CH3Cl,CH3Br and CH3I we could observe a change of the emission asymmetry of thehigh-energy CH3
+ fragments. We propose that the change of the asymmetryis due to ionization from lower-lying orbitals.

Chapter 7
Conclusion and Outlook
In a pump-probe experiment we could observe a mixed electronic-rotationalwave packet in NO induced by a Raman scattering and probed by strong-field ionization. We identified pump-probe delays where the wave packet wasdominated either by the electronic or nuclear coherence. In a subsequent ex-periment, momentum-resolved photoelectron spectra were measured for thedifferent pump-probe delays. With these spectra we could show that the holo-graphic pattern is very sensitive to the time-dependent electronic structure ofthe wave packet whereas only minor effects of the electronic coherence on thehigh-energy electrons were observed. However, for pump-probe delays closeto the alignment revival we could also observe a change of the momentumdistribution of the high-energy photoelectrons. By comparison of the experi-mental results with ab-initio calculations based on the R-matrix theory, thisobservation is attributed to the orientation dependence of the elastic-scatteringdifferential cross section. This experiment is the first demonstration of the po-tential of strong-field ionization, rescattering and holography to observe bothelectronic and nuclear dynamics in molecules.From the ion TOF measurements of H2, D2, CH4 and CD4 we could clearlyshow isotope effects on the fragmentation processes of the ionized moleculesin an intense femtosecond laser field. For H2 and D2 we could observe thatthe dissociation through charge-resonance enhanced ionization compared tothe dissociation through bond-softening is faster in H2 compared to D2. ForCH4
+ we could observe a higher H+ fragment yield and a lower CH3+ frag-
ment yield relative to the parent ion yield as compared to the relative yieldsof the corresponding fragments from CD4
+. We concluded that the rate ofthe reactions CX+
4 → CX+3 + X and CX+
4 → CX3 + X+ is different for CH4+
and CD4+. From the yield ratios it follows that the latter reaction is faster
for CH4+ compared to CD4
+. Because of the lack of a sufficiently accuratemethod to calibrate the gas density in the detection volume, reliable resultsof the absolute ionization rates were not obtained. However, the developmentof an accurate and sample-independent method to measure the gas density in
133
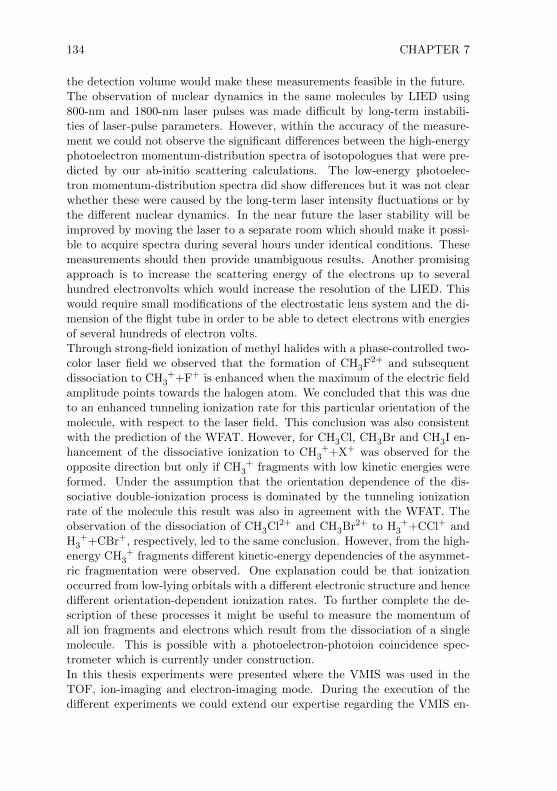
134 CHAPTER 7
the detection volume would make these measurements feasible in the future.The observation of nuclear dynamics in the same molecules by LIED using800-nm and 1800-nm laser pulses was made difficult by long-term instabili-ties of laser-pulse parameters. However, within the accuracy of the measure-ment we could not observe the significant differences between the high-energyphotoelectron momentum-distribution spectra of isotopologues that were pre-dicted by our ab-initio scattering calculations. The low-energy photoelec-tron momentum-distribution spectra did show differences but it was not clearwhether these were caused by the long-term laser intensity fluctuations or bythe different nuclear dynamics. In the near future the laser stability will beimproved by moving the laser to a separate room which should make it possi-ble to acquire spectra during several hours under identical conditions. Thesemeasurements should then provide unambiguous results. Another promisingapproach is to increase the scattering energy of the electrons up to severalhundred electronvolts which would increase the resolution of the LIED. Thiswould require small modifications of the electrostatic lens system and the di-mension of the flight tube in order to be able to detect electrons with energiesof several hundreds of electron volts.Through strong-field ionization of methyl halides with a phase-controlled two-color laser field we observed that the formation of CH3F2+ and subsequentdissociation to CH3
++F+ is enhanced when the maximum of the electric fieldamplitude points towards the halogen atom. We concluded that this was dueto an enhanced tunneling ionization rate for this particular orientation of themolecule, with respect to the laser field. This conclusion was also consistentwith the prediction of the WFAT. However, for CH3Cl, CH3Br and CH3I en-hancement of the dissociative ionization to CH3
++X+ was observed for theopposite direction but only if CH3
+ fragments with low kinetic energies wereformed. Under the assumption that the orientation dependence of the dis-sociative double-ionization process is dominated by the tunneling ionizationrate of the molecule this result was also in agreement with the WFAT. Theobservation of the dissociation of CH3Cl2+ and CH3Br2+ to H3
++CCl+ andH3
++CBr+, respectively, led to the same conclusion. However, from the high-energy CH3
+ fragments different kinetic-energy dependencies of the asymmet-ric fragmentation were observed. One explanation could be that ionizationoccurred from low-lying orbitals with a different electronic structure and hencedifferent orientation-dependent ionization rates. To further complete the de-scription of these processes it might be useful to measure the momentum ofall ion fragments and electrons which result from the dissociation of a singlemolecule. This is possible with a photoelectron-photoion coincidence spec-trometer which is currently under construction.In this thesis experiments were presented where the VMIS was used in theTOF, ion-imaging and electron-imaging mode. During the execution of thedifferent experiments we could extend our expertise regarding the VMIS en-

CONCLUSION AND OUTLOOK 135
abling us to perform versatile experiments. Unfortunately, we never reachedthe point where we could use the VMIS in combination with the attosecondXUV beam line which was under construction during the time of this the-sis. However, the spectrometer will soon be attached to the attosecond XUVbeam line which will open the possibility of using isolated attosecond pulses.Especially the observation of charge migration in molecules would be very in-teresting not least because this process is of great importance in biologicalsystems and also in applications where (single) molecules are used, for exam-ple, as transistors or in photovoltaic elements.If it may turn out that the performance of the VMIS in the current statedoes not meet the requirements of these experiments, there are several mod-ifications which can be easily implemented. A better vacuum, for example,can be achieved by connecting additional turbomolecular pumps to the cham-ber. Currently it would be possible to connect two additional pumps whichwould improve the vacuum by a factor of ten. Also the separation of the flighttube from the source chamber can be improved to reduce the pressure in theflight tube. The electrostatic lens system could also be extended by additionallenses to improve the imaging quality. There are still unused HV feedthroughswelded into the top flange to which these lenses can be connected.However, also without any further modification of the VMIS several new exper-iments are possible. For example one could study the electronic wave packetin Xe+. The electronic ground (2P3/2) and first excited state (2P1/2) of Xe+
are separated by 1.3 eV [102]. The period of the quantum beat of a coherentsuperposition of the two states is thus 3.2 fs. Xe+ ions in this state can beobtained through tunnel ionization of neutral xenon atoms with an intenselaser pulse. With a second, delayed laser pulse with a center wavelength of1900 nm one can ionize the Xe+ ions further to Xe2+. However, due to theelectronic wave packet the efficiency of this process is expected to be depen-dent on the time delay between the first and second laser pulse. In anotherexperiment one could study a nuclear wave packet in CH2Br2 where the CBr2
vibrational scissor mode can be exited through an impulsive stimulated Ra-man transition. The vibrational levels of this mode are separated by 169 cm−1
[83]. Hence, the dynamic of the wave packet of these vibrational modes hap-pens on a time scale of ≈ 200 fs. In a pump-probe experiment similar to theexperiment on nitric oxide presented in this thesis one could study the effect ofthe nuclear motion on the angle- and momentum-resolved photoelectron andphotoion spectrum. By combining a UV or XUV source with the VMIS manymore experiments, for example on photoelectron circular dichroism in chi-ral molecules, become feasible. However, the interpretation of photoelectronspectra becomes increasingly challenging for complex samples. But comingback to the experiments done by Heinrich Hertz, since then far more complexproblems have been solved in this context.

136 CHAPTER 7

Bibliography
[1] A. Einstein, Ueber einen die Erzeugung und Verwandlung des Lichtesbetreffenden heuristischen Gesichtspunkt, Annalen der Physik 322, 132(1905).
[2] H. Hertz, Ueber einen Einfluss des ultravioletten Lichtes auf die elec-trische Entladung, Annalen der Physik 267, 983 (1887).
[3] P. Agostini, F. Fabre, G. Mainfray, G. Petite and N. K. Rahman, Free-free transitions following six-photon ionization of xenon atoms, PhysicalReview Letters 42, 1127, 1 (1979).
[4] B. Yang, K. J. Schafer, B. Walker, K. C. Kulander, P. Agostini andL. F. DiMauro, Intensity-dependent scattering rings in high order above-threshold ionization, Physical Review Letters 71, 3770, 6 (1993).
[5] P. B. Corkum, Plasma perspective on strong-field multiphoton ioniza-tion, Physical Review Letters 71, 1994 (1993).
[6] L. V. Keldysh, Ionization in the field of a strong electromagnetic wave,Journal of Experimental and Theoretical Physics 47, 1945 (1964).
[7] S. Baker, J. S. Robinson, C. A. Haworth, H. Teng, R. A. Smith, C. C.Chirila, M. Lein, J. W. G. Tisch and J. P. Marangos, Probing protondynamics in molecules on an attosecond time scale, Science 312, 424(2006).
[8] M. Lein, Molecular imaging using recolliding electrons, Journal ofPhysics B: Atomic, Molecular and Optical Physics 40, R135 (2007).
[9] S. Haessler, J. Caillat, W. Boutu, C. Giovanetti-Teixeira, T. Ruchon,T. Auguste, Z. Diveki, P. Breger, A. Maquet, B. Carre, R. Taieb andP. Salieres, Attosecond imaging of molecular electronic wavepackets, Na-ture Physics 6, 200 (2010).
[10] O. Smirnova, Y. Mairesse, S. Patchkovskii, N. Dudovich, D. Villeneuve,P. Corkum and M. Y. Ivanov, High harmonic interferometry of multi-electron dynamics in molecules, Nature 460, 972 (2009).
137

138
[11] H. J. Worner, J. B. Bertrand, B. Fabre, J. Higuet, H. Ruf, A. Dubrouil,S. Patchkovskii, M. Spanner, Y. Mairesse, V. Blanchet, E. Mevel,E. Constant, P. B. Corkum and D. M. Villeneuve, Conical intersec-tion dynamics in no2 probed by homodyne high-harmonic spectroscopy,Science 334, 208 (2011).
[12] H. J. Worner, J. B. Bertrand, D. V. Kartashov, P. B. Corkum andD. M. Villeneuve, Following a chemical reaction using high-harmonicinterferometry, Nature 466, 604 (2010).
[13] P. M. Kraus, S. B. Zhang, A. Gijsbertsen, R. R. Lucchese, N. Rohringerand H. J. Worner, High-harmonic probing of electronic coherence indynamically aligned molecules, Physical Review Letters 111, 243005(2013).
[14] M. Hentschel, R. Kienberger, C. Spielmann, G. A. Reider, N. Milosevic,T. Brabec, P. Corkum, U. Heinzmann, M. Drescher and F. Krausz,Attosecond metrology, Nature 414, 509 (2001).
[15] P. M. Paul, E. S. Toma, P. Breger, G. Mullot, F. Auge, P. Balcou, H. G.Muller and P. Agostini, Observation of a train of attosecond pulses fromhigh harmonic generation, Science 292, 1689 (2001).
[16] E. Goulielmakis, M. Schultze, M. Hofstetter, V. S. Yakovlev, J. Gagnon,M. Uiberacker, A. L. Aquila, E. M. Gullikson, D. T. Attwood, R. Kien-berger, F. Krausz and U. Kleineberg, Single-cycle nonlinear optics, Sci-ence 320, 1614 (2008).
[17] M. Drescher, M. Hentschel, R. Kienberger, M. Uiberacker, V. Yakovlev,A. Scrinzi, T. Westerwalbesloh, U. Kleineberg, U. Heinzmann andF. Krausz, Time-resolved atomic inner-shell spectroscopy, Nature 419,803 (2002).
[18] E. Goulielmakis, Z.-H. Loh, A. Wirth, R. Santra, N. Rohringer, V. S.Yakovlev, S. Zherebtsov, T. Pfeifer, A. M. Azzeer, M. F. Kling, S. R.Leone and F. Krausz, Real-time observation of valence electron motion,Nature 466, 739 (2010).
[19] F. Calegari, D. Ayuso, A. Trabattoni, L. Belshaw, S. De Camillis,S. Anumula, F. Frassetto, L. Poletto, A. Palacios, P. Decleva, J. B.Greenwood, F. MartAn and M. Nisoli, Ultrafast electron dynamics inphenylalanine initiated by attosecond pulses, Science 346, 336 (2014).
[20] M. Okunishi, T. Morishita, G. Prumper, K. Shimada, C. D. Lin,S. Watanabe and K. Ueda, Experimental retrieval of target structure in-formation from laser-induced rescattered photoelectron momentum dis-tributions, Physical Review Letters 100, 143001 (2008).

139
[21] T. Morishita, A.-T. Le, Z. Chen and C. D. Lin, Accurate retrieval ofstructural information from laser-induced photoelectron and high-orderharmonic spectra by few-cycle laser pulses, Physical Review Letters 100,013903 (2008).
[22] D. Ray, B. Ulrich, I. Bocharova, C. Maharjan, P. Ranitovic,B. Gramkow, M. Magrakvelidze, S. De, I. V. Litvinyuk, A. T. Le,T. Morishita, C. D. Lin, G. G. Paulus and C. L. Cocke, Large-angle elec-tron diffraction structure in laser-induced rescattering from rare gases,Physical Review Letters 100, 143002 (2008).
[23] Z. Chen, A.-T. Le, T. Morishita and C. D. Lin, Origin of species depen-dence of high-energy plateau photoelectron spectra, Journal of PhysicsB: Atomic, Molecular and Optical Physics 42, 061001 (2009).
[24] M. Meckel, D. Comtois, D. Zeidler, A. Staudte, D. Pavicic, H. C. Ban-dulet, H. Pepin, J. C. Kieffer, R. Dorner, D. M. Villeneuve and P. B.Corkum, Laser-induced electron tunneling and diffraction, Science 320,1478 (2008).
[25] D. Comtois, H.-C. Bandulet, M. Spanner, D. Pavicic, M. Meckel, D. Zei-dler, H. Pepin, R. Dorner, J.-C. Kieffer, D. Villeneuve, P. Corkum andA. Staudte, Laser-induced orbital projection and diffraction of O2 withvelocity map imaging, Journal of Modern Optics 60, 1395 (2013).
[26] C. I. Blaga, J. Xu, A. D. DiChiara, E. Sistrunk, K. Zhang, P. Agostini,T. A. Miller, L. F. DiMauro and C. D. Lin, Imaging ultrafast molecu-lar dynamics with laser-induced electron diffraction., Nature 483, 194(2012).
[27] Y. Huismans, A. Rouzee, A. Gijsbertsen, J. H. Jungmann, A. S.Smolkowska, P. S. W. M. Logman, F. Lepine, C. Cauchy, S. Zamith,T. Marchenko, J. M. Bakker, G. Berden, B. Redlich, A. F. G. van derMeer, H. G. Muller, W. Vermin, K. J. Schafer, M. Spanner, M. Y. Ivanov,O. Smirnova, D. Bauer, S. V. Popruzhenko and M. J. J. Vrakking, Time-resolved holography with photoelectrons, Science 331, 61 (2011).
[28] D. D. Hickstein, P. Ranitovic, S. Witte, X.-M. Tong, Y. Huismans,P. Arpin, X. Zhou, K. E. Keister, C. W. Hogle, B. Zhang, C. Ding,P. Johnsson, N. Toshima, M. J. J. Vrakking, M. M. Murnane and H. C.Kapteyn, Direct visualization of laser-driven electron multiple scatteringand tunneling distance in strong-field ionization, Physical Review Letters109, 73004 (2012).
[29] X.-B. Bian, Y. Huismans, O. Smirnova, K.-J. Yuan, M. J. J. Vrakkingand A. D. Bandrauk, Subcycle interference dynamics of time-resolved

140
photoelectron holography with midinfrared laser pulses, Physical ReviewA 84, 043420 (2011).
[30] D. W. Chandler and P. L. Houston, Two-dimensional Imaging of State-selected Photodissociation Products Detected By Multiphoton Ioniza-tion, Journal of Chemical Physics 87, 1445 (1987).
[31] A. T. J. B. Eppink and D. H. Parker, Velocity map imaging of ions andelectrons using electrostatic lenses: Application in photoelectron andphotofragment ion imaging of molecular oxygen, Review of ScientificInstruments 68, 3477 (1997).
[32] V. Dribinski, A. Ossadtchi, V. A. Mandelshtam and H. Reisler, Recon-struction of Abel-transformable images: The Gaussian basis-set expan-sion Abel transform method, Review of Scientific Instruments 73, 2634(2002).
[33] M. J. J. Vrakking, An iterative procedure for the inversion of two-dimensional ion/photoelectron imaging experiments, Review of Scien-tific Instruments 72, 4084 (2001).
[34] S. K. Lee, Y. F. Lin, L. Yan and W. Li, Laser-induced low energy electrondiffraction in aligned molecules, The Journal of Physical Chemistry A116, 1950 (2012).
[35] C. D. Lin, A.-T. Le, Z. Chen, T. Morishita and R. Lucchese, Topicalreview: strong-field rescattering physics—self-imaging of a molecule byits own electrons, J. Phys. B 43, 2001 (2010).
[36] H. Stapelfeldt and T. Seideman, Colloquium: Aligning molecules withstrong laser pulses, Rev. Mod. Phys. 75, 543 (2003).
[37] T. Seideman and E. Hamilton, Nonadiabatic alignment by intense pulses.Concepts, theory, and directions, Advances in atomic, molecular, andoptical physics 52, 289 (2005).
[38] C. I. Blaga, F. Catoire, P. Colosimo, G. G. Paulus, H. G. Muller, P. Agos-tini and L. F. DiMauro, Strong-field photoionization revisited, NaturePhysics 5, 335 (2009).
[39] W. Quan, Z. Lin, M. Wu, H. Kang, H. Liu, X. Liu, J. Chen, J. Liu, X. T.He, S. G. Chen, H. Xiong, L. Guo, H. Xu, Y. Fu, Y. Cheng and Z. Z.Xu, Classical aspects in above-threshold ionization with a midinfraredstrong laser field, Physical Review Letters 103, 093001 (2009).
[40] Z. Chen, A.-T. Le, T. Morishita and C. D. Lin, Quantitative rescatter-ing theory for laser-induced high-energy plateau photoelectron spectra,Physical Review A 79, 033409 (2009).

141
[41] M. Y. Ivanov, M. Spanner and O. Smirnova, Anatomy of strong fieldionization, Journal of Modern Optics 52, 165 (2005).
[42] M. Spanner, O. Smirnova, P. B. Corkum and M. Y. Ivanov, Read-ing diffraction images in strong field ionization of diatomic molecules,Journal of Physics B: Atomic, Molecular and Optical Physics 37, L243(2004).
[43] C. D. Lin, A. T. Le, Z. J. Chen, T. Morishita and R. Lucchese, Strong-field rescattering physics-self-imaging of a molecule by its own electrons,Journal of Physics B-atomic Molecular and Optical Physics 43, 122001(2010).
[44] R. Murray, W.-K. Liu and M. Y. Ivanov, Partial Fourier-transform ap-proach to tunnel ionization: Atomic systems, Physical Review A 81,023413 (2010).
[45] R. Murray, M. Spanner, S. Patchkovskii and M. Y. Ivanov, Tunnel Ion-ization of Molecules and Orbital Imaging, Physical Review Letters 106,173001 (2011).
[46] R. Murray, Tunnel ionization in strong fields in atoms and moleculesand its applications, Ph.D. thesis, University of Waterloo (2011).
[47] X.-B. Bian and A. D. Bandrauk, Orientation-dependent forward-backward photoelectron holography from asymmetric molecules, Physi-cal Review A 89, 033423 (2014).
[48] D. Pavicic, K. F. Lee, D. M. Rayner, P. B. Corkum and D. M. Vil-leneuve, Direct measurement of the angular dependence of ionizationfor N2, O2, and CO2 in intense laser fields, Physical Review Letters 98,243001 (2007).
[49] O. I. Tolstikhin, T. Morishita and L. B. Madsen, Theory of tunnelingionization of molecules: Weak-field asymptotics including dipole effects,Physical Review A 84, 053423 (2011).
[50] L. B. Madsen, O. I. Tolstikhin and T. Morishita, Application of theweak-field asymptotic theory to the analysis of tunneling ionization oflinear molecules, Physical Review A 85, 053404 (2012).
[51] G. L. Yudin and M. Y. Ivanov, Nonadiabatic tunnel ionization: Lookinginside a laser cycle, Physical Review A 64, 013409 (2001).
[52] T. Morishita, Z. Chen, S. Watanabe and C. D. Lin, Two-dimensionalelectron momentum spectra of argon ionized by short intense lasers:Comparison of theory with experiment, Physical Review A 75, 023407(2007).

142
[53] O. I. Tolstikhin, H. J. Worner and T. Morishita, Effect of nuclear motionon tunneling ionization rates of molecules, Physical Review A 87, 041401(2013).
[54] R. Trebino, K. W. DeLong, D. N. Fittinghoff, J. N. Sweetser, M. A.Krumbugel, B. A. Richman and D. J. Kane, Measuring ultrashort laserpulses in the time-frequency domain using frequency-resolved opticalgating, Review of Scientific Instruments 68, 3277 (1997).
[55] D. J. Kane, Recent progress toward real-time measurement of ultrashortlaser pulses, IEEE Journal of Quantum Electronics 35, 421 (1999).
[56] G. W. Fraser, The ion detection efficiency of microchannel plates(MCPs), International Journal of Mass Spectrometry 215, 13 (2002).
[57] B. Brehm, J. Grosser, T. Ruscheinski and M. Zimmer, Absolute detec-tion efficiencies of a microchannel plate detector for ions, MeasurementScience and Technology 6, 953 (1995).
[58] B. L. Peko and T. M. Stephen, Absolute detection efficiencies of lowenergy H, H−, H+, H+
2 and H+3 incident on a multichannel plate detector,
Nuclear Instruments and Methods in Physics Research Section B: BeamInteractions with Materials and Atoms 171, 597 (2000).
[59] D. P. Shelton, Nonlinear-optical susceptibilities of gases measured at1064 and 1319 nm, Physical Review A 42, 2578 (1990).
[60] A. D. Shiner, B. E. Schmidt, C. Trallero-Herrero, H. J. Worner,S. Patchkovskii, P. B. Corkum, J.-C. Kieffer, F. Legare and D. M. Vil-leneuve, Supplement to ”Probing collective multi-electron dynamics inxenon with high-harmonic spectroscopy” (2011).
[61] S. M. Hankin, D. M. Villeneuve, P. B. Corkum and D. M. Rayner,Intense-field laser ionization rates in atoms and molecules, Physical Re-view A 64, 013405 (2001).
[62] S. M. Hankin, D. M. Villeneuve, P. B. Corkum and D. M. Rayner,Nonlinear ionization of organic molecules in high intensity laser fields,Physical Review Letters 84, 5082 (2000).
[63] A. Rudenko, B. Feuerstein, K. Zrost, V. L. B. de Jesus, T. Ergler, C. Di-mopoulou, C. D. Schroter, R. Moshammer and J. Ullrich, Fragmentationdynamics of molecular hydrogen in strong ultrashort laser pulses, Jour-nal of Physics B: Atomic, Molecular and Optical Physics 38, 487 (2005).
[64] J. H. Posthumus, The dynamics of small molecules in intense laser fields,Reports on Progress in Physics 67, 623 (2004).

143
[65] C. E. Trump, Atomare und molekulare Fragmentationsdynamik in in-tensiven ultrakurzen Lichtpulsen, Ph.D. thesis, Technische UniversitatBerlin (2000).
[66] M. R. Thompson, M. K. Thomas, P. F. Taday, J. H. Posthumus, A. J.Langley, L. J. Frasinski and K. Codling, One and two-colour studies ofthe dissociative ionization and Coulomb explosion of H2 with intenseTi:sapphire laser pulses, Journal of Physics B: Atomic, Molecular andOptical Physics 30, 5755 (1997).
[67] A. Staudte, S. Patchkovskii, D. Pavicic, H. Akagi, O. Smirnova, D. Zei-dler, M. Meckel, D. M. Villeneuve, R. Dorner, M. Y. Ivanov and P. B.Corkum, Angular tunneling ionization probability of fixed-in-space H2
molecules in intense laser pulses, Physical Review Letters 102, 033004(2009).
[68] W. Guo, X. Lu, D. Zhao and X. Wang, Pathway of H+ in fragmentationof H2 in 810 nm intense femtosecond laser fields, Physica Scripta 89,025401 (2014).
[69] L. J. Frasinski, J. Plumridge, J. H. Posthumus, K. Codling, P. F. Taday,E. J. Divall and A. J. Langley, Counterintuitive alignment of H+
2 inintense femtosecond laser fields, Physical Review Letters 86, 2541 (2001).
[70] T. D. G. Walsh, F. A. Ilkov and S. L. Chin, The dynamical behaviourof H2 and D2 in a strong, femtosecond, titanium:sapphire laser field,Journal of Physics B: Atomic, Molecular and Optical Physics 30, 2167(1997).
[71] J.-Y. Zhu, B.-K. Liu, Y.-Q. Wang, H.-X. He and L. Wang, Dynamicsof H2 in Intense Femtosecond Laser Field, Chinese Physics Letters 27,093301 (2010).
[72] C. Trump, H. Rottke and W. Sandner, Strong-field photoionization ofvibrational ground-state H+
2 and D+2 molecules, Physical Review A 60,
3924 (1999).
[73] C. Trump, H. Rottke, M. Wittmann, G. Korn, W. Sandner, M. Lein andV. Engel, Pulse-width and isotope effects in femtosecond-pulse strong-field dissociation of H+
2 and D+2 , Physical Review A 62, 063402 (2000).
[74] A. S. Alnaser, T. Osipov, E. P. Benis, A. Wech, B. Shan, C. L. Cocke,X.-M. Tong and C.-D. Lin, Rescattering double ionization of D2 and H2
by intense laser pulses, Physical Review Letters 91, 163002 (2003).
[75] J. Strohaber, F. Zhu, A. A. Kolomenskii and H. A. Schuessler, Observa-tion of anisotropic fragmentation in methane subjected to femtosecondradiation, Physical Review A 89, 023430 (2014).

144
[76] S. Wang, X. Tang, L. Gao, M. E. Elshakre and F. Kong, Dissociationof methane in intense laser fields, Journal of Physical Chemistry A 107,6123 (2003).
[77] M. Sharifi, F. Kong, S. L. Chin, H. Mineo, Y. Dyakov, A. M. Mebel,S. D. Chao, M. Hayashi and S. H. Lin, Experimental and theoreticalinvestigation of high-power laser ionization and dissociation of methane,Journal of Physical Chemistry A 111, 9405 (2007).
[78] Z. Wu, C. Wu, Q. Liang, S. Wang, M. Liu, Y. Deng and Q. Gong, Frag-mentation dynamics of methane by few-cycle femtosecond laser pulses,Journal of Chemical Physics 126, 074311 (2007).
[79] S. Micheau, Z. Chen, A. T. Le, J. Rauschenberger, M. F. Kling and C. D.Lin, Accurate retrieval of target structures and laser parameters of few-cycle pulses from photoelectron momentum spectra, Physical ReviewLetters 102, 073001 (2009).
[80] M. Okunishi, H. Niikura, R. R. Lucchese, T. Morishita and K. Ueda,Extracting electron-ion differential scattering cross sections for par-tially aligned molecules by laser-induced rescattering photoelectron spec-troscopy, Physical Review Letters 106, 063001 (2011).
[81] J. Tennyson, Electron–molecule collision calculations using the R-matrixmethod, Physics Reports 491, 29 (2010).
[82] E. Hirota, Anharmonic potential function and equilibrium structure ofmethane, Journal of Molecular Spectroscopy 77, 213 (1979).
[83] National Institute of Standards and Technology,http://webbook.nist.gov/chemistry/ (2014).
[84] R. Signorell, M. Sommavilla and F. Merkt, Jahn-Teller distortion inCD2H2
+ from a rotationally resolved photoelectron spectrum, ChemicalPhysics Letters 312, 139 (1999).
[85] X. M. Tong, Z. X. Zhao and C. D. Lin, Theory of molecular tunnelingionization, Physical Review A 66, 033402 (2002).
[86] V. S. Popov, Tunnel and multiphoton ionization of atoms and ions in astrong laser field (Keldysh theory), Physics-Uspekhi 47, 855 (2004).
[87] A. S. Alnaser, S. Voss, X. M. Tong, C. M. Maharjan, P. Ranitovic,B. Ulrich, T. Osipov, B. Shan, Z. Chang and C. L. Cocke, Effects ofmolecular structure on ion disintegration patterns in ionization of O2
and O2 by short laser pulses, Physical Review Letters 93, 113003 (2004).

145
[88] L. Holmegaard, J. L. Hansen, L. Kalhoj, S. Louise Kragh, H. Stapelfeldt,F. Filsinger, J. Kupper, G. Meijer, D. Dimitrovski, M. Abu-samha,C. P. J. Martiny and L. Bojer Madsen, Photoelectron angular distribu-tions from strong-field ionization of oriented molecules, Nature Physics6, 428 (2010).
[89] D. Dimitrovski, C. P. Martiny and L. B. Madsen, Strong-field ioniza-tion of polar molecules: Stark-shift-corrected strong-field approximation,Physical Review A 82, 053404 (2010).
[90] J. L. Hansen, L. Holmegaard, J. H. Nielsen, H. Stapelfeldt, D. Dim-itrovski and L. B. Madsen, Orientation-dependent ionization yieldsfrom strong-field ionization of fixed-in-space linear and asymmetric topmolecules, Journal of Physics B: Atomic, Molecular and Optical Physics45, 015101 (2012).
[91] H. Ohmura, N. Saito and T. Morishita, Molecular tunneling ionizationof the carbonyl sulfide molecule by double-frequency phase-controlledlaser fields, Physical Review A 89, 013405 (2014).
[92] H. Li, D. Ray, S. De, I. Znakovskaya, W. Cao, G. Laurent, Z. Wang,M. Kling, A. Le and C. Cocke, Orientation dependence of the ionizationof CO and NO in an intense femtosecond two-color laser field, PhysicalReview A 84, 043429 (2011).
[93] H. Ohmura, N. Saito and T. Morishita, Quantum control of moleculartunneling ionization in the spatiotemporal domain, Physical Review A83, 063407 (2011).
[94] H. Ohmura, F. Ito and M. Tachiya, Phase-sensitive molecular ionizationinduced by a phase-controlled two-color laser field in methyl halides,Physical Review A 74, 043410 (2006).
[95] J. L. Hansen, L. Holmegaard, L. Kalhøj, S. L. Kragh, H. Stapelfeldt,F. Filsinger, G. Meijer, J. Kupper, D. Dimitrovski, M. Abu-samha,C. P. J. Martiny and L. B. Madsen, Ionization of one-and three-dimensionally-oriented asymmetric-top molecules by intense circularlypolarized femtosecond laser pulses, Physical Review A 83, 023406 (2011).
[96] X. M. Tong and C. D. Lin, Empirical formula for static field ionizationrates of atoms and molecules by lasers in the barrier-suppression regime,Journal of Physics B: Atomic, Molecular and Optical Physics 38, 2593(2005).
[97] L. B. Madsen, F. Jensen, O. I. Tolstikhin and T. Morishita, Structurefactors for tunneling ionization rates of molecules, Physical Review A87, 013406 (2013).

146
[98] H. Liu, Z. Yang, Z. Gao and Z. Tang, Ionization and dissociation of CH3Iin intense laser field, Journal of Chemical Physics 126, 44316 (2007).
[99] S. Sun, Y. Yang, J. Zhang, H. Wu, Y. Chen, S. Zhang, T. Jia, Z. Wangand Z. Sun, Ejection of triatomic molecular ion from methyl chloridein an intense femtosecond laser field, Chemical Physics Letters 581, 16(2013).
[100] M. Tanaka, M. Murakami, T. Yatsuhashi and N. Nakashima, Atomiclikeionization and fragmentation of a series of CH3X (X: H, F, Cl, Br, I, andCN) by an intense femtosecond laser, The Journal of Chemical Physics127, 104314 (2007).
[101] M. E. Corrales, G. Gitzinger, J. Gonzalez-Vazquez, V. Loriot,R. de Nalda and L. Banares, Velocity map imaging and theoretical studyof the coulomb explosion of CH3I under intense femtosecond IR pulses,The Journal of Physical Chemistry A 116, 2669 (2011).
[102] NIST Atomic Spectra Database, http://www.nist.gov/pml/data/asd.cfm(2015).

Danksagung
Ich mochte mich ganz herzlich bei allen bedanken, die mich wahrend meinerDoktorarbeit inspiriert und unterstutzt haben, besonders bei meinen BetreuernProf. Hans Jakob Worner und Prof. Vahid Sandoghdar. Wahrend der erstenanderthalb Jahre meiner Dissertation durfte ich in der Gruppe von Prof. VahidSandoghdar eine spannende und lehrreiche Zeit verbringen. Dann entschiedsich Prof. Vahid Sandoghdar, seine Forschungstatigkeit an das ”Max-Planck-Institut fur die Physik des Lichts” in Erlangen zu verlegen. Um meine Disser-tation in Zurich weiterfuhren zu konnen, begab ich mich auf die Suche nacheinem neuen Betreuer an der ETH. Glucklicherweise schlug mir Prof. HansJakob Worner ein faszinierendes Projekt vor, bei dem ich eine schone, inter-essante und pragende Zeit an der ETH erleben durfte. Ich bedanke mich ganzherzlich bei Frau Prof. Ruth Signorell, die sich freundlicherweise bereit erklarthat, diese Arbeit als Korreferentin zu betreuen.
Ich hatte das Gluck, dass ich in den Gruppen von Prof. Vahid Sandoghdarund Prof. Hans Jakob Worner stets von sehr liebenswerten und kompetentenMenschen umgeben war. Meinem Burokollegen Martin Huppert verdanke icheine sehr angenehme und anregende Arbeitsatmosphare. Obwohl er nie direktan meinen Projekten beteiligt war, hat er trotzdem mit seinem Wissen sehrviel zum Gelingen der Experimente beigetragen.
Die Zusammenarbeit mit Yves Rezus und Bhargava Ram Niraghatam warausserordentlich bereichernd. Sie gaben mir in meiner Forschungsarbeit wichtigeHilfestellungen und Impulse.
Ganz herzlich mochte ich mich auch bei Aaron von Conta, Peter Kraus, IngaJordan, Andres Tehlar, Denitsa Baykusheva und Alisa Rupenyan-Vasileva furihre sehr angenehme Zusammenarbeit bedanken.
Gert Zumofen danke ich fur die vielen Stunden, wahrend denen er mir mit vielGeduld meine Fragen zum theoretischen Hintergrund beantwortet hat, sowieauch Alois Renn, dem wandelnden Lexikon, dessen Tipps und Tricks mir im-mer wieder weitergeholfen haben. Auch Stephan Gotzinger danke ich fur seine
147

148
nutzlichen Hilfestellungen.
David Stapfer, aber auch Andres Laso, Markus Kerellaj und das ganze Werk-stattteam waren mir eine unverzichtbare Hilfe, Losungen fur technische Prob-leme bei Planung und Aufbau des Spektrometers zu suchen und umzusetzen.Mit allen elektronischen Anliegen durfte ich mich an Markus Steger und An-dreas Schneider wenden. Auch Markus Imbach und das ganze Elektronikteamwaren eine grosse Unterstutzung. Ihnen allen danke ich ganz herzlich.
Nebst allen wissenschaftlichen Mitarbeitenden waren mir viele Menschen impersonlichen Umfeld eine ausserst wichtige Unterstutzung. Ich bedanke michbei meiner Familie fur ihren grossartigen Zusammenhalt und im Besonderenbei Nicole fur ihre liebevolle Unterstutzung.
Zum Schluss danke ich meinen Eltern herzlichst fur ihre bedingungslose Liebeund ihre jahrelange Unterstutzung in jeder Hinsicht. Ihnen verdanke ich unteranderem meine kreative Neugier als treibende Kraft jeder wissenschaftlichenTatigkeit.