2018 2018 Insights and Interpretations FINAL PD… · 2018 ... pisa,
64
Insights and Interpretations 2018 Andreas Schleicher
Transcript of 2018 2018 Insights and Interpretations FINAL PD… · 2018 ... pisa,

I n s i g h t s a n d I n t e r p re t a t i o n s
2018
Andreas Schleicher

© OECD 2019 3
PISA 2018: Insights and Interpretations
“
“
Equipping citizens with the knowledge and
skills necessary to achieve their full potential,
to contribute to an increasingly interconnected
world, and to convert better skills into better lives
needs to become a more central preoccupation
of policy makers around the world. Fairness,
integrity and inclusiveness in public policy thus
all hinge on the skills of citizens. In working to
achieve these goals, more and more countries are
looking beyond their own borders for evidence
of the most successful and efficient education
policies and practices.
PISA is not only the world’s most comprehensive
and reliable indicator of students’ capabilities, it is
also a powerful tool that countries and economies
can use to fine-tune their education policies…That
is why the OECD produces this triennial report on
the state of education around the globe: to share
evidence of the best policies and practices, and
to offer our timely and targeted support to help
countries provide the best education possible for
all of their students.
Angel Gurría OECD Secretary-General
About PISA
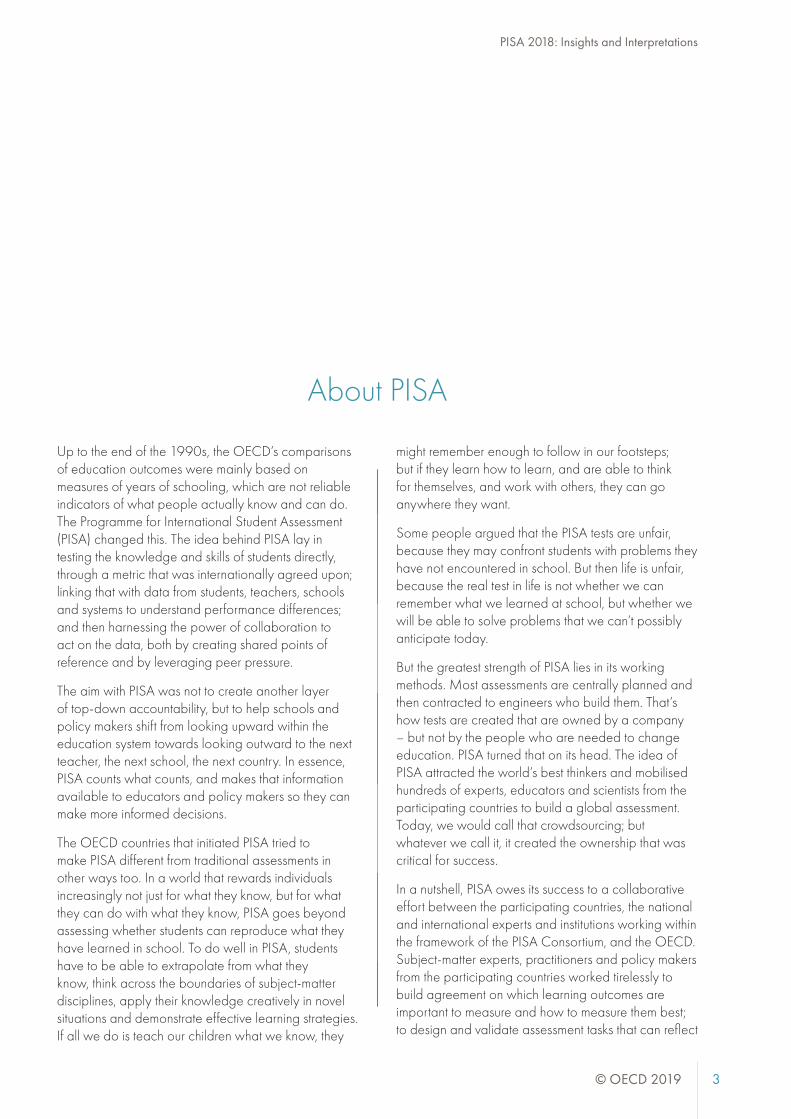
Up to the end of the 1990s, the OECD’s comparisons of education outcomes were mainly based on measures of years of schooling, which are not reliable indicators of what people actually know and can do. The Programme for International Student Assessment (PISA) changed this. The idea behind PISA lay in testing the knowledge and skills of students directly, through a metric that was internationally agreed upon; linking that with data from students, teachers, schools and systems to understand performance differences; and then harnessing the power of collaboration to act on the data, both by creating shared points of reference and by leveraging peer pressure.
The aim with PISA was not to create another layer of top-down accountability, but to help schools and policy makers shift from looking upward within the education system towards looking outward to the next teacher, the next school, the next country. In essence, PISA counts what counts, and makes that information available to educators and policy makers so they can make more informed decisions.
The OECD countries that initiated PISA tried to make PISA different from traditional assessments in other ways too. In a world that rewards individuals increasingly not just for what they know, but for what they can do with what they know, PISA goes beyond assessing whether students can reproduce what they have learned in school. To do well in PISA, students have to be able to extrapolate from what they know, think across the boundaries of subject-matter disciplines, apply their knowledge creatively in novel situations and demonstrate effective learning strategies. If all we do is teach our children what we know, they
might remember enough to follow in our footsteps; but if they learn how to learn, and are able to think for themselves, and work with others, they can go anywhere they want.
Some people argued that the PISA tests are unfair, because they may confront students with problems they have not encountered in school. But then life is unfair, because the real test in life is not whether we can remember what we learned at school, but whether we will be able to solve problems that we can’t possibly anticipate today.
But the greatest strength of PISA lies in its working methods. Most assessments are centrally planned and then contracted to engineers who build them. That’s how tests are created that are owned by a company – but not by the people who are needed to change education. PISA turned that on its head. The idea of PISA attracted the world’s best thinkers and mobilised hundreds of experts, educators and scientists from the participating countries to build a global assessment. Today, we would call that crowdsourcing; but whatever we call it, it created the ownership that was critical for success.
In a nutshell, PISA owes its success to a collaborative effort between the participating countries, the national and international experts and institutions working within the framework of the PISA Consortium, and the OECD. Subject-matter experts, practitioners and policy makers from the participating countries worked tirelessly to build agreement on which learning outcomes are important to measure and how to measure them best; to design and validate assessment tasks that can reflect
© OECD 2019 3
PISA 2018: Insights and Interpretations
“
“
Equipping citizens with the knowledge and
skills necessary to achieve their full potential,
to contribute to an increasingly interconnected
world, and to convert better skills into better lives
needs to become a more central preoccupation
of policy makers around the world. Fairness,
integrity and inclusiveness in public policy thus
all hinge on the skills of citizens. In working to
achieve these goals, more and more countries are
looking beyond their own borders for evidence
of the most successful and efficient education
policies and practices.
PISA is not only the world’s most comprehensive
and reliable indicator of students’ capabilities, it is
also a powerful tool that countries and economies
can use to fine-tune their education policies…That
is why the OECD produces this triennial report on
the state of education around the globe: to share
evidence of the best policies and practices, and
to offer our timely and targeted support to help
countries provide the best education possible for
all of their students.
Angel Gurría OECD Secretary-General
About PISA
Up to the end of the 1990s, the OECD’s comparisons of education outcomes were mainly based on measures of years of schooling, which are not reliable indicators of what people actually know and can do. The Programme for International Student Assessment (PISA) changed this. The idea behind PISA lay in testing the knowledge and skills of students directly, through a metric that was internationally agreed upon; linking that with data from students, teachers, schools and systems to understand performance differences; and then harnessing the power of collaboration to act on the data, both by creating shared points of reference and by leveraging peer pressure.
The aim with PISA was not to create another layer of top-down accountability, but to help schools and policy makers shift from looking upward within the education system towards looking outward to the next teacher, the next school, the next country. In essence, PISA counts what counts, and makes that information available to educators and policy makers so they can make more informed decisions.
The OECD countries that initiated PISA tried to make PISA different from traditional assessments in other ways too. In a world that rewards individuals increasingly not just for what they know, but for what they can do with what they know, PISA goes beyond assessing whether students can reproduce what they have learned in school. To do well in PISA, students have to be able to extrapolate from what they know, think across the boundaries of subject-matter disciplines, apply their knowledge creatively in novel situations and demonstrate effective learning strategies. If all we do is teach our children what we know, they
might remember enough to follow in our footsteps; but if they learn how to learn, and are able to think for themselves, and work with others, they can go anywhere they want.
Some people argued that the PISA tests are unfair, because they may confront students with problems they have not encountered in school. But then life is unfair, because the real test in life is not whether we can remember what we learned at school, but whether we will be able to solve problems that we can’t possibly anticipate today.
But the greatest strength of PISA lies in its working methods. Most assessments are centrally planned and then contracted to engineers who build them. That’s how tests are created that are owned by a company – but not by the people who are needed to change education. PISA turned that on its head. The idea of PISA attracted the world’s best thinkers and mobilised hundreds of experts, educators and scientists from the participating countries to build a global assessment. Today, we would call that crowdsourcing; but whatever we call it, it created the ownership that was critical for success.
In a nutshell, PISA owes its success to a collaborative effort between the participating countries, the national and international experts and institutions working within the framework of the PISA Consortium, and the OECD. Subject-matter experts, practitioners and policy makers from the participating countries worked tirelessly to build agreement on which learning outcomes are important to measure and how to measure them best; to design and validate assessment tasks that can reflect

4 © OECD 2019 © OECD 2019 5
PISA 2018: Insights and InterpretationsPISA 2018: Insights and Interpretations
those measures adequately and accurately across countries and cultures; and to find ways to compare the results meaningfully and reliably. The OECD co-ordinated this effort and worked with countries to make sense of the results and compile the reports.
PISA 2018 was the seventh round of the international assessment since the programme was launched in 2000. Every PISA test assesses students’ knowledge and skills in reading, mathematics and science; each assessment focuses on one of these subjects and provides a summary assessment of the other two. In 2018, the focus was on reading in a digital environment; but the design of the assessment also made it possible to measure trends in reading literacy over the past two decades. PISA 2018 defined reading literacy as understanding, using, evaluating, reflecting on and engaging with texts in order to achieve one’s goals, to develop one’s knowledge and potential, and to participate in society. PISA 2018 also collected extensive data on students’ attitudes and well-being.
PISA 2018 assessed the cumulative outcomes of education and learning at a point at which most children are still enrolled in formal education: the age of 15. The 15-year-olds in the PISA sample must also have been enrolled in an educational institution at grade 7 or higher. All such students were eligible to sit the PISA assessment, regardless of the type of educational establishment in which they were enrolled and whether they were enrolled in full-time or part-time education. Not all of the students who were eligible to sit the PISA assessment were actually assessed. A two-stage sampling procedure first selected a representative sample of at least 150 schools, taking into account factors such as location (state or province; but also whether the school is located in a rural area, town or city) and level of education. Then, in the second stage, roughly 42 15-year-old students were randomly selected from each school to sit the assessment. Most countries assessed between 4 000 and 8 000 students. Students selected to sit the PISA assessment received sampling weights so as to represent the entire PISA-eligible cohort.
Over the past two decades, PISA has become the world’s premier yardstick for comparing quality, equity and efficiency in learning outcomes across countries, and an influential force for education reform. It has helped policy makers lower the cost of political action by backing difficult decisions with evidence – but it has also raised the political cost of inaction by exposing areas where policy and practice have been unsatisfactory.
Since 2000, PISA has shown that education systems can provide both high-quality instruction and equitable learning opportunities for all, and that they can support academic excellence in an environment that also nurtures students’ well-being. PISA shows what countries are doing to support their students and provides an opportunity for countries to learn from each other. This brochure summarises some of the initial findings from PISA 2018 and puts them into context. The full set of initial results can be found in PISA 2018 Results (Volume I): What Students Know and Can Do; PISA 2018 Results (Volume II): Where All Students Can Succeed; and PISA 2018 Results (Volume III): What School Life Means for Students’ Lives. Three additional volumes of PISA 2018 Results – Are Students Smart about Money?; Effective Policies, Successful Schools; and Are Students Ready to Thrive in Global Societies? – will be published in 2020. Improving education
Over ten million students represented by PISA in 2018 were not able to complete even the most basic reading tasks – and these were 15-year-olds living in the 79 high- and middle-income countries that participated in the test. In many countries, the quality of the education a student acquires can still best be predicted by the student’s or his or her school’s socio-economic background. In fact, the 10% most socio-economically advantaged students outperformed their 10% most disadvantaged counterparts in reading by 141 score points, on average across OECD countries. This adds up to the equivalent of over three years of schooling in the countries which were able to estimate learning progress across school grades, and this gap has essentially remained unchanged over the past decade. Moreover, there has also been no real overall improvement in the learning outcomes of students in OECD countries, even though expenditure on schooling rose by more than 15% over the past decade alone.
It might be tempting to drop this report, and any further thought about improving education, right about now. Impossible to change anything as big, complex and entrenched in vested interests as education.
But keep reading. Why? Because 15-year-old students in four provinces/municipalities of China – Beijing, Shanghai, Jiangsu and Zhejiang – outperformed their peers in all of the other 78 participating education systems – in mathematics and science by a wide margin, and in reading, only Singapore came close (Figures 1, 2 and 3). In fact, the 10% most disadvantaged students in these four provinces showed better reading skills than those of the
average student in OECD countries, and performed on a par with the 10% most advantaged students in some of them (Figure 4). True, these four provinces in eastern China are far from representing China as a whole, but the size of each compares to that of a typical OECD country, and their combined populations amount to over 180 million. What makes their achievement even more remarkable is that the level of income of these four Chinese regions is well below the OECD average. At the same time, they have a long way to go when it comes to improving the social and emotional outcomes, and other aspects of students’ well-being that were measured by PISA 2018, areas where other countries excel (more on that later).
It is also noteworthy that some of today’s highest-performing education systems have only recently attained their top positions. Less than 17% of 55-65 year-old Singaporeans scored at level 3 or higher in literacy in the Survey of Adult Skills (a product of the OECD Programme for the International Assessment of Adult Competencies, a kind of PISA for adults) – one of the smallest proportions amongst participating countries – while 63% of 16-24 year-olds did so, one of the largest proportions. And, as noted before, in PISA 2018, 15-year-old Singaporeans scored not statistically differently from the four provinces/municipalities of China in reading. Amongst OECD countries, Estonia has advanced steadily to the top, despite the fact that its expenditure per student remains about 30% lower than the OECD average (Figures 5 and 6).
Portugal advanced to the OECD average level despite being severely hit by the financial crisis. Some countries that still perform well below the
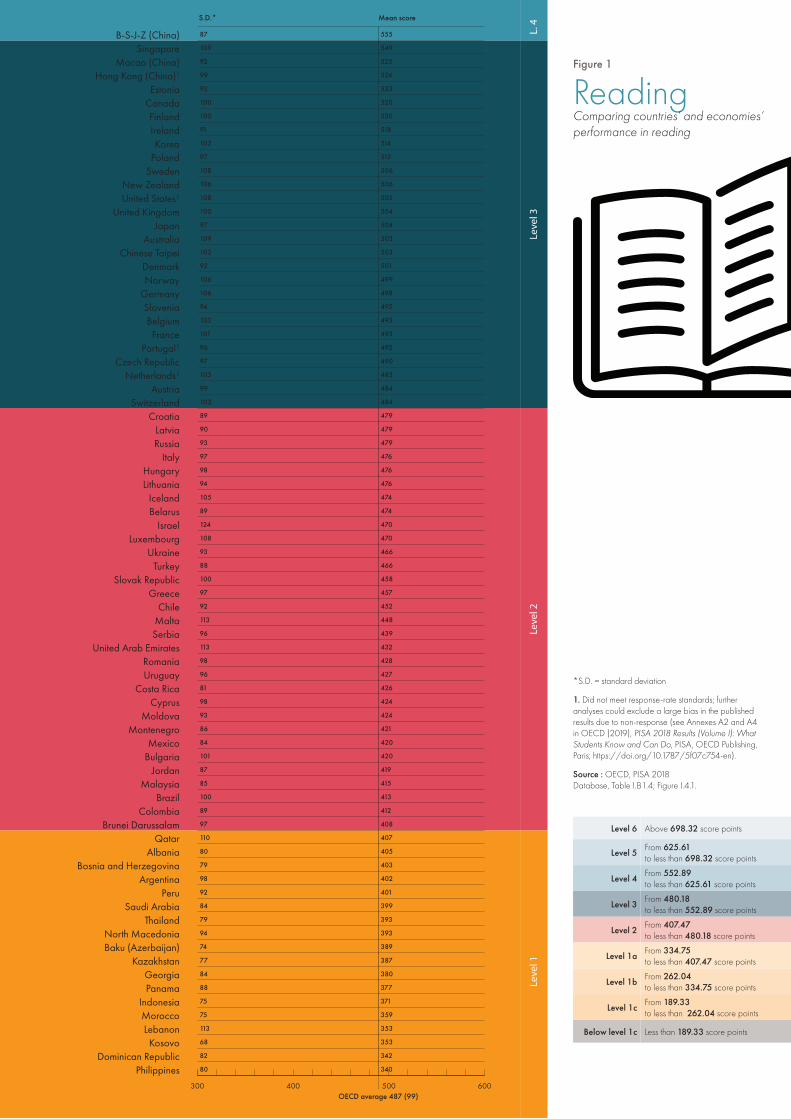
Level 6 Above 698.32 score points
Level 5 From 625.61 to less than 698.32 score points
Level 4 From 552.89 to less than 625.61 score points
Level 3 From 480.18 to less than 552.89 score points
Level 2 From 407.47 to less than 480.18 score points
Level 1a From 334.75 to less than 407.47 score points
Level 1b From 262.04 to less than 334.75 score points
Level 1c From 189.33 to less than 262.04 score points
Below level 1c Less than 189.33 score points
*S.D. = standard deviation
1. Did not meet response-rate standards; further analyses could exclude a large bias in the published results due to non-response (see Annexes A2 and A4 in OECD (2019), PISA 2018 Results (Volume I): What Students Know and Can Do, PISA, OECD Publishing, Paris; https://doi.org/10.1787/5f07c754-en).
Source : OECD, PISA 2018 Database, Table I.B1.4; Figure I.4.1.
Level 6 Above 669.30 score points
Level 5 From 606.99to less than 669.30 score points
Level 4 From 544.68 to less than 606.99 score points
Level 3 From 482.38 to less than 544.68 score points
Level 2 From 420.07 to less than 482.38 score points
Level 1 From 357.77 to less than 420.07 score points
Below level 1 Below 357.77 score points
*S.D. = standard deviation
1. Data did not meet the PISA technical standards but were accepted as largely comparable (see Annexes A2 and A4 in OECD (2019), PISA 2018 Results (Volume I): What Students Know and Can Do, PISA, OECD Publishing, Paris; https://doi.org/10.1787/5f07c754-en.
Source : OECD, PISA 2018 Database, Table I.B1.5; Figure I.4.2.
L. 4
Leve
l 3Le
vel 2
Leve
l 1
OECD average 487 (99)
S.D.* Mean score
PhilippinesDominican Republic
KosovoLebanonMoroccoIndonesia
PanamaGeorgia
KazakhstanBaku (Azerbaijan)North Macedonia
ThailandSaudi Arabia
PeruArgentina
Bosnia and HerzegovinaAlbania
QatarBrunei Darussalam
ColombiaBrazil
MalaysiaJordan
BulgariaMexico
MontenegroMoldova
CyprusCosta Rica
UruguayRomania
United Arab EmiratesSerbiaMaltaChile
GreeceSlovak Republic
TurkeyUkraine
LuxembourgIsrael
BelarusIceland
LithuaniaHungary
ItalyRussiaLatvia
CroatiaSwitzerland
AustriaNetherlands¹
Czech RepublicPortugal¹
FranceBelgium
SloveniaGermanyNorwayDenmark
Chinese TaipeiAustralia
JapanUnited Kingdom
United States¹New Zealand
SwedenPolandKorea
IrelandFinland
CanadaEstonia
Hong Kong (China)1
Macao (China)Singapore
B-S-J-Z (China) 555
549
525
524
523
520
520
518
514
512
506
506
505
504
504
503
503
501
499
498
495
493
493
492
490
485
484
484
479
479
479
476
476
476
474
474
470
470
466
466
458
457
452
448
439
432
428
427
426
424
424
421
420
420
419
415
413
412
408
407
405
403
402
401
399
393
393
389
387
380
377
371
359
353
353
342
340
87
109
92
99
93
100
100
91
102
97
108
106
108
100
97
109
102
92
106
106
94
103
101
96
97
105
99
103
89
90
93
97
98
94
105
89
124
108
93
88
100
97
92
113
96
113
98
96
81
98
93
86
84
101
87
85
100
89
97
110
80
79
98
92
84
79
94
74
77
84
88
75
75
113
68
82
80
300 400 500 600
Leve
l 4Le
vel 3
Leve
l 2Le
vel 1
Belo
w L
evel
1
OECD average 489 (91)
Mean scoreS.D.*
Dominican RepublicPhilippines
PanamaKosovo
MoroccoSaudi Arabia
IndonesiaArgentina
BrazilColombia
LebanonNorth Macedonia
GeorgiaJordan
PeruCosta Rica
Bosnia and HerzegovinaMexico
QatarChile
UruguayThailand
Baku (Azerbaijan)Moldova
KazakhstanMontenegro
RomaniaBrunei Darussalam
United Arab EmiratesBulgariaAlbania
MalaysiaSerbiaCyprusGreeceUkraine
TurkeyIsrael
CroatiaMalta
BelarusUnited States¹
HungaryLithuania
SpainLuxembourg
Slovak RepublicItaly
RussiaAustraliaPortugal¹
New ZealandIcelandFranceLatvia
AustriaCzech Republic
IrelandGermanyNorway
United KingdomSwedenFinland
BelgiumSloveniaDenmarkCanada
SwitzerlandPoland
Netherlands¹EstoniaKoreaJapan
Chinese TaipeiHong Kong (China)¹
Macao (China)Singapore
B-S-J-Z (China) 591
569
558
551
531
527
526
523
519
516
515
512
509
509
508
507
502
502
501
500
500
499
499
496
495
495
494
492
491
488
487
486
483
481
481
481
478
472
472
464
463
454
453
451
451
448
440
437
436
435
430
430
430
423
421
420
419
418
417
414
409
406
402
400
400
398
394
393
391
384
379
379
373
368
366
353
353
325
80
94
81
94
100
86
100
82
93
90
94
92
82
89
95
82
91
93
90
95
78
93
93
80
93
90
93
96
92
86
94
100
98
88
91
91
92
93
102
87
108
88
94
89
95
97
83
83
97
106
91
94
83
87
94
89
88
85
85
98
78
82
75
84
85
88
93
106
81
88
84
79
79
76
77
77
78
71
300 400 500 600
ReadingComparing countries’ and economies’ performance in reading
MathematicsComparing countries’ and economies’ performance in mathematics
Figure 1 Figure 2

© OECD 2019 9
PISA 2018: Insights and Interpretations
Level 6 Above 707.93 score points
Level 5 From 633.33 to less than 707.93 score points
Level 4 From 558.73 to less than 633.33 score points
Level 3 From 484.14 to less than 558.73 score points
Level 2 From 409.54 to less than 484.14 score points
Level 1a From 334.94 to less than 409.54 score points
Level 1b From 260.54 to less than 334.94 score points
Below level 1b Below 260.54 score points
*S.D. = standard deviation
1. Data did not meet the PISA technical standards but were accepted as largely comparable (see Annexes A2 and A4 in OECD (2019), PISA 2018 Results (Volume I): What Students Know and Can Do, PISA, OECD Publishing, Paris; https://doi.org/10.1787/5f07c754-en.
Source : OECD, PISA 2018 Database, Table I.B1.6; Figure I.4.3.
Note: Bottom, second, ninth and top deciles correspond to the average performance of students who are in the corresponding deciles of the distribution of the PISA index of economic, social and cultural status across all countries and economies; the middle decile corresponds to students whose socio-economic status ranges from the 45th to the 55th percentile of this distribution. Only results of countries and economies with at least 3% of students in each international decile are shown. Countries and economies are ranked in ascending order of the mean reading performance of students in the international middle decile of socio-economic status.
Source: OECD, PISA 2018 Database, Table II.B1.2.2; Figure II.2.2.
L. 4
Leve
l 3Le
vel 2
Leve
l 1
OECD agerage 489 (94)
Mean scoreS.D.*
Dominican RepublicPhilippines
PanamaKosovo
MoroccoGeorgiaLebanon
Saudi ArabiaIndonesia
KazakhstanBaku (Azerbaijan)
Bosnia and HerzegovinaBrazil
ArgentinaPeru
North MacedoniaColombia
MontenegroCosta Rica
AlbaniaQatar
MexicoBulgariaRomaniaUruguayThailand
MoldovaJordan
Brunei DarussalamUnited Arab Emirates
MalaysiaCyprusSerbia
ChileGreece
MaltaIsrael
Slovak RepublicItaly
TurkeyUkraineBelarusCroatiaIceland
LuxembourgRussia
HungaryLithuania
SpainLatvia
AustriaNorway
Portugal1Denmark
FranceSwitzerland
IrelandCzech Republic
BelgiumSweden
United States1
AustraliaGermany
Netherlands1
United KingdomSlovenia
New ZealandPoland
Chinese TaipeiHong Kong (China)1
CanadaKorea
FinlandJapan
EstoniaMacao (China)
SingaporeB-S-J-Z (China) 590
551
544
530
529
522
519
518
517
516
511
508
507
505
503
503
503
502
499
499
497
496
495
493
493
492
490
490
487
483
482
481
478
477
475
472
471
469
468
468
464
462
457
452
444
440
439
438
434
431
429
428
426
426
426
424
419
419
417
416
415
413
413
404
404
404
398
398
397
396
386
384
383
377
365
365
357
336
83
97
83
88
92
96
98
96
86
99
92
102
88
99
104
103
101
99
98
99
94
88
97
96
91
92
98
96
84
89
90
94
84
98
91
90
85
91
84
90
96
111
107
86
83
92
93
77
103
96
88
89
82
87
90
95
74
103
74
73
81
82
92
80
90
90
77
74
76
69
79
95
81
67
65
85
75
71
300 400 500 600
Middle decile
Top decileSecond decileNinth decileBottom decile
300 350 400 450 500 550 600 650Mean score
Country / Economy
KosovoDominican RepublicLebanonQatarPhilippinesMoroccoGeorgiaPanamaNorth MacedoniaKazakhstanIndonesiaBaku (Azerbaijan)United Arab EmiratesSaudi ArabiaBrunei DarussalamBosnia and HerzegovinaMontenegroAlbaniaBulgariaThailandArgentinaPeruMalaysiaColombiaJordanBrazilRomaniaCosta RicaIcelandMexicoIsraelSerbiaMoldovaMaltaUruguayLuxembourgGreeceSlovak RepublicChileLithuaniaNetherlandsRussiaLatviaBelarusUkraineDenmarkHungaryCroatiaNorwayOECD averageSwitzerlandSloveniaBelgiumItalyTurkeySwedenFranceAustraliaAustriaNew ZealandCzech RepublicUnited StatesPortugalUnited KingdomKoreaCanadaFinlandPolandJapanGermanyChinese TaipeiIrelandEstoniaMacao (China)Hong Kong (China)SingaporeB-S-J-Z (China)
ScienceComparing countries’ and economies’ performance in science
Figure 3Figure 4•Mean performance in reading, by international decile of socio-economic status
10 © OECD 2019 © OECD 2019 11
PISA 2018: Insights and InterpretationsPISA 2018: Insights and Interpretations
Notes: Figures are for illustrative purposes only. Countries and economies are grouped according to the overall direction of their trend (the sign and significance of the average three-year trend) and to the rate of change in the direction of their trend (the sign and significance of the curvature in the estimate of quadratic trends). Only countries and economies with data from at least five PISA reading assessments are included. Not all countries and economies can compare their students’ performance over the same period. For each country/economy, the base year, starting from which reading results can be compared, is indicated in parentheses next to the country’s/economy’s name (“00” = 2000, “01” = 2001, etc.). Both the overall direction and the change in the direction may be affected by the period considered. OECD average-23 refers to the average of all OECD countries with valid data in all seven assessments; Austria, Chile, Estonia, Israel, Luxembourg, the Netherlands, the Slovak Republic, Slovenia, Spain, Turkey, the United Kingdom and the United States are not included in this average.
Source: OECD, PISA 2018 Database, Table I.B1.10; Figure I.9.1.
200920062000 2003 201820152012 200920062000 2003 201820152012 200920062000 2003 201820152012
200920062000 2003 201820152012 200920062000 2003 201820152012 200920062000 2003 201820152012
200920062000 2003 201820152012 200920062000 2003 201820152012 200920062000 2003 201820152012
Positive, but flattening(less positive over more recent years)
Increasingly positive Steadily positive
Coun
trie
s/ec
onom
ies
with
a p
ositi
ve a
vera
ge tr
end
Coun
trie
s/ec
onom
ies
with
no
sign
ifica
nt a
vera
ge tr
end
Coun
trie
s/ec
onom
ies
with
a n
egat
ive
aver
age
tren
d
Australia (00)Finland (00)Iceland (00)New Zealand (00)
Sweden (00)
Hump-shaped(more negative over more recent years)
U-shaped(more positive over more recent years)
Flat
Negative, but flattening(less negative over more recent years)
Increasingly negative Steadily negative
PISA reading score PISA reading score PISA reading score
PISA reading score PISA reading score PISA reading score
PISA reading score PISA reading score PISA reading score
Austria (00)Bulgaria (01)Canada (00)Croatia (06)Denmark (00)France (00)
Italy (00)Japan (00)Mexico (00)Norway (00)United States (00)
OECD average-23 (00)Belgium (00)Greece (00)Hong Kong (China) (02)Hungary (00)Indonesia (01)
Latvia (00)Luxembourg (03)Switzerland (00)Chinese Taipei (06)Turkey (03)
Korea (00)Netherlands (03)Thailand (01)
Jordan (06)Macao (China) (03)Russia (00)
Estonia (06)Portugal (00)
Argentina (01)Czech Republic (00)Ireland (00)Slovenia (06)Uruguay (03)
Albania (01)Chile (01)Colombia (06)Germany (00)Israel (02)
Montenegro (06)Peru (01)Poland (00)Qatar (06)Romania (06)
Figure 5•Curvilinear trajectories of average performance in reading across PISA assessmentsDirection and trajectory of trend in mean performance
OECD average saw remarkable improvements in their students’ performance, most notably Albania, the Republic of Moldova, Peru and Qatar. Turkey’s improvement between 2003 and 2018 may look somewhat less impressive, but Turkey was able to double the coverage of the 15-year-olds who are enrolled in school and covered by PISA from 36% to 73% during that period. Five other countries – namely Albania, Brazil, Indonesia, Mexico and Uruguay – also significantly increased enrolment rates in secondary education over their participation in PISA and maintained or improved their mean reading, mathematics and science performance. This shows that the quality of education does not have to be sacrificed when increasing access to schooling.
Some countries were able to move to a more positive trajectory in recent years after a period of stagnation or decline. Sweden showed an improving trend in all three subjects between 2012 and 2018, reversing earlier declines in mean performance. Argentina, the Czech Republic and Ireland saw recent improvements in reading; Denmark, Ireland, Jordan, Slovenia and the United Kingdom in mathematics; and Jordan and Montenegro in science. In some countries, some of these trends can be related to changes in the demographic composition of the student body; but in no country do such demographic changes alter the picture dramatically.
PISA also shows that in most countries excellence in education is apparent amongst some of the most disadvantaged students and schools. On average across OECD countries, one in ten disadvantaged students was able to score in the top quarter of reading performance in his or her country, indicating that disadvantage is not destiny. In fact, in Australia, Canada, Estonia, Ireland and the United Kingdom, all of which scored above the OECD average, more than 13% of disadvantaged students were academically resilient. Similarly, more than 30% of immigrant students in Brunei Darussalam, Jordan, Panama, Qatar, Saudi Arabia and the United Arab Emirates scored in the top quarter of reading performance. These successes do not come about by chance. Factors that PISA shows to be positively associated with academic resilience include support from parents, a positive school climate and having a growth mindset (see more on this later).
In the same way as social disadvantage does not automatically lead to poor educational performance for students and schools, the world is no longer divided between rich and well-educated nations and poor and badly educated ones. When comparing countries that score similarly in PISA, their income levels vary widely. History shows that countries with
the determination to build a first-class education system can achieve this even in adverse economic circumstances, and their schools today will be their economy and society tomorrow. So it can be done.
And it must be done. Without the right education, people will languish on the margins of society, countries will not be able to benefit from technological advances, and those advances will not translate into social progress. It will not be possible to develop fair and inclusive policies and engage all citizens if a lack of education prevents people from fully participating in society.
But change can be an uphill struggle. Young people are less likely to invest their time and energy in better education if that education seems irrelevant to the demands of the “real” world. Businesses are less likely to invest in their employees’ lifelong learning if those workers might move away for a better job. Policy makers often prioritise the urgent over the important – even if the latter includes education, an investment in the future well-being of society.
Read more about these issues in Chapters 4 and 9 in PISA 2018 Results (Volume I): What Students Know and Can Do. https://doi.org/10.1787/5f07c754-en
And in Chapter 2 in PISA 2018 Results (Volume II): Where All Students Can Succeed. https://doi.org/ 10.1787/b5fd1b8f-en
12 © OECD 2019 © OECD 2019 13
PISA 2018: Insights and InterpretationsPISA 2018: Insights and Interpretations
Getting ready for the digital world
While people have different views on the role that digital technology can and should play in schools, we cannot ignore how digital tools have so fundamentally transformed the world outside of school. Everywhere, digital technologies are offering firms new business models and opportunities to enter markets and transform their production processes. They can make us live longer and healthier, help us with boring or dangerous tasks, and allow us to travel into virtual worlds. People who cannot navigate through the digital landscape can no longer participate fully in our social, economic and cultural life.
PISA shows how access to new technologies has increased at a remarkable rate. In the 2009 PISA assessment, about 15% of students in OECD countries, on average, reported that they did not have access to the Internet at home. By 2018, that proportion had shrunk to less than 5%. The growth in access to online services is likely to be even steeper than suggested by these percentages, which hide the improvements in the quality of Internet services and the explosion of mobile Internet access over the past decade.
Furthermore, in all countries that distributed an optional questionnaire on students’ familiarity with these technologies as part of PISA 2018, the amount of time that 15-year-old students in OECD countries spent on line outside of school increased between 2012 and 2018 – by an average of more than 1 hour per day (on both weekdays and weekends). Students now spend about 3 hours on line outside of school on weekdays, on average, and almost 3.5 hours on line
on weekend days. For young people, the digital world is becoming a sizeable part of the real world.
While improved access to new technologies provides unprecedented opportunities, it also raises the bar of what it means to be proficient in reading. Students growing up with a great smartphone but a poor education will face real risks. The smartphone has transformed the ways in which people read and exchange information; and digitalisation has resulted in the emergence of new forms of text, ranging from the concise (text messages; annotated search-engine results) to the lengthy and unwieldy (tabbed, multipage websites or complex archival material). In the past, students could find clear and often singular answers to their questions in carefully curated and government-approved textbooks, and they could generally trust those answers to be true. Today, they will find hundreds of thousands of answers to their questions on line, and it is up to them to figure out what is true and what is false, what is right and what is wrong. While in many offline situations readers can assume that the author of the text they are reading is competent, well-informed and benevolent, when reading online blogs, forums or news sites readers must constantly assess the quality and reliability of the information, based on implicit or explicit cues related to the content, format or source of the text.
This is not exactly a new phenomenon, but the speed, volume and reach of information flows in the current digital ecosystem have created the perfect conditions for fake news to thrive, affecting public opinion and
14 © OECD 2019 © OECD 2019 15
PISA 2018: Insights and InterpretationsPISA 2018: Insights and Interpretations
will need to help students develop a strong sense of right and wrong, a sensitivity to the claims that others make on them, and a grasp of the limits on individual and collective action. At work, at home and in the community, people will need a deep understanding of how others live, in different cultures and traditions, and how others think, whether as scientists or artists. The PISA 2018 assessment of global competence explored some of these capacities. Results from that assessment will be published in 2020.
Read more about these issues in Chapters 1 and 5 in PISA 2018 Results (Volume I): What Students Know and Can Do. https://doi.org/10.1787/5f07c754-en
political choices. In this “post-truth” climate, quantity seems to be valued more than quality when it comes to information. Assertions that “feel right” but have no basis in fact become accepted as truth. Algorithms that sort people into groups of like-minded individuals create social media echo chambers that amplify views, and leave individuals uninformed of and insulated from opposing arguments that may alter their beliefs. There is a scarcity of attention, but an abundance of information.
The more knowledge that technology allows students to search and access, the more important becomes deep understanding and the capacity to make sense of content. Understanding involves knowledge and information, concepts and ideas, practical skills and intuition. But fundamentally it involves integrating and applying all of these in ways that are appropriate to the learner’s context. Reading is no longer mainly about extracting information; it is about constructing knowledge, thinking critically and making well-founded judgements. Contrast this with the findings from this latest round of PISA, which show that fewer than 1 in 10 students in OECD countries was able to distinguish between fact and opinion, based on implicit cues pertaining to the content or source of the information. Education has won the race with technology throughout history, but there is no guarantee that it will do so in the future.
The PISA assessments have evolved to better capture these demands. In the 2018 assessment, the description of what top-performing students are able to do in reading included not only being able to understand and communicate complex information, but also the capacity to distinguish between fact and opinion when reading about an unfamiliar topic. The nature of texts and the type of problems included in the PISA 2018 assessment of reading reflected the evolving nature of reading in increasingly digital societies. Specifically, the 2018 reading assessment placed greater emphasis on the ability to find, compare, contrast and integrate information across multiple sources. In order to assess multiple-source reading, new assessment tasks were designed, based on texts composed of several smaller units, each created by a different author or authors or at different times. Examples of these kinds of texts are an online forum with multiple posts and a blog that links to a newspaper article. Computer delivery made it possible to use various digital navigation tools, such as hyperlinks or tabs, and to present such tasks in realistic scenarios, in which the amount of available text
sources increases as the student progresses through the assessment. (To see what some of these tasks were like, go to www.oecd.org/pisa/test/)
The results from the PISA 2018 assessment suggest that improvements in education have not kept up with these rising demands. The proportion of 15-year-old students who scored at the highest levels rose only marginally across OECD countries, from 7% in 2009 to 9% in 2018. These students, who attained Level 5 or 6 in the PISA reading test, were able to comprehend lengthy texts, deal with concepts that are abstract or counterintuitive, and establish distinctions between fact and opinion, based on implicit cues pertaining to the content or source of the information. Even in Singapore, the country with the largest share of top performers, only one in four 15-year-old students was able to reach this level. In the four participating Chinese provinces/municipalities, Canada, Finland and Hong Kong (China), at least one in seven students were able to do so.
Beyond the requisite knowledge and skills, PISA also shows that students seem to read less for leisure and to read fewer books of fiction, magazines or newspapers because they want to (as opposed to because they have to). Instead, they read more to fulfil practical needs, and they read more in online formats, such as chats, online news or websites containing practical information. In 2018, more students considered reading “a waste of time” (+5 percentage points, on average across OECD countries) and fewer students read for enjoyment (-5 percentage points) than their counterparts did in 2009.
Humans were always better at inventing new tools than using them wisely, but as the influence that schools – and families – have over what students read declines, it is essential that schools redouble their efforts to promote reading proficiency to meet the demands of the digitalised world. All students need to be able to read complex texts, distinguish between credible and untrustworthy sources of information, and between fact and fiction, and question or seek to improve the accepted knowledge and practices of our times.
Beyond that, in a world shaped by artificial intelligence, education is no longer just about teaching people something, but about helping people build a reliable compass and the navigation tools to find their own way through an increasingly volatile, uncertain and ambiguous world. Tomorrow’s schools will need to help students think for themselves and join others, with empathy, in work and citizenship. They

16 © OECD 2019 © OECD 2019 17
PISA 2018: Insights and InterpretationsPISA 2018: Insights and Interpretations
Note: Countries and economies are ranked in descending order of the percentage of students who performed at or above Level 2.
Source: OECD, PISA 2018 Database, Tables I.B1.1 and I.A2.1; Figures I.5.1 and I.5.2.
B-S-J-Z China)Macao China)
EstoniaSingapore
IrelandHong Kong China)
FinlandCanadaPoland
KoreaDenmark
JapanUnited Kingdom
Chinese TaipeiSloveniaSweden
New ZealandUnited States
NorwayAustraliaPortugal
GermanyCzech Republic
FranceBelgium
CroatiaRussiaLatvia
OECD averageItaly
BelarusAustria
SwitzerlandNetherlands
LithuaniaHungary
TurkeyIceland
LuxembourgGreece
IsraelSlovak Republic
ChileMalta
SerbiaUruguay
Costa RicaUnited Arab Emirates
MontenegroMexico
MalaysiaBulgaria
ColombiaBrazilQatar
Brunei DarussalamAlbania
Bosnia and HerzegovinaPeru
ThailandBaku (Azerbaijan)
KazakhstanPanamaGeorgia
IndonesiaMorocco
KosovoDominican Republic
Philippines
Level 6Level 5Level 4Level 3Level 2Level 1aLevel 1bLevel 1cBelow Level 1c
Students at Level 2 or aboveStudents at Level 1a or below
% 020 2040 4060 6080 80100 100
UkraineRomania
JordanMoldova
ArgentinaSaudi Arabia
North MacedoniaLebanon
Figure 6a
Figure 6b Students’ proficiency in reading (paper-based assessment)
Figure 6•Students’ proficiency in reading (6a: computer-based assessment/6b: paper-based assessment)
Building strong foundations
The rising bar of success in education in the digital age puts even greater pressure on education systems to secure strong foundations. There is a great risk that technology will super-empower those with strong knowledge and skills while leaving those with weak foundations further behind.
Only 77% of students, on average across OECD countries, attained Level 2 proficiency in reading (Figure 6). Level 2 marks the point at which students have acquired the technical skills to read, and can use reading for learning. At a minimum, these students are able to identify the main idea in a text of moderate length, find information based on explicit criteria, and reflect on the purpose and form of texts when explicitly directed to do so.
The share of 15-year-old students, in grade 7 and above, who reached this basic level of proficiency in reading ranged from close to 90% in the four provinces/municipalities of China, Estonia, Macao (China) and Singapore, to less than 10% in Cambodia, Senegal and Zambia (countries that participated in the PISA for Development assessment in 2017). The share of 15-year-old students who attained minimum levels of proficiency in mathematics (at least Level 2) varied even more – between 98% in Beijing, Shanghai, Jiangsu and Zhejiang (China) and 2% in Zambia. These numbers show that all countries still have some way to go towards reaching the global goals for quality education, as defined in the UN Sustainable Development Goal for education, and for many countries it remains a long way. Some 78% of students attained Level 2 or higher in science, on
average across OECD countries. These students can recognise the correct explanation for familiar scientific phenomena and can use such knowledge to identify, in simple cases, whether a conclusion is valid based on the data provided.
In some education systems low performers are spread across many different schools, while in others, low performers tend to be clustered in certain schools, often compounded with social disadvantage. In some of these countries the between-school variation in performance is the result of stratification and selection, and thus an in-built feature of the school system. In systems where low performers are more often concentrated in specific schools or types of schools, such as Germany, Hungary, Israel, Lebanon, the Netherlands, the Slovak Republic and Turkey, it is important to ensure that especially those schools with low performance receive adequate resources and support.
Interventions can also be targeted at socio-economically disadvantaged students and/or schools. In almost all countries that participated in PISA 2018, students who were disadvantaged compared with their peers in their country were less likely to attain the minimum level of proficiency in reading. However, the strength of the relationship between a student’s socio-economic status and his or her performance varied greatly across countries and economies. In systems where the relationship between the two was particularly strong, including Belarus, France, Hungary, Luxembourg, Peru, the Philippines, Romania and the Slovak Republic, interventions targeting disadvantaged students

18 © OECD 2019 © OECD 2019 19
PISA 2018: Insights and InterpretationsPISA 2018: Insights and Interpretations
would be particularly important. Since in Belarus, Hungary, Peru, the Philippines and the Slovak Republic disadvantaged students were clustered in certain schools, interventions targeting these schools would be most appropriate.
In many countries, immigrant students tended to be less likely than their native-born peers to attain the minimum level of proficiency in reading. Targeted support for immigrant students would seem most appropriate in Belgium, Denmark, Finland, Germany, Iceland, the Netherlands, Slovenia and Sweden, where at least 5% of students have an immigrant background. These students are at least three times as likely as students without an immigrant background to score below the minimum level of proficiency in reading.
Boys, especially disadvantaged boys, also need special support if they are to improve their reading performance. In all but 3 PISA-participating countries and economies (the exceptions are the 4 PISA-participating provinces/municipalities of China, Estonia and Macao [China]) at least 20% of disadvantaged boys did not attain the minimum level of proficiency in reading. In 24 countries and economies, more than 70% of disadvantaged boys scored below that level.
Perhaps most worryingly, the proportion of low performers, both girls and boys, increased between 2009 and 2018, on average across OECD countries. While in all PISA-participating countries and economies girls outperformed boys in reading in 2018, in 20 countries and economies girls’ reading performance declined over the past decade. Iceland, Italy, Japan and New Zealand, in particular, need to monitor this decline closely, even though boys’ performance remained stable in these countries over the period.
Evidence from PISA shows that boys and girls can improve their performance. In the Czech Republic, Denmark, Estonia, Ireland, Macao (China), Singapore, Slovenia, the United Kingdom and the United States, the proportion of top performers in reading increased amongst both boys and girls, while the proportion of low performers in reading remained stable or shrank. The Czech Republic, Denmark, Macao (China), Singapore and Slovenia also saw a narrowing of the gender gap in mathematics performance while achieving at high levels.
Some worry that if efforts and resources are directed towards low-performing students, high-performing students will suffer. However, PISA results show that countries can pull up low performers without adversely affecting other students. For example, 22 countries and economies saw improvements in the average
reading score amongst the lowest-performing 10% of students; none of them saw a decline in average performance and 14 saw improvements. In only two of these 22 countries and economies did the scores of the highest-performing 10% of students actually decline.
Read more about these issues in Chapters 4-10 in PISA 2018 Results (Volume I): What Students Know and Can Do. https://doi.org/10.1787/5f07c754-en
And in Chapters 2, 4, 7, 9 and 10 in PISA 2018 Results (Volume II): Where All Students Can Succeed. https://doi.org/ 10.1787/b5fd1b8f-en
Reconciling equity and excellence
For those with the right knowledge and skills, digitalisation and globalisation have been liberating and exciting; but for those who are insufficiently prepared, they often mean vulnerable and insecure work, and a life with few prospects. Economies are shifting towards regional hubs of production that are linked together by global chains of information and goods, but that are concentrated where comparative advantage can be built and renewed. This makes the distribution of knowledge and wealth crucial, and that is linked to the distribution of education opportunities.
For a start, PISA shows that the performance gap between top-performing and low-achieving students varies widely across education systems. The largest gaps were found in Israel, Lebanon, Malta and the United Arab Emirates, meaning that learning outcomes at age 15 in these countries are highly unequal. Not surprisingly, the smallest differences between high and low-achieving students tended to be observed amongst countries and economies with the lowest mean scores. In Kosovo, Morocco and the Philippines, even the highest-performing students scored only around the OECD average. Countries also differed in the performance variation that lay between schools. In Finland, less than 7% of that variation lay between schools, so the closest school is always the best school. In Israel, that proportion was 78% (Figure 7).
Equity and socio-economic statusHowever, equity does not mean that all students have equal outcomes in every subject; rather it means that whatever variations there may be in education outcomes, these should not be related to students’
background, including socio-economic status, gender or immigrant background. In other words, there can be numerous reasons why some students perform better than others, but the performance differences should not be the result of the conditions in which students learn. Therefore, PISA measures equity by the extent to which education outcomes, such as student performance, students’ attitudes and beliefs, and students’ expectations for their future, are related to students' personal background. The weaker the relationship, the more equitable PISA considers a school system to be.
The motivation for that approach to defining equity is simple: children from wealthier families may find many open doors to a successful life, but children from poor families often have just one chance in life – and that is a good teacher and school that give them an opportunity to develop their potential. Those who miss that boat rarely catch up, and OECD data show that subsequent education opportunities in life tend to reinforce early education outcomes.
In France, Germany, Hungary, Israel, Peru and the Slovak Republic, the gap in reading performance between the 10% most socio-economically advantaged and the 10% most disadvantaged students was over 170 score points – the equivalent of well over four years of schooling in the countries that were able to estimate progress across school grades. Of course, where there are students with economic or social advantages, it is likely that they will be better equipped to do well. This is not just about poverty of material resources, but equally about poverty of aspirations and hope. However, and as noted before, in some countries even the most disadvantaged

20 © OECD 2019 © OECD 2019 21
PISA 2018: Insights and InterpretationsPISA 2018: Insights and Interpretations
Note: All analyses are restricted to schools with the modal ISCED level for 15-year-old students. Countries and economies are ranked in descending order of the between-school variation in reading performance, as a percentage of the total variation in performance across OECD countries.
Source: OECD, PISA 2018 Database, Table II.B1.4.1; Figure II.4.1.
Within-school variation Between-school variation
110 100 90 80 70 60 50 40 30 20 10 0 10 20 30 40 50 60 70 80 90
FinlandIceland
Baku (Azerbaijan)NorwayIreland
DenmarkCanada
PortugalNew Zealand
EstoniaPoland
SwedenUnited Kingdom
KosovoLatvia
AlbaniaMexico
GeorgiaUnited States
Bosnia and HerzegovinaSaudi Arabia
MalaysiaAustralia
KazakhstanCosta Rica
BelarusPhilippines
JordanMontenegro
MoroccoChile
IndonesiaMacao (China)
MoldovaRussia
ThailandDominican Republic
Ukraine
OECD averageGreece
ColombiaFranceKorea
Chinese TaipeiLithuania
PanamaCroatia
B-S-J-Z (China)Uruguay
MaltaBrazil
Hong Kong (China)Peru
Brunei DarussalamNorth Macedonia
SingaporeLuxembourg
JapanSwitzerland
ArgentinaSloveniaRomania
SerbiaBelgium
ItalyQatar
TurkeyCzech Republic
HungarySlovak Republic
GermanyBulgaria
United Arab EmiratesNetherlands
LebanonIsrael
%%
OEC
D av
erag
e 29
%
OEC
D av
erag
e 71
%
Less
bet
wee
n-sc
hool
var
iati
on
Figure 7•Variation in reading performance between and within schoolsstudents do well by international standards, which shows that this relationship is not inevitable.
More generally, PISA shows that the impact of social background on success in education varies greatly across countries. The most impressive outcome of world-class school systems is that they deliver high-quality education across the entire system. In Australia, Canada, Denmark, Estonia, Finland, Hong Kong (China), Japan, Korea, Macao (China), Norway and the United Kingdom, for example, average reading performance was higher than the OECD average while the relationship between socio-economic status and reading performance was weaker than the OECD average.
There seems to be no association between trends in mean performance and a widening or narrowing of performance gaps. Some countries improved in PISA mainly as a result of low-achieving students catching up to higher-performing students; others improved by nurturing high performance amongst their top-performing students; and many improved by helping all students succeed at higher levels.
The issue is more pertinent for education policy when it comes to the interplay between a student’s and a school’s social background and how these are related to learning outcomes. In many countries, the school’s socio-economic context influences the kind of education children are acquiring, and the quality of schooling can shape the socio-economic contexts of schools. If schools are popular, house prices in their catchment areas can rise, further segregating the population. People with fewer assets, lower income and less education end up finding housing where education and social opportunities are poorer. The result is that in most countries, differences in education outcomes related to social inequalities are stubbornly persistent, and too much talent remains latent. Although private schools tend to be more selective, which contributes to social segregation in the school system, in many countries most of the social segregation across schools comes from within the public sector rather than from social segregation between public and private schools (Figure 8).
Some countries still have a long way to go in moderating between-school differences. In Argentina, Bulgaria, the Czech Republic, Hungary, Peru, the Slovak Republic and the United Arab Emirates, a typical disadvantaged student has only a one-in-eight chance of attending the same school as high achievers (those who score in the top quarter of reading performance in PISA). By contrast, in 14 countries, including the OECD countries Canada, Denmark, Estonia, Finland,
Iceland, Ireland, Norway, Portugal and Sweden, disadvantaged students have at least a one-in-five chance of having high-achieving schoolmates.
High levels of social and ability stratification between schools can have an impact on the learning opportunities available to students and thus on education outcomes. Limited social diversity in schools implies that disadvantaged students are more likely to be enrolled in schools that have disproportionately large concentrations of low achievers – which, may negatively affect their performance. Unless disadvantaged schools are allocated sufficient resources to compensate for their shortfalls, social and academic segregation between schools may widen the gaps in outcomes related to socio-economic status.
The good news is that improving education is not all about the volume of resources. PISA results show that there is a positive relationship between investment in education and average performance – up to a threshold of USD 50 000 in cumulative expenditure per student from age 6 to 15 (Figure 9). However, after that threshold, there is almost no relationship between the amount invested in education and student performance. For example, Estonia and Latvia invest similarly in primary and lower secondary education (a cumulative expenditure of about USD 65 000 per student), yet Estonia scored more than 40 points above Latvia in reading. In turn, Australia, the United Kingdom and the United States all spend more than USD 107 000 per student from age 6 to 15, yet scored no better than (and in some cases, below) Canada, Ireland and New Zealand, all of which spend between 10% and 30% less. The results are similar when it comes to the relationship between spending per student and the impact of social background on reading performance, i.e. the countries spending more do not necessarily show a weaker relationship between students’ socio-economic status and their performance.
What may matter more after a threshold is reached is how resources are allocated. The picture is similar when comparing the learning time that students invest (Figure 10). In Finland, the country where students spend the least time learning, student performance is comparatively high, whereas in the United Arab Emirates, the country with the longest study hours, learning outcomes are comparatively poor. The lack of a correlation between the amount of learning time and learning outcomes illustrates that learning outcomes are always the product of the quantity of learning time, and the quality of learning and the instructional environment.
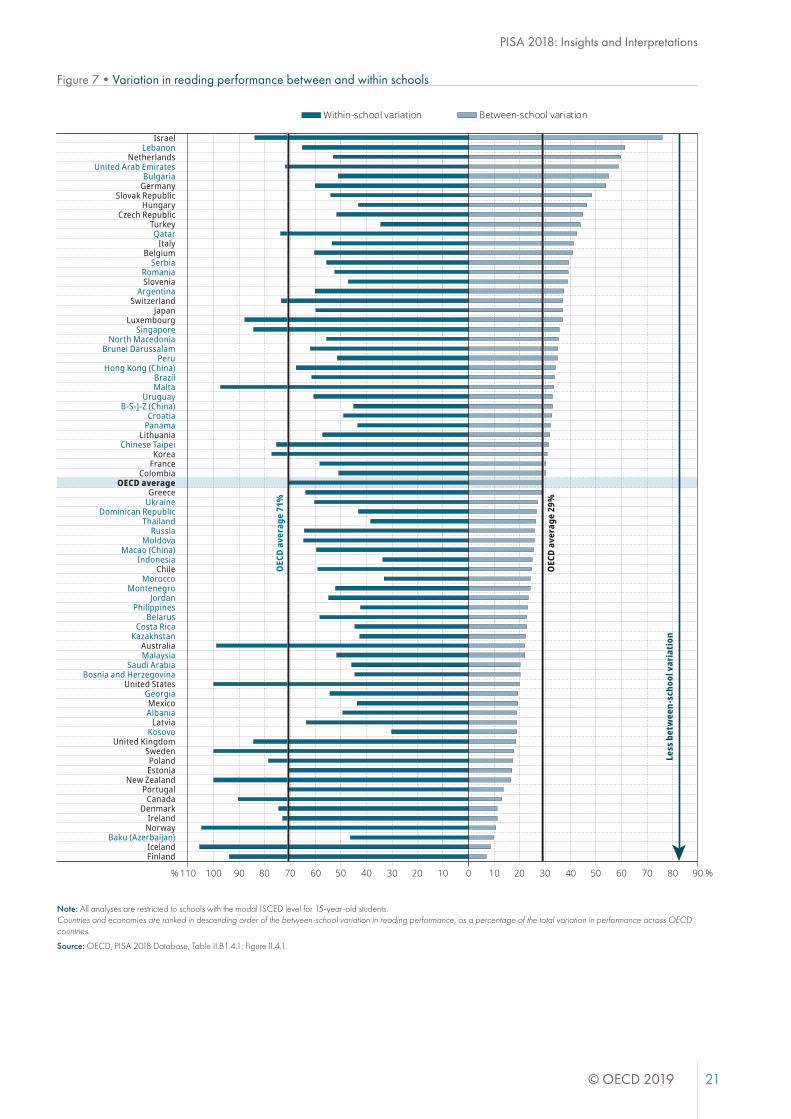
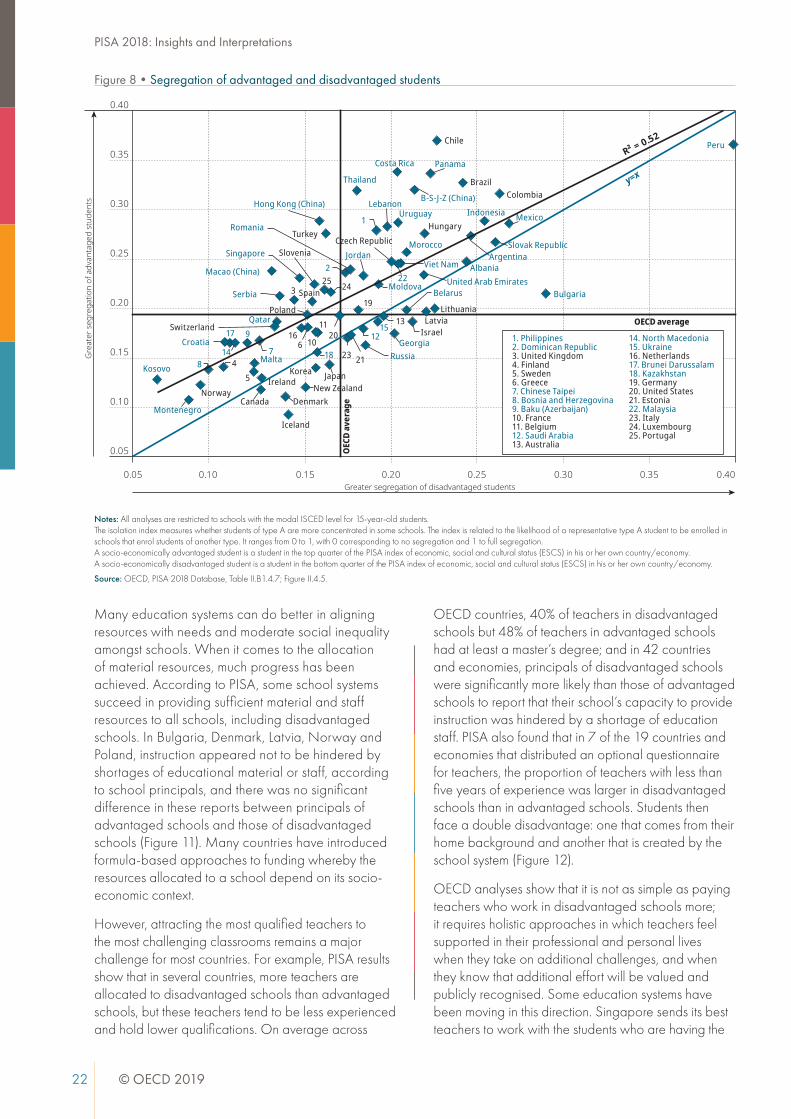
22 © OECD 2019 © OECD 2019 23
PISA 2018: Insights and InterpretationsPISA 2018: Insights and Interpretations
Notes: All analyses are restricted to schools with the modal ISCED level for 15-year-old students. The isolation index measures whether students of type A are more concentrated in some schools. The index is related to the likelihood of a representative type A student to be enrolled in schools that enrol students of another type. It ranges from 0 to 1, with 0 corresponding to no segregation and 1 to full segregation. A socio-economically advantaged student is a student in the top quarter of the PISA index of economic, social and cultural status (ESCS) in his or her own country/economy. A socio-economically disadvantaged student is a student in the bottom quarter of the PISA index of economic, social and cultural status (ESCS) in his or her own country/economy.
Source: OECD, PISA 2018 Database, Table II.B1.4.7; Figure II.4.5.
Source: OECD, PISA 2018 Database, Tables I.B1.4 and Figure; 1.4.4.
y=x
0.05
0.10
0.15
0.20
0.25
0.30
0.35
0.40
0.05 0.10 0.15 0.20 0.25 0.30 0.35 0.40
Gre
ater
seg
rega
tion
of a
dvan
tage
d st
uden
ts
Chile
Montenegro
Japan
Mexico
18
Hungary
10
Canada
Serbia
Macao (China)
Jordan
20
Argentina
Denmark
Viet Nam22
Lebanon
Morocco
Ireland
1517
Slovenia
IsraelQatar
23
Norway
13
Peru
Croatia
19
Panama
Malta
2
Russia
Albania
Czech Republic
Iceland
Bulgaria
21
5
LatviaSwitzerland
Singapore
Korea
SpainMoldova
New Zealand
Hong Kong (China)
11
Colombia
Turkey
16
Lithuania
Georgia
B-S-J-Z (China)
8
Thailand
9
Romania
4
Poland
Kosovo
25
Brazil
Costa Rica
United Arab Emirates
Slovak Republic
Uruguay Indonesia
14 712
6
1
24Belarus3
OEC
D av
erag
e
OECD average
1. Philippines2. Dominican Republic3. United Kingdom4. Finland5. Sweden6. Greece7. Chinese Taipei8. Bosnia and Herzegovina9. Baku (Azerbaijan)10. France11. Belgium12. Saudi Arabia13. Australia
14. North Macedonia15. Ukraine16. Netherlands17. Brunei Darussalam18. Kazakhstan19. Germany20. United States21. Estonia22. Malaysia23. Italy24. Luxembourg25. Portugal
R² = 0.52
Greater segregation of disadvantaged students
Cumulative expenditure per student over the theoretical duration of studies (in US dollars)
Average performance in reading (in score points)
300 000250 000200 000150 000100 00050 000
555
530
505
480
455
430
405
380
355
330
0 350 000
OEC
D av
erag
e: U
SD 8
9 09
2
OECD average: 487 points
R2 = 0.49
Argentina
Australia
Austria
Belarus
Belgium
Bosnia and HerzegovinaBrazil
Brunei Darussalam
Bulgaria
Canada
Chile
Chinese Taipei
Czech Republic
Dominican Republic
EstoniaFinland
FranceGermany
Greece
Hong Kong (China)
Hungary Iceland
Indonesia
Ireland
Israel
Italy
Japan
Jordan
Kazakhstan
Korea
Latvia
Lithuania Luxembourg
Macao (China)
Malaysia
MaltaMexico
MoldovaMontenegro
Netherlands
New Zealand
North Macedonia
Norway
Panama
Philippines
Poland
Portugal
Qatar
Romania
Russia
Serbia
Singapore
Slovak Republic
Slovenia
Sweden
Thailand
TurkeyUkraine
United Kingdom
Uruguay
Croatia
United States
Peru
Colombia
Figure 8•Segregation of advantaged and disadvantaged students Figure 9•Reading performance and spending on education
Many education systems can do better in aligning resources with needs and moderate social inequality amongst schools. When it comes to the allocation of material resources, much progress has been achieved. According to PISA, some school systems succeed in providing sufficient material and staff resources to all schools, including disadvantaged schools. In Bulgaria, Denmark, Latvia, Norway and Poland, instruction appeared not to be hindered by shortages of educational material or staff, according to school principals, and there was no significant difference in these reports between principals of advantaged schools and those of disadvantaged schools (Figure 11). Many countries have introduced formula-based approaches to funding whereby the resources allocated to a school depend on its socio-economic context.
However, attracting the most qualified teachers to the most challenging classrooms remains a major challenge for most countries. For example, PISA results show that in several countries, more teachers are allocated to disadvantaged schools than advantaged schools, but these teachers tend to be less experienced and hold lower qualifications. On average across
OECD countries, 40% of teachers in disadvantaged schools but 48% of teachers in advantaged schools had at least a master’s degree; and in 42 countries and economies, principals of disadvantaged schools were significantly more likely than those of advantaged schools to report that their school’s capacity to provide instruction was hindered by a shortage of education staff. PISA also found that in 7 of the 19 countries and economies that distributed an optional questionnaire for teachers, the proportion of teachers with less than five years of experience was larger in disadvantaged schools than in advantaged schools. Students then face a double disadvantage: one that comes from their home background and another that is created by the school system (Figure 12).
OECD analyses show that it is not as simple as paying teachers who work in disadvantaged schools more; it requires holistic approaches in which teachers feel supported in their professional and personal lives when they take on additional challenges, and when they know that additional effort will be valued and publicly recognised. Some education systems have been moving in this direction. Singapore sends its best teachers to work with the students who are having the
greatest difficulty meeting Singapore’s high standards. In Japan, officials in prefectural offices will transfer effective teachers to schools with weak faculties to make sure that all students have equally capable instructors. Shanghai has established a system of financial transfer payments to schools serving disadvantaged students and career structures that incentivise high-performing teachers to teach in disadvantaged schools. Shanghai also pairs high-performing districts and schools with low-performing districts and schools, so that the authorities in each can exchange and discuss their development plans with each other, and institutes for teachers’ professional development can share their curricula, teaching materials and good practices. The government commissions “strong” public schools to take over the administration of “weak” ones by having the “strong” school appoint one of its experienced leaders, such as the deputy principal, to be the principal of the “weak” school, and sending a team of experienced teachers to lead in teaching. The
underlying expectation is that the ethos, management style and teaching methods of the high-performing school can be transferred to the poorer-performing school.
In the state of Ceará, in Brazil, the highest-performing schools receive a significant reward in additional financial resources that allows them to hire more specialised teachers and experts. They do not use these additional resources in their own school; but are required to allocate them to the schools that struggle most. So everyone wins: the high-performing schools gain additional prestige and an expanded team, and the low-performing schools benefit from the expertise of high-performing schools – which might have been more valuable to them than additional money.
All this being said, it is often difficult for teachers to allocate scarce additional time and resources to the children with the greatest needs. People who laud
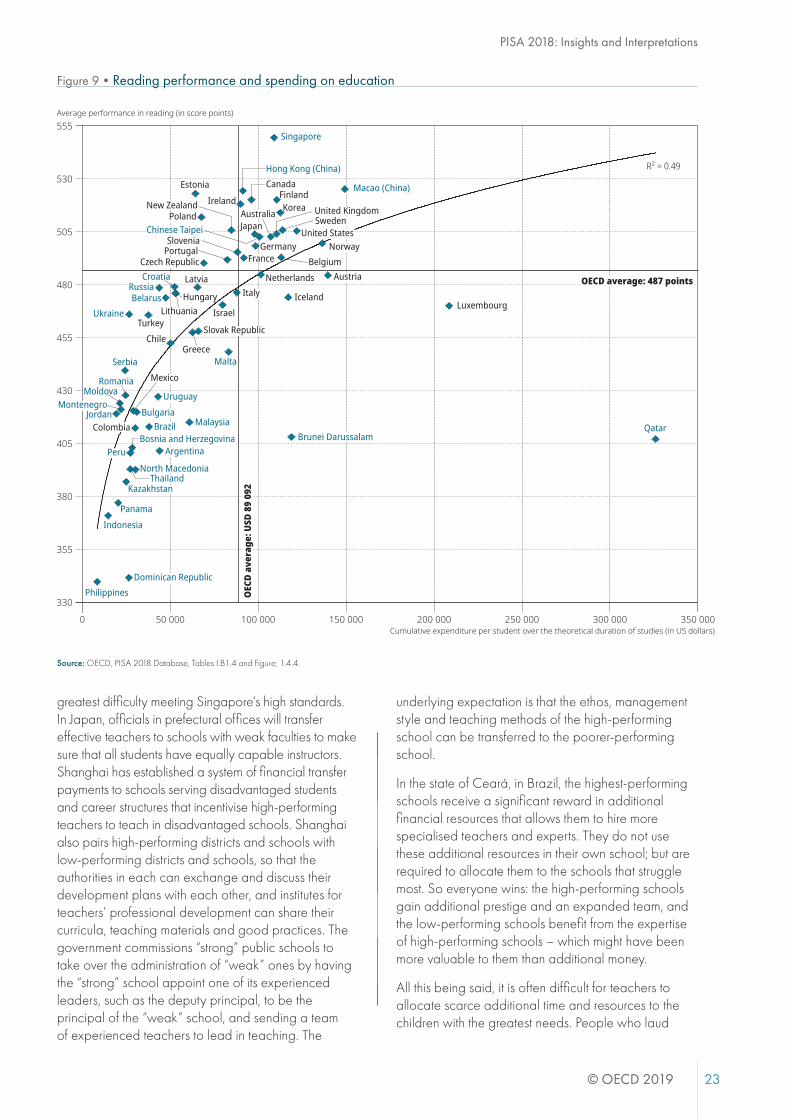

24 © OECD 2019 © OECD 2019 25
PISA 2018: Insights and InterpretationsPISA 2018: Insights and Interpretations
Notes: Statistically significant differences are shown in a darker tone. The socio-economic profile is measured by the school’s average PISA index of economic, social and cultural status. For this analysis, the sample is restricted to schools with the modal ISCED level for 15-year-old students. Countries and economies are ranked in ascending order of the difference in the mean index of shortage of education staff.
Source: OECD, PISA 2018 Database, Tables II.B1.5.13 and II.B1.5.14; Figure II.5.5.
Note: Learning time is based on reports by 15-year-old students in the same country/economy in response to the PISA 2015 questionnaire. For Beijing-Shanghai-Jiangsu-Zhejiang (China) (labelled as B-J-S-Z [China] on the figure), data on learning time amongst students from Beijing-Shanghai-Jiangsu-Guangdong (China) were used.
Source: OECD, PISA 2018 Database, Table I.B1.4; and OECD, PISA 2015 Database, Figure II.6.23; and PISA 2018 Figure I.4.5.
Learning time (in hours per week)
Average performance in reading (in score points)
55504540
555
530
505
480
455
430
405
380
355
330
35 60
OEC
D av
erag
e: 4
4 ho
urs
OECD average: 487 points
Australia
Austria
B-S-J-Z (China)
Belgium
BrazilBulgaria
Canada
Chile
Chinese Taipei
Colombia
Costa Rica
Czech Republic
Denmark
Dominican Republic
EstoniaFinland
FranceGermany
Greece
Hong Kong (China)
HungaryIceland
Ireland
IsraelItaly
JapanKorea
LatviaLithuania
Luxembourg
Macao (China)
Mexico Montenegro
Netherlands
New Zealand
Norway
Peru
Poland
Portugal
Qatar
Russia
Singapore
Slovak Republic
SloveniaSweden
Switzerland
Thailand
Turkey
United Arab Emirates
United Kingdom
United States
Uruguay
Croatia
-2.00 -1.50 -1.00 -0.50 0 0.50 1.00Mean index difference between advantaged and disadvantaged schools
Disadvantaged schoolshave more resourcesthan advantaged schools
Disadvantaged schoolshave fewer resourcesthan advantaged schools
PeruUruguay
United Arab EmiratesThailandAustralia
Hong Kong (China)Turkey
LuxembourgBrazil
Saudi ArabiaColombia
PanamaPhilippines
ArgentinaB-S-J-Z (China)
IsraelUnited StatesNew Zealand
SloveniaMalta
Dominican RepublicMacao (China)
IndonesiaJordan
MoroccoCanada
United KingdomBelgium
SwitzerlandIreland
SpainDenmarkGermanyLebanon
Brunei DarussalamSweden
KoreaBaku (Azerbaijan)
OECD averageSlovak Republic
GreeceMexicoRussia
NorwayViet Nam
JapanChile
MalaysiaHungary
QatarKazakhstan
EstoniaSerbia
Czech RepublicChinese Taipei
Bosnia and HerzegovinaIcelandFrance
AlbaniaNetherlands
BelarusSingapore
MontenegroGeorgia
ItalyCosta Rica
PortugalUkrainePolandKosovoCroatia
LatviaFinland
BulgariaMoldova
LithuaniaRomania
North Macedonia
Index of shortage of education staff Index of shortage of educational material
Figure 11•Difference in shortage of educational material and staff, by schools’ socio-economic profileResults based on principals’ reports
Figure 10•Reading performance and total learning time per week
the value of diversity in classrooms are often talking about the classes other people’s children attend. It is challenging to convince socio-economically advantaged parents whose children go to school with other privileged children that everyone is better off when classes are socially diverse. Policy makers, too, find it hard to allocate resources where the challenges are greatest and where those resources can have the biggest impact, often because poor children usually don’t have someone lobbying for them. It is worth studying how countries that have addressed these challenges successfully have dealt with the political economy of these changes.
In sum, all countries have excellent students, but too few countries have enabled all of their students to excel and fulfil their potential to do so. The education that wise parents want for their children is what
public policy should strive to achieve for all children. Achieving greater equity in education is not only a social justice imperative, it is also a way to use resources more efficiently, increase the supply of skills that fuel economic growth, and promote social cohesion. Not least, how we treat the most vulnerable students and citizens shows who we are as a society.
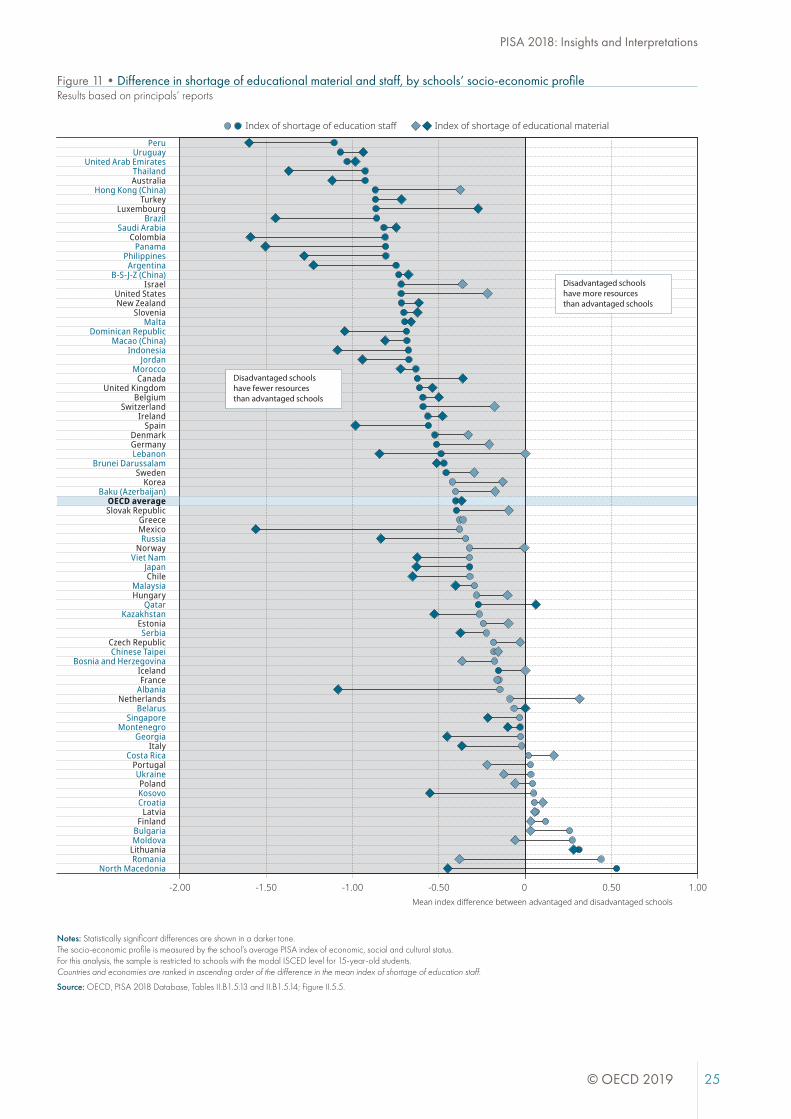

26 © OECD 2019 © OECD 2019 27
PISA 2018: Insights and InterpretationsPISA 2018: Insights and Interpretations
Notes: Statistically significant differences are shown in a darker tone. Education levels correspond to level 5A master’s degree and level 6 of the International Standard Classification of Education (ISCED-1997). The socio-economic profile is measured by the school’s average PISA index of economic, social and cultural status. For this analysis, the sample is restricted to schools with the modal ISCED level for 15-year-old students. Countries and economies are ranked in descending order of the percentage of teachers in disadvantaged schools with at least an ISCED 5A qualification.
OECD average-36 refers to the arithmetic mean across OECD countries (and Colombia), excluding Spain.
Source: OECD, PISA 2018 Database, Table II.B1.5.4; Figure II.5.1.
Disadvantaged schools Advantaged schools
PolandFinland
Slovak RepublicCroatia
BulgariaCzech Republic
GermanyEstonia
LuxembourgItaly
UkraineGeorgia
SwitzerlandAlbaniaKosovo
Chinese TaipeiHong Kong (China)
Baku (Azerbaijan)United States
FranceRomania
SpainRussia
OECD averageLithuania
IsraelKorea
United Arab EmiratesThailand
KazakhstanBelgiumSwedenIreland
Costa RicaSerbia
ArgentinaMexico
LebanonMalta
IcelandGreece
QatarTurkey
CanadaBrunei Darussalam
SingaporePanama
New ZealandPortugal
NetherlandsPhilippines
United KingdomAustraliaViet NamMoldova
JordanColombiaMorocco
PeruChile
SloveniaIndonesia
Dominican RepublicMalaysia
North MacedoniaBosnia and Herzegovina
BrazilMontenegro
B-S-J-Z (China)Saudi Arabia
BelarusUruguay
0 10 20 30 40 50 60 70 80 90 100Percentage of teachers
Figure 12•Percentage of teachers with at least a master’s degree, by schools’ socio-economic profileResults based on principals’ reports
Equity and immigrationThe number of students with an immigrant background has grown considerably over the past 20 years in most OECD countries. In 2015 alone, an estimated 4.8 million immigrants arrived in OECD countries, a wave that reinforced a long and steady upward trend. How schools and education systems respond to the challenges and opportunities that arise with immigrant flows has profound implications for the economic and social well-being of all members of society, including immigrants themselves.
On average across OECD countries, some 13% of students in 2018 had an immigrant background, up from 10% in 2009. In most countries, immigrant students tended to be socio-economically disadvantaged, with the largest proportions in Austria, Denmark, Finland, France, Germany, Greece, Iceland, the Netherlands, Norway, Slovenia and Sweden, where nearly one in two immigrant students was disadvantaged.
However, despite media-stoked concern, this growth in the share of students with an immigrant background did not lead to a decline in the education standards in host communities. That may be surprising, but only at first glance. While it is true that migrants often endure economic hardship and precarious living conditions, many immigrants bring to their host countries high aspirations for education, and valuable knowledge and skills. On average across OECD countries, the majority of the first-generation immigrant students who took part in the PISA 2015 assessment had at least one parent who had attended school for as many years as the average parent in the host country.
Still, many children with an immigrant background face enormous challenges at school. They need to adjust quickly to different academic expectations, learn in a new language, forge a social identity that incorporates both their background and their adopted country of residence – and withstand conflicting pressures from family and peers. These difficulties are magnified when immigrants are segregated in poor neighbourhoods with disadvantaged schools. It should thus come as no surprise that PISA data have consistently shown, in most countries, a performance gap between students with an immigrant background and native-born students.
In 2018, the average difference in reading performance across OECD countries between immigrant and non-immigrant students was 41 score points in favour of non-immigrant students. The difference shrank to 24 score points after accounting for students’ and schools’ socio-economic profile (Figure 13).
However, the considerable cross-country variation in performance between immigrant students and students without an immigrant background is striking, even after accounting for socio-economic status. Even if the culture and the education acquired before migrating have an impact on student performance, the country where immigrant students settle seems to matter significantly.
The average performance disadvantage of immigrants should not mask the finding that many immigrant students overcome considerable obstacles and excel academically. On average across OECD countries, 17% of immigrant students scored in the top quarter of reading performance in the country where they sat the PISA test. In Brunei Darussalam, Jordan, Panama, Qatar, Saudi Arabia and the United Arab Emirates, more than 30% of immigrant students performed at that level. Similarly, in Australia, Brunei Darussalam, Jordan, Macao (China), Panama, Qatar, Saudi Arabia, Singapore and the United Arab Emirates, immigrant students scored higher than or at least at the same level as their native-born peers. Despite the considerable challenges they face, they succeed in school – a testament to the great drive, motivation and openness that they and their families possess.
In 1954, the United States opened its borders to an immigrant from Syria. His son, Steve Jobs, became one of the world’s most creative entrepreneurs who revolutionised six industries: personal computers, film, music, telephony, tablet computing and digital publishing. Jobs’s life story may sound like a fairy tale, but it is firmly rooted in reality. While immigrants are over-represented amongst poor performers in PISA, in half of PISA-participating countries and economies, one in five immigrant students managed to score in the top quarter performance in their host countries. Amongst countries where more than 45% of immigrant students are disadvantaged (including Austria, Denmark, Greece and Slovenia), the share of immigrant students who attained the top quarter of reading performance in their country was as large as the share of disadvantaged students who attained that level. In France and Germany, more immigrant students than disadvantaged students attained that level. These students, who manage to overcome the double disadvantage of poverty and an immigrant background, have the potential to make exceptional contributions to their host countries.
Most immigrant students and their parents hold an ambition to succeed that in some cases surpasses the aspirations of families in their host country. That is remarkable, given that immigrant students in most countries are more disadvantaged and do not
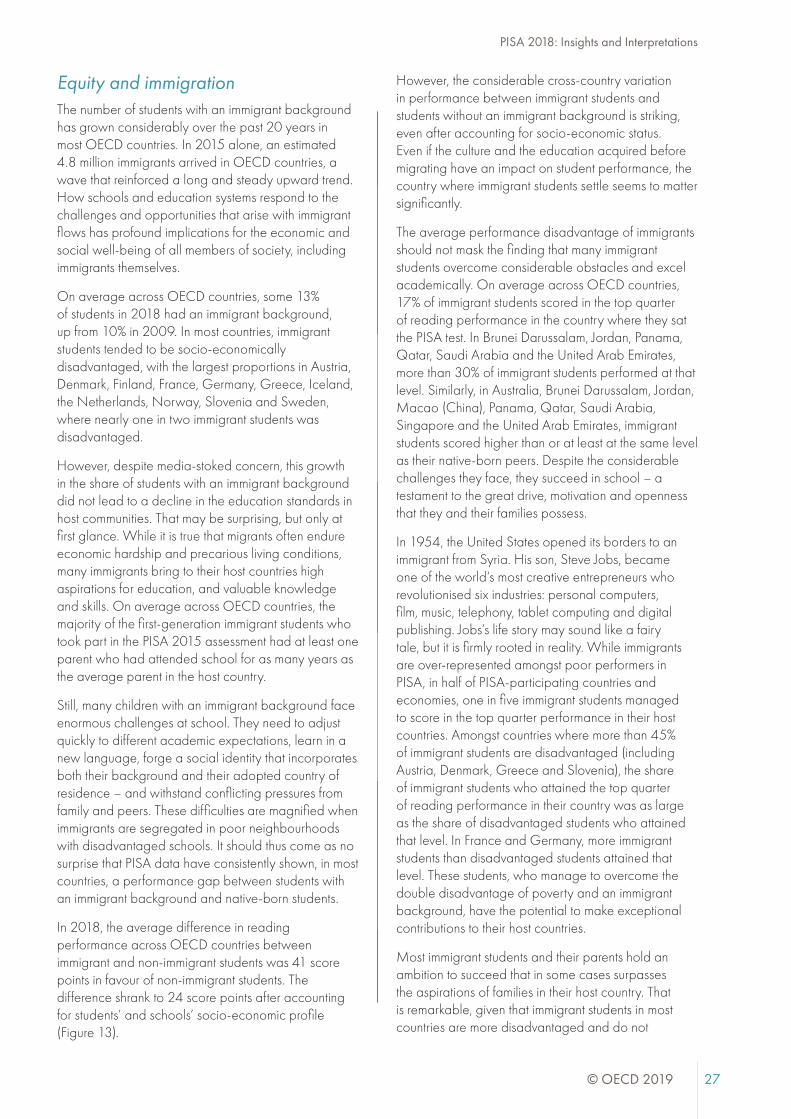
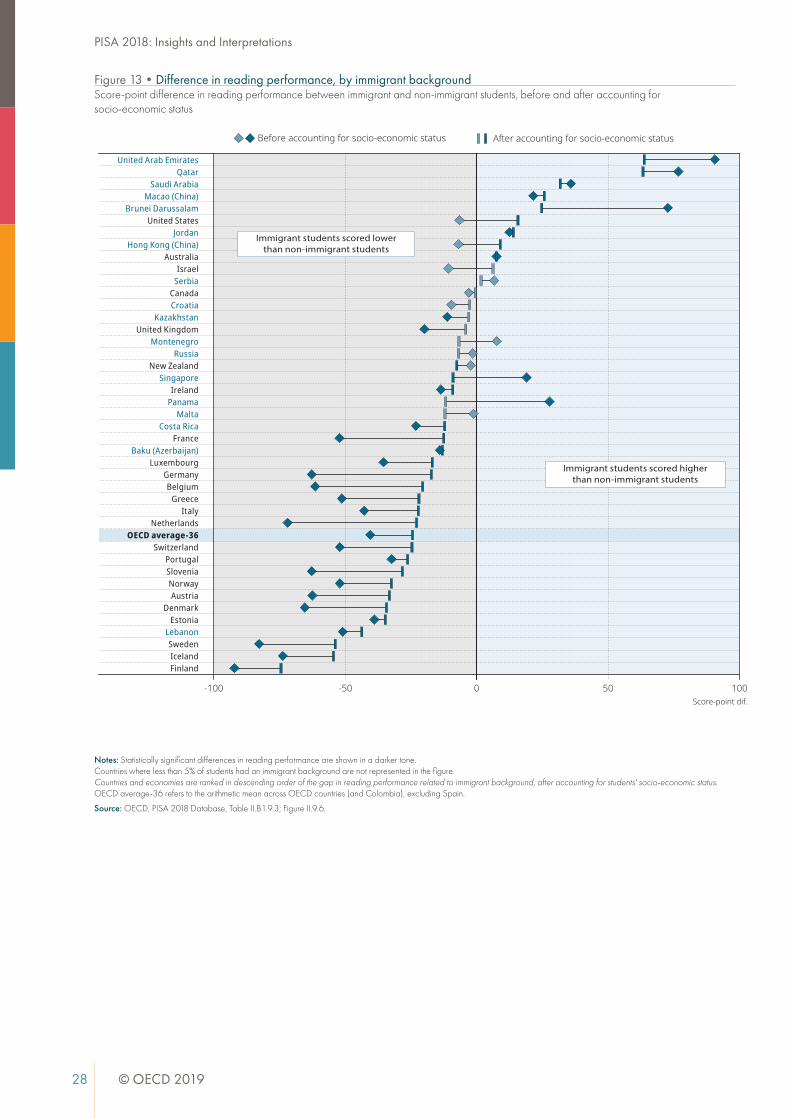
28 © OECD 2019 © OECD 2019 29
PISA 2018: Insights and InterpretationsPISA 2018: Insights and Interpretations
Notes: Statistically significant differences in reading performance are shown in a darker tone. Countries where less than 5% of students had an immigrant background are not represented in the figure. Countries and economies are ranked in descending order of the gap in reading performance related to immigrant background, after accounting for students' socio-economic status. OECD average-36 refers to the arithmetic mean across OECD countries (and Colombia), excluding Spain.
Source: OECD, PISA 2018 Database, Table II.B1.9.3; Figure II.9.6.
Before accounting for socio-economic status After accounting for socio-economic status
-100 -50 0 50 100
United Arab EmiratesQatar
Saudi ArabiaMacao (China)
Brunei DarussalamUnited States
JordanHong Kong (China)
AustraliaIsrael
SerbiaCanadaCroatia
KazakhstanUnited Kingdom
MontenegroRussia
New ZealandSingapore
IrelandPanama
MaltaCosta Rica
FranceBaku (Azerbaijan)
LuxembourgGermanyBelgium
GreeceItaly
NetherlandsOECD average-36
SwitzerlandPortugalSloveniaNorwayAustria
DenmarkEstonia
LebanonSwedenIcelandFinland
Score-point dif.
Immigrant students scored lowerthan non-immigrant students
Immigrant students scored higherthan non-immigrant students
Figure 13•Difference in reading performance, by immigrant backgroundScore-point difference in reading performance between immigrant and non-immigrant students, before and after accounting forsocio-economic status
perform as well as students without an immigrant background. When comparing students of similar socio-economic status, the difference between immigrant and non-immigrant students in their expectations for their future education grows even larger. This is important, as students who hold ambitious yet realistic expectations about their future are more likely to put effort into their learning and make better use of the opportunities available to them to achieve their goals (Figure 14).
The large variation in performance between immigrant and non-immigrant students in different countries, even after accounting for socio-economic background and country of origin, suggests that policy can play a significant role in minimising those disparities. The key is to dismantle the barriers that usually make it harder for immigrant students to succeed at school. The crunch point is not necessarily the point of entry, but afterwards, when educators and school systems decide whether or not to offer programmes and support specifically designed to help immigrant students succeed.
Designing education policies to address immigrant students’ needs – particularly language instruction – is not easy, and education policy alone is insufficient. For example, immigrant students’ performance in PISA is more strongly (and negatively) associated with the concentration of disadvantaged students in schools than with the concentration of immigrants or of students who speak a language at home that is different from the language of instruction.
Reducing the concentration of disadvantage in schools might require changes in other social policy, such as housing or welfare, to encourage a more balanced social mix in schools. Consider this: when the influx of low-skilled immigrants to Europe began to grow rapidly in the 1970s, the Netherlands chose to accommodate the migrants in large, specially constructed urban housing blocks. The neighbouring Flemish Community of Belgium, whose schools are run on policies very similar to those in the Netherlands, chose to give vouchers to migrant workers to supplement the amount that they would otherwise have to spend on housing. They could use these vouchers wherever they wished. The result was that there were fewer Flemish schools composed entirely of the sons and daughters of migrant workers. Years later, the Netherlands faced an enormous challenge to educate students from the public housing projects whom they had not been able to integrate into their education system and who continued to be low achievers. By contrast, in the Flemish Community of Belgium, where the migrants had been more dispersed, students
from immigrant families were doing far better than their counterparts in the Netherlands, where housing segregation had led to school segregation.
Over the years, OECD’s analyses have established some pointers for policy. A quick-win policy response is to provide language support for immigrant students with limited proficiency in the language of instruction. Common features of successful language-support programmes include sustained language training across all grade levels, centrally developed curricula, teachers who are specifically educated in second-language acquisition, and a focus on academic language, and integrating language and content learning.
Since language development and general intellectual development are intertwined, it seems best not to postpone teaching the mainstream curriculum until students fully master their new language. What is important is to ensure close co-operation between language teachers and classroom teachers, an approach that is widely used in countries that seem most successful in educating immigrant students, such as Australia, Canada and Sweden.
Offering high-quality early childhood education, tailored to language development, is another policy response. Participating in early education programmes can improve the chances that immigrant students start school at the same level as non-immigrant children. Targeted home visits can encourage enrolment in early childhood education and can help families support their child’s learning at home.
However, spending on early childhood education, in and of itself, is not enough. Key to success is helping children from disadvantaged backgrounds develop the kinds of cognitive, social and emotional skills that they might not acquire at home.
A third high-impact policy option is to build specialist knowledge in the schools receiving immigrant children. This can involve providing special education for teachers to better tailor instructional approaches to diverse student populations and support second-language learning. It can also help if teacher turnover is reduced in schools serving disadvantaged and immigrant populations, and if high-quality and experienced teachers are encouraged to work in these schools. Hiring more teachers from ethnic minority or immigrant backgrounds can help reverse the growing disparity between an increasingly diverse student population and a largely homogeneous teacher workforce, especially in countries where immigration is a more recent phenomenon.
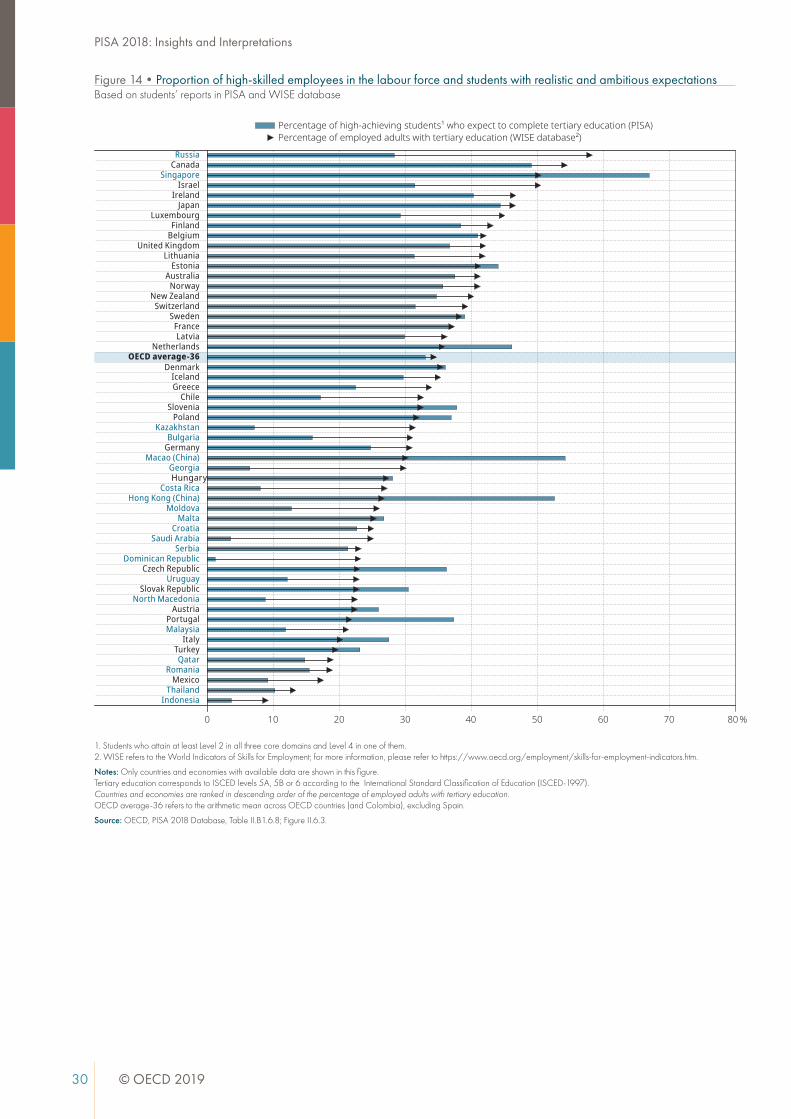
30 © OECD 2019 © OECD 2019 31
PISA 2018: Insights and InterpretationsPISA 2018: Insights and Interpretations
1. Students who attain at least Level 2 in all three core domains and Level 4 in one of them. 2. WISE refers to the World Indicators of Skills for Employment; for more information, please refer to https://www.oecd.org/employment/skills-for-employment-indicators.htm.
Notes: Only countries and economies with available data are shown in this figure. Tertiary education corresponds to ISCED levels 5A, 5B or 6 according to the International Standard Classification of Education (ISCED-1997). Countries and economies are ranked in descending order of the percentage of employed adults with tertiary education. OECD average-36 refers to the arithmetic mean across OECD countries (and Colombia), excluding Spain.
Source: OECD, PISA 2018 Database, Table II.B1.6.8; Figure II.6.3.
0 10 20 30 40 50 60 70 80 %
RussiaCanada
SingaporeIsrael
IrelandJapan
LuxembourgFinland
BelgiumUnited Kingdom
LithuaniaEstonia
AustraliaNorway
New ZealandSwitzerland
SwedenFranceLatvia
NetherlandsOECD average-36
DenmarkIcelandGreece
ChileSlovenia
PolandKazakhstan
BulgariaGermany
Macao (China)GeorgiaHungary
Costa RicaHong Kong (China)
MoldovaMalta
CroatiaSaudi Arabia
SerbiaDominican Republic
Czech RepublicUruguay
Slovak RepublicNorth Macedonia
AustriaPortugalMalaysia
ItalyTurkeyQatar
RomaniaMexico
ThailandIndonesia
Percentage of employed adults with tertiary education (WISE database²)Percentage of high-achieving students¹ who expect to complete tertiary education (PISA)
Figure 14•Proportion of high-skilled employees in the labour force and students with realistic and ambitious expectationsBased on students’ reports in PISA and WISE database
The harder challenge is avoiding concentrating immigrant students in the same, underachieving schools. Schools that struggle to do well for native-born students will struggle even more with a large population of children who cannot speak or understand the language of instruction. Countries use different approaches to address the concentration of immigrant and other disadvantaged students in particular schools. One way is to attract other students to these schools, including more advantaged students. A second is to better equip immigrant parents with information on how to select the best school for their child. A third is to limit the extent to which advantaged schools can select students.
Extra support and guidance for immigrant parents can also help. While immigrant parents may have high aspirations for their children, they may feel limited in their capacity to support their children if they have poor language skills or an insufficient understanding of the school system. Programmes to support immigrant parents can include home visits to encourage these parents to participate in educational activities, employing specialised liaison staff to improve communication between schools and families, and reaching out to parents to involve them in school-based activities.
Equity and genderTechnically, the industrialised world had closed the gender gap in education – as measured in average years of schooling – by the 1960s. That made a huge difference, as about half of the economic growth in OECD countries over the past 50 years was due to higher educational attainment, mainly amongst women. But women still earn 15% less than men, on average in OECD countries, and 20% less amongst the highest-paid workers. Some analyses suggest that this is because men and women who do similar work are not paid the same. But a more important factor is that men and women pursue different careers, and those career choices are often made early in life.
In mathematics and science, PISA 2018 suggests that gender differences are generally small (Figure 15). Boys outperformed girls just by five score points in mathematics, on average across OECD countries, and girls outperformed boys in science just by two score points. Only in Argentina, the four provinces/municipalities of China, Colombia, Costa Rica and Mexico did boys significantly outperform girls in science, while the opposite was true in 33 countries and economies. However, while claiming victory in having closed gender gaps in girls’ and boys’ cognitive abilities, education may have lost sight of
other social and emotional dimensions of learning that may have a stronger impact on children as they think about what they want to be when they grow up.
Amongst the 15-year-olds assessed by PISA, only 1% of girls reported that they want to work in ICT-related occupations, compared with 8% of boys who so reported, on average across OECD countries. In Bulgaria, Estonia, Lithuania, Poland, Serbia and Ukraine, more than 15% of boys reported that they expect to work in an ICT-related profession; but in no PISA-participating country or economy did more than 3% of girls so report. It seems even when they excel in mathematics or science in PISA, boys and girls have very different expectations for their future occupation (Figures 16a and 16b). More than one in four boys reported than they expect to work as an engineer or science professional when they are 30 years old, but fewer than one in six girls so reported. Almost one in three high-performing girls, but only one in eight boys with the same proficiency reported that they expect to work as health professionals.
Data from earlier PISA assessments suggest that girls do not seem to be getting much encouragement from their parents either. In all countries and economies surveyed on this question in 2012, parents were more likely to expect their sons, rather than their daughters, to work in a STEM field – even when boys and girls performed equally well in mathematics and science. In 2012, some 50% of parents in Chile, Hungary and Portugal reported that they expect their sons to have a career in science, technology, engineering or mathematics, but less than 20% of parents held such expectations for their daughters.
The picture is very different when it comes to reading. In all countries and economies that participated in PISA 2018, girls significantly outperformed boys in reading – by 30 score points. The narrowest gender gaps (less than 20 score points) were observed in Argentina, the four provinces/municipalities of China, Chile, Colombia, Costa Rica, Mexico, Panama and Peru; the widest (more than 50 score points) were observed in Finland, Jordan, the Republic of North Macedonia, Qatar, Saudi Arabia and the United Arab Emirates.
A comparison of results in reading performance between 2009, when reading was also the main subject assessed in PISA, and 2018 shows that, in several countries and economies, the gender gap in reading performance narrowed over time. It shrank significantly in 36 of the 62 countries and economies that participated in both the 2009 and 2018 PISA assessments. In 17 of those countries

32 © OECD 2019 © OECD 2019 33
PISA 2018: Insights and InterpretationsPISA 2018: Insights and Interpretations
Note: Gender gap refers to the difference between girls and boys (girls minus boys).
Source: OECD, PISA 2018 Database, Tables II.B1.7.1 and II.B1.7.3; Figure II.7.3.
Notes: Statistically significant differences between girls and boys are show in a darker tone. For students’ career expectations, results are only available for the French Community of Belgium. In this figure, “top performers” refers to students who attain at least Level 2 in all three core subjects and Level 5 or 6 in mathematics and/or science. Countries and economies are ranked in descending order of the percentage of top performing girls who expect a career in the field. OECD average-36 refers to the arithmetic mean across OECD countries (and Colombia), excluding Spain.
Source: OECD, PISA 2018 Database, Tables II.B1.8.22 and II.B1.8.23; Figure II.8.8.
-25
-15
-5
5
15
25
10 20 30 40 50 60 70
Gen
der g
ap in
mat
hem
atic
s pe
rfor
man
ce (i
n sc
ore
poin
ts)
Gender gap in reading performance (in score points)
Chi le
16Japan
Mexico
Kazakhstan
27
624
Serbia10
Jordan
30
17
Malaysia
7Morocco
22
Ukraine
Brunei Darussalam
Slovenia
Israel
Qatar
Ita ly
Norway
3
Peru
913
Panama
MaltaDominican Republic
Austria
25
Albania
31
Iceland
Bulgaria
Estonia
Sweden
84
11
Korea
Moldova
26
Hong Kong (China)
Belgium
Colombia
1
5
Lithuania
Georgia
B-S-J-Z (China) 21
Thailand
15
14
Finland
3228
2Brazi l
Costa Rica
United Arab Emirates
12
29
Indonesia
North Macedonia
18
Saudi Arabia
Greece
Phi l ippines
2019
23
R² = 0.63
1. Turkey2. Portugal3. Australia4. Switzerland5. Netherlands6. France7. Lebanon
8. Latvia9. Croatia10. Macao (China)11. Singapore12. Slovak Republic13. Germany14. Romania
15. Baku (Azerbaijan)16. Montenegro17. Denmark18. Chinese Taipei19. Belarus20. Luxembourg21. Bosnia and Herzegovina
22. Ireland23. United Kingdom24. Canada25. Russia26. New Zealand27. Hungary28. Kosovo
29. Uruguay30. United States31. Czech Republic32. Poland
Girls perform worse thanboys in mathematics
Argentina
Girls perform better thanboys in mathematics
0
Percentage of top performers
A. Science and engineering professionalsGirls Boys
Percentage of top performers who expect a career in the field0 10 20 30 40 50 60
0.72.24.32.31.93.95.5
14.71.4
16.21.6
14.14.01.95.8
13.313.310.5
9.66.8
17.46.5
11.119.413.2
2.69.7
12.415.5
2.6
13.116.3
2.011.119.5
9.91.9
10.116.5
9.09.8
40.218.113.8
4.73.5
18.51.12.87.9
11.612.348.416.814.224.520.714.731.023.629.6
6.30.5
21.7
ArgentinaLebanon
GreeceAlbania
ChileQatar
TurkeySweden
BrazilUnited Kingdom
North MacedoniaAustralia
Brunei DarussalamMontenegro
SerbiaFrance
DenmarkIreland
HungaryCroatia
BelgiumUnited Arab Emirates
IsraelEstonia
PortugalMalaysia
MaltaLuxembourg
SloveniaThailand
OECD average-36New Zealand
KazakhstanIcelandCanada
LithuaniaBaku (Azerbaijan)
ItalyGermany
RussiaLatvia
SingaporePoland
NorwayBulgariaRomania
SwitzerlandJordan
MoldovaBelarus
Slovak RepublicUnited States
B-S-J-Z (China)FinlandAustria
Chinese TaipeiNetherlands
Czech RepublicMacao (China)
KoreaHong Kong (China)
UkraineIndonesia
Japan
Figure 15•Gender gap in reading and mathematics performance Figure 16a•Gender gap in career expectations amongst top performers in mathematics and/or science
and economies, the narrowing of the gender gap in reading performance was due to an improvement in boys' performance. However, in 11 countries, namely Bulgaria, Hungary, Indonesia, Italy, Japan, Kazakhstan, Latvia, Mexico, New Zealand, the Slovak Republic and Switzerland, the narrowing of the gender gap in reading performance was due not to an improvement in boys’ performance but to a decline in girls’ performance.
Students’ attitudes towards reading have changed over time too. In 2018, 24% of 15-year-old boys and 44% of girls the same age agreed that “Reading is one of my favourite hobbies”, while 60% of boys and 39% of girls agreed that “I read only to get information that I need”. But compared with 2009 results, in 2018 larger proportions of both boys (an increase of 7 percentage points) and girls (an increase of 9 percentage points) agreed that “I read only if I have to”. When asked how much time they usually spend reading for enjoyment, more than 75% of boys reported either none at all or less than 30 minutes a day; less than 3% reported that they read more than two hours a day. By contrast,
43% of girls reported that they read at least 30 minutes a day, and 8% of them reported reading more than 2 hours a day.
Perhaps surprisingly, the large gender gap in reading performance observed amongst 15-year-olds in PISA virtually disappears amongst the 16-29 year-olds who were assessed by the OECD Survey of Adult Skills. Why? To some extent this may have to do with differences in the cohorts; but another explanation is that young men are much more likely than young women to read at work. This suggests that there are many ways to narrow or even eliminate gender gaps in education and skills, as long as education enlists parents, teachers, school leaders and employers in giving men and women the same opportunities and encouragement to learn.
The good news is that narrowing these gender gaps does not require expensive reform. Rather, it requires concerted efforts by parents, teachers and employers to become more aware of their own conscious or unconscious biases so that they give girls and boys equal chances for success at school and beyond.
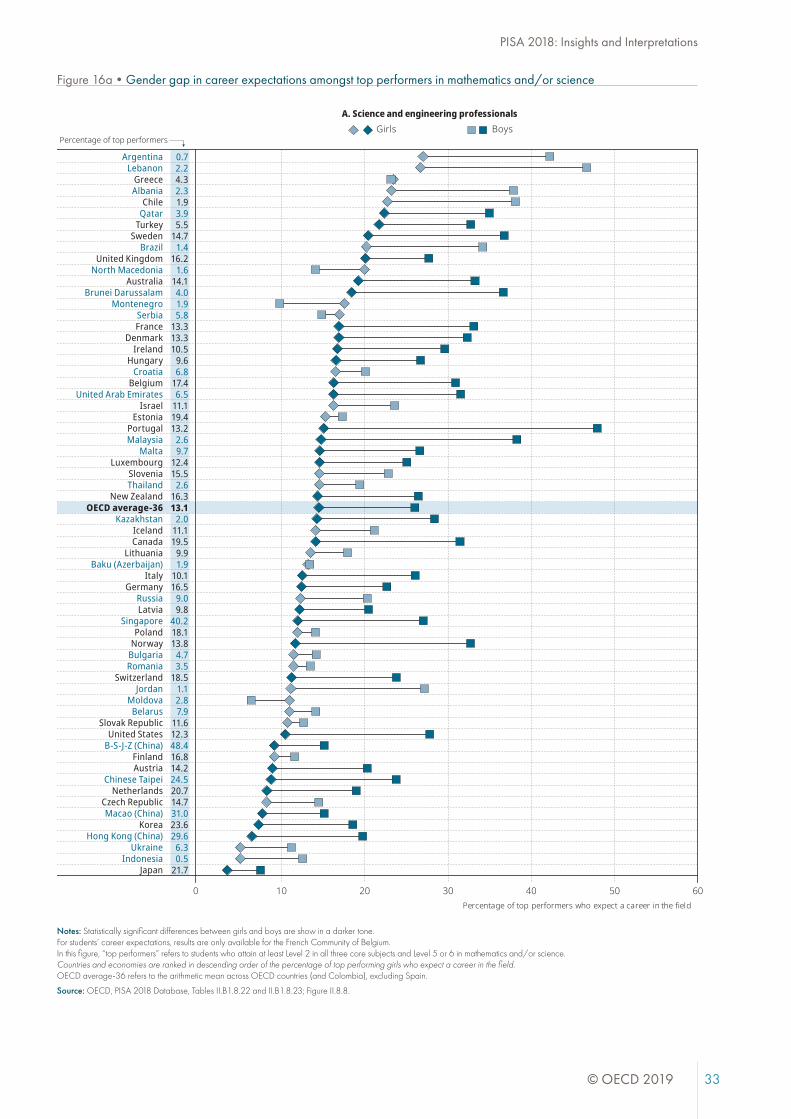
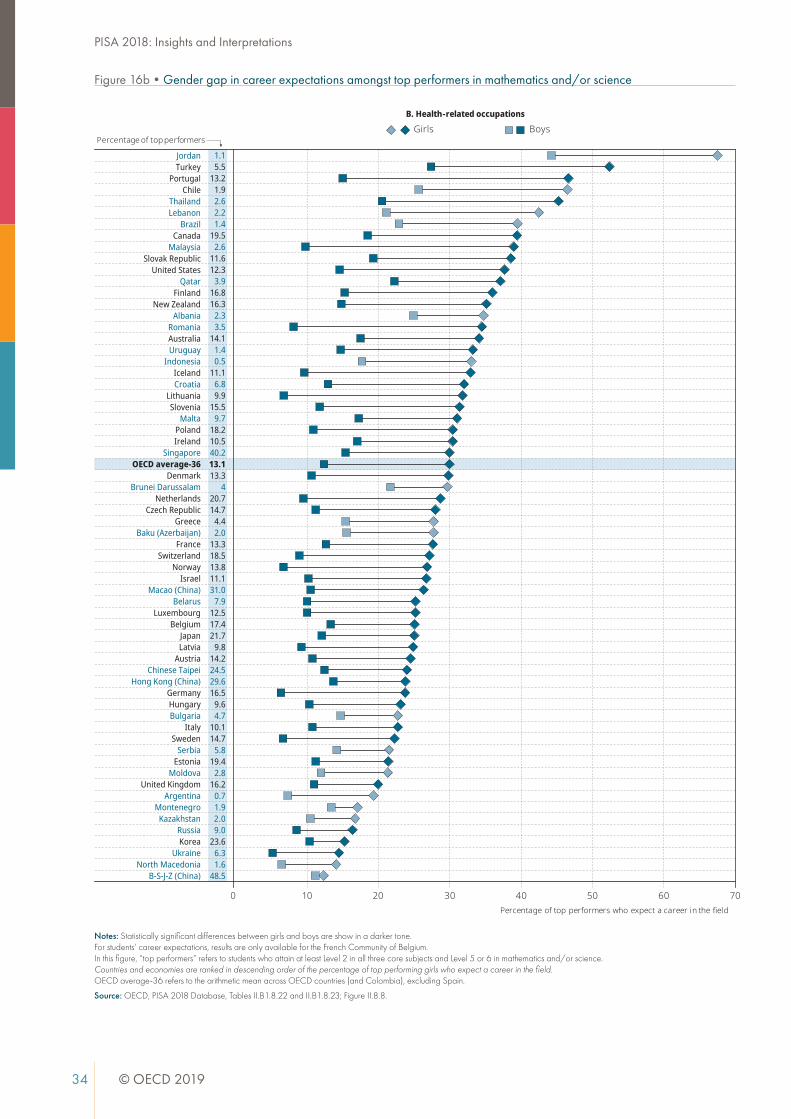
34 © OECD 2019 © OECD 2019 35
PISA 2018: Insights and InterpretationsPISA 2018: Insights and Interpretations
Notes: Statistically significant differences between girls and boys are show in a darker tone. For students’ career expectations, results are only available for the French Community of Belgium. In this figure, “top performers” refers to students who attain at least Level 2 in all three core subjects and Level 5 or 6 in mathematics and/or science. Countries and economies are ranked in descending order of the percentage of top performing girls who expect a career in the field. OECD average-36 refers to the arithmetic mean across OECD countries (and Colombia), excluding Spain.
Source: OECD, PISA 2018 Database, Tables II.B1.8.22 and II.B1.8.23; Figure II.8.8.
Percentage of top performers
B. Health-related occupationsGirls Boys
Percentage of top performers who expect a career in the field0 10 20 30 40 50 60 70
1.15.5
13.21.92.62.21.4
19.52.6
11.612.3
3.916.816.3
2.33.5
14.11.40.5
11.16.89.9
15.59.7
18.210.540.213.113.3
420.714.7
4.42.0
13.318.513.811.131.0
7.912.517.421.7
9.814.224.529.616.5
9.64.7
10.114.7
5.819.4
2.816.2
0.71.92.09.0
23.66.31.6
48.5
JordanTurkey
PortugalChile
ThailandLebanon
BrazilCanada
MalaysiaSlovak Republic
United StatesQatar
FinlandNew Zealand
AlbaniaRomaniaAustraliaUruguay
IndonesiaIcelandCroatia
LithuaniaSlovenia
MaltaPolandIreland
SingaporeOECD average-36
DenmarkBrunei Darussalam
NetherlandsCzech Republic
GreeceBaku (Azerbaijan)
FranceSwitzerland
NorwayIsrael
Macao (China)Belarus
LuxembourgBelgium
JapanLatvia
AustriaChinese Taipei
Hong Kong (China)GermanyHungaryBulgaria
ItalySweden
SerbiaEstonia
MoldovaUnited Kingdom
ArgentinaMontenegro
KazakhstanRussiaKorea
UkraineNorth Macedonia
B-S-J-Z (China)
Figure 16b•Gender gap in career expectations amongst top performers in mathematics and/or science For example, PISA shows clearly that boys and girls have different reading preferences. Girls are far more likely than boys to read novels and magazines for enjoyment while boys prefer comic books and newspapers. If parents and teachers were to give boys a greater choice in what they read, they might help boys develop an enjoyment of reading, which could, in turn, lead to at least a narrowing of the gender gap in reading performance.
PISA 2015 also found that boys spend more time playing video games and less time doing homework than girls. While excessive video gaming is shown to be a drag on student performance, a moderate amount of video gaming is related to boys’ better performance in digital reading than in print reading (although boys still lag behind girls in both types of reading). Anyone with teenage children knows how difficult it is to tell them how to spend their free time; but all parents should be aware that convincing their children that completing homework comes before playing video games will significantly improve their children’s life chances.
One of the most revealing findings from PISA 2009 was that teachers consistently give girls better marks in mathematics than boys, even when boys and girls perform similarly on the PISA mathematics test. That might be because girls are “good students” – attentive in class and respectful of authority – while boys may have less self-control. But while higher marks may mean success at school, they are not necessarily an advantage for girls in the long run, particularly when they do not lead to higher aspirations. Labour markets ultimately reward people for what they know and what they can do with what they know, not for their grades at school.
When it comes to preparing for entry into the labour market, PISA shows that girls are more likely than boys to get information about future studies or careers through Internet research, while boys are more likely than girls to get hands-on experience, by working as interns, job shadowing, visiting a job fair or speaking to career advisers outside of school (more on that later). This implies that employers and guidance counsellors can do far more to engage girls in learning about potential careers.
Read more about these issues in Chapter 8 of PISA 2018 Results (Volume II): Where All Students Can Succeed. https://doi.org/10.1787/b5fd1b8f-en

36 © OECD 2019 © OECD 2019 37
PISA 2018: Insights and InterpretationsPISA 2018: Insights and Interpretations
Countries and economies are ranked in descending order of the percentage of students who disagreed or strongly disagreed with the statement.
Source: OECD, PISA 2018 Database, Tables III.B1.14.1 and III.B1.14.3; Figure III.14.1.
Positive difference Negative difference Difference is not significant Missing values
A Girls - boys B Advantaged - disadvantaged students C Immigrant - non-immigrant students
Difference between:A B C
France
Korea
Viet Nam
Czech Republic
Serbia
Baku (Azerbaijan)
Peru
Slovenia
Bosnia and Herzegovina
Netherlands
Qatar
Georgia
Argentina
Macao (China)
Greece
Jordan
Brunei Darussalam
United Arab Emirates
Montenegro
Mexico
Moldova
Romania
Saudi Arabia
Thailand
Hong Kong (China)
Morocco
Malaysia
Albania
Poland
Lebanon
Dominican Republic
Philippines
Panama
Indonesia
Kosovo
North Macedonia
Difference between:A B C
Estonia
Denmark
Germany
Ireland
Iceland
Latvia
Lithuania
Austria
United Kingdom
United States
Australia
Canada
New Zealand
Japan
Finland
Ukraine
Portugal
Brazil
Switzerland
Sweden
OECD average
Israel
Luxembourg
Spain
Hungary
Colombia
Chile
Russia
Chinese Taipei
Singapore
Turkey
Bulgaria
Italy
Slovak Republic
Croatia
Belgium (Flemish)
B-S-J-Z (China)
Kazakhstan
Belarus
Costa Rica
Malta
Uruguay
0 20 40 60 80 100 %
0 20 40 60 80 100 %
A B CCountries/economies with a positive difference 39 68 18
Countries/economies with no difference 32 8 41
Countries/economies with a negative difference 6 1 11
Figure 17•Growth mindset, by student characteristicsPercentage of students who disagreed or strongly disagreed with the statement: “Your intelligence is something about you that you can’t change very much”
Fostering a growth mindset
When students struggle and teachers respond by lowering standards, teachers may imply that low achievement is the consequence of an inherent lack of ability. Unlike effort, talent is seen as something that students have no control over, so students may be more likely to give up rather than try harder. According to some research, teachers also give more praise, more help and coaching, and lengthier answers to questions to those students whom they perceive as having greater ability. When teachers don’t believe that pupils can develop and extend themselves through hard work, they may feel guilty pressing students whom they perceive to be less capable of achieving at higher levels. This is also concerning because research shows that when a teacher gives a student an easier task and then praises that student excessively for completing it, the student may interpret the teacher’s behaviour as reflecting a belief that the student is less able.
All of this is important because of all the judgements people make about themselves, the most influential is how capable they think they are of completing a task successfully. More generally, research shows that the belief that we are responsible for the results of our behaviour influences motivation, such that people are more likely to invest effort if they believe it will lead to the results they are trying to achieve.
In this context, it is worrying that in one-third of countries and economies that participated in PISA 2018, more than one in two students said that intelligence is something about them that they can’t change very much (Figure 17). In the Dominican Republic, Indonesia, Kosovo, the Republic of North Macedonia, Panama and the Philippines, at least 60% of students agreed or strongly agreed with
that statement. Those students are unlikely to make the investments in themselves that are necessary to succeed in school and in life.
Perhaps not surprisingly then, students who disagreed or strongly disagreed with the statement "Your intelligence is something about you that you can’t change very much" scored 32 points higher in reading than students who agreed or strongly agreed, after accounting for the socio-economic profile of students and schools. Students who believe that their abilities and intelligence can be developed over time (those with a “growth mindset”) also expressed less fear of failure than students who believe their abilities and intelligence are “fixed” (Figure 18). In PISA 2018, the students with a growth mindset reported greater motivation to master tasks and self-efficacy, set more ambitious learning goals for themselves, attached greater importance to school, and were more likely to expect to complete a university degree.
There are various ways a growth mindset can be instilled in students. It can begin by teaching students more about the brain’s capacity to learn through reading, class discussions and other activities. Research has shown that students who are exposed to these school-based interventions tend to show stronger beliefs about the brain’s capacity to change, and are less likely to attribute failure to a lack of talent, than students who are assigned to control groups. Other successful interventions include encouraging students to explain the growth mindset to other students, instilling a growth mindset amongst parents and teachers, offering a single online session about the growth mindset, and playing with a social robot that displays growth-mindset beliefs.

38 © OECD 2019 © OECD 2019 39
PISA 2018: Insights and InterpretationsPISA 2018: Insights and Interpretations
Notes: All coefficients are statistically significant. All linear regression models account for students’ and schools’ socio-economic profile. The socio-economic profile is measured by the PISA index of economic, social and cultural status.
Source: OECD, PISA 2018 Database, Table III.B1.14.7; Figure III.14.5.
0.04
0.03
0.02
0.01
0.00
-0.01
-0.02
-0.03
-0.04
-0.05Self-efficacy Fear of failure Learning goals Value of school Change in these indices when students
disagreed or strongly disagreed that “your intelligence is something about you that you can’t change very much”
Motivation to master tasks
Change in indices
Figure 18•Growth mindset and student attitudesOECD average
However, a lot comes down to the instructional system. In East Asia, mastery learning is often used to strengthen a growth mindset. It builds on the understanding that learning is sequential, and that mastery of earlier tasks is the foundation on which proficiency in subsequent tasks is built. According to this approach, student learning outcomes reflect the amount of time and instruction a student needs to learn, and whether the opportunity to learn and quality of instruction are sufficient to meet students’ needs. For teachers, that means that they do not vary the learning goals, which hold for the entire class, but that they do whatever is needed to ensure that each student has the opportunity to learn the material in ways that are appropriate to him or her. Some students will require additional instruction time, others will not; some students will require different learning environments than others. Behind this thinking is the belief that all students can learn and succeed, and that the task of teachers is to design the learning environments, whether inside or outside the classroom, that help students realise their potential. Because all students succeed in completing each successive task, the result is often less variation and a weaker impact of socio-economic status on learning outcomes.
However, regardless of whether or not students believe that they can develop their intelligence, students may find it challenging to do so if they are not given the necessary tools and support. Parents, teachers and principals need to create an environment where children are encouraged to participate, and where educators believe in students’ potential to develop their skills and provide students with the necessary support
and feedback. In this regard, PISA 2018 results reveal that students who perceived their teachers to be more supportive scored higher in reading, particularly after accounting for their socio-economic status. Policy makers, in turn, need to provide educators with the necessary resources and time to achieve their goals. When the role played by educators is not recognised as essential for encouraging a growth mindset to take root and flourish, the responsibility for failing lies entirely with the student, even when they do not have the resources necessary to reach their full potential.
Finland’s special teachers work closely with classroom teachers to identify students in need of extra help, and then work individually or in small groups with struggling students to help them keep up with their classmates. It is not left solely to the regular classroom teacher to identify a problem and alert the special teacher; every comprehensive school has a “pupils’ multiprofessional care group” that meets at least twice a month for two hours. The group consists of the principal, the special teacher, the school nurse, the school psychologist, a social worker, and the teachers whose students are being discussed. The parents of any child being discussed are contacted prior to the meeting and are sometimes asked to attend.
In many countries, it has taken time to move from a belief that only a few students can succeed to embracing the idea that all students can achieve at high levels. It takes a concerted, multifaceted programme of policy making and capacity building to attain that goal. But one of the patterns observed amongst the highest-performing countries is the gradual move from a system in which students were
stratified into different types of secondary schools, with curricula demanding various levels of cognitive skills, to a system in which all students go to secondary schools with similarly demanding curricula.
Amongst OECD countries, Finland was the first to take this route in the 1970s; Poland was the most recent, with its school reform in the 2000s. These countries “levelled-up”, requiring all students to meet the standards that they previously expected only their elite students to meet. Students who start to fall behind are identified quickly, their problem is promptly and accurately diagnosed, and the appropriate course of action is quickly taken. Inevitably, this means that some students are targeted for more resources than others; but it is the students with the greatest needs who benefit from the most resources.
It takes strong leadership, and thoughtful and sustained communication to bring parents along in this effort, particularly those benefiting from the more selective tracks. In the end, education systems are unlikely to sustain high performance and equitable opportunities to learn without the premise that it is possible for all students to achieve at high levels – and that it is necessary for them to do so.
Students’ confidence in their abilities and their fear of failure also affect both their performance and their well-being. While a moderate sense of fear can spur students to expend greater effort on academic tasks, an excess of fear could compel students to avoid challenging tasks and situations that are essential for their personal growth. PISA found that, on average, the greater the fear of failure expressed by students, the higher a country’s reading score. This was observed in a large number of English-speaking and East Asian education systems.
However, fear of failure can be a double-edged sword, and parents, teachers and school principals should be aware that instilling a fear of failure in children may also adversely affect their well-being. For instance, PISA results show that, in virtually all school systems, students reported less satisfaction with life when they expressed a greater fear of failure. Policy makers may be interested in learning more about the Flemish Community of Belgium, Estonia, Finland and Germany – education systems where students scored above the OECD average in reading, but expressed less fear of failure than the typical student across OECD countries. Interestingly, PISA also found that, in every school system except the Flemish Community of Belgium and Germany, students who exhibited a growth-mindset – i.e. they believe that abilities and intelligence can be developed over time – reported
less fear of failure than students with a fixed mindset.
PISA results also show that students who see themselves as more competitive scored higher in reading than those who do not, especially when they reported trying harder when in competition with others, and this holds for both boys and girls. However, parents, teachers, school principals and policy makers should be aware that when they create a competitive learning environment, not all students may respond in the same way. For example, PISA results show that in a competitive environment, boys and students who perceived themselves as competitive reported better well-being outcomes than girls and students who did not perceive themselves as competitive. In the debate about how much competition and co-operation are needed, some researchers argue that when co-operative and competitive behaviours are intertwined, as in inter-team competitions, the performance and enjoyment of participants are even higher than in a purely co-operative or competitive environment.
Read more about these issues in Chapters 12, 13 and 14 in PISA 2018 Results (Volume III): What School Life Means for Students’ Lives. https://doi.org/10.1787/acd78851-en
40 © OECD 2019 © OECD 2019 41
PISA 2018: Insights and InterpretationsPISA 2018: Insights and Interpretations
Aligning education and career aspirations
Across the world, young people who leave education today are entering the labour market with often considerably more years of schooling than their parents or grandparents had when they started working. And yet, young people continue to struggle in the labour market, employers continue to complain that they cannot find the new talent they need, and governments continue to worry about the mismatch between what the labour market demands and what the education system supplies. The bottom line is that, for young people, academic success alone is not sufficient to ensure easy transitions into good employment.
The PISA 2018 assessment collected data not only on the knowledge and skills of 15-year-olds, but also on their expectations for further education and a career (Table 1). These data allow for an examination of how young people’s career aspirations compare with future-focused labour market information about specific occupations – their potential for growth and their likelihood of succumbing to automation. It is also possible to examine how closely young people’s career aspirations correlate with their strengths and skills, and to identify gaps where additional awareness and support could help young people discover, pursue and secure careers in which they might be successful.
These data also make it possible to examine whether gender-related differences in career expectations have already taken root by the age of 15. Location data can also be leveraged to analyse differences in ambition across countries and between urban and rural environments. They can also be used to identify regional factors to be borne in mind when
giving young people information about labour-market opportunities. The PISA 2018 report includes an initial analysis on this, and more detailed analyses are underway.
Of course, not all 15-year-olds have a clear vision of their future career, and some 25% of students, on average across OECD countries, provided only vague answers to the question about their career expectations. However, longitudinal studies in four countries that followed students who had sat the PISA test in the early 2000s as they became young adults found that those who, at the age of 15, had expected to work in a high-skilled job were more likely to be doing so as young adults than those who had not held high expectations when they were 15.
The results from PISA 2018 show that disadvantaged students tend to hold lower ambitions than would be expected given their academic achievement (Figure 19). More than nine in ten high-achieving advantaged students, but only seven in ten high-achieving disadvantaged students reported that they expect to complete tertiary education. As a result, more than 30% of high-achieving disadvantaged students did not expect to complete tertiary education; and even when disadvantaged students aspired to high-skilled occupations, a considerable proportion of them held expectations of future education that were not aligned with their career goals.
Encouraging all students, especially disadvantaged students, to have ambitious and realistic education and career expectations is necessary not only to improve equity but as an investment in the future. Only in a few

42 © OECD 2019 © OECD 2019 43
PISA 2018: Insights and InterpretationsPISA 2018: Insights and Interpretations
Notes: The percentage of high performers is shown next to the country/economy name. Statistically significant differences are marked in a darker tone. Only countries and economies with sufficient proportions of high performers amongst advantaged/disadvantaged students are shown in this figure. Countries and economies are ranked in ascending order of the percentage of advantaged students. OECD average-36 refers to the arithmetic mean across OECD countries (and Colombia), excluding Spain.
Source: OECD, PISA 2018 Database, Table II.B1.6.7; Figure II.6.5.
Source: OECD, PISA 2018 Database; Table II.6.1.
Disadvantaged students Advantaged students
0 10 20 30 40 50 60 70 %
Thailand 11United States 41
Mexico 8Korea 53
Turkey 24Singapore 69
Greece 23Serbia 22
Ireland 43Canada 51
Bosnia and Herzegovina 7United Arab Emirates 22
Qatar 15Chile 17
Romania 16Portugal 40
Lithuania 33Montenegro 12
Brazil 11B-S-J-Z (China) 79
Argentina 8Belarus 29
Chinese Taipei 52Albania 11
North Macedonia 9Czech Republic 41
Slovak Republic 33Hong Kong (China) 61
Sweden 45Jordan 10
Belgium 44Australia 43Malaysia 13Norway 43
Japan 52Bulgaria 18
Kazakhstan 8France 41
Hungary 34Macao (China) 65
OECD average-36 39Estonia 52
United Kingdom 45Brunei Darussalam 16
Slovenia 44Poland 48
Malta 31Latvia 35
Netherlands 47Israel 35
Russia 34Baku (Azerbaijan) 8
Moldova 15Uruguay 14Ukraine 26
Italy 35New Zealand 45
Denmark 43Croatia 29Finland 50
Luxembourg 35Iceland 37
Switzerland 44Austria 40
Germany 44
Boys Girls
1st Police officers Specialist medical practitioners
2nd Athletes and sports players Generalist medical practitioners
3rd Engineering professionals Lawyers
4th Generalist medical practitioners Teaching professionals
5th Business services and administration managers Nursing professionals
6th Motor vehicle mechanics and repairers Medical doctors
7th Armed forces occupations, other ranks Psychologists
8th Policy and planning managers Police officers
9th Lawyers Veterinarians
10th Teaching professionals Policy and planning managers
Figure 19•High performers who do not expect to complete tertiary education, by socio-economic statusPercentage of students amongst those who have attained at least minimum proficiency (Level 2) in the three core PISA subjects and are high performers (Level 4) in at least one subject
Table 1•Top 10 career expectations of 15-year-old students, by gender
countries, such as Canada, Chile, Korea, Singapore, Ukraine and the United States, were students’ expectations of further education both ambitious and aligned with their academic performance, regardless of the students’ socio-economic status.
In addition, disadvantaged students are often more at risk of lacking relevant information about future education and career choices. In many countries, schools that enrol more disadvantaged students were less likely to provide opportunities for students to discuss their career plans with a specialised advisor, on average. In fact, PISA 2018 finds that only a small proportion of disadvantaged students reported knowing how to get information about student financing (e.g. student loans or grants) for higher education.
A misalignment between academic performance, on the one hand, and education and career expectations, on the other, can be partly due to the anticipated difficulties in progressing through a long and costly education. For example, an experiment conducted in the Dominican Republic suggests that eighth-grade boys from poor backgrounds largely underestimated the returns to higher education, and that providing them with accurate information had a positive impact on their schooling.
A study in the United States showed the potential of intensive college counselling provided to college-aspiring, low-income students. These interventions are typically run by community-based non-profit organisations, and provide personalised guidance to students throughout the college search, application and financial aid processes. They shift the focus towards enrolment in four-year colleges that are
less expensive and have higher graduation rates than the alternatives that students would otherwise choose. Counselling also improves students’ persistence through at least the second year of college, suggesting a potential to increase the rate of degree completion amongst disadvantaged students. Similar results were observed with another intervention, which showed that mailing high-achieving seniors an information packet and application fee waivers made low-income students more likely to enrol in colleges that have stronger academic records and higher graduation rates than those to which students with similar profiles would normally have applied.
An experiment in disadvantaged high schools in Toronto, Canada, found that watching a video about the benefits of post-secondary education and being invited to try out a financial-aid calculator significantly assuaged the concerns of disadvantaged high school students about the costs of higher education, and raised their expectations to earn a degree. Results from another controlled trial conducted in German high schools suggest that similar low-cost interventions may eventually lead to greater tertiary enrolment amongst students whose parents did not attain that level of education. Students in selected schools who had attended a simple, in-class presentation on the benefits and costs of higher education, and on possible funding options, more often applied to university and were more often enrolled than students who had not been exposed to these interventions.
Similarly, in several countries, schools that enrol mostly disadvantaged students were less likely than schools that mostly enrol advantaged students to provide opportunities for students to discuss their career plans with a specialised advisor (Figure 20).
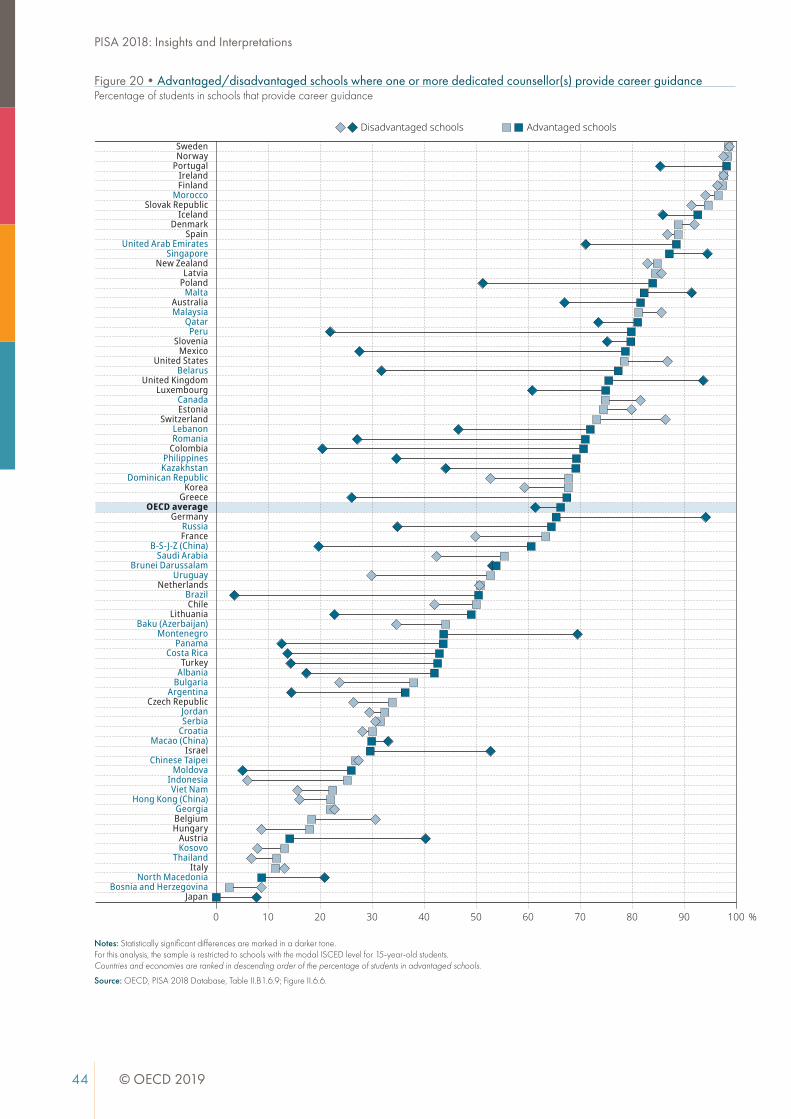
44 © OECD 2019 © OECD 2019 45
PISA 2018: Insights and InterpretationsPISA 2018: Insights and Interpretations
Notes: Statistically significant differences are marked in a darker tone. For this analysis, the sample is restricted to schools with the modal ISCED level for 15-year-old students. Countries and economies are ranked in descending order of the percentage of students in advantaged schools.
Source: OECD, PISA 2018 Database, Table II.B1.6.9; Figure II.6.6.
Disadvantaged schools Advantaged schools
0 10 20 30 40 50 70 10060 9080 %
SwedenNorway
PortugalIrelandFinland
MoroccoSlovak Republic
IcelandDenmark
SpainUnited Arab Emirates
SingaporeNew Zealand
LatviaPoland
MaltaAustraliaMalaysia
QatarPeru
SloveniaMexico
United StatesBelarus
United KingdomLuxembourg
CanadaEstonia
SwitzerlandLebanonRomania
ColombiaPhilippinesKazakhstan
Dominican RepublicKorea
GreeceOECD average
GermanyRussiaFrance
B-S-J-Z (China)Saudi Arabia
Brunei DarussalamUruguay
NetherlandsBrazilChile
LithuaniaBaku (Azerbaijan)
MontenegroPanama
Costa RicaTurkey
AlbaniaBulgaria
ArgentinaCzech Republic
JordanSerbia
CroatiaMacao (China)
IsraelChinese Taipei
MoldovaIndonesiaViet Nam
Hong Kong (China)GeorgiaBelgiumHungary
AustriaKosovo
ThailandItaly
North MacedoniaBosnia and Herzegovina
Japan
Figure 20•Advantaged/disadvantaged schools where one or more dedicated counsellor(s) provide career guidancePercentage of students in schools that provide career guidance
The Mexican anti-poverty programme, PROGRESA, shows that simply being exposed to highly educated professionals, such as doctors and nurses, raises the aspirations of poor families for their children’s education, and has a positive impact on students’ achievement at school.
Clearly, school-to-work transitions have become more complex and prolonged. This reflects both changes in labour market demand, and a growing disparity with what education systems supply. This generation of young citizens requires curiosity, entrepreneurship and resilience to work effectively in the new labour market. They will need confidence to create their own employment and to manage their careers in new ways. Education systems need to prepare young people to be effective in applying what they know to ever-changing situations, expose them to relevant role models, and provide guidance that helps them discover their passions, areas where they can excel, and where and how they can find or create a job.
Read more about these issues in Chapter 6 in PISA 2018 Results (Volume II): Where All Students Can Succeed. https://doi.org/10.1787/b5fd1b8f-en
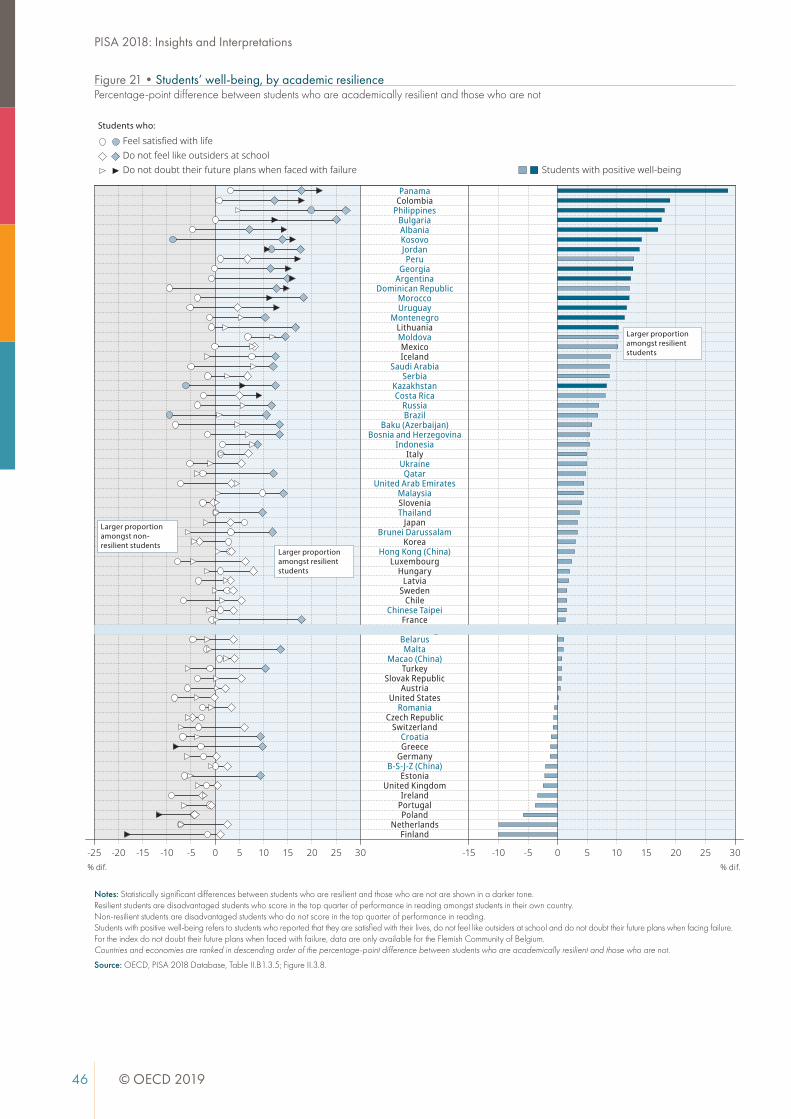
46 © OECD 2019 © OECD 2019 47
PISA 2018: Insights and InterpretationsPISA 2018: Insights and Interpretations
Notes: Statistically significant differences between students who are resilient and those who are not are shown in a darker tone. Resilient students are disadvantaged students who score in the top quarter of performance in reading amongst students in their own country. Non-resilient students are disadvantaged students who do not score in the top quarter of performance in reading. Students with positive well-being refers to students who reported that they are satisfied with their lives, do not feel like outsiders at school and do not doubt their future plans when facing failure. For the index do not doubt their future plans when faced with failure, data are only available for the Flemish Community of Belgium. Countries and economies are ranked in descending order of the percentage-point difference between students who are academically resilient and those who are not.
Source: OECD, PISA 2018 Database, Table II.B1.3.5; Figure II.3.8.
Students who:
Feel satisfied with life
Do not doubt their future plans when faced with failureDo not feel like outsiders at school
-25 -20 -15 -10 -5 0 5 10 15 20 25 30 -15 -10 -5 0 5 10 15 20 25 30
PanamaColombia
PhilippinesBulgariaAlbaniaKosovoJordanPeru
GeorgiaArgentina
Dominican RepublicMoroccoUruguay
MontenegroLithuaniaMoldovaMexicoIceland
Saudi ArabiaSerbia
KazakhstanCosta Rica
RussiaBrazil
Baku (Azerbaijan)Bosnia and Herzegovina
IndonesiaItaly
UkraineQatar
United Arab EmiratesMalaysiaSloveniaThailand
JapanBrunei Darussalam
KoreaHong Kong (China)
LuxembourgHungary
LatviaSweden
ChileChinese Taipei
FranceOECD average
BelarusMalta
Macao (China)Turkey
Slovak RepublicAustria
United StatesRomania
Czech RepublicSwitzerland
CroatiaGreece
GermanyB-S-J-Z (China)
EstoniaUnited Kingdom
IrelandPortugalPoland
NetherlandsFinland
Students with positive well-being
% dif.% dif.
Larger proportionamongst resilientstudents
Larger proportionamongst resilientstudents
Larger proportionamongst non-resilient students
Figure 21•Students’ well-being, by academic resiliencePercentage-point difference between students who are academically resilient and those who are not
School life, student life and student well-being
From its first assessment, PISA has been asking students about their motivations and dispositions towards learning, such as their enjoyment of reading and their anxiety towards mathematics. In more recent assessments, PISA also asked students about their more general social and emotional state, including their satisfaction with life, their feelings and their fear of failure, in order to establish a more holistic appreciation of education outcomes and student well-being. In addition, an optional questionnaire on well-being was distributed as part of PISA 2018. All of these questions connect school life with the broader ecosystem in which students live – the family, their peers, the community – and provide information on the development of 15-year-old students.
Across OECD countries, about two in three students reported that they are satisfied with their lives, a percentage that shrank by five percentage points between 2015 and 2018. More than 85% of students reported sometimes or always feeling happy, cheerful or joyful; but about 6% of students reported always feeling sad. In almost every education system, girls expressed greater fear of failure than boys, even when they outperformed boys in reading by a large margin, and this gender gap was considerably wider amongst top-performing students. Positive student well-being was also associated with a higher proportion of resilient students (Figure 21).
PISA 2018 shows that school life is closely related to the well-being of 15-year-old students. For instance, the three aspects of students’ lives that are more strongly associated with expressions of sadness are how satisfied students are with the way they look, with
their relationships with their parents, and with school life. Ultimately, the well-being of students may also affect their academic performance. In this regard, PISA data show that students who were frequently bullied were more likely to have skipped school and scored lower in reading.
A positive school climate is one of those things that is difficult to define and measure, but everyone recognises it when they see it. Students appreciate a school environment where bullying is unusual, where students do not feel out of place, and where establishing genuine and respectful relationships with teachers is the norm. PISA 2018 shows that school climate is closely associated with students’ sense of well-being.
The disciplinary climate in language-of-instruction lessons is also one of the strongest predictors of reading performance. In all countries and economies, students who reported fewer disciplinary problems in their language-of-instruction lessons performed better in reading, after accounting for the socio-economic profile of students and schools. More specifically, on average across OECD countries, students who reported that students cannot work well in every or most language-of-instruction lessons scored 25 points lower in reading than students who reported that this never happened or happened only in some lessons, after accounting for socio-economic status. Even occasional disciplinary problems were negatively associated with reading performance. Students who reported that disciplinary problems occur in some language-of-instruction lessons scored between 5 and 9 points lower in reading than students who reported that the problems never, or hardly ever, occur.

48 © OECD 2019 © OECD 2019 49
PISA 2018: Insights and InterpretationsPISA 2018: Insights and Interpretations
Notes: All values are statistically significant. Results based on linear regression analysis, after accounting for students’ socio-economic profile, gender and immigrant background. The socio-economic profile is measured by the PISA index of economic, social and cultural status.
Source: OECD, PISA 2018 Database, Table III.B1.5.7; Figure III.5.3.
Notes: All values are statistically significant, except for teacher feedback after accounting for reading performance and other teaching practices. Results based on linear regression analysis, after accounting for students’ and schools’ socio-economic profile. The socio-economic profile is measured by the PISA index of econo-mic, social and cultural status.
Source: OECD, PISA 2018 Database, Table III.B1.6.10; Figure III.6.5.
504540353025201510
50
It was clear to me that the teacher liked teaching us
The enthusiasm of the teacher inspired me
It was clear that the teacher likes to deal with the topic of the lesson
The teacher showed enjoyment in teaching
Disagree Agree Stongly agree
Score-point differencein reading
0.16
0.14
0.12
0.10
0.08
0.06
0.04
0.02
0.00
-0.02
Indices of teaching practices in language-of-instruction lessons
Teacher enthusiasm
Teachers’ stimulation of
reading engagement
Teacher-directed instruction
Teacher feedback
Adaptive instruction
Teacher support
Change in the index of enjoyment of reading
Before accounting for reading performance and other teaching practicesAfter accounting for reading performanceAfter accounting for reading performance and other teaching practices
Figure 22•Prevalence of teacher enthusiasm and reading performanceOECD average; reference category "strongly disagree"
Figure 23•Enjoyment of reading and teaching practices in language-of-instruction lessonsBased on students’ reports, OECD average
The good news is that the disciplinary climate in school generally improved between 2009 and 2018, according to students’ reports, especially in Albania, Korea and the United Arab Emirates. For example, on average across OECD countries, the percentage of students who reported that their classmates in their language-of-instruction lessons always, or almost always, listen to what the teacher says, or can work well, increased by about four percentage points during that period. That’s good news because all types of students appeared to benefit from a positive disciplinary climate. The relationship between disciplinary climate and reading performance was relatively stable across students’ gender, socio-economic status and immigrant background.
PISA 2018 also asked students whether their language-of-instruction teacher supports them in their schoolwork and is enthusiastic about teaching. Around three in four students reported that, in most or every lesson, the teacher gives extra help when students need it and that the teacher helps students with their learning. In most countries and economies, students scored higher in reading when they perceived their teachers as more enthusiastic, especially when they said their teachers were interested in the subject (Figure 22). On average across OECD countries and in 43 education systems, students who perceived greater support from teachers scored higher in reading, after accounting for the socio-economic profile of students and schools. Equally important, teacher enthusiasm and teachers’ stimulation of reading engagement were the teaching practices most strongly
(and positively) associated with students’ enjoyment of reading (Figure 23).
Of course, most teachers care about having positive relationships with their students; but some teachers might be insufficiently prepared to deal with difficult students and classroom environments. Effective classroom management consists of far more than establishing and imposing rules, rewards and incentives to control behaviour; it requires the ability to create a learning environment that facilitates and supports students’ active engagement in learning, encourages co-operation, and promotes behaviour that benefits other people. A stronger focus on classroom and relationship management in professional-development programmes may give teachers some of the tools they need to connect better with their students. Teachers also need the time to share information about students’ strengths and weaknesses with their colleagues, so that, together, they can find the best approaches to make students feel part of the school community.
Clearly, what goes on at school can have an impact not only on students’ attitudes towards learning, but on their feelings, in general (Figure 24). Parents recognise this, too, as they cited school safety, school climate and school reputation as the most important criteria when choosing a school for their child, followed closely by students’ academic achievement and the offering of specific subjects or courses. PISA 2018 finds that in all 65 countries and economies with available data, students were more likely to express positive feelings, in general, when they reported a stronger sense of belonging at school; and in virtually all school systems,
students who perceived their peers to be more co-operative were more likely to express positive feelings.
Teachers and principals often count on parents to help them create a positive learning environment in their schools. According to school principals, about 41% of students’ parents discussed their child’s progress with a teacher on their own initiative and 57% did so on the initiative of teachers. PISA finds that parents’ involvement in their child’s education is positively associated with student performance. The average score in reading was higher in those countries and economies where more parents discussed their child’s progress on the initiative of teachers, and that positive association remained even after accounting for per capita GDP and for other forms of parental involvement in school-related activities. In fact, for every 10 percentage-point increase in the share of parents who discussed their child’s progress on the teachers’ initiative, the average reading score in the country or economy improved by 10 points on average across the 74 countries and economies with available data, after acconting for national income and other factors. The prevalence of parents discussing their child’s progress on the initiative of teachers may be an indication of a school system’s responsiveness.
At the same time, PISA 2018 also finds that fewer than one in five parents was involved in school government
or volunteered to participate in extracurricular activities in their child’s school. Why were so few parents involved in these school-based activities? On average across the nine OECD countries and economies that distributed the parent questionnaire, the issues that parents most commonly cited as hindering their participation in these activities were time-related, and included the need to work (34%) and the inconvenience of meeting times (33%). Only 5% of parents reported that they felt unwelcome at school. Given these results, school leaders and educators can perhaps do more to accommodate working parents so that everyone – schools, teachers, students and the parents themselves – can benefit from greater parental involvement in school activities.
All in all, one way to promote students’ well-being is to encourage all parents to be more aware of their children’s interests and concerns, and show interest in their school life, including in the challenges children face at school. Schools can create an environment of co-operation with parents and communities. Teachers can be given better tools to enlist parents’ support, and schools can address some critical deficiencies amongst disadvantaged children, such as the lack of a quiet space for studying. If parents and teachers were to establish relationships based on trust, schools could rely on parents as valuable partners in the education of their students.

50 © OECD 2019 © OECD 2019 51
PISA 2018: Insights and InterpretationsPISA 2018: Insights and Interpretations
1. Higher values indicate a more positive disciplinary climate. 2. The socio-economic status of students is measured by the PISA index of economic, social and cultural status. 3. The index of positive feelings is based on three items: “happy”, “joyful” and “cheerful”.
Note: All predictors were included in the same linear regression model.
Source: OECD, PISA 2018 Database, Table III.B1.12.19; Figure III.12.5.
Predictors of the index of positive feelings
Partners
School climate indices Other indicatorsA B C D E F G H I
Albania
Argentina
Baku (Azerbaijan)
Belarus
Bosnia and Herzegovina
Brazil
Brunei Darussalam
B-S-J-Z (China)
Bulgaria
Costa Rica
Croatia
Dominican Republic
Georgia
Hong Kong (China)
Indonesia
Jordan
Kazakhstan
Kosovo
Macao (China)
Malaysia
Malta
Moldova
Montenegro
Panama
Peru
Philippines
Qatar
Romania
Russia
Saudi Arabia
Serbia
Chinese Taipei
Thailand
Ukraine
United Arab Emirates
Uruguay
Predictors of the index of positive feelings3
OECD
School climate indices Other indicatorsA B C D E F G H I
OECD average
Austria
Chile
Colombia
Czech Republic
Denmark
Estonia
Finland
France
Germany
Greece
Hungary
Iceland
Ireland
Japan
Latvia
Lithuania
Luxembourg
Mexico
Netherlands
Poland
Portugal
Slovak Republic
Slovenia
Spain
Sweden
Switzerland
Turkey
United Kingdom
United States
A Disciplinary climate1
B Sense of belonging at schoolC Student co-operationD Student competitionE Exposure to bullyingF Index of parents’ emotional supportG Students’ socio-economic status2
H Student is a girlI Student has an immigrant background
A B C D E F G H I32 65 64 30 0 65 9 16 6 Countries/economies with a positive association33 0 1 35 17 0 39 23 39 Countries/economies with no association
0 0 0 0 48 0 17 26 11 Countries/economies with a negative association
Positive association Negative association Association is not significant Missing values
Figure 24•Predictors of positive feelingsBased on students’ reports
Yet school principals and teachers may be overlooking some challenges if they only pay attention to what is happening inside the classroom. Although a majority of students reported that they feel they belong at school – across OECD countries, about 7 in 10 students agreed or strongly agreed that they feel like they belong at school – students’ sense of belonging at school weakened considerably between 2003 and 2015 and waned even further between 2015 and 2018. Even students in Japan and Korea, who enjoyed one of the best disciplinary climates of all PISA-participating countries – e.g. they rarely skipped school or arrived late for school, and a clear majority of them reported that they had never been bullied – were some of the most dissatisfied with their lives, at least according to their own reports. In addition, they expressed greater fear of failure, and were about twice as likely as students in other OECD countries to report that they always feel scared or sad.
Furthermore, the share of students who reported being frequently bullied increased by around four percentage points since 2015, on average across OECD countries. More than one in five students reported being bullied at school at least a few times a month (Figure 25). Most of the reported bullying was verbal or relational – others made fun of the student, the student was the object of nasty rumours, or the student was left out of things on purpose – rather than physical. For example, more than 10% of students in 67 out of 75 countries and economies reported that their peers made fun of them at least a few times a month; but on average across OECD countries, around 7% of students reported that they got hit or pushed around by other students that often.
Bullying can have adverse – and potentially long-lasting – effects on students’ performance at school and general well-being. Students who reported being frequently bullied scored 21 points lower in reading than students who did not report so, after accounting for socio-economic status. Frequently bullied students reported feeling sad, scared and less satisfied with their lives. These students were also more likely to have skipped school in the two weeks prior to the PISA test – an indication that they missed out on valuable learning opportunities.
Yet when asked about their feelings towards bullying, students overwhelmingly reported negative attitudes towards bullying – and positive attitudes towards defending the victims of bullying (Figure 26). For example, on average across OECD countries, 90% of students agreed or strongly agreed that they like it when someone stands up for other students who are being bullied; and 88% agreed or strongly agreed that
it is a good thing to help students who can’t defend themselves. Policy makers and local educators can capitalise on these sentiments to put in place measures and programmes to combat and prevent bullying.
Co-operation amongst students, independent of good relations with teachers, is also associated with higher performance – and with students’ well-being: in every participating school system, students were more likely to feel they belong at school when their peers were more co-operative.
Given the harmful consequences that bullying can have on students’ well-being, policy makers, principals and teachers need to devise effective policies and practices to limit bullying. Previous OECD studies suggest, in particular, that:
» Early signs of bullying should not be overlooked.
» All types of bullying need to be taken seriously, including the less “visible” ones, such as relational forms of bullying. Considering all types of bullying may draw greater attention to the bullying most typically suffered by girls. While boys are more likely than girls to be frequently – and physically – bullied, the gender gap almost disappears when students were asked about relational types of bullying, such as spreading nasty rumours and being left out of things on purpose.
» Monitoring students’ attitudes towards bullying can provide valuable insights into how to address bullying. For instance, students’ attitudes can be used as a predictive tool, to understand the role played by bystanders, or to identify students who would stand up against bullies. Changing bystanders’ reactions to bullying may be an effective way to reduce the incidence of bullying.
» Building a culture of good behaviour, establishing clear anti-bullying rules, and creating a positive school climate, where students feel engaged and socially connected, is essential for preventing bullying.
» Students and teachers should be taught how to recognise and respond to bullying.
» Communication with the parents of the bullied students and the bully him/herself is important.
Compared to the average student across OECD countries, students in Spain reported being bullied less frequently, were more satisfied with their lives, expressed more positive and fewer negative feelings, and their sense of belonging at school was amongst the strongest across all PISA-participating school systems. Yet, according to students’ reports, the disciplinary climate in language-of-instruction lessons
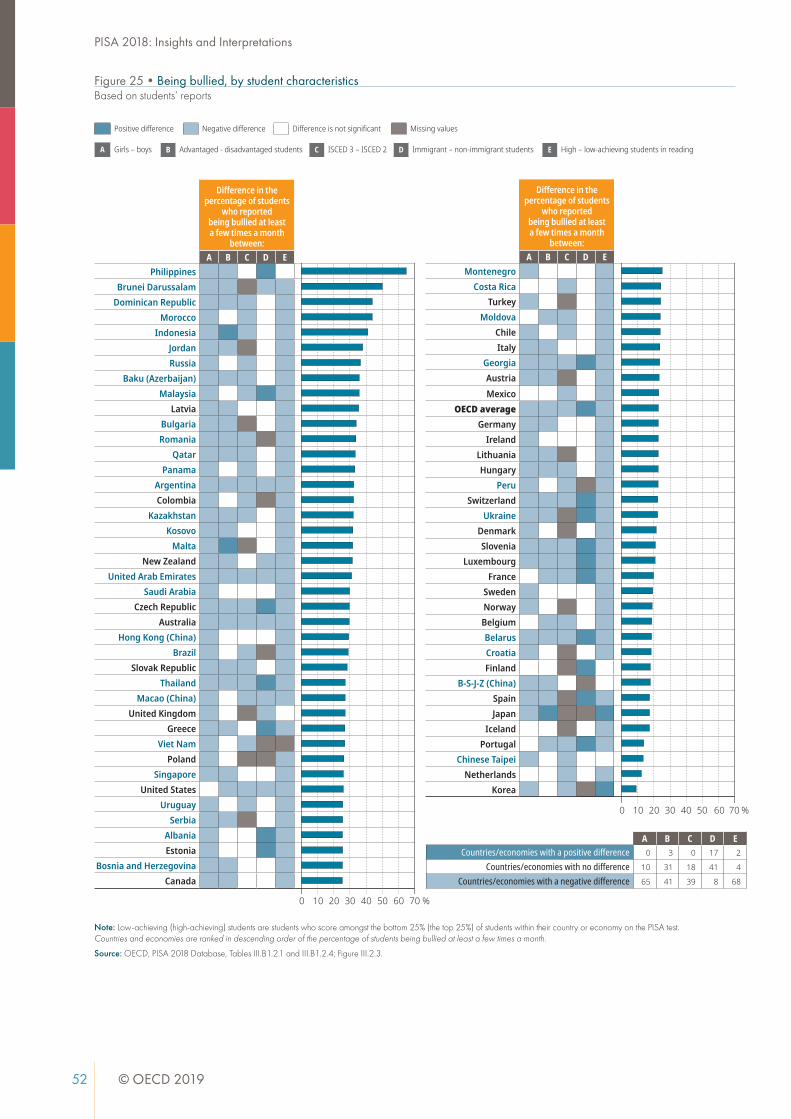
52 © OECD 2019 © OECD 2019 53
PISA 2018: Insights and InterpretationsPISA 2018: Insights and Interpretations
Note: Differences between girls and boys on average across OECD countries are shown next to the item on attitudes towards bullying. All differences are statistically significant.
Source: OECD, PISA 2018 Database, Tables III.B1.2.15 and III.B1.2.16; Figure III.2.5.
Note: Low-achieving (high-achieving) students are students who score amongst the bottom 25% (the top 25%) of students within their country or economy on the PISA test. Countries and economies are ranked in descending order of the percentage of students being bullied at least a few times a month.
Source: OECD, PISA 2018 Database, Tables III.B1.2.1 and III.B1.2.4; Figure III.2.3.
%A 13.6
B 8.9
C 6.8
D 11.3
E 7.3
OECD
Percentage of students who agreed or strongly agreed with the following statements:
A B C D EAustralia 86 93 92 92 94
Austria 76 84 87 80 86Belgium 80 93 94 87 94Canada 85 92 92 91 93
Chile 84 88 86 87 89Colombia 75 84 68 82 86
Czech Republic 84 89 88 86 89Denmark 88 92 94 92 94
Estonia 81 89 89 86 89Finland 82 91 93 89 92France 84 90 93 89 93
Germany 77 86 90 80 90Greece 84 85 85 88 89
Hungary 76 83 75 80 85Iceland 79 88 88 86 86Ireland 90 94 94 95 96
Israel 82 86 84 87 89Italy 84 87 85 83 89
Japan 71 80 93 90 84Korea 86 94 93 94 94Latvia 74 82 83 77 84
Lithuania 72 79 81 77 82Luxembourg 78 87 89 82 88
Mexico 78 86 82 84 87Netherlands 70 91 95 91 96
New Zealand 88 93 92 92 94Norway 89 93 94 91 92Poland 76 83 80 79 84
Portugal 81 94 86 93 93Slovak Republic 73 79 80 80 84
Slovenia 80 86 84 87 86Spain 87 92 90 91 93
Sweden 84 90 92 83 92Switzerland 73 82 86 79 87
Turkey 80 84 80 85 82United Kingdom 88 94 95 93 96
United States 88 93 93 93 95
Partners
Percentage of students who agreed or strongly agreed with the following statements:
A B C D EAlbania 86 89 86 90 91
Argentina 81 87 79 85 88Baku (Azerbaijan) 71 77 76 79 79
Belarus 68 81 76 72 82Bosnia and Herzegovina 80 86 86 87 89
Brazil 71 85 83 86 87Brunei Darussalam 81 89 87 90 88
B-S-J-Z (China) 88 83 96 89 91Bulgaria 68 73 77 75 76
Costa Rica 84 90 86 88 90Croatia 83 89 89 88 90
Dominican Republic 72 77 74 79 80Georgia 81 85 80 86 80
Hong Kong (China) 75 81 91 83 89Indonesia 74 80 57 80 73
Jordan 60 74 70 80 79Kazakhstan 65 74 72 70 74
Kosovo 77 83 76 84 83Macao (China) 75 84 93 86 91
Malaysia 82 87 84 87 87Malta 87 90 90 91 92
Moldova 74 91 74 83 85Montenegro 79 84 83 84 87
Morocco 67 73 67 74 74Panama 73 83 74 81 84
Peru 77 88 81 86 87Philippines 77 84 79 82 78
Qatar 78 83 79 84 85Romania 77 85 75 82 87
Russia 74 81 84 77 84Saudi Arabia 69 75 71 79 79
Serbia 78 84 83 83 86Singapore 90 94 96 94 96
Chinese Taipei 75 84 92 83 84Thailand 68 77 72 80 81Ukraine 76 83 78 79 86
United Arab Emirates 77 83 77 85 86Uruguay 83 86 84 87 89
Viet Nam 71 85 82 86 89
%60 80 1000 20 40
All studentsBoys Girls
OECD average
A It irritates me when nobody defends bullied studentsB It is a good thing to help students who can’t defend themselvesC It is a wrong thing to join in bullyingD I feel bad seeing other students bulliedE I like it when someone stands up for other students who are being bullied
Percentage of students who agreed or strongly agreed with the following statements
Difference in the percentage of students
who reported being bullied at least a few times a month
between:A B C D E
Philippines
Brunei Darussalam
Dominican Republic
Morocco
Indonesia
Jordan
Russia
Baku (Azerbaijan)
Malaysia
Latvia
Bulgaria
Romania
Qatar
Panama
Argentina
Colombia
Kazakhstan
Kosovo
Malta
New Zealand
United Arab Emirates
Saudi Arabia
Czech Republic
Australia
Hong Kong (China)
Brazil
Slovak Republic
Thailand
Macao (China)
United Kingdom
Greece
Viet Nam
Poland
Singapore
United States
Uruguay
Serbia
Albania
Estonia
Bosnia and Herzegovina
Canada
Difference in the percentage of students
who reported being bullied at least a few times a month
between:A B C D E
Montenegro
Costa Rica
Turkey
Moldova
Chile
Italy
Georgia
Austria
Mexico
OECD average
Germany
Ireland
Lithuania
Hungary
Peru
Switzerland
Ukraine
Denmark
Slovenia
Luxembourg
France
Sweden
Norway
Belgium
Belarus
Croatia
Finland
B-S-J-Z (China)
Spain
Japan
Iceland
Portugal
Chinese Taipei
Netherlands
Korea
Positive difference Negative difference Difference is not significant Missing values
A Girls – boys B Advantaged - disadvantaged students C ISCED 3 – ISCED 2 D Immigrant – non-immigrant students E High – low-achieving students in reading
0 %20 3010 40 50 60 70
0 %20 3010 40 50 60 70
A B C D ECountries/economies with a positive difference 0 3 0 17 2
Countries/economies with no difference 10 31 18 41 4
Countries/economies with a negative difference 65 41 39 8 68
Figure 26•Students’ attitudes towards bullying, by gender Based on students’ reports
Figure 25•Being bullied, by student characteristicsBased on students’ reports
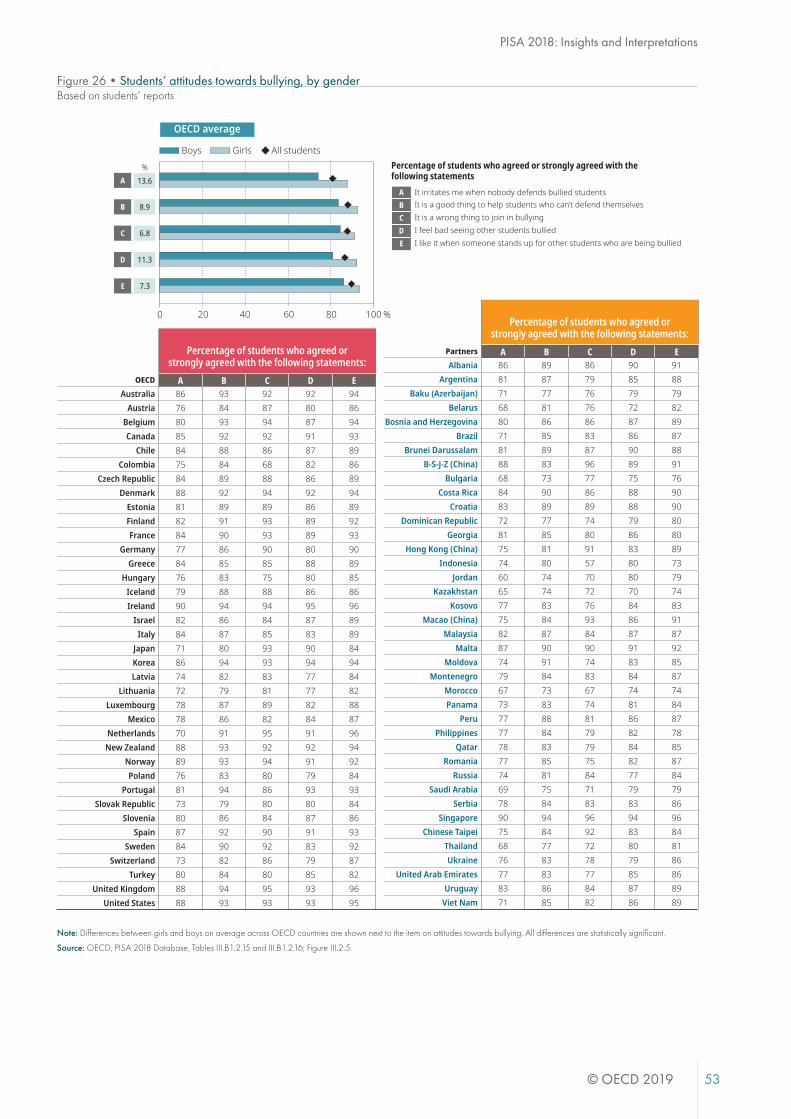

54 © OECD 2019 © OECD 2019 55
PISA 2018: Insights and InterpretationsPISA 2018: Insights and Interpretations
was far from ideal, and the share of students who had skipped school or lessons in the two weeks prior to the PISA test was clearly above the OECD average. A similar picture emerged in Costa Rica and Portugal.
In Sweden, students’ reports on bullying, the disciplinary climate and student truancy were more positive than the reports of the average student across OECD countries. Moreover, students in Sweden were as satisfied with life and expressed a similar sense of belonging at school and fear of failure as the average student across OECD countries. However, students in Sweden were more frequently late for school and were somewhat less likely to express positive feelings than students in other OECD countries.
Read more on these issues in PISA 2018 Results (Volume III): What School Life Means for Students’ Lives. https://doi.org/10.1787/acd78851-en
What comes next?
The three volumes of PISA 2018 results that are published in 2019 and summarised in this brochure provide the first findings from this latest assessment. Volume V, which will be published in June 2020, will highlight some of the policies and practices that predict the success of students, schools and education systems; but it will take some time until we fully understand the results from PISA 2018. Policy makers’ hunger for immediate answers is always frustrated by the snail’s pace at which the development of data, evidence and research advances; and the data collected by PISA alone leave many questions unanswered. The results offer a snapshot of education systems at a certain moment in time; but they do not – they cannot – show how the school systems got to that point, or the institutions and organisations that might have helped or hindered progress. In addition, the data do not really say much about cause and effect. Correlations are often deceptive: if the birds sing when the sun rises, and they do so day after day, year after year, and in many different places around the world, it doesn’t mean the sun rises because the birds sing. In a nutshell, knowing what successful systems are doing does not yet tell us how to improve less-successful systems. That is where the OECD brings a range of other tools to bear to strengthen insights for policy and practice.
PISA is not only the world’s most comprehensive and reliable international comparison of students’ capabilities, it is also integrated with a range of methods and resources at the OECD, including country and thematic policy reviews, that countries can use to situate the results from PISA in the different contexts in which students learn, teachers teach and schools
operate, and to fine-tune their education policies. Education policy makers and practitioners can benefit from these tools in the same way that business leaders learn to steer their companies towards success: by taking inspiration from others, and then adapting lessons learned to their own situation.
Sharing insights, across borders, to improve quality, equity and efficiency in education is more urgently needed than ever before. The demands on education and education policy are high and rising. In the past it was sufficient for education to sort students because our economies and societies could rely on a few highly educated individuals. In today’s world, everyone needs to have advanced knowledge and skills, not just for economic reasons but also for social participation.
In traditional bureaucratic school systems, teachers are left alone in classrooms with a lot of prescriptions about what to teach. The OECD Teaching and Learning International Survey, TALIS, shows the value of teachers and schools looking outward to collaborate with the next teacher and the next school. The past was about delivered wisdom; the future is about user-generated wisdom. The past was about divisions: education systems could allow for teachers and content to be divided by subjects and student abilities. The past was about isolation: schools were designed to keep students inside, and the rest of the world outside. The past was about hierarchies: teachers provided, students received. The future of education needs to be about integration: the integration of different subjects, the integration of diverse students and the integration of various learning contexts; it needs to be about connections: connections with real-world contexts,

56 © OECD 2019 © OECD 2019 57
PISA 2018: Insights and InterpretationsPISA 2018: Insights and Interpretations
and with the rich array of resources in the community; and it needs to be about co-creation: recognising both students and adults as resources for how learning is designed and how students succeed.
In the past, different students were taught in similar ways; now, schools need to embrace diversity with differentiated pedagogical practices. The goals of the past were standardisation and compliance: students of the same age were educated in batches and followed the same instruction. The future is about personalising educational experiences: building instruction out of students’ passions and capabilities, helping students with individualised learning and assessment in ways that foster their engagement and talents. In the past, schools were technological islands, where technology was deployed mostly to support existing practices. The schools of tomorrow will use the potential of technologies to liberate learning from conventions and connect learners in new and powerful ways.
The future is about more innovative partnerships. Effective learning environments are constantly creating synergies and finding new ways to enhance professional, social and cultural capital with others. They do that with families and communities, with higher education, with other schools and learning environments, and with businesses. Education needs to find better ways to recognise, reward and give exposure to the successes of innovators.
All of this has profound implications for schools, teachers and teaching. The past was about prescription, the future requires a knowledge-rich profession, and the replacement of the industrial work organisation, with its administrative control, with much more professional and collaborative working norms. When teachers feel a sense of ownership over their classrooms, when students feel a sense of ownership over their learning, that is when learning for the post-truth information age can take place. The central reason why teachers’ ownership of the profession is a must-have rather than an optional extra is the pace of change. Even the most efficient attempts to push a central curriculum into classroom practice will drag out over a decade, because it takes so much time to communicate the goals and methods through the different layers of the system. In this age of accelerations, such a slow process inevitably leads to a widening gap between what students need to learn and what teachers teach. When fast gets really fast, being slow to adapt makes us really slow.
While measurement is the means, the purpose of PISA is to help countries look outward and incorporate the results of that learning into policy and practice.
That outward-looking perspective also seems to be a common trait of many high-performing education systems: they are open to the world and ready to learn from and with the world’s education leaders; they do not feel threatened by alternative ways of thinking.
In the end, the laws of physics apply. If we stop pedalling, not only will we not move forward, our bicycles will stop moving at all and will fall over – and we will fall with them. Against strong headwinds, we need to push ourselves even harder. In the face of challenges and opportunities as great as any that have gone before, human beings need not be passive or inert. We have agency, the ability to anticipate and the power to frame our actions with purpose. The best-performing PISA countries show that high-quality and equitable education is an attainable goal, that it is within countries’ means to deliver a future for millions of learners who currently do not have one. The task is not to make the impossible possible, but to make the possible attainable.
58 © OECD 2019 © OECD 2019 59
PISA 2018: Insights and InterpretationsPISA 2018: Insights and Interpretations
Bibliography Bullying » OECD (2018), Teaching for the Future: Effective Classroom Practices To Transform
Education, OECD Publishing, Paris. https://dx.doi.org/10.1787/9789264293243-en
» Salmivalli, C. (2014), “Participant roles in bullying: How can peer bystanders be utilized in interventions?”, Theory Into Practice, Vol. 53/4, pp. 286-292. http://dx.doi.org/10.1080/00405841.2014.947222
» Ttofi, M. and D. Farrington (2011), “Effectiveness of school-based programs to reduce bullying: A systematic and meta-analytic review”, Journal of Experimental Criminology, Vol. 7/1, pp. 27-56. http://dx.doi.org/10.1007/s11292-010-9109-1
» Wright, J. (2004), “Preventing classroom bullying: What teachers can do”, Retrieved October. https://scholar.google.fr/scholar?hl=en&as_
sdt=0%2C5&q=Classroom.+Bullying%3A+What+Teachers+Can+Do.+Jim+Wright&btnG= (Accessed on 13 March 2019.)
Career/Education expectations » Carrell, S. and B. Sacerdote (2017), “Why do college-going interventions work?”,
American Economic Journal: Applied Economics, Vol. 9/3, pp. 124-151. http://dx.doi.org/10.1257/app.20150530
» Carruthers, C. and W. Fox (2016), “Aid for all: College coaching, financial aid, and post-secondary persistence in Tennessee”, Economics of Education Review, Vol. 51, pp. 97-112. http://dx.doi.org/10.1016/j.econedurev.2015.06.001
» Castleman, B. and J. Goodman (2018), “Intensive college counseling and the enrollment and persistence of low-income students”, Education Finance and Policy, Vol. 13/1, pp. 19-41. http://dx.doi.org/10.1162/edfp_a_00204
» Chiapa, C., J. Garrido and S. Prina (2012), “The effect of social programs and exposure to professionals on the educational aspirations of the poor”, Economics of Education Review, Vol. 31/5, pp. 778-798. http://dx.doi.org/10.1016/j.econedurev.2012.05.006
» Dinkelman, T. and C. Martínez A. (2014), “Investing in schooling in Chile: The role of information about financial aid for higher education”, Review of Economics and Statistics, Vol. 96/2, pp. 244-257. http://dx.doi.org/10.1162/rest_a_00384
» Fack, G. and J. Grenet (2015), “Improving college access and success for low-income students: Evidence from a large need-based grant program”, American Economic Journal: Applied Economics, Vol. 7/2, pp. 1-34. http://dx.doi.org/10.1257/app.20130423
» Hoxby, C. and C. Avery (2012), The Missing “One-Offs”: The Hidden Supply of High-Achieving, Low-Income Students, National Bureau of Economic Research, Cambridge, MA. http://dx.doi.org/10.3386/w18586
» Hoxby, C. and S. Turner (2013), Expanding College Opportunities for High-Achieving, Low-Income Students, Stanford Institute for Economic Policy Research. https://siepr.stanford.edu/sites/default/files/publications/12-014paper_6.pdf (Accessed on 20 May 2019.)
» Jensen, R. (2010), “The (perceived) returns to education and the demand for schooling*”, Quarterly Journal of Economics, Vol. 125/2, pp. 515-548. http://dx.doi.org/10.1162/qjec.2010.125.2.515
» OECD (2012), Grade Expectations: How Marks and Education Policies Shape Students’ Ambitions, OECD Publishing, Paris. https://www.oecd-ilibrary.org/education/grade-expectations_9789264187528-en
» Peter, F., C. Spiess and V. Zambre (2018), “Informing students about college: An efficient way to decrease the socio-economic gap in enrollment: Evidence from a randomized field experiment”, SSRN Electronic Journal. http://dx.doi.org/10.2139/ssrn.3287800
Co-operation/Competition » Gillies, R. (2016), “Cooperative learning: Review of research and practice”, Australian
Journal of Teacher Education, Vol. 41/3, pp. 38-54. http://dx.doi.org/10.14221/ajte.2016v41n3.3
» Kistruck, G. et al. (2016), “Cooperation vs. competition: Alternative goal structures for motivating groups in a resource scarce environment”, Academy of Management Journal, Vol. 59/4, pp. 1174-1198. http://dx.doi.org/10.5465/amj.2014.0201
» Morschheuser, B., J. Hamari and A. Maedche (2019), “Cooperation or competition – When do people contribute more? A field experiment on gamification of crowdsourcing”, International Journal of Human-Computer Studies, Vol. 127, pp. 7-24. http://dx.doi.org/10.1016/J.IJHCS.2018.10.001
https://scholar.google.fr/scholar?hl=en&as_sdt=0%2C5&q=Classroom.+Bullying%3A+What+Teachers+Can+Do.+
60 © OECD 2019 © OECD 2019 61
PISA 2018: Insights and InterpretationsPISA 2018: Insights and Interpretations
» Tauer, J. and J. Harackiewicz (2004), “The effects of cooperation and competition on
intrinsic motivation and performance”, Journal of Personality and Social Psychology,
Vol. 86/6, pp. 849-861.
http://dx.doi.org/10.1037/0022-3514.86.6.849
Gender » OECD (2015), The ABC of Gender Equality in Education: Aptitude, Behaviour,
Confidence, OECD Publishing, Paris.
http://dx.doi.org/10.1787/9789264229945-en
» OECD (2012), Closing the Gender Gap: Act Now, OECD Publishing, Paris.
http://dx.doi.org/10.1787/9789264179370-en
Gender and competition » Booth, A. and P. Nolen (2012), “Choosing to compete: How different are girls and boys?”,
Journal of Economic Behavior & Organization, Vol. 81/2, pp. 542-555.
http://dx.doi.org/10.1016/J.JEBO.2011.07.018
» Datta Gupta, N., A. Poulsen and M. Villeval (2005), “Male and female competitive
behavior - Experimental evidence”, IZA Discussion Paper, No. 1833.
http://dx.doi.org/10.2139/ssrn.906766
» Niederle, M. and L. Vesterlund (2010), “Explaining the gender gap in math test scores:
The role of competition”, Journal of Economic Perspectives, Vol. 24/2, pp. 129-144.
http://dx.doi.org/10.1257/jep.24.2.129
Growth mindset » Andersen, S. and H. Nielsen (2016), “Reading intervention with a growth mindset
approach improves children’s skills”, Proceedings of the National Academy of Sciences,
Vol. 113/43, pp. 12 111-12 113
http://dx.doi.org/10.1073/PNAS.1607946113
» Blackwell, L., K. Trzesniewski and C. Dweck (2007), “Implicit theories of intelligence
predict achievement across an adolescent transition: A longitudinal study and an
intervention”, Child Development, Vol. 78/1, pp. 246-263
http://dx.doi.org/10.1111/j.1467-8624.2007.00995.x
» Dweck, C. (2016), Mindset: The New Psychology of Success, Ballantine Books,
New York, NY.
» Good, T. and A. Lavigne (2017), Looking in Classrooms, Routledge, New York.
http://dx.doi.org/10.4324/9781315627519
» Paunesku, D. et al. (2015), “Mind-set interventions are a scalable treatment for academic
underachievement”, Psychological Science, Vol. 26/6, pp. 784-793.
http://dx.doi.org/10.1177/0956797615571017
Immigrant students » Dronkers, J. and M. Levels (2007), “Do school segregation and school resources explain
region-of-origin differences in the mathematics achievement of immigrant students?”, Educational Research and Evaluation, Vol. 13/5, pp. 435-462. http://dx.doi.org/10.1080/13803610701743047
» Jonsson, J. and F. Rudolphi (2010), “Weak performance, strong determination: School achievement and educational choice among children of immigrants in Sweden”, European Sociological Review, Vol. 27/4, pp. 487-508. http://dx.doi.org/10.1093/esr/jcq021
» OECD (2019), The Road to Integration: Education and Migration, OECD Reviews of Migrant Education, OECD Publishing, Paris. https://dx.doi.org/10.1787/d8ceec5d-en
» OECD (2018), The Resilience of Students with an Immigrant Background: Factors that Shape Well-being, OECD Reviews of Migrant Education, OECD Publishing, Paris. https://dx.doi.org/10.1787/9789264292093-en
Programme for the International Assessment of Adult Competencies (PIAAC) » OECD (2016), Skills Matter: Further Results from the Survey of Adult Skills, OECD Skills
Studies, OECD Publishing, Paris. http://dx.doi.org/10.1787/9789264258051-en
Programme for International Student Assessment (PISA) » OECD (2019), PISA 2018 Assessment and Analytical Framework, PISA, OECD
Publishing, Paris. https://doi.org/10.1787/7fda7869-en
» Schleicher, A. (2018), World Class: How to Build a 21st-Century School System, Strong Performers and Successful Reformers in Education, OECD Publishing, Paris. https://dx.doi.org/10.1787/9789264300002-en
Resilience » Claro, S., D. Paunesku and C. Dweck (2016), “Growth mindset tempers the effects of
poverty on academic achievement”, Proceedings of the National Academy of Sciences, Vol. 113/31, pp. 8664-8668. http://dx.doi.org/10.1073/pnas.1608207113
» Doll, B. (2012), “Enhancing resilience in classrooms”, in Handbook of Resilience in Children, Springer US, Boston, MA. http://dx.doi.org/10.1007/978-1-4614-3661-4_23
» Yeager, D. and C. Dweck (2012), “Mindsets that promote resilience: When students believe that personal characteristics can be developed”, Educational Psychologist, Vol. 47/4, pp. 302-314. http://dx.doi.org/10.1080/00461520.2012.722805

62 © OECD 2019 © OECD 2019 63
PISA 2018: Insights and InterpretationsPISA 2018: Insights and Interpretations
PISA 2018 ResultsVolume I, What Students Know and Can Do, provides a detailed examination of student performance in reading, mathematics and science, and describes how performance has changed since previous PISA assessments. https://doi.org/10.1787/5f07c754-en
Volume II, Where All Students Can Succeed, examines gender differences in student performance, and the links between students’ socio-economic status and immigrant background, on the one hand, and student performance and well-being, on the other. https://doi.org/10.1787/b5fd1b8f-en
Volume III, What School Life Means for Students’ Lives, focuses on the physical and emotional health of students, the role of teachers and parents in shaping the school climate, and the social life at school. The volume also examines indicators of student well-being, and how these are related to the school climate. https://doi.org/10.1787/acd78851-en
Volume IV, Are Students Smart about Money?, examines 15-year-old students’ understanding about money matters in the 21 countries and economies that participated in this optional assessment; forthcoming in 2020.
Volume V, Effective Policies, Successful Schools, analyses the policies and practices used in schools and school systems, and their relationship with education outcomes more generally; forthcoming in 2020.
Volume VI, Are Students Ready to Thrive in Global Societies?, explores students’ ability to examine local, global and intercultural issues, understand and appreciate different perspectives and world views, interact respectfully with others, and take responsible action towards sustainability and collective well-being; forthcoming in 2020.
This work is published under the responsibility of the Secretary-General of the OECD. The opinions expressed and arguments employed herein do not necessarily reflect the official views of OECD member countries.
This document and any map included herein are without prejudice to the status of or sovereignty over any territory, to the delimitation of international frontiers and boundaries and to the name of any territory, city or area.
The statistical data for Israel are supplied by and under the responsibility of the relevant Israeli authorities. The use of such data by the OECD is without prejudice to the status of the Golan Heights, East Jerusalem and Israeli settlements in the West Bank under the terms of international law.
Notes on Cyprus: Note by Turkey: The information in this document with reference to “Cyprus” relates to the southern part of the Island. There is no single authority representing both Turkish and Greek Cypriot people on the Island. Turkey recognises the Turkish Republic of Northern Cyprus (TRNC). Until a lasting and equitable solution is found within the context of the United Nations, Turkey shall preserve its position concerning the “Cyprus issue”.
Note by all the European Union Member States of the OECD and the European Union: The Republic of Cyprus is recognised by all members of the United Nations with the exception of Turkey. The information in this document relates to the area under the effective control of the Government of the Republic of Cyprus.
Photo credits: Cover © LuminaStock/iStock © Dean Mitchell/iStock © bo1982/iStock © karandaev/iStock© IA98/Shutterstock © Tupungato/Shutterstock © OECD 2019
The use of this work, whether digital or print, is governed by the Terms and Conditions
to be found at www.oecd.org/termsandconditions

Connect with us: [email protected] @OECDEduSkills
https://oecdedutoday.com/ OECD Education and skills
https://www.oecd-ilibrary.org/education @oecd_education_skills
Visit www.oecd.org/pisa
2018For more information, contact
Andreas Schleicher [email protected]