Dividend.com - 2016 Stock Guide - Amazon S3 - 2016 Stock Guide 6 Even More Dividends And Buybacks We...
227
1
Transcript of Dividend.com - 2016 Stock Guide - Amazon S3 - 2016 Stock Guide 6 Even More Dividends And Buybacks We...

1

Dividend.com - 2016 Stock Guide
2
Table of Contents
Introduction 3-4
2015 Review 5-7
2016 Preview 8 -12
Stock-by-Stock Previews 13-226

Dividend.com - 2016 Stock Guide
3
INTRODUCTION
This eBook serves as an investing guide and economic forecast for dividend-minded
investors. In the following pages, we’ll examine the important issues facing both investors
and specific dividend-paying stocks in the coming year.
Despite a dramatic and frightening 11% drop in August, the stock market (as measured
by the S&P 500 Index) ended 2015 just about where it was when the year began.
After a choppy start in January—and a shift to a slightly higher trading plateau in the
spring and early summer—the markets plunged in response to sharp stock declines in
China, and then recovered in the year’s final quarter. Following an 11.4% gain in 2014
and an almost 30% gain in 2013, the market’s go-nowhere 2015 performance was
disappointing. Treasuries as measured by 10-year bonds also were essentially flat. But
considering mounting fears of a global recession and worries over the effects of higher
interest rates, many investors were thankful for a year in which financial markets had no
particular color rather than one that left their portfolios bright red.
Driving markets during the year were two key issues: the health of China (the world’s
second largest economy) and the future of interest rates.
Few Western analysts trust the accuracy of China’s official economic statistics—so what
they see with their own eyes has them concerned. Having built a huge manufacturing
engine largely on credit, which also fueled massive investments in real estate, China now
is burdened by debt. To service the debt, the country must keep up its furious export
pace, even if that means cutting prices—and that pricing pressure, in a world glutted with
goods, keeps driving commodity prices lower.
The price of Dr. Copper (so named because price movements of the widely used metal
have reliably forecast global economic shifts) were off almost 30% in 2015, after a fifth
year of declines in 2014. Other commodities came down too.
Oil prices were the biggest movers, down 40% to the delight of drivers and to the dismay
of energy producers, especially the highly leveraged ones. The broad Bloomberg
Commodity Index was off more than 20% for the year. While the pace of decline
probably won’t continue in 2016, there are few signs of an imminent turnaround.
On the interest-rate front, repeated signals throughout the year from the Federal Reserve
that a modest hike was likely as long as employment and other signs of economic health
continued to improve seemed to serve as a kind of inoculation against shock—there was
little immediate reaction once the Fed eventually pulled the trigger in mid-December. By
that time, analysts had already moved on to concerns about the timing and size of
subsequent rate hikes.
As the year drew to a close, uncertainty abounded on many fronts: Will the European
Central Bank’s increased monetary easing—a move at odds with Fed tightening—spur
Eurozone growth, attract more investment to the U.S. and drive the dollar even higher, or

Dividend.com - 2016 Stock Guide
4
both? Will the U.S. economy continue to recover or slump in the face of worldwide
deflationary trends? How will the 2016 elections shape markets and the economy?
As we have done in the past, we will look into the economic crystal ball for 2016 from
the perspective of what may go right and what may go wrong. We will then provide our
own view of these potential factors, aware that a multitude of factors could influence
outcomes. We hope this analysis—followed by similar upside and downside previews for
several dozen of the biggest-name dividend stocks in the world—helps you invest
successfully in 2016.
And please keep in mind that the scenarios that follow are possibilities, not predictions.

Dividend.com - 2016 Stock Guide
5
A Look Back At 2015
Before looking ahead, let’s review some of the scenarios laid out in last year’s dividend
guide—a process that will add perspective to our 2016 outlook. First, a retrospective on some
of our optimistic scenarios, then we’ll look at some of the things we thought might go wrong.
Things We Hoped Would Go Right
Continued Unwinding Of Commodities Even after more than three years of declining commodity prices, our year-end 2014 outlook
for the coming year said that commodities would like fall further (possibly much further) as a
great unwinding continued into 2015—the call was right on target.
At the top of the commodity pyramid stands gold, which peaked at $1,921.50 an ounce in
September 2011 and has been riding a downward roller coaster since. It ended 2014 at
$1,188.20 an ounce and was trading at about $1,080 by the time 2015 came to close, a
decline of almost 9%. The drop in the price of oil, which hit $147.27 per barrel in July 2008,
has been even steeper as a result of the astonishing success of new U.S. production. From
roughly $75 per barrel at the end of 2014, the next 12 months saw oil prices fall to $40.
Rounding out the most prominent commodities, copper also continued to sink, down to a few
pennies above $2 a pound, down from its peak near $4.70 in February 2011, and its year-end
2014 price of near $3.
Since commodities traditionally have moved inversely to equities, we were expecting that
lower commodity prices would have a tonic effect on stocks. On that score, we were half
right.
A Booming M&A Market Just as 2014 saw considerable merger and acquisition activity in tobacco, energy,
broadcasting, telecom, tech, biotech, spirits and more, we anticipated that 2015 would be
another big year for M&A—especially in technology and energy, as interest rates remained
low and activist investors demanded greater returns. We were more than right; the year
turned out to be a record for mergers and acquisitions, with deal volume approaching $1.7
trillion. Some of the largest and most notable deals included the merger of Charter
Communications Inc. (CHTR) and Time Warner Cable Inc. (TWC); The Kraft Heinz Co.
(KHC), which combined two giant food companies; the merger of insurance goliaths ACE
Limited (ACE) and The Chubb Corp. (CB); and Dell’s offer for EMC Corp. (EMC).
More IPOs
After a very strong market for initial public offerings in 2014, we felt that market conditions
in 2015 would be ripe for many more companies to make the move. Conditions were good,
and about 230 companies went public during the year—but that was below the blizzard of
364 IPOs in 2014, a recent record, and lower than the 256 of 2013. The less-than-exciting
trajectory of the stock market in 2015, and the sharp correction in August, probably
contributed to the subdued number of newcomers.

Dividend.com - 2016 Stock Guide
6
Even More Dividends And Buybacks We risk self-injury in patting ourselves on the back for this call—U.S. corporations spent a
record $1 trillion on dividends and buybacks in 2015. Prodded into returning more to
shareholders by activist investors such as Carl Icahn, Bill Ackman and Nelson Peltz,
corporate managers are also serving their own ends by buying back company shares to push
up the price of remaining shares and their own share-price dependent compensation—this is
where ordinary shareholders benefit along with the top guys.
Global QE Hits A Crescendo Last year, we said that quantitative easing by the world’s central banks would continue
because: a) central bankers believe more liquidity is the miracle pill for every sick economy;
b) they’re so committed to QE that they have no choice but to convince themselves that the
process works and that it is good for everyone; and c) to believe otherwise, or to question the
long-term ramifications of their practices, is all but forbidden at this point. While the Fed
took its foot off the gas in 2015, their European counterparts stomped down even harder,
driving interest rates further into negative territory. The big money wheels kept on rolling.
Things We Thought Could Go Wrong
The Housing Market Plunges We thought that stagnant household income and weak wage growth would keep the housing
market cool in 2015. In fact, the housing market slogged along in the same way that the
economy slowly and modestly improved. Sales of existing homes continued to improve each
month, while new home sales were up very modestly for the year. The outlook, however, is
optimistic rather than gloomy: In October, a builder sentiment index from the National
Association of Home Builders rose to a 10-year high.
Valuations Finally Come Under Scrutiny Is the market overvalued? We worried about that all through 2013 and 2014, when the price-
to-revenue ratio of the S&P 500 climbed to a record 1.81 toward the end of the year.
Guess what? As 2015 drew to a close, the ratio was still in the 1.8 area, so market
participants clearly were not especially concerned. Since valuations are based on emotions,
which can turn on a dime, what investors are willing to pay for stock may change in 2016—
and then again, it may not.
A New Cold War Freezes The Markets Looking ahead to 2015 last year, the belligerency and aggressiveness of Russian president
Vladimir Putin seemed like a wildcard. Anything from war to energy disruptions to organized
computer hacking seemed possible with the Russian strong man at the helm. There was no
discernable market fallout from the Russian sabre rattling last year, not that conditions have
devolved into a 21st century cold war, but the West is still keeping a wary eye on the Eastern
front.
Another Recession Rocks The Markets

Dividend.com - 2016 Stock Guide
7
Whew! Our lumbering recovery may not be the economic revival of our dreams, but it sure
beats the Almost Depression of 2008-2009, or even a garden variety recession. Thank
goodness that 2015 was a year of slow growth, not negative growth, and that our economic
nightmares remained a dream. But one additional year without a recession only means that
the next inevitable downturn is one year closer. Caution and preparation are warranted more
than ever.

Dividend.com - 2016 Stock Guide
8
Looking Ahead To 2016
Things We Hope Will Go Right
The Economy Continues On Its Low-Growth Path
There’s no law that says recessions are inevitable—but history has shown that they recur
periodically for a variety of reasons, typically every several years. The last one, of course,
was the December 2007 to June 2009 doozy that has come to be known as the Great
Recession when the economy shrank by 4.3%. The National Bureau of Economic Research
(the official record keeper and identifier of recessions) says the two previous recessions
occurred between March and November 2001, when GDP declined by 0.3%, and from July
1990 to March 1991, when it declined by 1.4%. So as we proceed into the seventh year of
recovery, the likelihood of a recession increases.
In the past, inventory accumulation and tighter monetary policy were often seen as the major
causes of slowdowns. Today, information technology has radically reduced the potential for
inventory problems. Concerns over the recessionary consequences of tighter money was the
chief reason the Federal Reserve deliberated for so long in its decision to raise interest rates.
Those concerns remain, but there are several factors suggesting that our current economic
expansion will continue.
First, the absolute level of interest rates, even if the Fed acts a few times, is still
extraordinarily low by historical standards. While it’s true that the size of marginal increases
is significant, the absolute rate of interest is hugely important too, as in a case where the Fed
would raise rates 25% to 1.25% from 1%—a huge percentage hike, but one that kept rates at
a very low level. Even if rates move somewhat higher, our current low-interest rate
environment is likely to continue due to international economic forces, and low rates are a
traditional driver of economic expansion.
Second, consumers appear to be on a better footing. Employment figures continue to
improve, and while much of the gains from the current recovery have gone to the wealthy,
people across the income spectrum seem more disposed to spend.
While countervailing economic forces—including a slowdown in China and weakened global
demand—could tip the scales toward recession, we believe there is a good chance the
domestic economy will continue to lumber along.
The Stock Market Muddles Along If the economy continues to expand slowly, we believe the stock market could follow the
same route. To be sure, as we saw in 2015, volatility can be part of an essentially flat
performance picture; therefore, even if stock prices aren’t much higher a year from now,
there could well be times we reach for the Dramamine.
Those who say the market has little room to rise point to its overvaluation. According to one
important measure—the Cyclically Adjusted Price Earnings Ratio, or P/E10, which measures
current prices against the 10-year average of inflation-adjusted earnings—the market is
priced above its historic average at roughly 26 times adjusted earnings versus the long-term

Dividend.com - 2016 Stock Guide
9
P/E10 average of 16.6. But, current levels are far below the P/E10 peaks of 44.2 before the
dotcom crash in 2000 and the 32.6 level before the 1929 debacle. If corporate earnings
continue to rise the ratio would decline at current price levels, which would continue to make
the market a bit more expensive than average—but not excessively so, supporting the case
for okay, if not spectacular, market performance.
Bi-Partisan Agreement On Lowering Corporate Tax Rates Just as the Citigroup-Travelers merger in 1998 forced Congress into repealing the Glass-
Steagall Act, the 2015 Pfizer-Allergan merger cum tax inversion may be the trigger that sets
off a change in the corporate tax rate. Outrage over the $160 billion merger (in which
Allergan technically takes over Pfizer so that the surviving entity—which presto, change-o
becomes Pfizer again—is domiciled in Ireland) could well prompt an adjustment in the U.S.
corporate income tax rate, which can be as high as 39%. That’s the highest level in the
developed world and a reason that many U.S. companies are looking to leave the U.S.
Avoiding such high taxation is the reason that American companies have parked more than
$2 trillion overseas, which could be used for domestic investment if the tax climate changed.
If a lower corporate tax rate can be spun as a jobs creation measure—rather than as a
giveaway to large corporations (which merely pass along the tax to customers in the form of
higher prices anyway)—it’s possible that sufficient bipartisan support could exist for a
change in the tax law that would address an issue that troubles both sides of the aisle.
Small M&A Deals Continue While huge mergers and acquisitions dominate the headlines, lots of small- and medium-size
deals are going on under the media radar. These acquisitions are quietly transforming the
large American corporations that constitute the dividend-paying universe for a reason cynical
yet simple: Big companies are great at many things these days (including paying dividends),
but aside from the pharmaceutical and software/internet giants, they aren’t especially
innovative. Largely because of their bureaucracy, politics, short-term outlook and avoidance
of risk, big companies aren’t likely to come up with disruptive new products that will
dramatically increase revenue or create processes that encourage revenue growth.
Fortunately, they have the money to buy what they know they can’t create. And buying
smaller companies that have developed new products and processes is a lot easier than
creating those innovations from scratch.
While the record $3.7 trillion value of global M&A in 2015 was due largely to the size of the
year’s several mammoth transactions, it also included numerous smaller deals. These are
likely to continue in 2016 if the economy continues to grow modestly and interest rates stay
low, even if rising a bit. The acquisitions can continue to fuel the growth that large
companies require to continue paying dividends.
Dividends Continue Even if dividends and buybacks in 2016 do not reach the record $1 trillion spent in 2015, the
corporate community’s strong emphasis on rewarding shareholders is unlikely to abate as
activist investors continue to prod management to share some of the estimated $1.8 trillion in
cash on corporate balance sheets. Corporate management’s use of buybacks to put a glow on

Dividend.com - 2016 Stock Guide
10
modest or non-existent earnings-per-share growth—and boost their own compensation—isn’t
likely to stop either.
The big question mark will be earnings. In 2015, earnings and sales growth were essentially
flat. If the economy continues to expand, stock prices, and dividends, should rise modestly as
well. Barring a recession, all signs point to a continuation of the strong dividend-paying
trend.
Slightly Higher Rates Actually Help Economy While the Fed moves to raise interest rates traditionally seen as an economic depressant—
“removing the punch bowl just as the party gets going,” in the words of the late Federal
Reserve Chairman William McChesney Martin—this time around higher rates actually may
have a salutary effect on the economy and the stock market.
For one, after carefully taking the temperature of the economy for so long before raising
rates, the Fed’s move is a very strong vote of confidence in the underlying strength of the
recovery. That alone should add to optimism.
Second, greater economic confidence and concerns that rates are going up would prompt
many would-be home buyers to act rather than wait. Greater real estate activity would serve
as another economic driver.
Third, and equally important, higher rates would reward savers and take pressure off retirees
living off their savings. Confident of higher income (even if modest), savers would likely
increase their spending, which would add another economic spur.
Things We Worry May Go Wrong
Housing Markets Stumble If rates rise even slightly, the level of income needed to support mortgage payments will rise,
which could make a home purchase impossible for those with stagnant incomes. Higher rates
could also make mortgage lenders even more skittish and demanding than they are now,
which would add to the inability of many would-be buyers to purchase a home.
Another factor that could shift the demand-supply balance for housing includes the
possibility that institutional owners of single-family homes—including the hedge funds and
others that bought hundreds of thousands of homes at depressed prices over the last five
years—could decide to cash out and take their profits.
Finally, since the greatest housing demand generally arises from young couples seeking their
own space to raise a family, the $1 trillion level of student debt—largely among Millennials
in their prime home-buying years—could act as an overwhelming retardant to home
purchases.
Aside from demand in certain red-hot markets such as San Francisco and New York City,
these factors could cause a lull or a slowdown in housing.

Dividend.com - 2016 Stock Guide
11
The High-Yield Market Tanks
The long-term low interest rate environment has driven many investors to the high-yield
bond market. Corporations and securities firms responded to demand by issuing more high-
yield debt—now totaling $2.2 trillion, up by almost $1 trillion over the last five years.
Energy and metals and mining companies account for more than a quarter of that debt, and
those companies are in trouble due to the falling price of oil and other commodities. As the
decline continues, it’s possible that the high-yield default rate (now about 3% and low by
historic standards) may rise. Should that happen, confidence in the market could decline and
sell-off pressures could increase.
According to analysis by UBS, more than a third of the outstanding U.S. high-yield and
leveraged loan universe is “at risk” because issuers may not be able to refinance when the
debt matures because of higher rates and poor cash flow generation. A downturn in the high-
yield market could ricochet through the economy, frightening investors and spreading doubt
about the strength of the recovery.
Terrorism Strikes At Economic Nerve Centers By its very nature, terrorism of the kind that struck Paris and San Bernardino, California at
the end of 2015 is irrational and almost impossible to predict. While the loss of life in these
horrible attacks has been tragic, the direct economic impact of terrorism has been slim aside
from its chilling effect on tourism. That may change.
While we are taking security steps to protect our national economic resources, we remain
vulnerable to terror attacks on vital points of our financial, energy and communications
infrastructure. In his recent book, “Lights Out,” former ABC News anchor Ted Koppel says
that a major cyberattack on the nation’s power grid is not only possible but likely, and that
such an attack would be devastating. He also believes that the evidence points to our
unpreparedness for such an attack.
Should terrorists strike a strategically important nerve center in 2016, the effect on the
national economy and our economic confidence could be enormous.
Global Trade Slumps In the wake of China’s economic problems, world trade tumbled in 2015. Conditions are
right for the slump to continue and possibly worsen in 2016.
Demand for dry bulk shipping (which shrunk 2% to 3% in 2015) is likely to shrink by the
same amount in 2016, say maritime experts, and losses and bankruptcies are already hitting
the global shipping industry. On the higher end of the value chain, air cargo shipments
declined by about 2% in 2015 as well, and the 2016 outlook among specialists in that area
indicate that it too is likely to suffer from a decline in global trade.
If the current declines and persistent weakness in China reinforce the trend, the global trading
decline could become a prominent issue in 2016 and lead to a variety of negative
consequences.
Major Infrastructure Failure
Dividend.com - 2016 Stock Guide
12
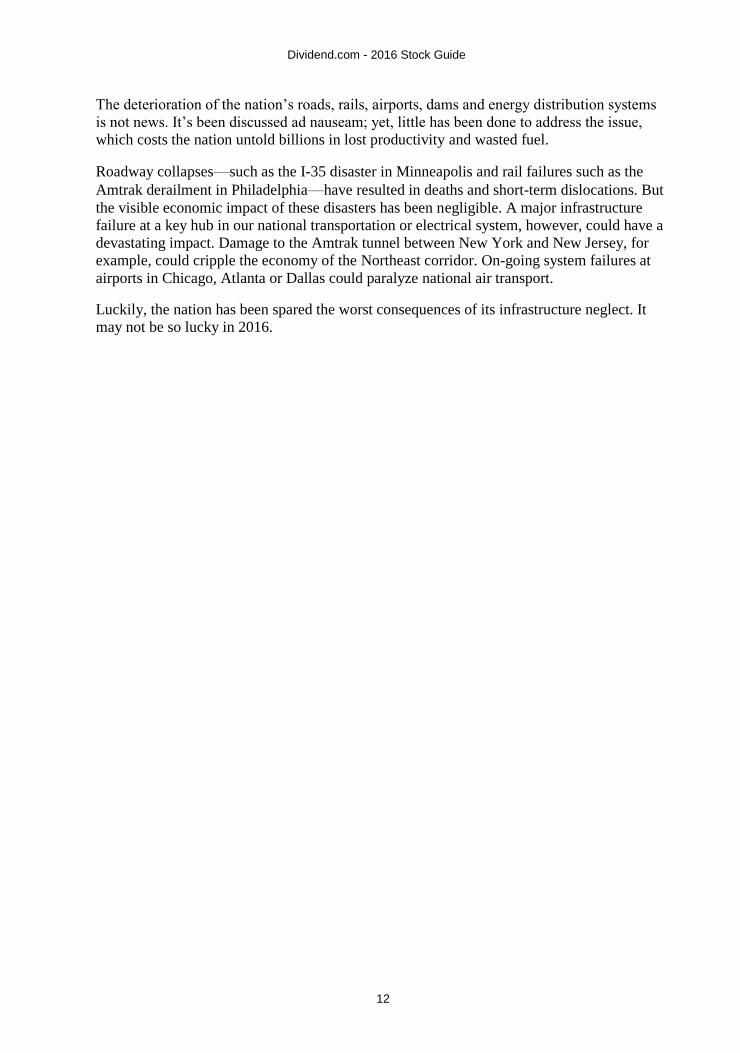
The deterioration of the nation’s roads, rails, airports, dams and energy distribution systems
is not news. It’s been discussed ad nauseam; yet, little has been done to address the issue,
which costs the nation untold billions in lost productivity and wasted fuel.
Roadway collapses—such as the I-35 disaster in Minneapolis and rail failures such as the
Amtrak derailment in Philadelphia—have resulted in deaths and short-term dislocations. But
the visible economic impact of these disasters has been negligible. A major infrastructure
failure at a key hub in our national transportation or electrical system, however, could have a
devastating impact. Damage to the Amtrak tunnel between New York and New Jersey, for
example, could cripple the economy of the Northeast corridor. On-going system failures at
airports in Chicago, Atlanta or Dallas could paralyze national air transport.
Luckily, the nation has been spared the worst consequences of its infrastructure neglect. It
may not be so lucky in 2016.

Dividend.com - 2016 Stock Guide
13
AbbVie, Inc. (ABBV)
2015 Range: 45.45 - 71.60
Avg. Volume: 10,252,700
Market Cap: 91.69B
P/E Ratio (2016): 11.22
2015 EPS Est: 4.28
2016 EPS Est: 5.00
Annualized Div: 2.28
Div. Yield: 4.11%
Payout Ratio (2015): 0.53
Payout Ratio (2016): 0.46
ABBV Five-Year Stock Chart
Company Profile
Abbvie, Inc. (ABBV) is a maker of pharmaceutical products. Its product line includes treatments
for health conditions such as rheumatoid arthritis, psoriasis, Crohn's disease, HIV, low
testosterone, thyroid disease, Parkinson's disease, and many others. The company is
headquartered in North Chicago, Illinois and was spun off from Abbott Laboratories (ABT) in
January 2013.
Twenty-year dividend payout history (annualized)

Dividend.com - 2016 Stock Guide
14
Year Annualized Payout Change
2014 1.66 +3.75%
2013 1.60 --
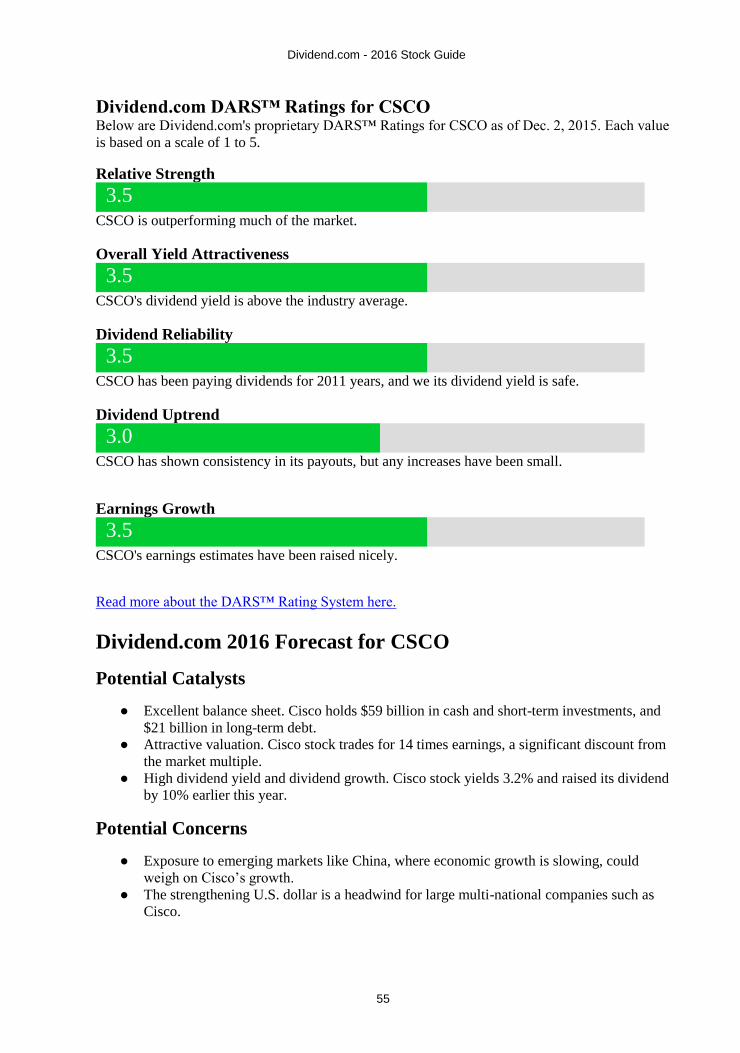
Dividend.com DARS™ Ratings for ABBV
Below are Dividend.com's proprietary DARS™ Ratings for ABBV as of Dec. 2, 2015. Each
value is based on a scale of 1 to 5.
Relative Strength
3.0
ABBV is performing in-line with the market or better.
Overall Yield Attractiveness
3.5
ABBV's dividend yield is above the industry average.
Dividend Reliability
4.5
ABBV has been paying dividends for 2011 years, and we feel its dividend yield is extremely
safe.
Dividend Uptrend
3.5
ABBV has shown steady and generous dividends, and has increased its payouts each year.
Earnings Growth
3.0
ABBV's earnings estimates are flat.
Read more about the DARS™ Rating System here.

Dividend.com - 2016 Stock Guide
15
Dividend.com 2016 Forecast for ABBV
Potential Catalysts
● As a major healthcare company, Abbvie is poised to benefit from the aging population.
The “baby boomer” generation is the largest in the United States. An aging population
will increase demand for health care products and services.
● Abbvie is growing revenue and earnings at a high rate. Through the first nine months of
the year, revenue and adjusted earnings grew 13% and 38%, respectively.
● Abbvie is a rare stock that offers both a high current dividend yield,(of 3.4%) and a high
dividend growth. Abbvie has increased its dividend by 27% since its first payout in
January 2013.
Potential Concerns
● The main concern for Abbvie is that it generates a majority of total revenue from one
drug, Humira, which constituted 61% of the company’s overall sales in 2015 thus far.
● Another concern is the increased regulatory scrutiny of biotechnology companies. In
October, Abbvie stock fell 14% in a single day after the FDA warned the company that
its hepatitis C treatments – Viekira Pak and Technivie – can cause serious liver injury in
patients with underlying advanced liver disease.
● Abbvie stock is aggressively valued based on its reported earnings. The stock trades for
18 times 2015 GAAP earnings per share, which is a premium valuation.
Bottom Line
Abbvie’s portfolio is highly focused on Humira, but it is aggressively expanding its future drug
pipeline. Last quarter, Abbvie generated $773 million in sales from two of its new drugs:
Imbruvica and Viekira. Abbvie’s future pipeline depends on the success of its new drugs and
continued strong sales of Humira.
Additional Resources for ABBV
● Dividend.com Profile Page for ABBV
● Full Dividend Payout History for ABBV

Dividend.com - 2016 Stock Guide
16
Alliance Resource Partners L.P. (ARLP)
2015 Range: 12.87 - 43.65 Avg. Volume: 304,534
Market Cap: 982.25M P/E Ratio (2016): 5.02
2015 EPS Est: 3.07 2016 EPS Est: 2.64
Annualized Div: 3.30 Div. Yield: 20.49%
Payout Ratio (2015): 1.07 Payout Ratio (2016): 1.25
ARLP Five-Year Stock Chart
Company Profile
Alliance Resource Partners LP (ARLP) engages in the production and marketing of coal
primarily to utilities and industrial users in the United States. As of December 31, 2007, the
company had approximately 712.8 million tons of coal reserves in Illinois, Indiana, Kentucky,
Maryland, Pennsylvania, and West Virginia. Alliance Resource Management GP, LLC is the
general partner of Alliance Resource Partners, L.P. The company was founded in 1971 and is
headquartered in Tulsa, Oklahoma. As a limited partnership, capital gains are accounted for
differently, so please consult with a tax advisor.
Twenty-year dividend payout history (annualized)

Dividend.com - 2016 Stock Guide
17
Year Annualized Payout Change
2014 3.68 -19.33%
2013 4.57 +9.67%
2012 4.16 +14.73%
2011 3.63 +13.20%
2010 3.21 -27.08%
2009 4.40 +73.72%
2008 2.53 +15.00%
2007 2.20 +14.58%
2006 1.92 +21.87%
2005 1.58 +26.65%
2004 1.24 +18.48%
2003 1.05 +5.00%
2002 1.00 --
2001 1.00 --
2000 1.00 +769.57%
1999 0.12 -93.07%
Dividend.com DARS™ Ratings for ARLP
Below are Dividend.com's proprietary DARS™ Ratings for ARLP as of Dec. 2, 2015. Each value
is based on a scale of 1 to 5.
Relative Strength
3.5
ARLP is outperforming much of the market.
Overall Yield Attractiveness
4.0
ARLP's dividend yield is above the industry average.
Dividend.com - 2016 Stock Guide
18
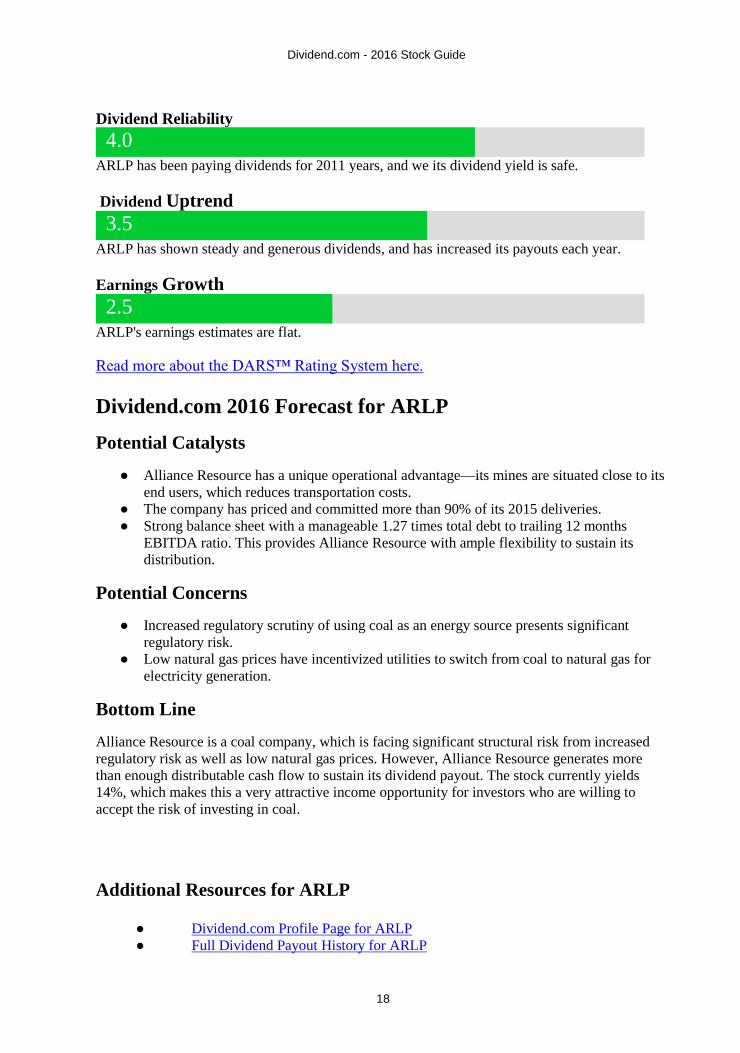
Dividend Reliability
4.0
ARLP has been paying dividends for 2011 years, and we its dividend yield is safe.
Dividend Uptrend
3.5
ARLP has shown steady and generous dividends, and has increased its payouts each year.
Earnings Growth
2.5
ARLP's earnings estimates are flat.
Read more about the DARS™ Rating System here.
Dividend.com 2016 Forecast for ARLP
Potential Catalysts
● Alliance Resource has a unique operational advantage—its mines are situated close to its
end users, which reduces transportation costs.
● The company has priced and committed more than 90% of its 2015 deliveries.
● Strong balance sheet with a manageable 1.27 times total debt to trailing 12 months
EBITDA ratio. This provides Alliance Resource with ample flexibility to sustain its
distribution.
Potential Concerns
● Increased regulatory scrutiny of using coal as an energy source presents significant
regulatory risk.
● Low natural gas prices have incentivized utilities to switch from coal to natural gas for
electricity generation.
Bottom Line
Alliance Resource is a coal company, which is facing significant structural risk from increased
regulatory risk as well as low natural gas prices. However, Alliance Resource generates more
than enough distributable cash flow to sustain its dividend payout. The stock currently yields
14%, which makes this a very attractive income opportunity for investors who are willing to
accept the risk of investing in coal.
Additional Resources for ARLP
● Dividend.com Profile Page for ARLP
● Full Dividend Payout History for ARLP

Dividend.com - 2016 Stock Guide
19
AvalonBay Communities Inc. (AVB)
2015 Range: 158.72 - 186.89 Avg. Volume: 774,577
Market Cap: 24.05B P/E Ratio (2016): 21.35
2015 EPS Est: 8.00 2016 EPS Est: 8.23
Annualized Div: 5.00 Div. Yield: 2.87%
Payout Ratio (2015): 0.63 Payout Ratio (2016): 0.61
AVB Five-Year Stock Chart
Company Profile
AvalonBay Communities (AVB) is an apartment-based real estate investment trust (REIT). AVB
owns or holds an ownership interest in multifamily communities in 10 states and the District of
Columbia. The company, formerly known as Bay Apartment Communities, Inc., was founded in
1978 and is headquartered in Arlington, Virginia. AVB is largely affected by general economic
conditions and the housing market in the U.S. As a REIT, it is mandated to pay out the majority
of its earnings, and as a result has a high dividend yield and payout ratio. AVB has been paying
dividends since 1998, and has increased them consecutively annually since 2013. AVB pays
dividends quarterly.

Dividend.com - 2016 Stock Guide
20
Twenty-year dividend payout history (annualized)
Year Annualized Payout Change
2014 4.64 +8.41%
2013 4.28 +10.31%
2012 3.88 +8.62%
2011 3.57 --
2010 3.57 -20.00%
2009 4.47 -16.99%
2008 5.38 +58.21%
2007 3.40 +8.97%
2006 3.12 +9.86%
2005 2.84 +1.43%
2004 2.80 --
2003 2.80 --
2002 2.80 +9.38%
2001 2.56 +14.29%
2000 2.24 +8.74%
1999 2.06 +34.64%
1998 1.53 -58.45%
Dividend.com - 2016 Stock Guide
21
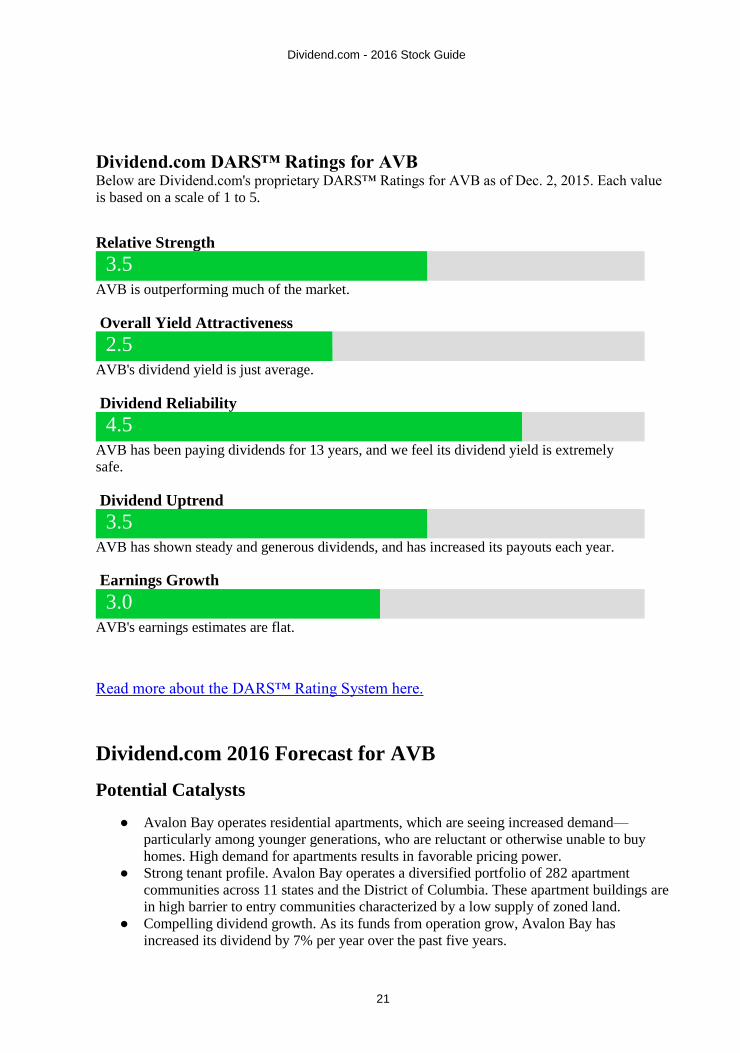
Dividend.com DARS™ Ratings for AVB
Below are Dividend.com's proprietary DARS™ Ratings for AVB as of Dec. 2, 2015. Each value
is based on a scale of 1 to 5.
Relative Strength
3.5
AVB is outperforming much of the market.
Overall Yield Attractiveness
2.5
AVB's dividend yield is just average.
Dividend Reliability
4.5
AVB has been paying dividends for 13 years, and we feel its dividend yield is extremely
safe.
Dividend Uptrend
3.5
AVB has shown steady and generous dividends, and has increased its payouts each year.
Earnings Growth
3.0
AVB's earnings estimates are flat.
Read more about the DARS™ Rating System here.
Dividend.com 2016 Forecast for AVB
Potential Catalysts
● Avalon Bay operates residential apartments, which are seeing increased demand—
particularly among younger generations, who are reluctant or otherwise unable to buy
homes. High demand for apartments results in favorable pricing power.
● Strong tenant profile. Avalon Bay operates a diversified portfolio of 282 apartment
communities across 11 states and the District of Columbia. These apartment buildings are
in high barrier to entry communities characterized by a low supply of zoned land.
● Compelling dividend growth. As its funds from operation grow, Avalon Bay has
increased its dividend by 7% per year over the past five years.

Dividend.com - 2016 Stock Guide
22
Potential Concerns
● As a REIT, Avalon Bay is sensitive to changes in interest rates. The U.S. Federal Reserve
may increase interest rates as soon as December. This would put pressure on REITs,
which utilize debt heavily within their capital structures, and would suffer higher interest
costs if rates rise.
● Avalon Bay carries a significantly leveraged balance sheet. Debt-to-EBITDA is 4.9 times
higher than many other stocks in its peer group.
● Low dividend yield. Avalon Bay’s share price is close to its 52-week high. This has
caused its dividend yield to fall to 2.8% currently. That is a fairly low dividend yield—
especially for a REIT, which commonly yield 4%-5%, or higher.
Bottom Line
As the company does not want to issue debt to further stress its balance sheet, Avalon Bay is
issuing equity, which is dilutive to existing shareholders. FFO per share fell 5% last quarter
largely because of more shares outstanding.
Additional Resources for AVB
● Dividend.com Profile Page for AVB
● Full Dividend Payout History for AVB
American Express Company (AXP)
2015 Range: 67.80 - 94.89 Avg. Volume: 5,533,700
Market Cap: 68.65B P/E Ratio (2016): 12.82
2015 EPS Est: 5.28 2016 EPS Est: 5.44
Annualized Div: 1.16 Div. Yield: 1.69%
Payout Ratio (2015): 0.22 Payout Ratio (2016): 0.21

Dividend.com - 2016 Stock Guide
23
AXP Five-Year Stock Chart
Company Profile
American Express (AXP)--or AmEx for short--is a multinational financial services company that
is primarily known for its payment services. The company operates in four segments: U.S. Card
Services, International Card Services, Global Commercial Services (GCS) and Global Network &
Merchant Services. The company employs over 62,500 people worldwide. AmEx is largely
affected by financial and credit markets, and well as general macroeconomic conditions. As well,
AmEx is affected by regulations about lending and interest rates. AmEx was founded in 1950,
and is headquartered in New York, NY. AmEx has been paying dividends since 1993, and has
increased them consecutively annually since 2012. AmEx pays its dividends quarterly.
Twenty-year dividend payout history (annualized)
Year Annualized Payout Change
2014 0.98 +13.95%
2013 0.86 +10.26%
2012 0.78 +8.33%
2011 0.72 --

Dividend.com - 2016 Stock Guide
24
2010 0.72 -20.00%
2009 0.90 +25.00%
2008 0.72 +20.00%
2007 0.60 +11.11%
2006 0.54 +12.50%
2005 0.48 +50.00%
2004 0.32 -15.79%
2003 0.38 -5.00%
2002 0.40 +25.00%
2001 0.32 +1.59%
2000 0.32 +4.88%
1999 0.30 +33.48%
1998 0.23 -25.00%
1997 0.30 -20.00%
1996 0.38 +66.67%
1995 0.23 -85.94%
1994 1.60 -65.52%
Dividend.com DARS™ Ratings for AXP
Below are Dividend.com's proprietary DARS™ Ratings for AXP as of Dec. 2, 2015. Each value
is based on a scale of 1 to 5.
Relative Strength
3.5
AXP is outperforming much of the market.
Overall Yield Attractiveness
2.5
AXP's dividend yield is just average.

Dividend.com - 2016 Stock Guide
25
Dividend Reliability
4.5
AXP has been paying dividends for 2011 years, and we feel its dividend yield is extremely
safe.
Dividend Uptrend
3.5
AXP has shown steady and generous dividends, and has increased its payouts each year.
Earnings Growth
3.0
AXP's earnings estimates are flat.
Read more about the DARS™ Rating System here.
Dividend.com 2016 Forecast for AXP
Potential Catalysts
● American Express will benefit from continued recovery in the global economy.
Consumer spending remains resilient, which is a long-term positive catalyst for the
company. Long-term growth initiatives are expected to materialize as early as 2016,
when earnings per share are projected to return to growth then increase 12%-15% in
2017.
● Attractive valuation. American Express stock trades for 12 times earnings per share,
which is close to a five-year low valuation.
Potential Concerns
● American Express’ earnings per share declined 11% last quarter as its return on equity
contracted by two percentage points. The company is spending aggressively on growth
initiatives including renewals and changes made earlier this year to certain co-brand
relationships.
● Low dividend yield. American Express yields just 1.5%, which is significantly below the
market average yield. This does not provide much of a margin of safety.
Bottom Line
American Express stock is cheap and the company recently formed a partnership with Sam’s
Club, the eighth largest retailer in the United States. It is also expanding its customer rewards
program to drive further increases in membership, which will be positive for earnings growth as
well.

Dividend.com - 2016 Stock Guide
26
Additional Resources for AXP
● Dividend.com Profile Page for AXP
● Full Dividend Payout History for AXP
Boeing Company (BA)
2015 Range: 115.14 - 158.83 Avg. Volume: 3,604,130
Market Cap: 97.76B P/E Ratio (2016): 15.46
2015 EPS Est: 8.25 2016 EPS Est: 9.44
Annualized Div: 4.36 Div. Yield: 3.05%
Payout Ratio (2015): 0.53 Payout Ratio (2016): 0.46
BA Five-Year Stock Chart
Company Profile
Boeing (BA) is the world's leading aerospace company and the largest manufacturer of
commercial jetliners and military aircraft combined. The company is located in over 90 countries,
and is the largest exporter in the U.S. It has three divisions: commercial airplanes, Integrated
Defense Systems (IDS), and Boeing Capital Corporation. BA was founded in 1916, and is based
in Chicago, IL. Boeing is affected by increasing costs of developing aircraft, as well as increasing
litigation costs. Boeing faced a probe in January 2013 over its new 787 dreamliner as batteries in
two aircraft overheated. Boeing has been paying dividends since 1937, and has been increasing it
steadily since 1970. Boeing is a dividend aristocrat and pays its dividend quarterly.

Dividend.com - 2016 Stock Guide
27
Twenty-year dividend payout history (annualized)
Year Annualized Payout Change
2014 2.92 +50.52%
2013 1.94 +10.23%
2012 1.76 +4.76%
2011 1.68 --
2010 1.68 -33.33%
2009 2.52 +57.50%
2008 1.60 +14.29%
2007 1.40 +16.67%
2006 1.20 +20.00%
2005 1.00 +29.87%
2004 0.77 +13.24%
2003 0.68 --
2002 0.68 --
2001 0.68 +21.43%
2000 0.56 --
1999 0.56 --
1998 0.56 --

Dividend.com - 2016 Stock Guide
28
1997 0.56 +2.75%
1996 0.55 +9.00%
1995 0.50 --
1994 0.50 -48.98%
Dividend.com DARS™ Ratings for BA
Below are Dividend.com's proprietary DARS™ Ratings for BA as of Dec. 2, 2015. Each value is
based on a scale of 1 to 5.
Relative Strength
3.5
BA is outperforming much of the market.
Overall Yield Attractiveness
3.0
BA's dividend yield is just average.
Dividend Reliability
4.0
BA has been paying dividends for 74 years, and we its dividend yield is safe.
Dividend Uptrend
4.0
BA has shown steady and generous dividends, and has increased its payouts each year.
Earnings Growth
2.5
BA's earnings estimates are flat.
Read more about the DARS™ Rating System here.

Dividend.com - 2016 Stock Guide
29
Dividend.com 2016 Forecast for BA
Potential Catalysts
● Refocused business strategy. Boeing is scaling back on exposure to global defense
budgets—a wise strategy in an environment of declining national defense spending.
● Boeing generates two-thirds of its revenue from the commercial markets. This is a strong
tailwind, as the commercial airline order backlog for planes is at a record high. Deliveries
of commercial aircraft rose 3% last year, representing the fourth consecutive record year.
● Huge backlog of growth opportunities. Boeing ended last quarter with a $485 billion
backlog for nearly 5,700 commercial airplane orders.
Potential Concerns
● Boeing currently has more than $24 billion in long-term liabilities on its balance sheet as
a result of accrued retiree health care and accrued pension plan liabilities.
● Geopolitical concerns. Boeing caters heavily to the commercial markets. Growth in
commercial aircraft is reliant on higher demand in the emerging markets, particularly in
Asia and the Middle East. Increased geopolitical risk could curtail Boeing’s growth.
Bottom Line
Boeing is a high-quality dividend stock with a 3% yield and a track record of high dividend
growth. Over the past five years, Boeing has increased its dividend by 16% compounded annually
– thanks to its strong earnings growth and large backlog – which will help fuel future earnings
and dividend growth.
Additional Resources for BA
● Dividend.com Profile Page for BA
● Full Dividend Payout History for BA
BlackRock Inc. (BLK)
2015 Range: 275.00 - 382.84 Avg. Volume: 771,494
Market Cap: 53.88B P/E Ratio (2016): 15.45
2015 EPS Est: 19.70 2016 EPS Est: 21.00
Annualized Div: 8.72 Div. Yield: 2.73%
Payout Ratio (2015): 0.44 Payout Ratio (2016): 0.42

Dividend.com - 2016 Stock Guide
30
BLK Five-Year Stock Chart
Company Profile
BlackRock, Inc. (BLK) is an independent investment management firm. The company provides
risk management, investment management, and advisory services to corporate, public, and Taft-
Hartley pension plans, insurance companies, mutual funds, endowments, foundations, nuclear
decommissioning trusts, banks, charities, corporations, official institutions, and individuals
worldwide. BlackRock was founded in 1988 and is based in New York, New York.
Twenty-year dividend payout history (annualized)
Year Annualized Payout Change
2014 7.72 +14.88%
2013 6.72 +12.00%
2012 6.00 +9.09%
2011 5.50 +10.00%
2010 5.00 +60.26%
2009 3.12 --

Dividend.com - 2016 Stock Guide
31
2008 3.12 +16.42%
2007 2.68 +59.52%
2006 1.68 +40.00%
2005 1.20 +20.00%
2004 1.00 +149.98%
2003 0.40 -86.30%
Dividend.com DARS™ Ratings for BLK
Below are Dividend.com's proprietary DARS™ Ratings for BLK as of Dec. 2, 2015. Each value
is based on a scale of 1 to 5.
Relative Strength
3.0
BLK is performing in-line with the market or better.
Overall Yield Attractiveness
3.0
BLK's dividend yield is just average.
Dividend Reliability
4.5
BLK has been paying dividends for 8 years, and we feel its dividend yield is extremely safe.
Dividend Uptrend
3.5
BLK has shown steady and generous dividends, and has increased its payouts each year.
Earnings Growth
3.0
BLK's earnings estimates are flat.
Read more about the DARS™ Rating System here.

Dividend.com - 2016 Stock Guide
32
Dividend.com 2016 Forecast for BLK
Potential Catalysts
● The rally in equity markets since the financial crisis has been a big positive for
BlackRock. This has fueled strong stock price gains and earnings growth. BlackRock
grew operating profit by 4% over the first three quarters of the year, thanks largely to $50
billion of net inflows in the third quarter.
● BlackRock is valued modestly given its earnings growth. The stock trades for 17 times
trailing earnings, a discount to the S&P 500 Index, which trades for 19 times EPS.
● Strong dividend yield and dividend growth. BlackRock yields 3% and has raised its
dividend by 16% compounded annually in the past five years.
Potential Concerns
● Equity markets have declined this year. Going forward, continued concerns regarding
global equity markets could deter investors from adding funds to ETF holdings, which
would lower BlackRock’s assets under management and earnings.
● Price deflation. Sponsors of ETFs are engaging in a price war, as each sponsor wants to
be the lowest-fee provider. Further compression of ETF expenses and fees would
negatively impact earnings growth.
Bottom Line
The financial industry is seeing a structural shift. Exchange-traded funds are becoming
increasingly popular with investors, due to their all-day tradability and lower fees than traditional
mutual funds. BlackRock has a leadership position in this growth category with its iShares lineup
of ETFs. This is what has fueled BlackRock’s compelling earnings and dividend growth, which
makes it a very good dividend pick.
Additional Resources for BLK
● Dividend.com Profile Page for BLK
● Full Dividend Payout History for BLK

Dividend.com - 2016 Stock Guide
33
Bristol-Myers Squibb Company (BMY)
2015 Range: 51.820 - 70.540 Avg. Volume: 6,730,380
Market Cap: 116.60B P/E Ratio (2016): 30.52
2015 EPS Est: 1.900 2016 EPS Est: 2.290
Annualized Div: 1.52 Div. Yield: 2.21%
Payout Ratio (2015): 0.8 Payout Ratio (2016): 0.66
BMY Five-Year Stock Chart
Company Profile
Bristol Myers Squibb Co. (BMY) is a global biopharmaceutical company. The company partakes
in the discovery, development, licensing, manufacturing, marketing, distribution and sale of
biopharmaceutical products. Its products are sold globally to wholesalers, retail pharmacies,
hospitals, government entities and to the medical profession. BMY was founded in 1933, and is
based in New York. BMY relies heavily on patents to maintain market exclusivity, as well as
research and development, and the continued development and commercialization of new
products. BMY started paying a dividend in 1970, and has been consecutively raising its dividend
since 2010, when it last made a cut to the dividend. BMY pays its dividend quarterly.
Twenty-year dividend payout history (annualized)

Dividend.com - 2016 Stock Guide
34
Year Annualized Payout Change
2014 1.45 -17.61%
2013 1.76 +29.41%
2012 1.36 +3.03%
2011 1.32 +37.50%
2010 0.96 -23.20%
2009 1.25 -19.35%
2008 1.55 +38.39%
2007 1.12 --
2006 1.12 --
2005 1.12 +33.33%
2004 0.84 -25.00%
2003 1.12 -20.00%
2002 1.40 -63.92%
2001 3.88 +295.92%
2000 0.98 +13.82%
1999 0.86 +47.18%
1998 0.59 -23.53%
1997 0.77 -18.62%
1996 0.94 +69.37%
1995 0.56 -39.34%
1994 0.92 -88.15%

Dividend.com - 2016 Stock Guide
35
Dividend.com DARS™ Ratings for BMY
Below are Dividend.com's proprietary DARS™ Ratings for BMY as of Dec. 2, 2015. Each value
is based on a scale of 1 to 5.
Relative Strength
3.0
BMY is performing in-line with the market or better.
Overall Yield Attractiveness
3.0
BMY's dividend yield is just average.
Dividend Reliability
4.5
BMY has been paying dividends for 111 years, and we feel its dividend yield is extremely
safe.
Dividend Uptrend
3.5
BMY has shown steady and generous dividends, and has increased its payouts each year.
Earnings Growth
3.0
BMY's earnings estimates are flat.
Read more about the DARS™ Rating System here.
Dividend.com 2016 Forecast for BMY
Potential Catalysts
● Bristol-Myers Squibb is a premier growth stock. Shares are up more than 150% in the
past five years, which is a much stronger performance than the S&P 500 in the same
period.
● There is high optimism over Bristol-Myers Squibb’s drug pipeline, including recently
launched Opdivo and continuing positive trends for Eliquis.
Potential Concerns
● Extremely high valuation. Bristol-Myers Squibb stock trades for 60 times earnings. This
is a massive premium to the broader market.
● Risk of Bristol-Myers Squibb’s drug pipeline under-performing expectations. This carries
significant risk if new drugs do not deliver growth as expected. Revenue was up just 4%
last quarter, which may not deserve such a high P/E.
● The stock has rallied in the past few years, which has significantly lowered its dividend
yield to 2.5% and is below many other stocks in the pharmaceutical peer group.
Dividend.com - 2016 Stock Guide
36
Bottom Line
Bristol-Myers Squibb stock has rewarded investors with huge stock price appreciation in the past
several years. But the stock is not attractive to dividend investors going forward. The stock trades
for a rich valuation and a low dividend yield, and thus does not offer a margin of safety.
Additional Resources for BMY
● Dividend.com Profile Page for BMY
● Full Dividend Payout History for BMY
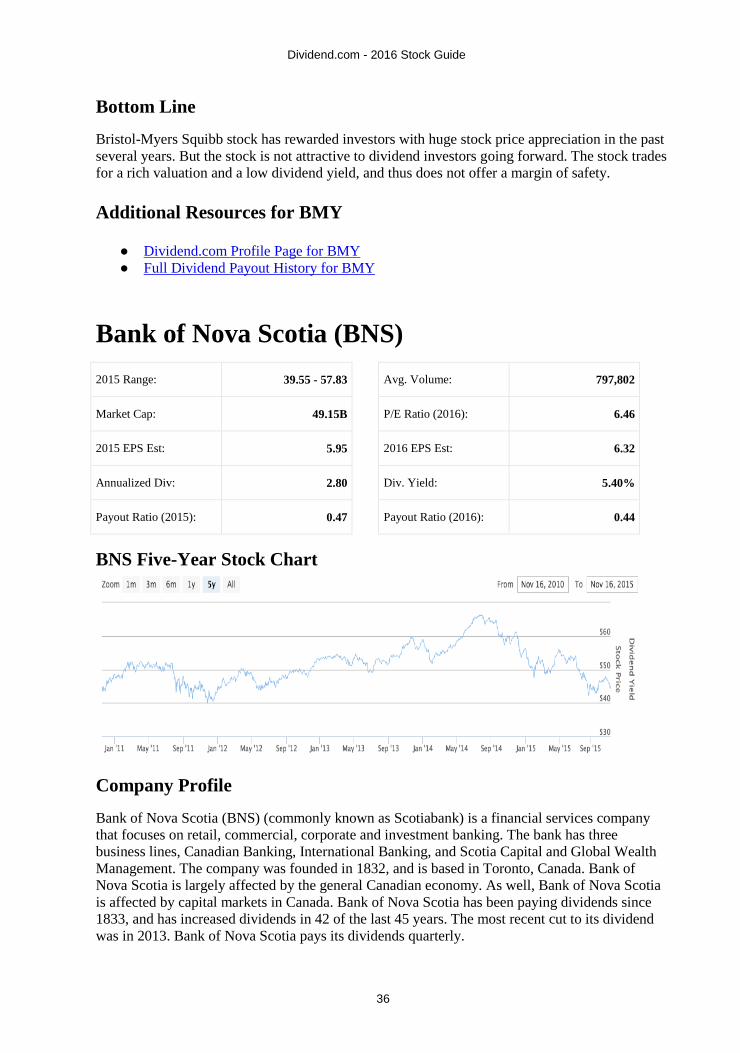
Bank of Nova Scotia (BNS)
2015 Range: 39.55 - 57.83 Avg. Volume: 797,802
Market Cap: 49.15B P/E Ratio (2016): 6.46
2015 EPS Est: 5.95 2016 EPS Est: 6.32
Annualized Div: 2.80 Div. Yield: 5.40%
Payout Ratio (2015): 0.47 Payout Ratio (2016): 0.44
BNS Five-Year Stock Chart
Company Profile
Bank of Nova Scotia (BNS) (commonly known as Scotiabank) is a financial services company
that focuses on retail, commercial, corporate and investment banking. The bank has three
business lines, Canadian Banking, International Banking, and Scotia Capital and Global Wealth
Management. The company was founded in 1832, and is based in Toronto, Canada. Bank of
Nova Scotia is largely affected by the general Canadian economy. As well, Bank of Nova Scotia
is affected by capital markets in Canada. Bank of Nova Scotia has been paying dividends since
1833, and has increased dividends in 42 of the last 45 years. The most recent cut to its dividend
was in 2013. Bank of Nova Scotia pays its dividends quarterly.

Dividend.com - 2016 Stock Guide
37
Twenty-year dividend payout history (annualized)
Year Annualized Payout Change
2014 2.56 +40.66%
2013 1.82 -18.75%
2012 2.24 +7.33%
2011 2.09 -13.19%
2010 2.40 +12.76%
2009 2.13 +50.04%
2008 1.42 -16.71%
2007 1.71 +24.98%
2006 1.37 +8.42%
2005 1.26 -7.43%
2004 1.36 +61.90%
2003 0.84 +127.03%
2002 0.37 -74.48%
Dividend.com - 2016 Stock Guide
38
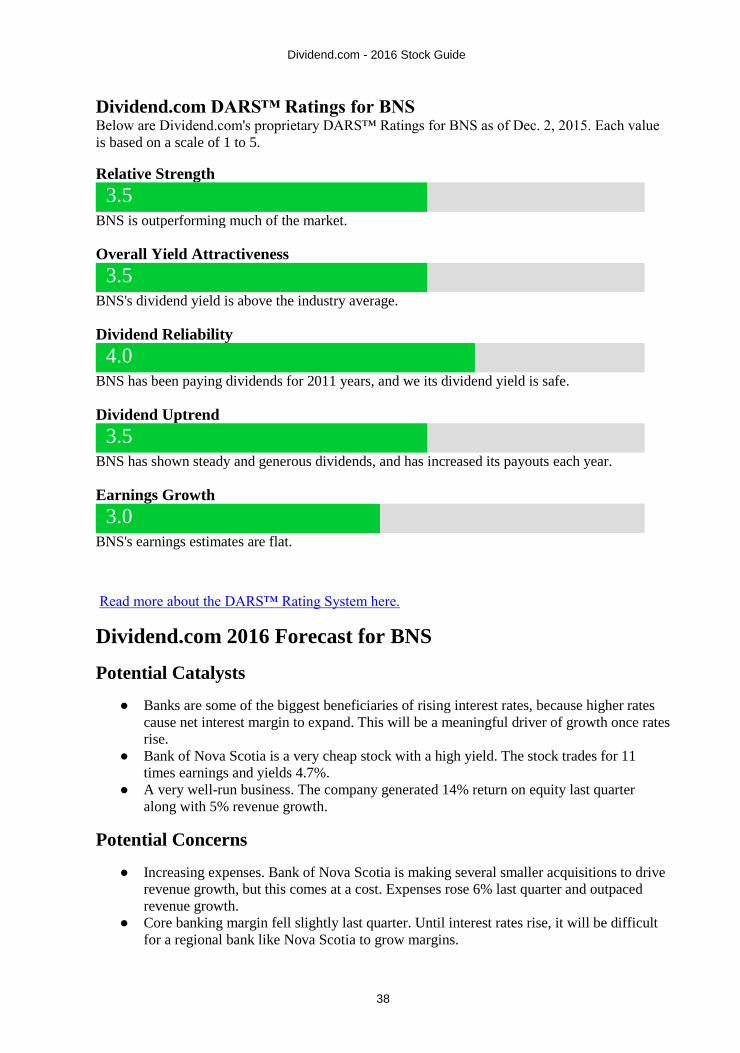
Dividend.com DARS™ Ratings for BNS
Below are Dividend.com's proprietary DARS™ Ratings for BNS as of Dec. 2, 2015. Each value
is based on a scale of 1 to 5.
Relative Strength
3.5
BNS is outperforming much of the market.
Overall Yield Attractiveness
3.5
BNS's dividend yield is above the industry average.
Dividend Reliability
4.0
BNS has been paying dividends for 2011 years, and we its dividend yield is safe.
Dividend Uptrend
3.5
BNS has shown steady and generous dividends, and has increased its payouts each year.
Earnings Growth
3.0
BNS's earnings estimates are flat.
Read more about the DARS™ Rating System here.
Dividend.com 2016 Forecast for BNS
Potential Catalysts
● Banks are some of the biggest beneficiaries of rising interest rates, because higher rates
cause net interest margin to expand. This will be a meaningful driver of growth once rates
rise.
● Bank of Nova Scotia is a very cheap stock with a high yield. The stock trades for 11
times earnings and yields 4.7%.
● A very well-run business. The company generated 14% return on equity last quarter
along with 5% revenue growth.
Potential Concerns
● Increasing expenses. Bank of Nova Scotia is making several smaller acquisitions to drive
revenue growth, but this comes at a cost. Expenses rose 6% last quarter and outpaced
revenue growth.
● Core banking margin fell slightly last quarter. Until interest rates rise, it will be difficult
for a regional bank like Nova Scotia to grow margins.

Dividend.com - 2016 Stock Guide
39
Bottom Line
Bank of Nova Scotia stock screens very well for value and income investors. The stock offers
significant income potential, as well as the potential for future dividend growth. When interest
rates rise, this will boost the company’s profits. Income investors should view this stock
favorably within the financial sector.
Additional Resources for BNS
● Dividend.com Profile Page for BNS
● Full Dividend Payout History for BNS

Dividend.com - 2016 Stock Guide
40
ConAgra Foods Inc. (CAG)
2015 Range: 33.45 - 45.49 Avg. Volume: 3,427,370
Market Cap: 17.11B P/E Ratio (2016): 16.54
2015 EPS Est: 2.23 2016 EPS Est: 2.39
Annualized Div: 1.00 Div. Yield: 2.55%
Payout Ratio (2015): 0.45 Payout Ratio (2016): 0.42
CAG Five-Year Stock Chart
Company Profile
ConAgra Foods, Inc. (CAG) is a packaged foods company. CAG offers several products
including consumer foods, including meals, entrees, condiments, sides, snacks, and desserts
across frozen, refrigerated, and shelf-stable temperature classes to customers through grocery
retailers, restaurants, and foodservice establishments. Its primary brands include Chef Boyardee,
Healthy Choice, Marie Callender's, Orville Redenbacher's, Slim Jim, Hebrew National, Kid
Cuisine, Reddi-Wip, VanCamp, Libby's, LaChoy, The Max, Manwich, Egg Beaters, Blue
Bonnet, Parkay, and many more. ConAgra Foods was founded in 1919 and is headquartered in
Omaha, Nebraska.
Twenty-year dividend payout history (annualized)

Dividend.com - 2016 Stock Guide
41
Year Annualized Payout Change
2014 1.00 --
2013 1.00 +3.09%
2012 0.97 +4.30%
2011 0.93 +12.05%
2010 0.83 +7.79%
2009 0.77 +1.32%
2008 0.76 +4.11%
2007 0.73 -10.21%
2006 0.81 -25.55%
2005 1.09 +3.70%
2004 1.05 +4.88%
2003 1.00 +5.35%
2002 0.95 +7.32%
2001 0.89 +6.09%
2000 0.84 +13.41%
1999 0.74 +13.19%
1998 0.65 +15.19%
1997 0.57 -7.52%
1996 0.61 +42.00%
1995 0.43 +15.24%
1994 0.37 -85.39%
Dividend.com - 2016 Stock Guide
42
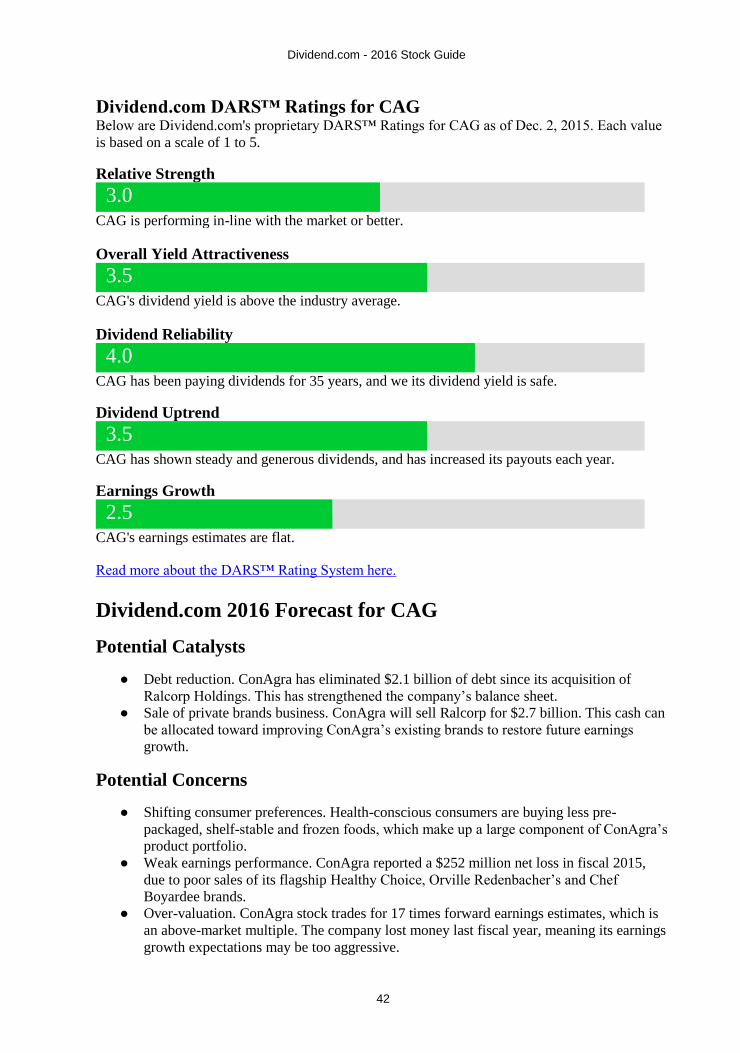
Dividend.com DARS™ Ratings for CAG
Below are Dividend.com's proprietary DARS™ Ratings for CAG as of Dec. 2, 2015. Each value
is based on a scale of 1 to 5.
Relative Strength
3.0
CAG is performing in-line with the market or better.
Overall Yield Attractiveness
3.5
CAG's dividend yield is above the industry average.
Dividend Reliability
4.0
CAG has been paying dividends for 35 years, and we its dividend yield is safe.
Dividend Uptrend
3.5
CAG has shown steady and generous dividends, and has increased its payouts each year.
Earnings Growth
2.5
CAG's earnings estimates are flat.
Read more about the DARS™ Rating System here.
Dividend.com 2016 Forecast for CAG
Potential Catalysts
● Debt reduction. ConAgra has eliminated $2.1 billion of debt since its acquisition of
Ralcorp Holdings. This has strengthened the company’s balance sheet.
● Sale of private brands business. ConAgra will sell Ralcorp for $2.7 billion. This cash can
be allocated toward improving ConAgra’s existing brands to restore future earnings
growth.
Potential Concerns
● Shifting consumer preferences. Health-conscious consumers are buying less pre-
packaged, shelf-stable and frozen foods, which make up a large component of ConAgra’s
product portfolio.
● Weak earnings performance. ConAgra reported a $252 million net loss in fiscal 2015,
due to poor sales of its flagship Healthy Choice, Orville Redenbacher’s and Chef
Boyardee brands.
● Over-valuation. ConAgra stock trades for 17 times forward earnings estimates, which is
an above-market multiple. The company lost money last fiscal year, meaning its earnings
growth expectations may be too aggressive.

Dividend.com - 2016 Stock Guide
43
Bottom Line
ConAgra is in the middle of a lengthy turnaround. The company will sell its private label business
for nearly half the purchase price. This was a very poor decision that cost the company billions of
dollars in losses. Because of this, ConAgra has not raised its dividend since 2012. As a result,
ConAgra cannot be recommended as a dividend growth stock.
Additional Resources for CAG
● Dividend.com Profile Page for CAG
● Full Dividend Payout History for CAG
Caterpillar Inc. (CAT)
2015 Range: 62.99 - 94.66 Avg. Volume: 6,838,460
Market Cap: 38.12B P/E Ratio (2016): 17.94
2015 EPS Est: 4.60 2016 EPS Est: 3.65
Annualized Div: 3.08 Div. Yield: 4.66%
Payout Ratio (2015): 0.67 Payout Ratio (2016): 0.84
CAT Five-Year Stock Chart
Dividend.com - 2016 Stock Guide
44
Company Profile
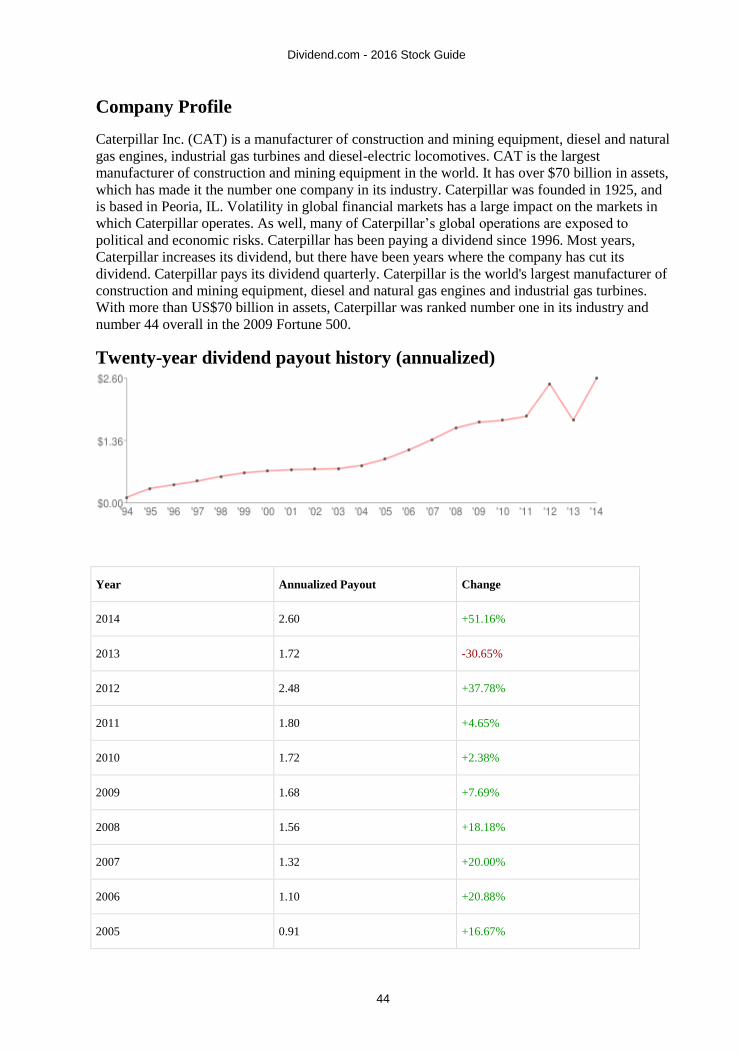
Caterpillar Inc. (CAT) is a manufacturer of construction and mining equipment, diesel and natural
gas engines, industrial gas turbines and diesel-electric locomotives. CAT is the largest
manufacturer of construction and mining equipment in the world. It has over $70 billion in assets,
which has made it the number one company in its industry. Caterpillar was founded in 1925, and
is based in Peoria, IL. Volatility in global financial markets has a large impact on the markets in
which Caterpillar operates. As well, many of Caterpillar’s global operations are exposed to
political and economic risks. Caterpillar has been paying a dividend since 1996. Most years,
Caterpillar increases its dividend, but there have been years where the company has cut its
dividend. Caterpillar pays its dividend quarterly. Caterpillar is the world's largest manufacturer of
construction and mining equipment, diesel and natural gas engines and industrial gas turbines.
With more than US$70 billion in assets, Caterpillar was ranked number one in its industry and
number 44 overall in the 2009 Fortune 500.
Twenty-year dividend payout history (annualized)
Year Annualized Payout Change
2014 2.60 +51.16%
2013 1.72 -30.65%
2012 2.48 +37.78%
2011 1.80 +4.65%
2010 1.72 +2.38%
2009 1.68 +7.69%
2008 1.56 +18.18%
2007 1.32 +20.00%
2006 1.10 +20.88%
2005 0.91 +16.67%
Dividend.com - 2016 Stock Guide
45
2004 0.78 +9.86%
2003 0.71 +1.43%
2002 0.70 +1.45%
2001 0.69 +3.76%
2000 0.67 +6.40%
1999 0.63 +13.64%
1998 0.55 +22.22%
1997 0.45 +20.00%
1996 0.38 +25.00%
1995 0.30 +166.67%
1994 0.11 -88.75%
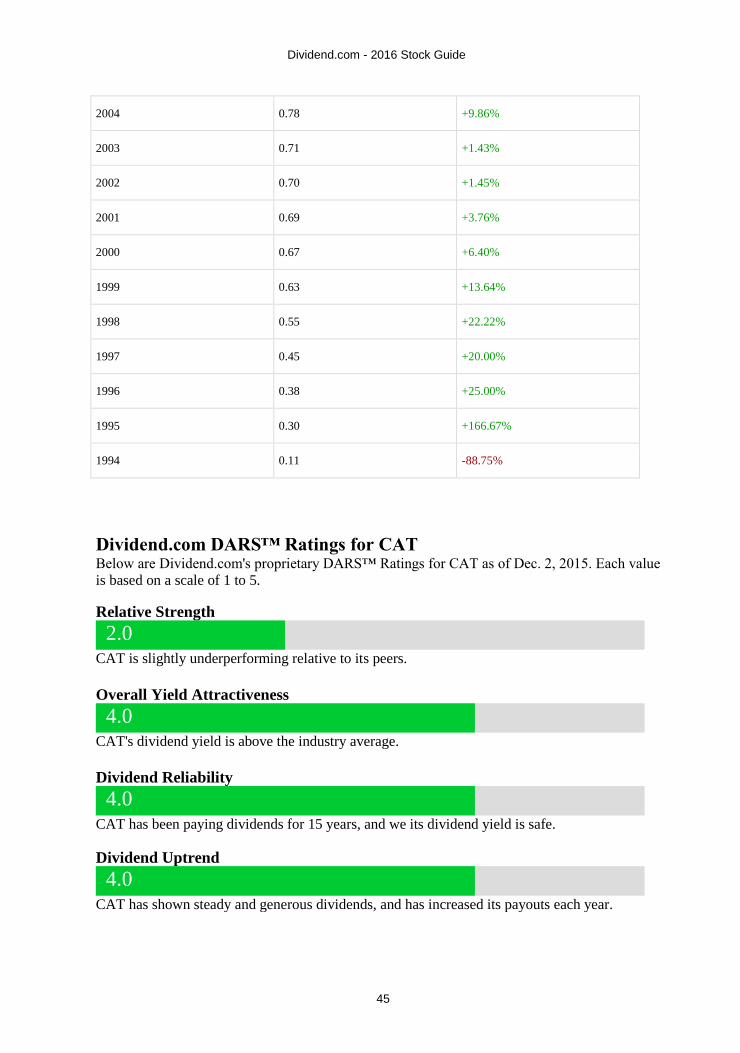
Dividend.com DARS™ Ratings for CAT Below are Dividend.com's proprietary DARS™ Ratings for CAT as of Dec. 2, 2015. Each value
is based on a scale of 1 to 5.
Relative Strength
2.0
CAT is slightly underperforming relative to its peers.
Overall Yield Attractiveness
4.0
CAT's dividend yield is above the industry average.
Dividend Reliability
4.0
CAT has been paying dividends for 15 years, and we its dividend yield is safe.
Dividend Uptrend
4.0
CAT has shown steady and generous dividends, and has increased its payouts each year.

Dividend.com - 2016 Stock Guide
46
Earnings Growth
2.0
CAT has seen its earnings estimates slightly lowered.
Read more about the DARS™ Rating System here.
Dividend.com 2016 Forecast for CAT
Potential Catalysts
● Attractive valuation. Caterpillar stock trades for 14 times earnings, a significant discount
to the broader market multiple.
● Compelling 4.3% dividend yield and dividend growth. The company generates enough
cash flow to continue paying its high dividend, and increased its dividend by 10%.
● Continued recoveries in the U.S. housing and construction markets are a positive for
Caterpillar.
Potential Concerns
● The slowdown in precious metals prices like gold and copper over the past year has
caused significant damage to the mining industry, which Caterpillar’s machinery caters
to.
● 2016 earnings estimated to be down 31% from peak 2012 levels. Most of this,
approximately 2/3, is due to declines in natural resource industry.
● Caterpillar is also heavily exposed to the strong U.S. dollar. Of the 31% decline in 2016
earnings versus 2012 levels, 10% of the decline is due to negative foreign exchange
effects.
Bottom Line
As the precious metals and natural resources industries contract, Caterpillar is experiencing
falling sales and earnings. Revenue fell 18% last quarter. In response, the company is
aggressively cutting costs, which is keeping profitability intact. This at least supports current
dividend, which is very high.
Additional Resources for CAT
● Dividend.com Profile Page for CAT
● Full Dividend Payout History for CAT

Dividend.com - 2016 Stock Guide
47
Colgate-Palmolive Company (CL)
2015 Range: 50.84 - 71.56 Avg. Volume: 3,573,440
Market Cap: 59.81B P/E Ratio (2016): 22.45
2015 EPS Est: 2.79 2016 EPS Est: 2.97
Annualized Div: 1.52 Div. Yield: 2.31%
Payout Ratio (2015): 0.54 Payout Ratio (2016): 0.51
CL Five-Year Stock Chart
Company Profile
Colgate Palmolive (CL) is a consumer products company that specializes in household,
healthcare, and personal products. The company operates in two segments: Oral, Personal and
Home Care and Pet Nutrition. CL offers hundreds of products, and operates in over 200 countries
throughout the world. The company was founded in 1806, and is based in New York, NY.
Colgate is affected by its ability to research and develop new products, as well as raw material
costs. Colgate has been increasing dividends since 1964. The company is known as a dividend
aristocrat, as it has been increasing its dividend consecutively annually for more than 25 years.
Colgate pays its dividend quarterly.
Twenty-year dividend payout history (annualized)

Dividend.com - 2016 Stock Guide
48
Year Annualized Payout Change
2014 1.42 -28.28%
2013 1.98 -18.85%
2012 2.44 +7.49%
2011 2.27 +11.82%
2010 2.03 +18.02%
2009 1.72 +10.26%
2008 1.56 +11.43%
2007 1.40 +12.00%
2006 1.25 +12.61%
2005 1.11 +15.63%
2004 0.96 +6.67%
2003 0.90 +25.00%
2002 0.72 +6.51%
2001 0.68 +6.96%
2000 0.63 +6.94%
1999 0.59 +7.45%
1998 0.55 +3.77%
1997 0.53 +12.77%
1996 0.47 +6.82%
1995 0.44 +14.29%
1994
0.39 -85.19%

Dividend.com - 2016 Stock Guide
49
Dividend.com DARS™ Ratings for CL
Below are Dividend.com's proprietary DARS™ Ratings for CL as of Dec. 2, 2015. Each value is
based on a scale of 1 to 5.
Relative Strength
3.0
CL is performing in-line with the market or better.
Overall Yield Attractiveness
3.0
CL's dividend yield is just average.
Dividend Reliability
4.5
CL has been paying dividends for 25 years, and we feel its dividend yield is extremely safe.
Dividend Uptrend
3.5
CL has shown steady and generous dividends, and has increased its payouts each year.
Earnings Growth
3.0
CL's earnings estimates are flat.
Read more about the DARS™ Rating System here.
Dividend.com 2016 Forecast for CL
Potential Catalysts
● Excellent brand strength. Colgate-Palmolive has a number of successful brands, including
its Colgate toothpaste, Palmolive soap and its pet care business.
● Colgate is a top dividend growth stock. It is a Dividend Aristocrat, having paid
uninterrupted dividends each year since 1895.
● Colgate-Palmolive generates significant free cash flow, which is returned to shareholders
through both dividends and buybacks. The dividend yields 2.4% and the company
recently announced a new $5 billion share buyback program.
Potential Concerns
● Slowing economic growth in the emerging markets. Colgate-Palmolive generates 80% of
its total revenue from outside North America; weak economic growth in the
underdeveloped nations could be a significant future headwind.
● The rising U.S. dollar. Colgate-Palmolive is heavily exposed to foreign exchange
fluctuations. Revenue growth was negatively impacted by 13 percentage points last
quarter just because of currency.

Dividend.com - 2016 Stock Guide
50
● Over-valuation. Colgate-Palmolive stock trades for 25 times earnings, approximately
31% above the S&P 500 Index valuation. Slowing growth could result in compression of
Colgate-Palmolive’s valuation multiple.
Bottom Line
Colgate-Palmolive is experiencing near-term challenges from currency impacts, but it remains a
strong business with top brands. According to the company, Colgate-Palmolive stock delivered a
1,137% total return in the 20-year period from Dec. 31, 1994 through June 30, 2015. This handily
beat the 563% total return for the S&P 500 index in the same period.
Additional Resources for CL
● Dividend.com Profile Page for CL
● Full Dividend Payout History for CL
ConocoPhillips (COP)
2015 Range: 41.10 - 71.37 Avg. Volume: 8,561,520
Market Cap: 62.72B P/E Ratio (2016): 137.3
2015 EPS Est: -0.80 2016 EPS Est: 0.37
Annualized Div: 2.96 Div. Yield: 5.98%
Payout Ratio (2015): -3.7 Payout Ratio (2016): 8
COP Five-Year Stock Chart
Dividend.com - 2016 Stock Guide
51
Company Profile
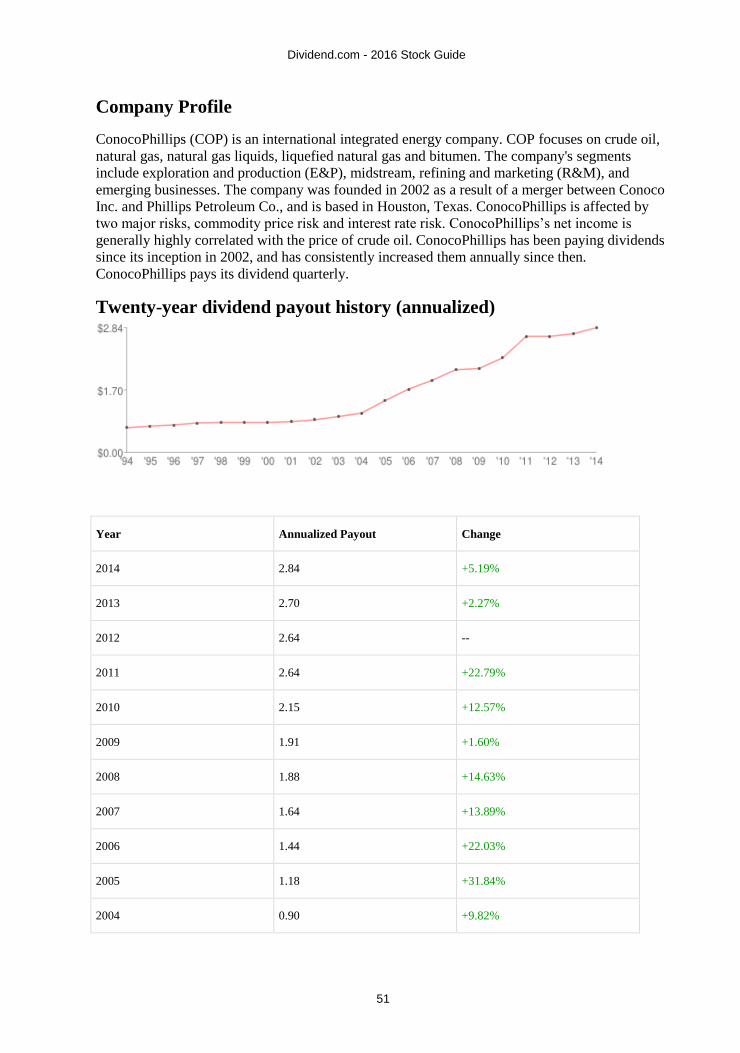
ConocoPhillips (COP) is an international integrated energy company. COP focuses on crude oil,
natural gas, natural gas liquids, liquefied natural gas and bitumen. The company's segments
include exploration and production (E&P), midstream, refining and marketing (R&M), and
emerging businesses. The company was founded in 2002 as a result of a merger between Conoco
Inc. and Phillips Petroleum Co., and is based in Houston, Texas. ConocoPhillips is affected by
two major risks, commodity price risk and interest rate risk. ConocoPhillips’s net income is
generally highly correlated with the price of crude oil. ConocoPhillips has been paying dividends
since its inception in 2002, and has consistently increased them annually since then.
ConocoPhillips pays its dividend quarterly.
Twenty-year dividend payout history (annualized)
Year Annualized Payout Change
2014 2.84 +5.19%
2013 2.70 +2.27%
2012 2.64 --
2011 2.64 +22.79%
2010 2.15 +12.57%
2009 1.91 +1.60%
2008 1.88 +14.63%
2007 1.64 +13.89%
2006 1.44 +22.03%
2005 1.18 +31.84%
2004 0.90 +9.82%

Dividend.com - 2016 Stock Guide
52
2003 0.82 +10.14%
2002 0.74 +5.71%
2001 0.70 +2.94%
2000 0.68 --
1999 0.68 --
1998 0.68 +1.49%
1997 0.67 +7.20%
1996 0.63 +4.60%
1995 0.60 +6.70%
1994 0.56 -60.56%
Dividend.com DARS™ Ratings for COP
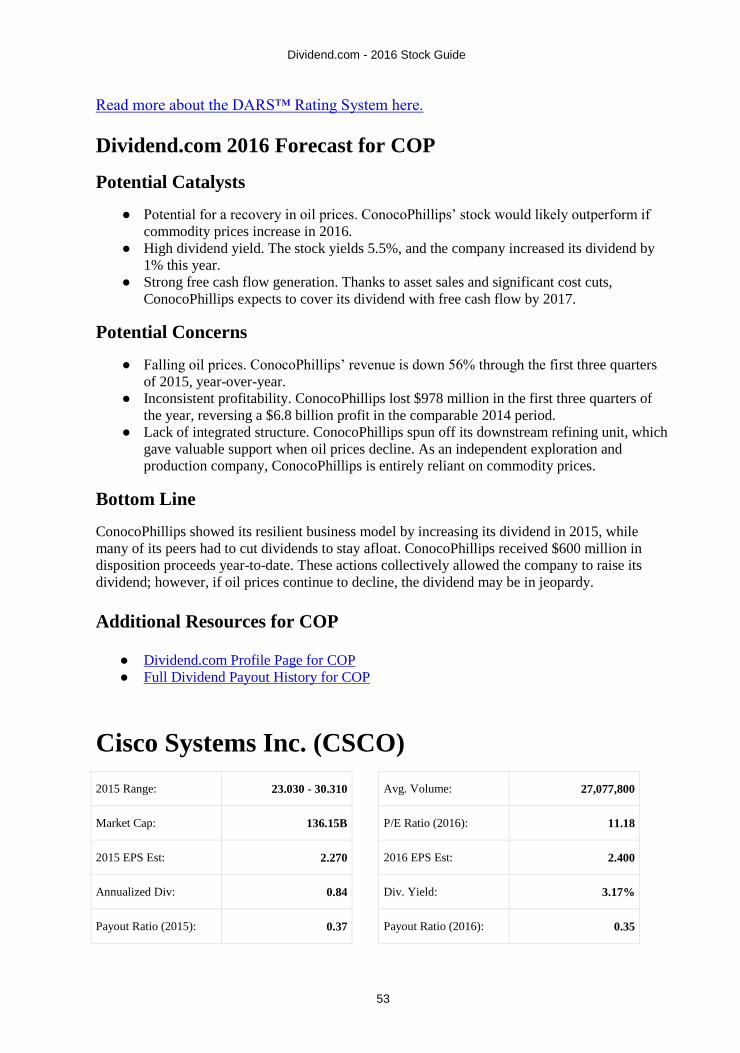
Below are Dividend.com's proprietary DARS™ Ratings for COP as of Dec. 2, 2015. Each value
is based on a scale of 1 to 5.
Relative Strength
2.0
COP is slightly underperforming relative to its peers.
Overall Yield Attractiveness
4.0
COP's dividend yield is above the industry average.
Dividend Reliability
4.5
COP has been paying dividends for 77 years, and we feel its dividend yield is extremely safe.
Dividend Uptrend
3.5
COP has shown steady and generous dividends, and has increased its payouts each year.
Earnings Growth
3.0
COP's earnings estimates are flat.
Dividend.com - 2016 Stock Guide
53
Read more about the DARS™ Rating System here.
Dividend.com 2016 Forecast for COP
Potential Catalysts
● Potential for a recovery in oil prices. ConocoPhillips’ stock would likely outperform if
commodity prices increase in 2016.
● High dividend yield. The stock yields 5.5%, and the company increased its dividend by
1% this year.
● Strong free cash flow generation. Thanks to asset sales and significant cost cuts,
ConocoPhillips expects to cover its dividend with free cash flow by 2017.
Potential Concerns
● Falling oil prices. ConocoPhillips’ revenue is down 56% through the first three quarters
of 2015, year-over-year.
● Inconsistent profitability. ConocoPhillips lost $978 million in the first three quarters of
the year, reversing a $6.8 billion profit in the comparable 2014 period.
● Lack of integrated structure. ConocoPhillips spun off its downstream refining unit, which
gave valuable support when oil prices decline. As an independent exploration and
production company, ConocoPhillips is entirely reliant on commodity prices.
Bottom Line
ConocoPhillips showed its resilient business model by increasing its dividend in 2015, while
many of its peers had to cut dividends to stay afloat. ConocoPhillips received $600 million in
disposition proceeds year-to-date. These actions collectively allowed the company to raise its
dividend; however, if oil prices continue to decline, the dividend may be in jeopardy.
Additional Resources for COP
● Dividend.com Profile Page for COP
● Full Dividend Payout History for COP
Cisco Systems Inc. (CSCO)
2015 Range: 23.030 - 30.310 Avg. Volume: 27,077,800
Market Cap: 136.15B P/E Ratio (2016): 11.18
2015 EPS Est: 2.270 2016 EPS Est: 2.400
Annualized Div: 0.84 Div. Yield: 3.17%
Payout Ratio (2015): 0.37 Payout Ratio (2016): 0.35

Dividend.com - 2016 Stock Guide
54
CSCO Five-Year Stock Chart
Company Profile
Cisco Systems (CSCO) is a technology company that designs, manufactures, and sells networking
equipment. The company focuses on three main segments which include Enterprise and Service
Provider, Small Business and the Home. The stock was added to the Dow Jones in 2009, and is
also included in the S&P 500 Index, the Russell 1000 Index, NASDAQ 100 Index and the Russell
1000 Growth Stock Index. CSCO was founded in 1984, and is based in San Jose, CA.
Twenty-year dividend payout history (annualized)
Year Annualized Payout Change
2014 0.74 +45.10%
2013 0.51 +2.00%
2012 0.50 +177.78%
2011 0.18 -93.66%
Dividend.com - 2016 Stock Guide
55
Dividend.com DARS™ Ratings for CSCO
Below are Dividend.com's proprietary DARS™ Ratings for CSCO as of Dec. 2, 2015. Each value
is based on a scale of 1 to 5.
Relative Strength
3.5
CSCO is outperforming much of the market.
Overall Yield Attractiveness
3.5
CSCO's dividend yield is above the industry average.
Dividend Reliability
3.5
CSCO has been paying dividends for 2011 years, and we its dividend yield is safe.
Dividend Uptrend
3.0
CSCO has shown consistency in its payouts, but any increases have been small.
Earnings Growth
3.5
CSCO's earnings estimates have been raised nicely.
Read more about the DARS™ Rating System here.
Dividend.com 2016 Forecast for CSCO
Potential Catalysts
● Excellent balance sheet. Cisco holds $59 billion in cash and short-term investments, and
$21 billion in long-term debt.
● Attractive valuation. Cisco stock trades for 14 times earnings, a significant discount from
the market multiple.
● High dividend yield and dividend growth. Cisco stock yields 3.2% and raised its dividend
by 10% earlier this year.
Potential Concerns
● Exposure to emerging markets like China, where economic growth is slowing, could
weigh on Cisco’s growth.
● The strengthening U.S. dollar is a headwind for large multi-national companies such as
Cisco.

Dividend.com - 2016 Stock Guide
56
Bottom Line
Cisco is a quality company. Revenue grew 3% last quarter. It is highly profitable – with a great
deal of cash on the balance sheet – and an excellent dividend. The company has seen growth
slow-down in the near term due to the rising U.S. dollar and economic challenges in the emerging
markets, but these are likely to be short-term challenges. The long-term investment case remains
positive.
Additional Resources for CSCO
● Dividend.com Profile Page for CSCO
● Full Dividend Payout History for CSCO
Chevron Corporation (CVX)
2015 Range: 69.580 - 114.450 Avg. Volume: 10,389,400
Market Cap: 172.85B P/E Ratio (2016): 22.96
2015 EPS Est: 3.320 2016 EPS Est: 4.000
Annualized Div: 4.28 Div. Yield: 4.79%
Payout Ratio (2015): 1.29 Payout Ratio (2016): 1.07
CVX Five-Year Stock Chart

Dividend.com - 2016 Stock Guide
57
Company Profile
Chevron Corporation (CVX) is a Fortune 500 multinational energy corporation based out of San
Ramon, California. Founded in 1984, it is involved in every aspect of energy production and
services, including petroleum operations, chemicals operations, mining operations, power
generation and energy services. The company has a focus in developing and producing crude oil
and natural gas. CVX is constantly named among the largest corporations in the world in terms of
revenue. Chevron is one of the world's six supermajor oil companies. Chevron's profitability is
mainly affected by the price of crude oil. The company's operations, especially upstream, can also
be affected by changing economic, regulatory, and political environments around the world.
Chevron has been increasing its dividend consistently since 1993, when the company first started
paying dividends.
Twenty-year dividend payout history (annualized)
Year Annualized Payout Change
2014 4.21 +7.95%
2013 3.90 +11.11%
2012 3.51 +13.59%
2011 3.09 +8.80%
2010 2.84 +6.77%
2009 2.66 +5.14%
2008 2.53 +11.95%
2007 2.26 +12.44%
2006 2.01 +14.86%
2005 1.75 +14.38%
2004 1.53 +6.99%

Dividend.com - 2016 Stock Guide
58
2003 1.43 +2.14%
2002 1.40 +5.66%
2001 1.33 +1.92%
2000 1.30 +4.84%
1999 1.24 +1.64%
1998 1.22 +7.02%
1997 1.14 +9.62%
1996 1.04 +8.11%
1995 0.96 +4.06%
1994 0.92 +24.93%
Dividend.com DARS™ Ratings for CVX
Below are Dividend.com's proprietary DARS™ Ratings for CVX as of Dec. 2, 2015. Each value
is based on a scale of 1 to 5.
Relative Strength
3.0
CVX is performing in-line with the market or better.
Overall Yield Attractiveness
3.5
CVX's dividend yield is above the industry average.
Dividend Reliability
4.5
CVX has been paying dividends for 99 years, and we feel its dividend yield is extremely
safe.
Dividend Uptrend
3.5
CVX has shown steady and generous dividends, and has increased its payouts each year.
Earnings Growth
3.0
CVX's earnings estimates are flat.

Dividend.com - 2016 Stock Guide
59
Read more about the DARS™ Rating System here.
Dividend.com 2016 Forecast for CVX
Potential Catalysts
● Any recovery in oil and gas prices would be a huge catalyst for Chevron, one of the
world’s biggest energy companies.
● Cost cuts and asset sales support earnings. Chevron has realized $5.4 billion of asset sales
year-to-date, and cut capital expenditures by 14% year-to-date.
● Chevron’s integrated structure provides valuable protection. Chevron’s large refining
business grew profits by 59% last quarter. Refining earnings tend to grow when oil prices
decline, as that causes feedstock costs to fall, which boosts refining margins.
Potential Concerns
● A continued deterioration in commodity prices could threaten Chevron’s dividend. Many
energy stocks have had to cut dividends this year due to falling oil and gas prices.
Chevron’s earnings are down 67% through the first three quarters of 2015.
● Chevron continues to increase production. Over the first nine months, net oil-equivalent
production is up 1.4%, year-over-year. This is problematic as higher production is
uneconomical at such low energy prices.
Bottom Line
Chevron is one of the highest dividend yields in the Dow Jones Industrial Average. This is due to
its collapsing stock price, as earnings are significantly lower this year than in previous years.
Chevron’s earnings, and its dividend, are highly dependent on a recovery in energy prices. As a
result, while Chevron’s 4.6% dividend is attractive, it is a risky dividend stock.
Additional Resources for CVX
● Dividend.com Profile Page for CVX
● Full Dividend Payout History for CVX
Dominion Resources Inc. (D)
2015 Range: 64.54 - 80.89 Avg. Volume: 2,339,960
Market Cap: 39.45B P/E Ratio (2016): 17.21
2015 EPS Est: 3.65 2016 EPS Est: 3.85
Annualized Div: 2.59 Div. Yield: 3.96%
Payout Ratio (2015): 0.71 Payout Ratio (2016): 0.67
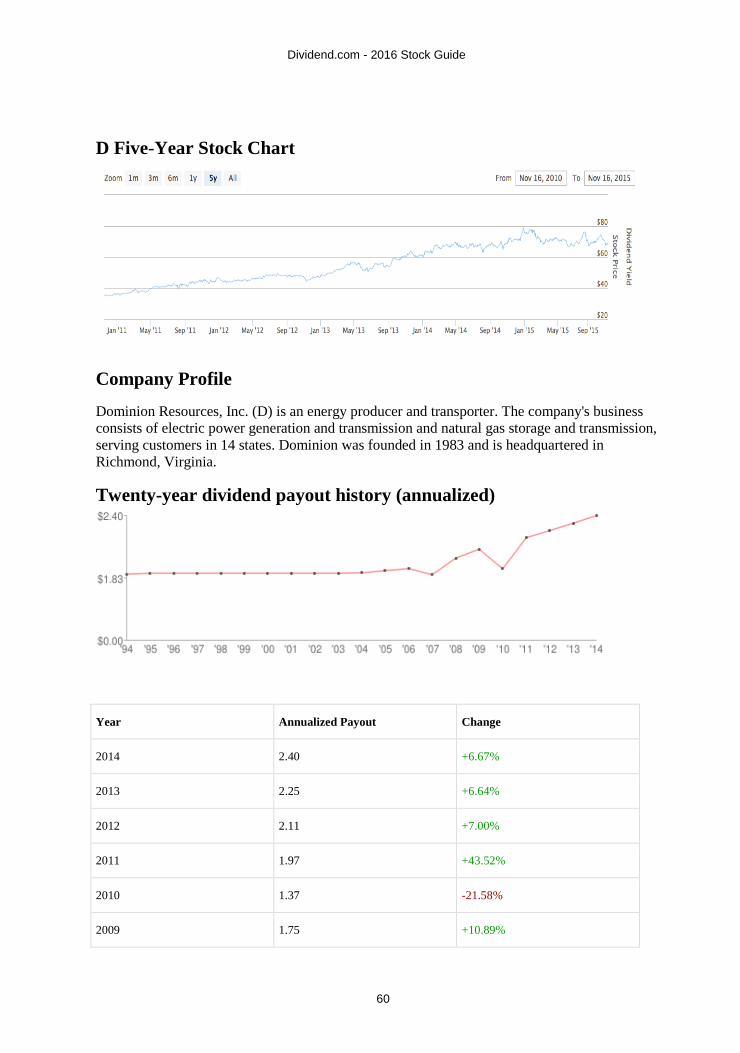
Dividend.com - 2016 Stock Guide
60
D Five-Year Stock Chart
Company Profile
Dominion Resources, Inc. (D) is an energy producer and transporter. The company's business
consists of electric power generation and transmission and natural gas storage and transmission,
serving customers in 14 states. Dominion was founded in 1983 and is headquartered in
Richmond, Virginia.
Twenty-year dividend payout history (annualized)
Year Annualized Payout Change
2014 2.40 +6.67%
2013 2.25 +6.64%
2012 2.11 +7.00%
2011 1.97 +43.52%
2010 1.37 -21.58%
2009 1.75 +10.89%

Dividend.com - 2016 Stock Guide
61
2008 1.58 +25.10%
2007 1.26 -8.48%
2006 1.38 +2.99%
2005 1.34 +3.08%
2004 1.30 +0.78%
2003 1.29 --
2002 1.29 --
2001 1.29 --
2000 1.29 --
1999 1.29 --
1998 1.29 --
1997 1.29 --
1996 1.29 --
1995 1.29 +1.18%
1994 1.28 -69.71%
Dividend.com DARS™ Ratings for D
Below are Dividend.com's proprietary DARS™ Ratings for D as of Dec. 2, 2015. Each value is
based on a scale of 1 to 5.
Relative Strength
3.5
D is outperforming much of the market.
Overall Yield Attractiveness
3.5
D's dividend yield is above the industry average.
Dividend Reliability
4.0
D has been paying dividends for 86 years, and we its dividend yield is safe.

Dividend.com - 2016 Stock Guide
62
Dividend Uptrend
3.5
D has shown steady and generous dividends, and has increased its payouts each year.
Earnings Growth
3.0
D's earnings estimates are flat.
Read more about the DARS™ Rating System here.
Dividend.com 2016 Forecast for D
Potential Catalysts
● High dividend yield. The stock yields 3.8%, which is a 90% greater yield than the
average S&P 500 stock.
● Highly recession-resistant business model. Consumers always need to keep the lights on,
even if the economy goes into recession.
● Modest gains in customers and average bills resulted in 10% earnings growth last quarter.
Continued gains in these areas should fuel future earnings growth.
Potential Concerns
● Exposure to rising interest rates is a headwind on future earnings growth.
● Low earnings growth will result in low dividend growth as well.
Bottom Line
Dominion Resources, as a utility, generates steady profitability from year to year. Its product,
electricity, is virtually a matter of national security. That places a great margin of safety
underneath the stock. For risk-averse income investors, Dominion can be a valuable addition to a
dividend portfolio.
Additional Resources for D
● Dividend.com Profile Page for D
● Full Dividend Payout History for D

Dividend.com - 2016 Stock Guide
63
DuPont & Company (DD)
2015 Range: 47.11 - 76.59 Avg. Volume: 7,015,560
Market Cap: 59.27B P/E Ratio (2016): 20.75
2015 EPS Est: 2.78 2016 EPS Est: 3.26
Annualized Div: 1.52 Div. Yield: 2.24%
Payout Ratio (2015): 0.55 Payout Ratio (2016): 0.47
DD Five-Year Stock Chart
Company Profile
E. I. du Pont de Nemours and Company (DD), commonly known as DuPont, is a diversified
chemicals company. The company operates in six segments: Agriculture & Nutrition, Coatings &
Color Technologies, Electronic & Communication Technologies, Performance Materials, Safety
& Protection, and Pharmaceuticals. DuPont, which has operations in 75 countries, was founded in
1802 and is headquartered in Wilmington, Delaware. DuPont operates in many industries and
sectors in which there is a high level of regulation, particularly for the environment. DuPont has
paid dividends since 1904, and has been increasing them annually since 2012. While the
dividends have not been raised some years, DuPont has never cut a dividend in the last 20 years.
DuPont pays its dividends quarterly.

Dividend.com - 2016 Stock Guide
64
Twenty-year dividend payout history (annualized)
Year Annualized Payout Change
2014 1.84 +3.37%
2013 1.78 +4.71%
2012 1.70 +3.66%
2011 1.64 --
2010 1.64 --
2009 1.64 --
2008 1.64 +7.89%
2007 1.52 +2.70%
2006 1.48 +1.37%
2005 1.46 +4.29%
2004 1.40 --
2003 1.40 --
2002 1.40 --
2001 1.40 --
2000 1.40 --
1999 1.40 +2.56%
1998 1.37 +10.98%

Dividend.com - 2016 Stock Guide
65
1997 1.23 +10.31%
1996 1.12 +9.85%
1995 1.02 +11.54%
1994 0.91 -62.08%
Dividend.com DARS™ Ratings for DD
Below are Dividend.com's proprietary DARS™ Ratings for DD as of Dec. 2, 2015. Each value is
based on a scale of 1 to 5.
Relative Strength
3.0
DD is performing in-line with the market or better.
Overall Yield Attractiveness
3.5
DD's dividend yield is above the industry average.
Dividend Reliability
4.0
DD has been paying dividends for 107 years, and we its dividend yield is safe.
Dividend Uptrend
3.5
DD has shown steady and generous dividends, and has increased its payouts each year.
Earnings Growth
2.5
DD's earnings estimates are flat.
Read more about the DARS™ Rating System here.
Dividend.com 2016 Forecast for DD
Potential Catalysts
● New management team may take the company in a better direction—CEO Edward D.
Breen replaces outgoing CEO Ellen Kullman.
● Strategic imperative to focus on agriculture positions the company well to benefit from
increased global demand for food.
● Activist investor Nelson Peltz urged DuPont to pursue a break-up. Further investor
activism could persuade management to pursue a spin-off, or a different value-creating
initiative.

Dividend.com - 2016 Stock Guide
66
Potential Concerns
● DuPont stock trades for 21 times earnings, a 10% premium to the market valuation.
Valuation does not provide a compelling margin of safety.
● Operating earnings declined 66% last quarter. The company’s turnaround is taking longer
than anticipated.
Bottom Line
DuPont is a company in transition. It is aggressively selling assets that it does not deem necessary
to the future, in order to reinvest in its agriculture and science divisions. Earnings are falling, but
the company generates enough cash flow to sustain its 2.5% dividend. Future dividend growth
will necessitate recovery in earnings. The company does expect full-year operating earnings to
increase 3%, which will help fuel dividend growth going forward.
Additional Resources for DD
● Dividend.com Profile Page for DD
● Full Dividend Payout History for DD
Diageo plc (DEO)
2015 Range: 100.59 - 122.51 Avg. Volume: 441,203
Market Cap: 68.67B P/E Ratio (2016): 22.55
2015 EPS Est: 4.42 2016 EPS Est: 4.86
Annualized Div: 3.41 Div. Yield: 3.96%
Payout Ratio (2015): 0.77 Payout Ratio (2016): 0.7
DEO Five-Year Stock Chart

Dividend.com - 2016 Stock Guide
67
Company Profile
Diageo PLC (DEO) is the world's largest producer of spirits and a major producer of beer and
wine. The company engages in the production, distillation, brewing, bottling, packaging,
distribution, development, and marketing of beer, wine, and other alcoholic beverages worldwide.
Some of its key brands include Smirnoff vodka, Johnnie Walker Scotch whiskey, Captain
Morgan rum, Baileys Original Irish Cream liqueur, Tanqueray gin, and Guinness stout beer.
Diageo was founded in 1886 and is based in London, England. Diageo is largely affected by
changing consumer tastes, as well as global regulation on alcohol use. Diageo has been paying
dividends since 1998, and has increased them annually since 2010. Diageo pays dividends semi-
annually.
Twenty-year dividend payout history (annualized)
Year Annualized Payout Change
2014 3.46 +18.39%
2013 2.92 +5.83%
2012 2.76 +5.02%
2011 2.63 +10.38%
2010 2.38 +6.39%
2009 2.24 -13.56%
2008 2.59 -0.65%
2007 2.61 +13.81%
2006 2.29 +3.90%
2005 2.20 +9.06%
2004 2.02 +19.24%

Dividend.com - 2016 Stock Guide
68
2003 1.69 +5.88%
2002 1.60 +10.73%
2001 1.45 +3.21%
2000 1.40 +0.36%
1999 1.40 -11.09%
1998 1.57 -14.73%
Dividend.com DARS™ Ratings for DEO
Below are Dividend.com's proprietary DARS™ Ratings for DEO as of Dec. 2, 2015. Each value
is based on a scale of 1 to 5.
Relative Strength
2.0
DEO is slightly underperforming relative to its peers.
Overall Yield Attractiveness
3.5
DEO's dividend yield is above the industry average.
Dividend Reliability
4.5
DEO has been paying dividends for 13 years, and we feel its dividend yield is extremely safe.
Dividend Uptrend
3.5
DEO has shown steady and generous dividends, and has increased its payouts each year.
Earnings Growth
3.0
DEO's earnings estimates are flat.
Read more about the DARS™ Rating System here.

Dividend.com - 2016 Stock Guide
69
Dividend.com 2016 Forecast for DEO
Potential Catalysts
● A huge portfolio of strong brands. Diageo's portfolio includes Johnnie Walker, Crown
Royal, Guinness, Smirnoff, Captain Morgan and Ketel One.
● Strong dividend stock. Diageo yields 3.7%—significantly higher than the overall market
as well as its consumer staples peer group. And, management recently raised the dividend
9%.
● The strengthening U.S. dollar is a tailwind for international companies that conduct
significant revenue from North America. Diageo generated 45% of fiscal 2015 revenue
from North America.
Potential Concerns
● Exposure to the Euro zone. Europe represented 25% of Diageo’s revenue in 2015;
slowing economic growth in the Euro zone is a challenge.
● Low penetration in the emerging markets. Management should make emerging market
growth a bigger priority. Asia-Pacific represented just 11% of total revenue in 2015.
Bottom Line
Diageo is a conglomerate in the industry, with a large portfolio of successful brands. This
generates significant cash flow to the company, which is then returned to shareholders through
regular dividend increases. Near-term headwinds present a challenge but the future is bright
thanks to growth potential in new markets.
Additional Resources for DEO
● Dividend.com Profile Page for DEO
● Full Dividend Payout History for DEO
Walt Disney Company (DIS)
2015 Range: 90.00 - 122.08 Avg. Volume: 8,516,190
Market Cap: 185.87B P/E Ratio (2016): 18.08
2015 EPS Est: 5.67 2016 EPS Est: 6.22
Annualized Div: 1.37 Div. Yield: 1.30%
Payout Ratio (2015): 0.24 Payout Ratio (2016): 0.22

Dividend.com - 2016 Stock Guide
70
DIS Five-Year Stock Chart
Company Profile
Walt Disney- (DIS)-operates as a diversified entertainment company worldwide. Its Media
Networks segment comprises a domestic broadcast television network, television production and
distribution operations, domestic television stations, cable/satellite networks, domestic broadcast
radio networks and stations, and the Internet and mobile operations. The company's Parks and
Resorts segment owns and operates the Walt Disney World Resort in Florida that includes theme
parks; hotels; vacation ownership units; a retail, dining, and entertainment complex; a sports
complex; conference centers; campgrounds; golf courses; and water parks. This segment also
owns and operates Disneyland Resort in California, Disney Vacation Club, Disney Cruise Line,
and ESPN Zone facilities; manages Disneyland Resort Paris and Hong Kong Disneyland Resort;
licenses the operations of the Tokyo Disney Resort in Japan; and designs and develops new
theme park concepts, attractions, and resort properties. The company was founded in 1923 and is
based in Burbank, California.
Twenty-year dividend payout history (annualized)

Dividend.com - 2016 Stock Guide
71
Year Annualized Payout Change
2014 1.15 +33.72%
2013 0.86 +14.67%
2012 0.75 +25.00%
2011 0.60 +50.00%
2010 0.40 +14.29%
2009 0.35 --
2008 0.35 --
2007 0.35 +12.90%
2006 0.31 +14.81%
2005 0.27 +12.50%
2004 0.24 +14.29%
2003 0.21 --
2002 0.21 --
2001 0.21 --
2000 0.21 -20.15%
1999 0.26 +31.06%
1998 0.20 +18.97%
1997 0.17 +53.32%
1996 0.11 -24.13%
1995 0.15 +51.56%
1994 0.10 -97.23%

Dividend.com - 2016 Stock Guide
72
Dividend.com DARS™ Ratings for DIS
Below are Dividend.com's proprietary DARS™ Ratings for DIS as of Dec. 2, 2015. Each value is
based on a scale of 1 to 5.
Relative Strength
4.0
DIS is outperforming much of the market.
Overall Yield Attractiveness
2.5
DIS's dividend yield is just average.
Dividend Reliability
4.0
DIS has been paying dividends for 49 years, and we its dividend yield is safe.
Dividend Uptrend
3.0
DIS has shown consistency in its payouts, but any increases have been small.
Earnings Growth
3.5
DIS's earnings estimates have been raised nicely.
Read more about the DARS™ Rating System here.
Dividend.com 2016 Forecast for DIS
Potential Catalysts
● Excellent brand recognition. Disney is one of the world’s most valuable brands and
operates highly profitable businesses including media networks, parks and resorts, a
movie studio, and consumer merchandise.
● High growth, particularly from the emerging markets. This helped fuel 7% revenue
growth and 15% earnings growth in fiscal 2015.
● The upcoming release of Star Wars: Episode VII – The Force Awakens has the potential
to make Disney billions of dollars—not just in ticket sales, but also through the immense
merchandising opportunity.
Potential Concerns
● Subscribers of Disney’s flagship media property ESPN are declining. This could be due
to the rising consumer trend known as cord-cutting.
● Low dividend yield. Thanks to Disney’s rising share price, its dividend yield is barely
1%, which does not provide a sufficient level of income for dividend investors.
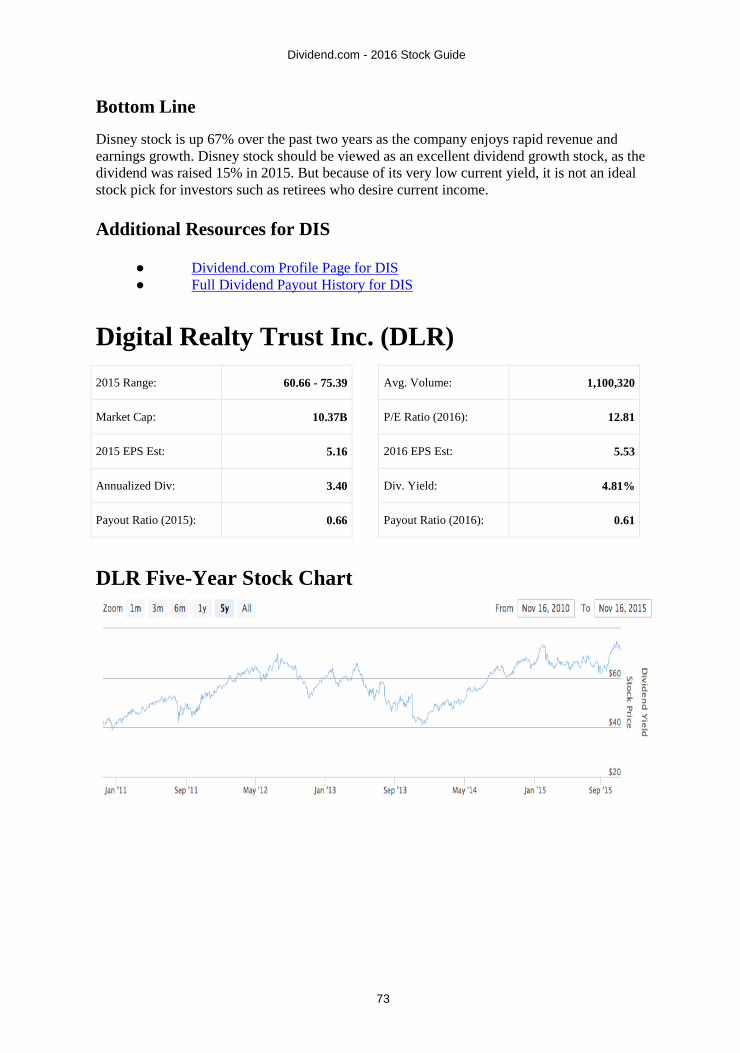
Dividend.com - 2016 Stock Guide
73
Bottom Line
Disney stock is up 67% over the past two years as the company enjoys rapid revenue and
earnings growth. Disney stock should be viewed as an excellent dividend growth stock, as the
dividend was raised 15% in 2015. But because of its very low current yield, it is not an ideal
stock pick for investors such as retirees who desire current income.
Additional Resources for DIS
● Dividend.com Profile Page for DIS
● Full Dividend Payout History for DIS
Digital Realty Trust Inc. (DLR)
2015 Range: 60.66 - 75.39 Avg. Volume: 1,100,320
Market Cap: 10.37B P/E Ratio (2016): 12.81
2015 EPS Est: 5.16 2016 EPS Est: 5.53
Annualized Div: 3.40 Div. Yield: 4.81%
Payout Ratio (2015): 0.66 Payout Ratio (2016): 0.61
DLR Five-Year Stock Chart

Dividend.com - 2016 Stock Guide
74
Company Profile
Digital Realty Trust (DLR) owns, acquires, develops, redevelops and manages technology-related
real estate. The company is focused on providing Turn-Key Datacenter (TM) and Powered Base
Building (TM) datacenter solutions for domestic and international tenants across a variety of
industry verticals ranging from information technology and internet enterprises to manufacturing
and financial services. Comprising approximately 24.5 million net rentable square feet, including
approximately 1.8 million square feet under active development as of December 31, 2013, Digital
Realty Trust's portfolio is comprised of 131 separate properties. As a REIT, Digital Realty Trust
is mandated to pay out the large majority of its earnings as dividends, and thus has a high
dividend yield and payout ratio. Digital Realty Trust has been paying dividends since 2004, and
has increased them every year consecutively since then. Digital Realty Trust pays its dividends
quarterly.
Twenty-year dividend payout history (annualized)
Year Annualized Payout Change
2014 3.32 +6.41%
2013 3.12 +6.85%
2012 2.92 +7.35%
2011 2.72 +34.65%
2010 2.02 +37.41%
2009 1.47 +16.67%
2008 1.26 +7.88%
2007 1.17 +8.05%
2006 1.08 +8.43%
2005 1.00 +539.10%
2004 0.16 -86.43%

Dividend.com - 2016 Stock Guide
75
Dividend.com DARS™ Ratings for DLR
Below are Dividend.com's proprietary DARS™ Ratings for DLR as of Dec. 2, 2015. Each value
is based on a scale of 1 to 5.
Relative Strength
3.5
DLR is outperforming much of the market.
Overall Yield Attractiveness
4.0
DLR's dividend yield is above the industry average.
Dividend Reliability
4.0
DLR has been paying dividends for 2011 years, and we its dividend yield is safe.
Dividend Uptrend
3.5
DLR has shown steady and generous dividends, and has increased its payouts each year.
Earnings Growth
3.0
DLR's earnings estimates are flat.
Read more about the DARS™ Rating System here.
Dividend.com 2016 Forecast for DLR
Potential Catalysts
● Digital Realty yields 4.7%, which is well above the market average. This is an attractive
yield for income investors.
● The company generates steady growth in funds from operation, which provides for
reliable dividend growth. Digital Realty has increased its dividend for 10 years in a row.
● A diversified, high quality tenant portfolio. Digital Realty enjoys 93% portfolio
occupancy and 80% average tenant retention. The company achieves 2%-3% annual rent
bumps and has a 6.2 year average remaining lease term.
Potential Concerns
● As a REIT, Digital Realty depends on debt to finance its capital structure. When interest
rates rise, this will be a headwind on earnings growth.
● Digital Realty is facing increasing competition from technology companies building their
own data storage centers.

Dividend.com - 2016 Stock Guide
76
Bottom Line
Digital Realty is in a particular niche (data center storage), which is in high demand right now. As
technology moves toward the cloud, demand for data centers is growing rapidly. This will
provide a fundamental tailwind for FFO growth, which will allow for regular dividend increases
as well. Digital Realty is a very good pick for a combination of high yield and dividend growth.
Additional Resources for DLR
● Dividend.com Profile Page for DLR
● Full Dividend Payout History for DLR
Dow Chemical (DOW)
2015 Range: 35.11 - 57.10 Avg. Volume: 15,068,800
Market Cap: 59.14B P/E Ratio (2016): 14.38
2015 EPS Est: 3.27 2016 EPS Est: 3.55
Annualized Div: 1.84 Div. Yield: 3.59%
Payout Ratio (2015): 0.56 Payout Ratio (2016): 0.52
DOW Five-Year Stock Chart
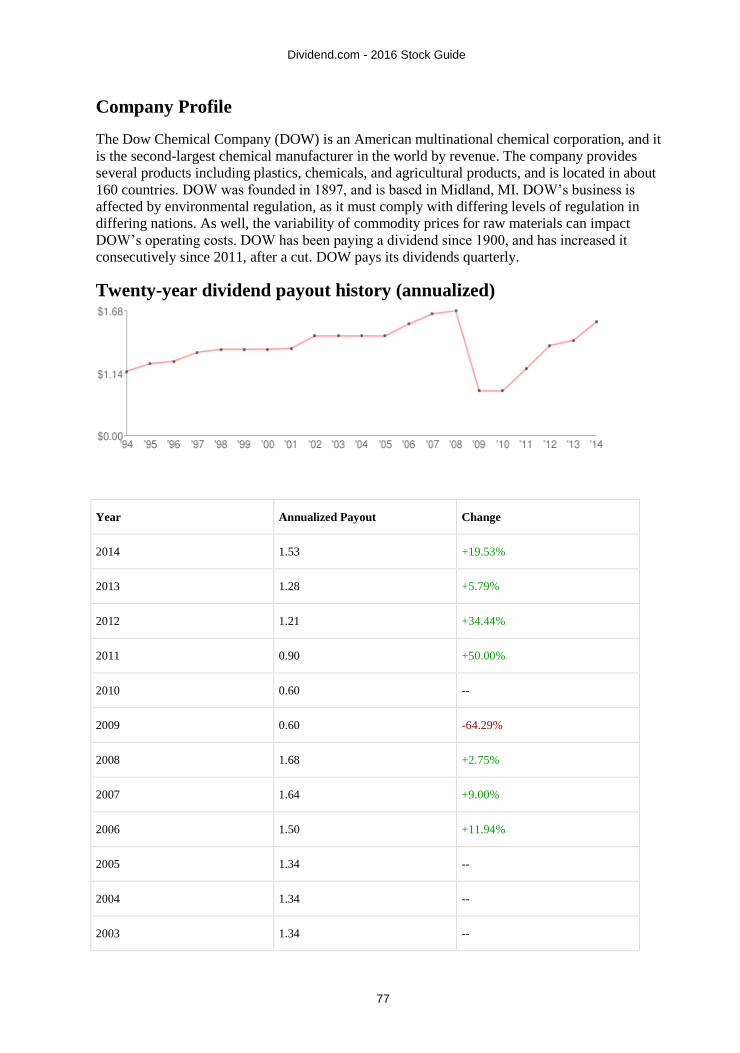
Dividend.com - 2016 Stock Guide
77
Company Profile
The Dow Chemical Company (DOW) is an American multinational chemical corporation, and it
is the second-largest chemical manufacturer in the world by revenue. The company provides
several products including plastics, chemicals, and agricultural products, and is located in about
160 countries. DOW was founded in 1897, and is based in Midland, MI. DOW’s business is
affected by environmental regulation, as it must comply with differing levels of regulation in
differing nations. As well, the variability of commodity prices for raw materials can impact
DOW’s operating costs. DOW has been paying a dividend since 1900, and has increased it
consecutively since 2011, after a cut. DOW pays its dividends quarterly.
Twenty-year dividend payout history (annualized)
Year Annualized Payout Change
2014 1.53 +19.53%
2013 1.28 +5.79%
2012 1.21 +34.44%
2011 0.90 +50.00%
2010 0.60 --
2009 0.60 -64.29%
2008 1.68 +2.75%
2007 1.64 +9.00%
2006 1.50 +11.94%
2005 1.34 --
2004 1.34 --
2003 1.34 --

Dividend.com - 2016 Stock Guide
78
2002 1.34 +14.14%
2001 1.17 +1.21%
2000 1.16 --
1999 1.16 --
1998 1.16 +3.57%
1997 1.12 +12.00%
1996 1.00 +3.45%
1995 0.97 +11.54%
1994 0.87 -73.90%
Dividend.com DARS™ Ratings for DOW
Below are Dividend.com's proprietary DARS™ Ratings for DOW as of Dec. 2, 2015. Each value
is based on a scale of 1 to 5.
Relative Strength
3.0
DOW is performing in-line with the market or better.
Overall Yield Attractiveness
3.5
DOW's dividend yield is above the industry average.
Dividend Reliability
4.0
DOW has been paying dividends for 100 years, and we its dividend yield is safe.
Dividend Uptrend
3.5
DOW has shown steady and generous dividends, and has increased its payouts each year.
Earnings Growth
3.0
DOW's earnings estimates are flat.
Read more about the DARS™ Rating System here.
Dividend.com - 2016 Stock Guide
79
Dividend.com 2016 Forecast for DOW
Potential Catalysts
● Strong underlying growth, particularly in the emerging markets. Last quarter, volumes
grew 7% in Asia-Pacific and 3% in Europe, the Middle East and Africa.
● Dow Chemical stock is cheap on a valuation basis. At 13 times earnings, the stock trades
for a 31% discount to the broader market valuation.
● Dow Chemical is a dividend stock with a 3.7% yield. This is higher than the market
average, and significantly above its closest competitor DuPont, which yields just 2.5%
Potential Concerns
● The rising U.S. dollar, which is weighing on revenue growth. Unfavorable currency
translations and divestments caused revenue to fall 16% last quarter.
● Exposure to weak agricultural conditions in Latin America. This caused revenue in Dow
Chemical’s agricultural sciences division to decline 14% last quarter.
Bottom Line
Dow Chemical is trying to refocus its business by divesting units deemed non-critical to the
future. This includes the sale of its AgroFresh specialty chemicals business. However, the stock
remains a compelling value and income opportunity with a cheap valuation and high dividend
yield.
Additional Resources for DOW
● Dividend.com Profile Page for DOW
● Full Dividend Payout History for DOW
Duke Energy Corporation (DUK)
2015 Range: 65.50 - 89.97 Avg. Volume: 3,324,930
Market Cap: 47.58B P/E Ratio (2016): 14.68
2015 EPS Est: 4.58 2016 EPS Est: 4.71
Annualized Div: 3.30 Div. Yield: 4.82%
Payout Ratio (2015): 0.72 Payout Ratio (2016): 0.7

Dividend.com - 2016 Stock Guide
80
DUK Five-Year Stock Chart
Company Profile
Duke Energy Corp (DUK) is an energy company in the United States. The company was founded
in 1904 and is based out of Charlotte, North Carolina. Duke Energy business segments include
U.S. Franchised Electric and Gas (USFE&G), Commercial Power and International Energy. Its
utility operations serve four million customers located in Ohio, Kentucky, Florida, Indiana, South
Carolina, and North Carolina. It also operates international power generation assets in Canada
and Latin America. Duke Energy is extensively affected by state and federal regulations. Duke
Energy also relies on short-term and long-term money markets to finance capital requirements
and liquidity needs. Duke Energy has been paying dividends since 2000, and has consistently
increased them annually since 2007. Duke Energy pays its dividends quarterly.
Twenty-year dividend payout history (annualized)
Year Annualized Payout Change
2014 3.15 +1.94%
2013 3.09 +52.22%
2012 2.03 +105.05%
2011 0.99 +2.06%

Dividend.com - 2016 Stock Guide
81
2010 0.97 +3.19%
2009 0.94 +4.44%
2008 0.90 +4.65%
2007 0.86 -31.75%
2006 1.26 +46.51%
2005 0.86 -21.82%
2004 1.10 --
2003 1.10 --
2002 1.10 --
2001 1.10 --
2000 1.10 --
1999 1.10 --
1998 1.10 +1.85%
1997 1.08 +3.85%
1996 1.04 +4.00%
1995 1.00 +4.17%
1994 0.96 -37.25%
Dividend.com DARS™ Ratings for DUK
Below are Dividend.com's proprietary DARS™ Ratings for DUK as of Dec. 2, 2015. Each value
is based on a scale of 1 to 5.
Relative Strength
3.5
DUK is outperforming much of the market.
Overall Yield Attractiveness
4.0
DUK's dividend yield is above the industry average.

Dividend.com - 2016 Stock Guide
82
Dividend Reliability
3.5
DUK has been paying dividends for 85 years, and we its dividend yield is safe.
Dividend Uptrend
3.0
DUK has shown consistency in its payouts, but any increases have been small.
Earnings Growth
3.0
DUK's earnings estimates are flat.
Read more about the DARS™ Rating System here.
Dividend.com 2016 Forecast for DUK
Potential Catalysts
● High dividend yield and dividend growth. The stock yields 5% – more than double the
overall market average yield. Duke Energy has paid dividends for 88 years.
● As an electric utility, Duke Energy generates consistent cash flow each year, since
consumers cannot do without electricity. Adjusted earnings grew 5% last quarter.
Potential Concerns
● Exposure to rising interest rates, which will raise the cost of debt for utility companies.
● Above-average valuation is a cause for concern. Duke Energy trades for 19 times
earnings, which matches the market multiple. Typically, utilities do not carry market
multiples, because earnings growth is lower than the overall market.
Bottom Line
Duke Energy, like other well-run utilities, generates steady earnings growth each year. This
helped the company pay its dividend each quarter for many decades without interruption. The
only challenge going forward is rising interest rates, but Duke Energy has a strong balance sheet
with a manageable debt load. Therefore, it remains a good dividend stock.
Additional Resources for DUK
● Dividend.com Profile Page for DUK
● Full Dividend Payout History for DUK

Dividend.com - 2016 Stock Guide
83
Consolidated Edison Inc. (ED)
2015 Range: 56.86 - 72.25 Avg. Volume: 2,056,720
Market Cap: 18.39B P/E Ratio (2016): 15.45
2015 EPS Est: 4.01 2016 EPS Est: 4.06
Annualized Div: 2.60 Div. Yield: 4.19%
Payout Ratio (2015): 0.65 Payout Ratio (2016): 0.64
ED Five-Year Stock Chart
Company Profile
Consolidated Edison, Inc. (ED) is one of the largest investor-owned energy companies in the
United States. The company delivers electricity, natural gas, and steam to customers in New York
City and Westchester County. ED was founded in 1823, and is based in New York, New York.
As a utility company, ED is extensively regulated by municipal, state, and federal governments.
ED is largely affected by the price of its utilities rate plans, which are limited and regulated by
state authorities. ED is a dividend aristocrat that has increased dividends for 40 consecutive years.
ED pays its dividends quarterly.

Dividend.com - 2016 Stock Guide
84
Twenty-year dividend payout history (annualized)
Year Annualized Payout Change
2014 2.52 +2.44%
2013 2.46 +1.65%
2012 2.42 +0.83%
2011 2.40 +0.84%
2010 2.38 +0.85%
2009 2.36 +0.85%
2008 2.34 +0.86%
2007 2.32 +0.87%
2006 2.30 +0.88%
2005 2.28 +0.88%
2004 2.26 +0.89%
2003 2.24 +0.90%
2002 2.22 +0.91%
2001 2.20 +0.92%
2000 2.18 +1.87%
1999 2.14 +0.94%
1998 2.12 +0.95%

Dividend.com - 2016 Stock Guide
85
1997 2.10 +0.96%
1996 2.08 +1.96%
1995 2.04 +2.00%
1994 2.00 -36.51%
Dividend.com DARS™ Ratings for ED
Below are Dividend.com's proprietary DARS™ Ratings for ED as of Dec. 2, 2015. Each value is
based on a scale of 1 to 5.
Relative Strength
2.5
ED is performing in-line with the market or better.
Overall Yield Attractiveness
3.5
ED's dividend yield is above the industry average.
Dividend Reliability
4.5
ED has been paying dividends for 126 years, and we feel its dividend yield is
extremely safe.
Dividend Uptrend
3.5
ED has shown steady and generous dividends, and has increased its payouts each
year.
Earnings Growth
3.0
ED's earnings estimates are flat.
Read more about the DARS™ Rating System here.
Dividend.com 2016 Forecast for ED
Potential Catalysts
● High dividend yield and dividend growth. ConEd stock yields 4.2% and it has increased
its dividend 41 years in a row.
● As an electric utility, ConEd enjoys a highly recession-resistant business model—
households need electricity even when the economy enters recession.
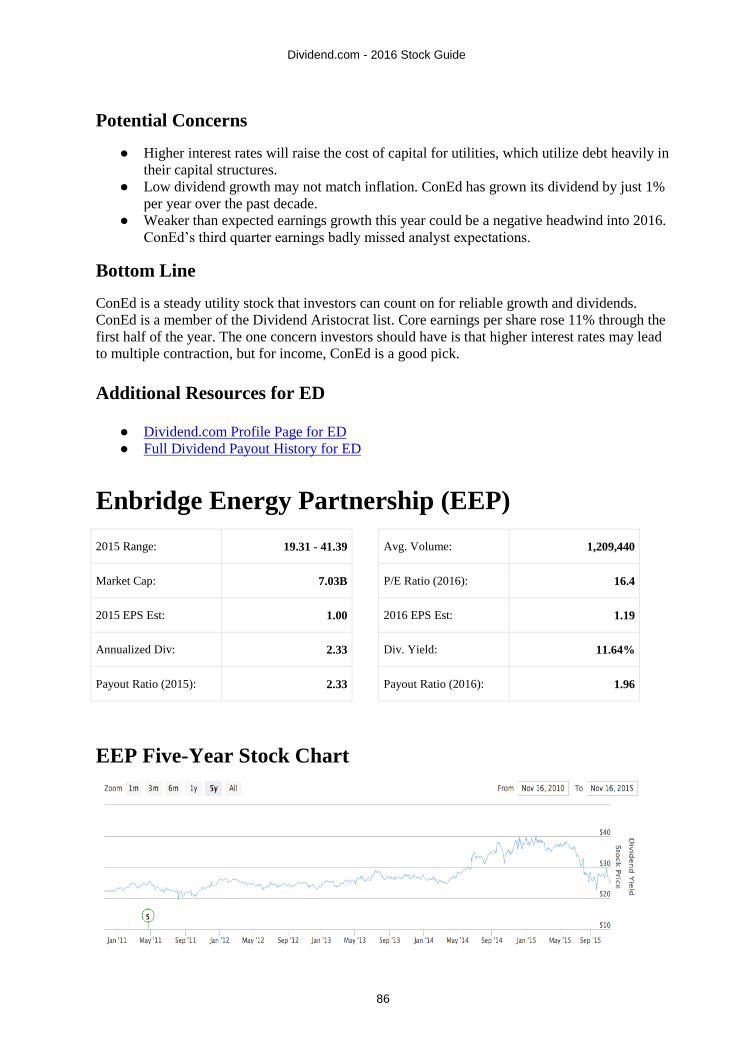
Dividend.com - 2016 Stock Guide
86
Potential Concerns
● Higher interest rates will raise the cost of capital for utilities, which utilize debt heavily in
their capital structures.
● Low dividend growth may not match inflation. ConEd has grown its dividend by just 1%
per year over the past decade.
● Weaker than expected earnings growth this year could be a negative headwind into 2016.
ConEd’s third quarter earnings badly missed analyst expectations.
Bottom Line
ConEd is a steady utility stock that investors can count on for reliable growth and dividends.
ConEd is a member of the Dividend Aristocrat list. Core earnings per share rose 11% through the
first half of the year. The one concern investors should have is that higher interest rates may lead
to multiple contraction, but for income, ConEd is a good pick.
Additional Resources for ED
● Dividend.com Profile Page for ED
● Full Dividend Payout History for ED
Enbridge Energy Partnership (EEP)
2015 Range: 19.31 - 41.39 Avg. Volume: 1,209,440
Market Cap: 7.03B P/E Ratio (2016): 16.4
2015 EPS Est: 1.00 2016 EPS Est: 1.19
Annualized Div: 2.33 Div. Yield: 11.64%
Payout Ratio (2015): 2.33 Payout Ratio (2016): 1.96
EEP Five-Year Stock Chart

Dividend.com - 2016 Stock Guide
87
Company Profile
Enbridge Energy Partners LP (EEP) is a energy company which is focused on three core
businesses, crude oil and liquids pipelines, natural gas transportation and distribution, and green
energy. The company was founded 1949, and is headquartered in Alberta, Canada.
Twenty-year dividend payout history (annualized)
Year Annualized Payout Change
2014 2.20 +1.06%
2013 2.17 +1.02%
2012 2.15 +2.77%
2011 2.09 -48.28%
2010 4.05 +2.25%
2009 3.96 +2.06%
2008 3.88 +4.16%
2007 3.73 +0.68%
2006 3.70 --
2005 3.70 --
2004 3.70 --
2003 3.70 +2.78%
2002 3.60 +37.14%

Dividend.com - 2016 Stock Guide
88
2001 2.63 -25.00%
2000 3.50 +0.43%
1999 3.49 +3.72%
1998 3.36 +15.07%
1997 2.92 +12.31%
1996 2.60 +1.56%
1995 2.56 +1.99%
1994 2.51 -0.40%
Dividend.com DARS™ Ratings for EEP
Below are Dividend.com's proprietary DARS™ Ratings for EEP as of Dec. 2, 2015. Each value
is based on a scale of 1 to 5.
Relative Strength
3.5
EEP is outperforming much of the market.
Overall Yield Attractiveness
4.0
EEP's dividend yield is above the industry average.
Dividend Reliability
4.0
EEP has been paying dividends for 2011 years, and we its dividend yield is safe.
Dividend Uptrend
3.5
EEP has shown steady and generous dividends, and has increased its payouts each year.
Earnings Growth
2.5
EEP's earnings estimates are flat.
Read more about the DARS™ Rating System here.
Dividend.com - 2016 Stock Guide
89
Dividend.com 2016 Forecast for EEP
Potential Catalysts
● A very high dividend yield. Enbridge currently yields 9%, which is well above the 2%
yield for the S&P 500 Index.
● Growing distributions. Enbridge’s most recent distribution was 5% higher than the same
quarterly payout last year.
● Some protection from commodity prices. As a midstream company, Enbridge operates
pipelines and storage terminals. This provides some measure of insulation against
commodity prices, as midstream operates more like a toll road, collecting fees based on
volumes transported and stored.
Potential Concerns
● Exposure to a continued slide in commodity prices could mean further downside for the
stock. Revenue fell 34% last quarter, year over year.
● A high level of debt could threaten Enbridge’s distribution. The company currently has
$7.1 billion of long-term debt, and just $110 million of cash and cash equivalents.
● Rising interest rates can be very dangerous. With so much long-term debt, Enbridge
could see significantly higher financing costs if and when interest rates rise.
Bottom Line
Enbridge has navigated the commodity downturn well. It has not cut its distribution yet.
However, the company has a great deal of debt on the balance sheet. A prolonged downturn in
commodity prices may jeopardize Enbridge’s ability to maintain its 9% distribution. If
commodity prices recover, the 9% yield will serve as an excellent yield for income investors.
Additional Resources for EEP
● Dividend.com Profile Page for EEP
● Full Dividend Payout History for EEP
Enterprise Products Partners L.P. (EPD)
2015 Range: 20.7600 - 37.1900 Avg. Volume: 5,930,550
Market Cap: 44.58B P/E Ratio (2016): 15.14
2015 EPS Est: 1.2800 2016 EPS Est: 1.4700
Annualized Div: 1.54 Div. Yield: 6.95%
Payout Ratio (2015): 1.2 Payout Ratio (2016): 1.05

Dividend.com - 2016 Stock Guide
90
EPD Five-Year Stock Chart
Company Profile
Enterprise Products Partners LP (EPD) is a holding company that owns Enterprise Products
Operating LLC, a provider of midstream energy services to producers and consumers of natural
gas, NGLs, crude oil, and refined products. The company is based in Houston, TX. EPD relies
solely on dividend pays from Enterprise Products Operating LLC. EPD’s profitability is largely
affected by the price of commodities such as crude oil and natural gas. As well, EPD is reliant on
liquid capital markets and access to investment opportunities. EPD has been paying dividends
since 1998, and has increased them consecutively annually since 1999. EPD pays its dividends
quarterly.
Twenty-year dividend payout history (annualized)
Year Annualized Payout Change
2014 2.50 -25.74%
2013 3.36 +32.68%
2012 2.53 +5.26%
2011 2.41 +5.25%
2010 2.29 +5.54%
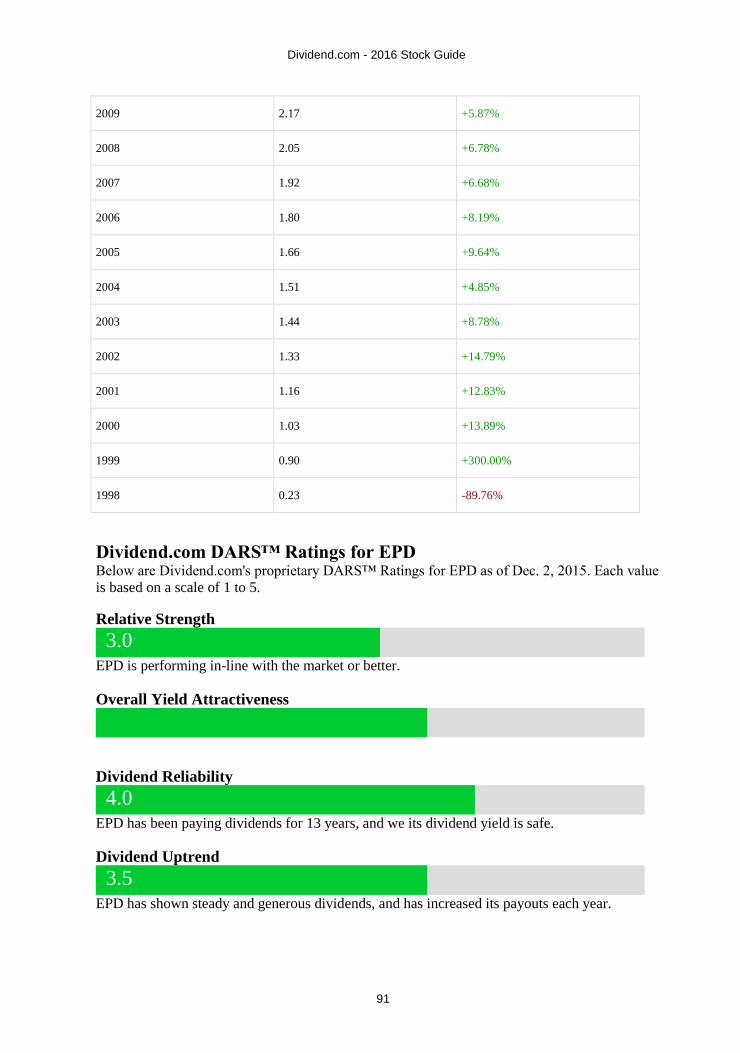
Dividend.com - 2016 Stock Guide
91
2009 2.17 +5.87%
2008 2.05 +6.78%
2007 1.92 +6.68%
2006 1.80 +8.19%
2005 1.66 +9.64%
2004 1.51 +4.85%
2003 1.44 +8.78%
2002 1.33 +14.79%
2001 1.16 +12.83%
2000 1.03 +13.89%
1999 0.90 +300.00%
1998 0.23 -89.76%
Dividend.com DARS™ Ratings for EPD
Below are Dividend.com's proprietary DARS™ Ratings for EPD as of Dec. 2, 2015. Each value
is based on a scale of 1 to 5.
Relative Strength
3.0
EPD is performing in-line with the market or better.
Overall Yield Attractiveness
Dividend Reliability
4.0
EPD has been paying dividends for 13 years, and we its dividend yield is safe.
Dividend Uptrend
3.5
EPD has shown steady and generous dividends, and has increased its payouts each year.

Dividend.com - 2016 Stock Guide
92
Earnings Growth
3.0
EPD's earnings estimates are flat.
Read more about the DARS™ Rating System here.
Dividend.com 2016 Forecast for EPD
Potential Catalysts
● Very high distribution yield and growth. Enterprise Products yields 5.8%, and has
increased its distribution for 45 consecutive quarters.
● Pipelines operate like toll roads. The company collects fees based on volumes, and is less
reliant on commodity prices than upstream firms. Distributable cash flow grew 49% over
the first nine months of the year.
● Demand for oil and gas infrastructure improvements in the United States, as well as the
potential for exporting oil and gas to underdeveloped nations.
Potential Concerns
● Rising interest rates raise the cost of debt for highly leveraged companies like Enterprise
Products. The company holds $22.5 billion in debt.
● Rising capital expenditures. Due to increased demand for oil and gas infrastructure,
Enterprise Products Partners’ capital expenditures rose 40% over the first nine months.
Bottom Line
Sentiment is broadly negative across the entire energy sector. Even high-quality companies that
are not highly exposed to commodity prices, such as Enterprise Products, are being sold in this
market. However, this sets up an excellent buying opportunity for new investors. Enterprise
Products’ excellent cash flow generation and distribution growth make it a very strong stock for
income investors.
Additional Resources for EPD
● Dividend.com Profile Page for EPD
● Full Dividend Payout History for EPD

Dividend.com - 2016 Stock Guide
93
General Electric Company (GE)
2015 Range: 19.37 - 30.99 Avg. Volume: 92,163,296
Market Cap: 307.32B P/E Ratio (2016): 20.13
2015 EPS Est: 1.30 2016 EPS Est: 1.51
Annualized Div: 0.92 Div. Yield: 3.04%
Payout Ratio (2015): 0.71 Payout Ratio (2016): 0.61
GE Five-Year Stock Chart
Company Profile
General Electric Company (GE) is a diversified technology and financial services company. The
company offers many products and services including aircraft engines, power generation, water
processing, household appliances, medical imaging, business and consumer financing, and
industrial products. GE has a presence in over 100 countries. Segments of the company include
Energy Infrastructure, Aviation, Healthcare, Transportation, Home & Business Solutions and GE
Capital. The company was founded in 1892 and is based in Fairfield, CT. Since 2008, GE has had
increasing pension costs from the vast number of Americans it had employed a few decades
previously. GE is also largely affected by global economic conditions globally, as many of its
products are sold to more volatile industries. GE has paid a dividend for over 100 years, and has
increased its dividend annually since 2011. GE has historically had a volatile dividend. GE pays
its dividends quarterly.

Dividend.com - 2016 Stock Guide
94
Twenty-year dividend payout history (annualized)
Year Annualized Payout Change
2014 0.89 +12.66%
2013 0.79 +12.86%
2012 0.70 +14.75%
2011 0.61 +1.67%
2010 0.60 -1.64%
2009 0.61 -50.81%
2008 1.24 +7.83%
2007 1.15 +11.65%
2006 1.03 +13.19%
2005 0.91 +10.98%
2004 0.82 +6.49%
2003 0.77 +5.48%
2002 0.73 +10.61%
2001 0.66 +15.65%
2000 0.57 +17.26%
1999 0.49 +16.80%
1998 0.42 +15.74%

Dividend.com - 2016 Stock Guide
95
1997 0.36 +13.68%
1996 0.32 +12.43%
1995 0.28 +13.42%
1994 0.25 -90.05%
Dividend.com DARS™ Ratings for GE
Below are Dividend.com's proprietary DARS™ Ratings for GE as of Dec. 2, 2015. Each value is
based on a scale of 1 to 5.
Relative Strength
2.0
GE is slightly underperforming relative to its peers.
Overall Yield Attractiveness
4.0
GE's dividend yield is above the industry average.
Dividend Reliability
4.0
GE has been paying dividends for 112 years, and we its dividend yield is safe.
Dividend Uptrend
4.0
GE has shown steady and generous dividends, and has increased its payouts each year.
Earnings Growth
3.0
GE's earnings estimates are flat.
Read more about the DARS™ Rating System here.
Dividend.com 2016 Forecast for GE
Potential Catalysts
● Divestiture of General Electric’s financing business. GE will sell most of its GE Capital
assets over the next two years, as well as its real estate assets. All told, the transactions
are expected to bring in $26 billion.
● This cash will be used for major share repurchases. GE plans to buy back as much as $50
billion of its own stock with the divestiture proceeds. This will be a very meaningful
catalyst for earnings growth going forward.
● Above-average dividend yield and dividend growth. General Electric yields 3% and
raised its dividend by 4.5% last year.

Dividend.com - 2016 Stock Guide
96
Potential Concerns
● Exposure to the oil and gas industries is a future concern. General Electric’s oil and gas
business makes up approximately 15% of its industrial revenue. Sales in that business fell
16% last quarter, due to continued contraction in commodity prices.
● Slowing economic growth in the emerging markets negatively affects GE because it is a
global company.
● Over-valuation is a concern, given weakness in certain business segments. General
Electric stock trades for 20 times forward earnings estimates, an above-average P/E
multiple.
Bottom Line
General Electric is undergoing a major restructuring and selling its massive financing arm. This
complicates the short-term picture but, long-term, it is a good strategy. Focusing on industrial
businesses should allow for smoother earnings growth and, as a result, stronger dividend growth.
Additional Resources for GE
● Dividend.com Profile Page for GE
● Full Dividend Payout History for GE
Gilead Sciences Inc. (GILD)
2015 Range: 85.95 - 123.37 Avg. Volume: 10,607,400
Market Cap: 147.39B P/E Ratio (2016): 8.56
2015 EPS Est: 12.20 2016 EPS Est: 11.95
Annualized Div: 1.72 Div. Yield: 1.71%
Payout Ratio (2015): 0.14 Payout Ratio (2016): 0.14
GILD Five-Year Stock Chart

Dividend.com - 2016 Stock Guide
97
Twenty-year dividend payout history (annualized)
Year Annualized Payout Change
Dividend.com DARS™ Ratings for GILD
Below are Dividend.com's proprietary DARS™ Ratings for GILD as of Dec. 2, 2014. Each value
is based on a scale of 1 to 5.
Relative Strength
4.5
GILD is breaking to the upside and outperforming most of the market.
Overall Yield Attractiveness
3.0
GILD's dividend yield is just average.
Dividend Reliability
3.0
GILD has been paying dividends for 2011 years, and we feel its dividend yield is
relatively safe.
Dividend Uptrend
3.0
GILD has shown consistency in its payouts, but any increases have been small.
Earnings Growth
4.0
GILD's earnings estimates have been raised nicely.
Read more about the DARS™ Rating System here.

Dividend.com - 2016 Stock Guide
98
Dividend.com 2016 Forecast for GILD
Potential Catalysts
● A large pipeline of new drugs is a catalyst for future earnings growth. Earnings are up
63% through the first three quarters of the year.
● Excellent balance sheet. Gilead holds $25 billion in cash on the balance sheet.
● An attractive valuation. Gilead stock trades for just 9 times earnings, which is less than
half the S&P 500 average valuation.
Potential Concerns
● Increased risk of regulatory intervention of biotechnology companies could limit future
growth.
● A low dividend yield. Gilead stock yields 1.5%, which is significantly below both the
market average and its pharmaceutical peer group.
Bottom Line
Gilead is a highly profitable company with an excellent balance sheet. Its current dividend yield
is low and the company has only paid dividends since this year. But over time, its strong financial
condition and earnings growth should fuel double-digit dividend growth per year. Gilead is a
stock that should appeal highly to dividend growth investors, but not as much to investors like
retirees who desire current income.
Additional Resources for GILD
● Dividend.com Profile Page for GILD
● Full Dividend Payout History for GILD
General Mills Inc. (GIS)
2015 Range: 47.500 - 59.870 Avg. Volume: 3,322,970
Market Cap: 34.95B P/E Ratio (2016): 18.62
2015 EPS Est: 2.940 2016 EPS Est: 3.140
Annualized Div: 1.76 Div. Yield: 3.01%
Payout Ratio (2015): 0.6 Payout Ratio (2016): 0.56
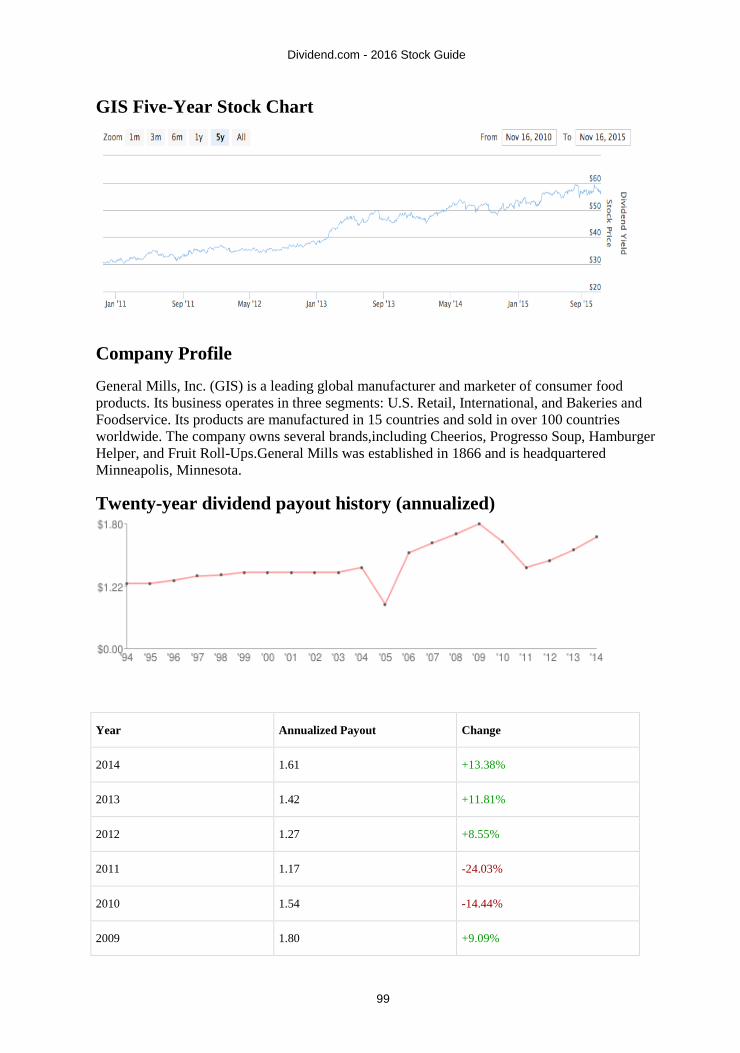
Dividend.com - 2016 Stock Guide
99
GIS Five-Year Stock Chart
Company Profile
General Mills, Inc. (GIS) is a leading global manufacturer and marketer of consumer food
products. Its business operates in three segments: U.S. Retail, International, and Bakeries and
Foodservice. Its products are manufactured in 15 countries and sold in over 100 countries
worldwide. The company owns several brands,including Cheerios, Progresso Soup, Hamburger
Helper, and Fruit Roll-Ups.General Mills was established in 1866 and is headquartered
Minneapolis, Minnesota.
Twenty-year dividend payout history (annualized)
Year Annualized Payout Change
2014 1.61 +13.38%
2013 1.42 +11.81%
2012 1.27 +8.55%
2011 1.17 -24.03%
2010 1.54 -14.44%
2009 1.80 +9.09%
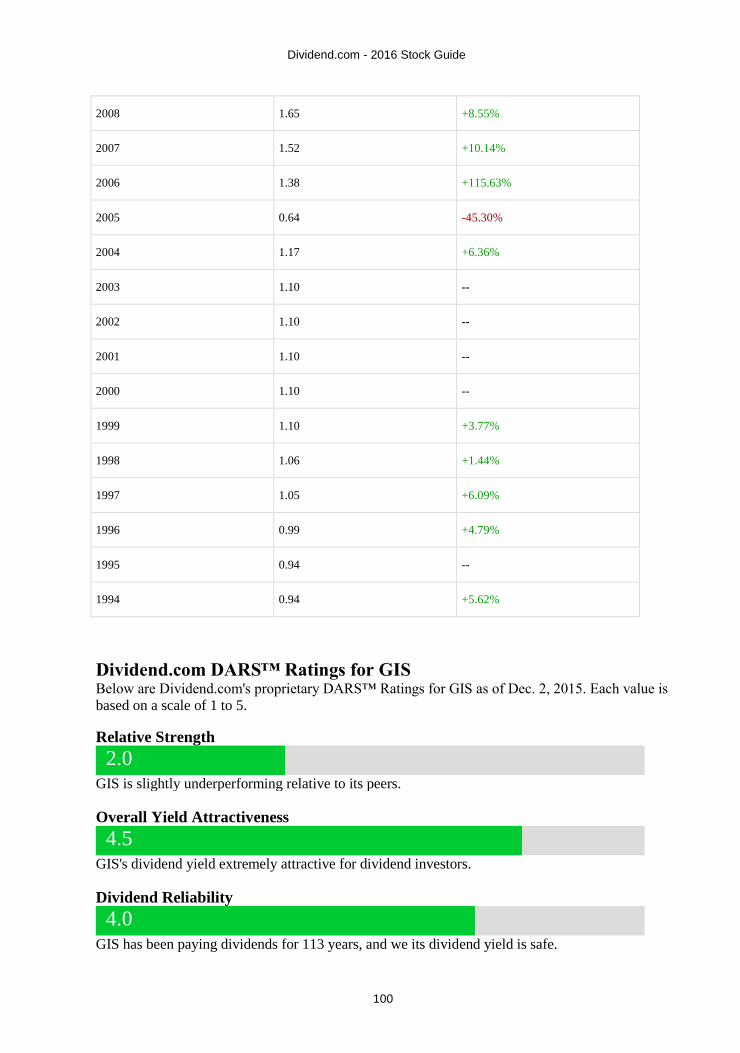
Dividend.com - 2016 Stock Guide
100
2008 1.65 +8.55%
2007 1.52 +10.14%
2006 1.38 +115.63%
2005 0.64 -45.30%
2004 1.17 +6.36%
2003 1.10 --
2002 1.10 --
2001 1.10 --
2000 1.10 --
1999 1.10 +3.77%
1998 1.06 +1.44%
1997 1.05 +6.09%
1996 0.99 +4.79%
1995 0.94 --
1994 0.94 +5.62%
Dividend.com DARS™ Ratings for GIS
Below are Dividend.com's proprietary DARS™ Ratings for GIS as of Dec. 2, 2015. Each value is
based on a scale of 1 to 5.
Relative Strength
2.0
GIS is slightly underperforming relative to its peers.
Overall Yield Attractiveness
4.5
GIS's dividend yield extremely attractive for dividend investors.
Dividend Reliability
4.0
GIS has been paying dividends for 113 years, and we its dividend yield is safe.

Dividend.com - 2016 Stock Guide
101
Dividend Uptrend
4.0
GIS has shown steady and generous dividends, and has increased its payouts each year.
Earnings Growth
2.5
GIS's earnings estimates are flat.
Read more about the DARS™ Rating System here.
Dividend.com 2016 Forecast for GIS
Potential Catalysts
● General Mills operates in a very stable industry. Food and beverage is a reliable source of
profits and cash flow, and is a recession-resistant business model.
● An above-average 3.2% dividend yield and a long history of paying dividends. It has
made quarterly dividend payments without interruption for 116 years.
● Dividend growth. Over the most recent five fiscal years, General Mills’ quarterly
dividend rate has been increased six times and its annual dividend per share has grown at
a 12% compound rate.
Potential Concerns
● General Mills has displayed a lack of progress in new growth areas like organic food. The
acquisition of specialty organic food company Annie’s last year, for $820 million, was a
relatively small acquisition.
● The company has failed to meet earnings forecasts recently. Last quarter, General Mills’
revenue declined 1%. Sales of $4.3 billion came in short of expectations; analysts had
projected $4.52 billion in sales.
● Aggressive valuation is a final concern. General Mills stock trades for 26 times earnings,
which is 36% above the S&P 500 Index valuation.
Bottom Line
General Mills has one of the longest track records of paying dividends. This is a testament to its
reliable business model and strong brand. However, the company has seen growth slow down due
to shifting consumer preferences, away from pre-packaged goods like cereal, and toward fresher
alternatives. General Mills is a satisfactory dividend stock with a 3.2% yield, but dividend growth
may slow in the years ahead.
Additional Resources for GIS
● Dividend.com Profile Page for GIS
● Full Dividend Payout History for GIS
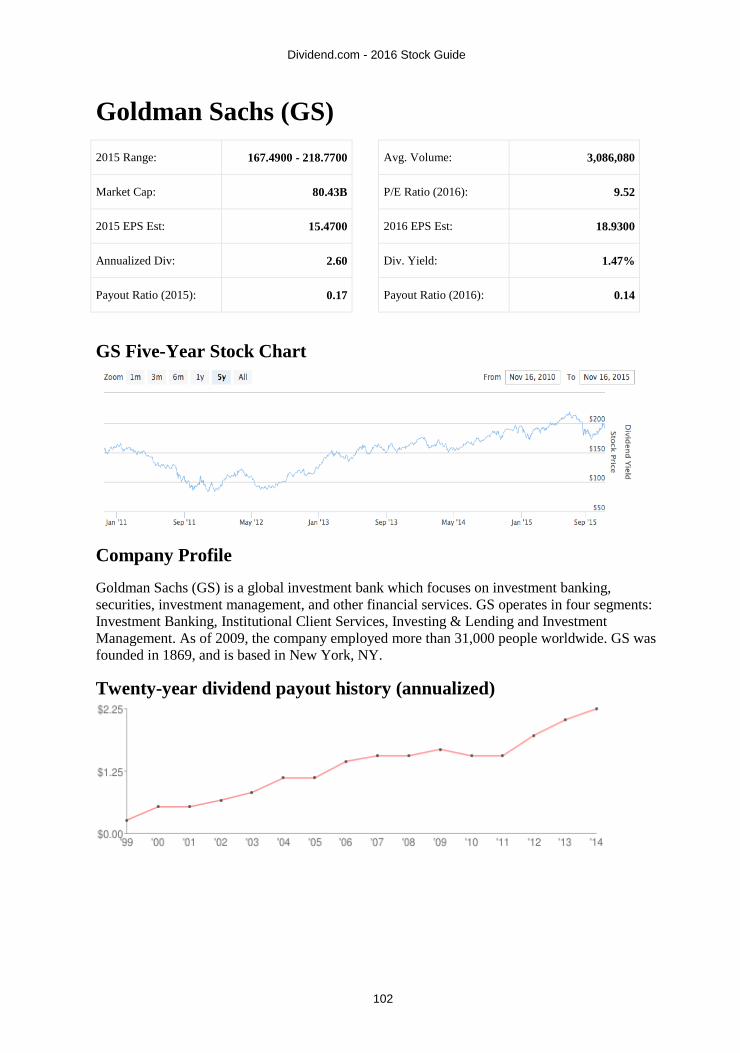
Dividend.com - 2016 Stock Guide
102
Goldman Sachs (GS)
2015 Range: 167.4900 - 218.7700 Avg. Volume: 3,086,080
Market Cap: 80.43B P/E Ratio (2016): 9.52
2015 EPS Est: 15.4700 2016 EPS Est: 18.9300
Annualized Div: 2.60 Div. Yield: 1.47%
Payout Ratio (2015): 0.17 Payout Ratio (2016): 0.14
GS Five-Year Stock Chart
Company Profile
Goldman Sachs (GS) is a global investment bank which focuses on investment banking,
securities, investment management, and other financial services. GS operates in four segments:
Investment Banking, Institutional Client Services, Investing & Lending and Investment
Management. As of 2009, the company employed more than 31,000 people worldwide. GS was
founded in 1869, and is based in New York, NY.
Twenty-year dividend payout history (annualized)

Dividend.com - 2016 Stock Guide
103
Year Annualized Payout Change
2014 2.25 +9.76%
2013 2.05 +15.82%
2012 1.77 +26.43%
2011 1.40 --
2010 1.40 -7.71%
2009 1.52 +8.36%
2008 1.40 --
2007 1.40 +7.69%
2006 1.30 +30.00%
2005 1.00 --
2004 1.00 +35.14%
2003 0.74 +23.33%
2002 0.60 +25.00%
2001 0.48 --
2000 0.48 +100.00%
1999 0.24 -85.09%
Dividend.com DARS™ Ratings for GS
Below are Dividend.com's proprietary DARS™ Ratings for GS as of Dec. 2, 2015. Each value is
based on a scale of 1 to 5.
Relative Strength
3.5
GS is outperforming much of the market.
Overall Yield Attractiveness
2.5
GS's dividend yield is just average.

Dividend.com - 2016 Stock Guide
104
Dividend Reliability
4.0
GS has been paying dividends for 2011 years, and we its dividend yield is safe.
Dividend Uptrend
3.5
GS has shown steady and generous dividends, and has increased its payouts each year.
Earnings Growth
3.5
GS's earnings estimates have been raised nicely.
Read more about the DARS™ Rating System here.
Dividend.com 2016 Forecast for GS
Potential Catalysts
● Goldman Sachs holds a top position as a global asset management and investment
banking firm. Its sterling reputation allows the company to recruit top talent.
● Improving global corporate finance activity is a growth catalyst for next year. Goldman
Sachs’ tangible book value is up 5% since the beginning of the year.
Potential Concerns
● Warren Buffett, Chairman of Berkshire Hathaway, recently sold shares of Goldman
Sachs. As of September 30, Berkshire owned just under 11 million shares of Goldman,
down from around 12.6 million on June 30. This could cause negative sentiment to
spread.
● Poor performance of the global equity and fixed income markets is a concern for asset
management firms. Last quarter, these headwinds caused Goldman Sachs’ earnings per
share to decline 36% year over year.
● Concerns over the health of CEO Lloyd Blankfein could linger into 2016.
Bottom Line
Goldman Sachs is one of the premier brand names in professional money management. The
company will benefit from a strong mergers and acquisitions environment. On the other hand,
equity markets have not performed well, which could hang over the stock next year. Goldman
Sachs is not a strong pick for dividends; the stock yields just 1.3%, which is significantly below
the market average.
Additional Resources for GS
● Dividend.com Profile Page for GS
● Full Dividend Payout History for GS
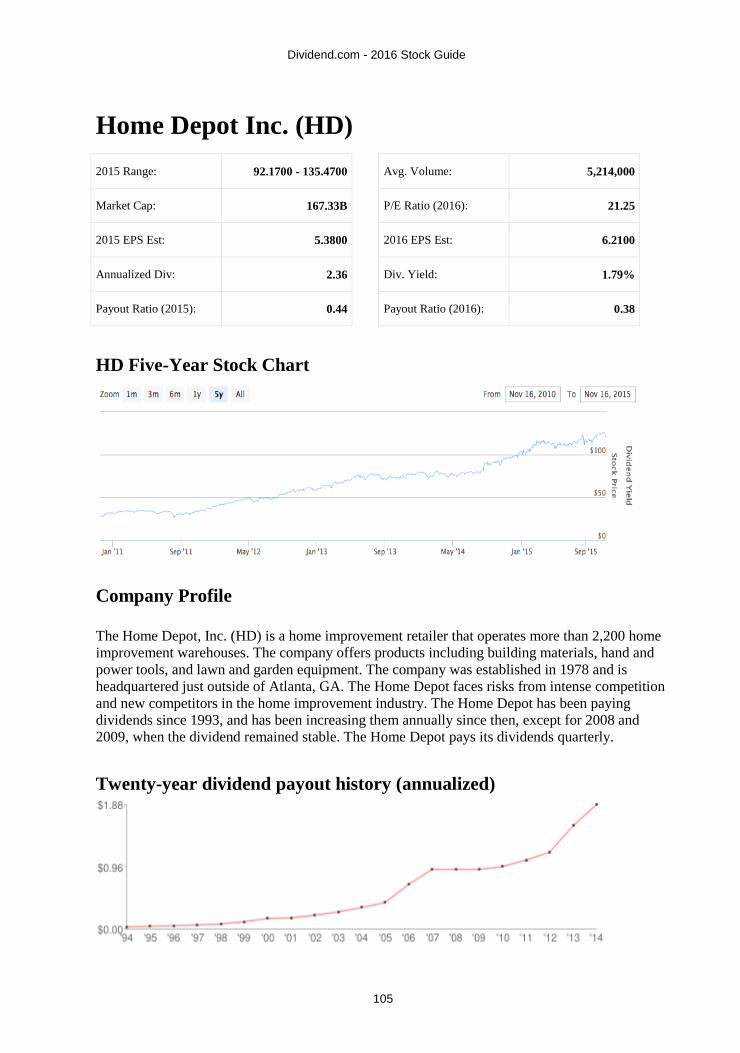
Dividend.com - 2016 Stock Guide
105
Home Depot Inc. (HD)
2015 Range: 92.1700 - 135.4700 Avg. Volume: 5,214,000
Market Cap: 167.33B P/E Ratio (2016): 21.25
2015 EPS Est: 5.3800 2016 EPS Est: 6.2100
Annualized Div: 2.36 Div. Yield: 1.79%
Payout Ratio (2015): 0.44 Payout Ratio (2016): 0.38
HD Five-Year Stock Chart
Company Profile
The Home Depot, Inc. (HD) is a home improvement retailer that operates more than 2,200 home
improvement warehouses. The company offers products including building materials, hand and
power tools, and lawn and garden equipment. The company was established in 1978 and is
headquartered just outside of Atlanta, GA. The Home Depot faces risks from intense competition
and new competitors in the home improvement industry. The Home Depot has been paying
dividends since 1993, and has been increasing them annually since then, except for 2008 and
2009, when the dividend remained stable. The Home Depot pays its dividends quarterly.
Twenty-year dividend payout history (annualized)

Dividend.com - 2016 Stock Guide
106
Year Annualized Payout Change
2014 1.88 +20.51%
2013 1.56 +34.48%
2012 1.16 +11.54%
2011 1.04 +10.17%
2010 0.94 +4.89%
2009 0.90 --
2008 0.90 --
2007 0.90 +33.33%
2006 0.68 +68.75%
2005 0.40 +23.08%
2004 0.33 +25.00%
2003 0.26 +23.81%
2002 0.21 +23.53%
2001 0.17 +6.25%
2000 0.16 +41.17%
1999 0.11 +47.83%
1998 0.08 +21.05%
1997 0.06 +23.95%
1996 0.05 +21.03%
1995 0.04 +26.63%
1994 0.03 -98.52%
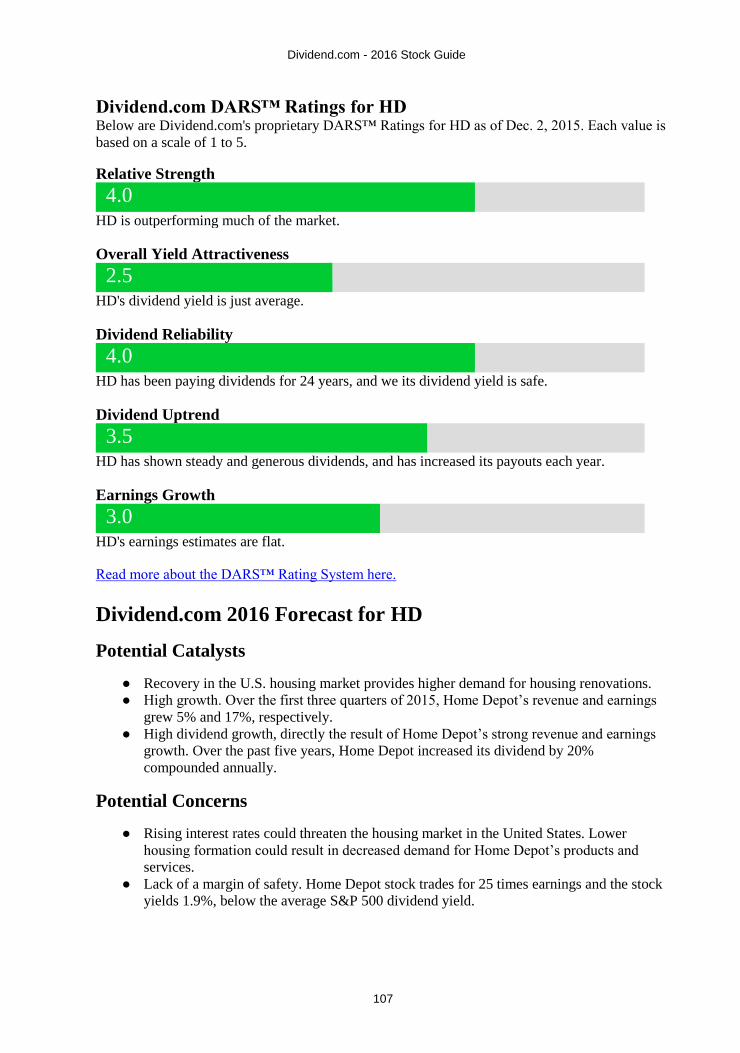
Dividend.com - 2016 Stock Guide
107
Dividend.com DARS™ Ratings for HD
Below are Dividend.com's proprietary DARS™ Ratings for HD as of Dec. 2, 2015. Each value is
based on a scale of 1 to 5.
Relative Strength
4.0
HD is outperforming much of the market.
Overall Yield Attractiveness
2.5
HD's dividend yield is just average.
Dividend Reliability
4.0
HD has been paying dividends for 24 years, and we its dividend yield is safe.
Dividend Uptrend
3.5
HD has shown steady and generous dividends, and has increased its payouts each year.
Earnings Growth
3.0
HD's earnings estimates are flat.
Read more about the DARS™ Rating System here.
Dividend.com 2016 Forecast for HD
Potential Catalysts
● Recovery in the U.S. housing market provides higher demand for housing renovations.
● High growth. Over the first three quarters of 2015, Home Depot’s revenue and earnings
grew 5% and 17%, respectively.
● High dividend growth, directly the result of Home Depot’s strong revenue and earnings
growth. Over the past five years, Home Depot increased its dividend by 20%
compounded annually.
Potential Concerns
● Rising interest rates could threaten the housing market in the United States. Lower
housing formation could result in decreased demand for Home Depot’s products and
services.
● Lack of a margin of safety. Home Depot stock trades for 25 times earnings and the stock
yields 1.9%, below the average S&P 500 dividend yield.

Dividend.com - 2016 Stock Guide
108
Bottom Line
The Home Depot is the world's largest home improvement specialty retailer. The company has
benefited hugely from the recovery in the housing and labor markets in North America. Home
Depot is an excellent stock for dividend growth, but is not such an ideal stock for current yield, as
its dividend yield is below the market average.
Additional Resources for HD
● Dividend.com Profile Page for HD
● Full Dividend Payout History for HD
Honeywell International Inc. (HON)
2015 Range: 87.00 - 107.41 Avg. Volume: 3,498,520
Market Cap: 76.24B P/E Ratio (2016): 15.2
2015 EPS Est: 6.10 2016 EPS Est: 6.51
Annualized Div: 2.38 Div. Yield: 2.40%
Payout Ratio (2015): 0.39 Payout Ratio (2016): 0.37
HON Five-Year Stock Chart
Company Profile
Honeywell International Inc. (HON) is a technology and manufacturing company. The company
offers many products and services including aerospace products and services, control, sensing and
security technologies for buildings, homes and industry, turbochargers, automotive products,
specialty chemicals, and electronic and advanced materials. The company was founded in 1906
and is headquartered in Morristown, NJ.

Dividend.com - 2016 Stock Guide
109
Twenty-year dividend payout history (annualized)
Year Annualized Payout Change
2014 1.87 +11.16%
2013 1.68 +9.98%
2012 1.53 +11.33%
2011 1.37 +13.20%
2010 1.21 --
2009 1.21 +10.18%
2008 1.10 +10.00%
2007 1.00 +10.13%
2006 0.91 +10.19%
2005 0.82 +9.57%
2004 0.75 --
2003 0.75 --
2002 0.75 --
2001 0.75 --
2000 0.75 +10.59%
1999 0.68 +13.33%
1998 0.60 +15.38%

Dividend.com - 2016 Stock Guide
110
1997 0.52 +15.56%
1996 0.45 +15.38%
1995 0.39 +20.18%
1994 0.32 -82.74%
Dividend.com DARS™ Ratings for HON
Below are Dividend.com's proprietary DARS™ Ratings for HON as of Dec. 2, 2015. Each value
is based on a scale of 1 to 5.
Relative Strength
3.0
HON is performing in-line with the market or better.
Overall Yield Attractiveness
3.5
HON's dividend yield is above the industry average.
Dividend Reliability
4.0
HON has been paying dividends for 41 years, and we its dividend yield is safe.
Dividend Uptrend
3.5
HON has shown steady and generous dividends, and has increased its payouts each year.
Earnings Growth
3.0
HON's earnings estimates are flat.
Read more about the DARS™ Rating System here.
Dividend.com 2016 Forecast for HON
Potential Catalysts
● As a major industrial company, Honeywell is a beneficiary of the global economic
recovery since the financial crisis.
● Huge growth potential in the emerging markets. Honeywell’s emerging markets business
grew at a 15% compound annual rate from 2003-2013.
● Continued free cash flow generation allows for the company to raise dividends at a high
rate. Honeywell recently increased its dividend by 15%.

Dividend.com - 2016 Stock Guide
111
Potential Concerns
● The rising U.S. dollar cut Honeywell’s revenue growth by six percentage points last
quarter.
● For the full year, Honeywell expects total sales to decline 4% from 2014 levels. This
could put pressure on future dividend growth.
Bottom Line
Honeywell’s growth is suppressed due to the strengthening U.S. dollar, but the company still
expects 10% earnings growth this year. This is because Honeywell, unlike many of its peers in
the industrial industry, does not cater to the oil and gas industry. Instead, Honeywell focuses on
aerospace and automation solutions. Honeywell stock yields 2.4%, which is above the S&P 500
Index average yield, and Honeywell is a strong dividend growth stock as well. Near-term
currency headwinds may be transitory.
Additional Resources for HON
● Dividend.com Profile Page for HON
● Full Dividend Payout History for HON
International Business Machines Corporation
(IBM)
2015 Range: 131.65 - 176.30 Avg. Volume: 4,657,570
Market Cap: 134.41B P/E Ratio (2016): 9.17
2015 EPS Est: 14.93 2016 EPS Est: 15.11
Annualized Div: 5.20 Div. Yield: 3.83%
Payout Ratio (2015): 0.35 Payout Ratio (2016): 0.34
IBM Five-Year Stock Chart
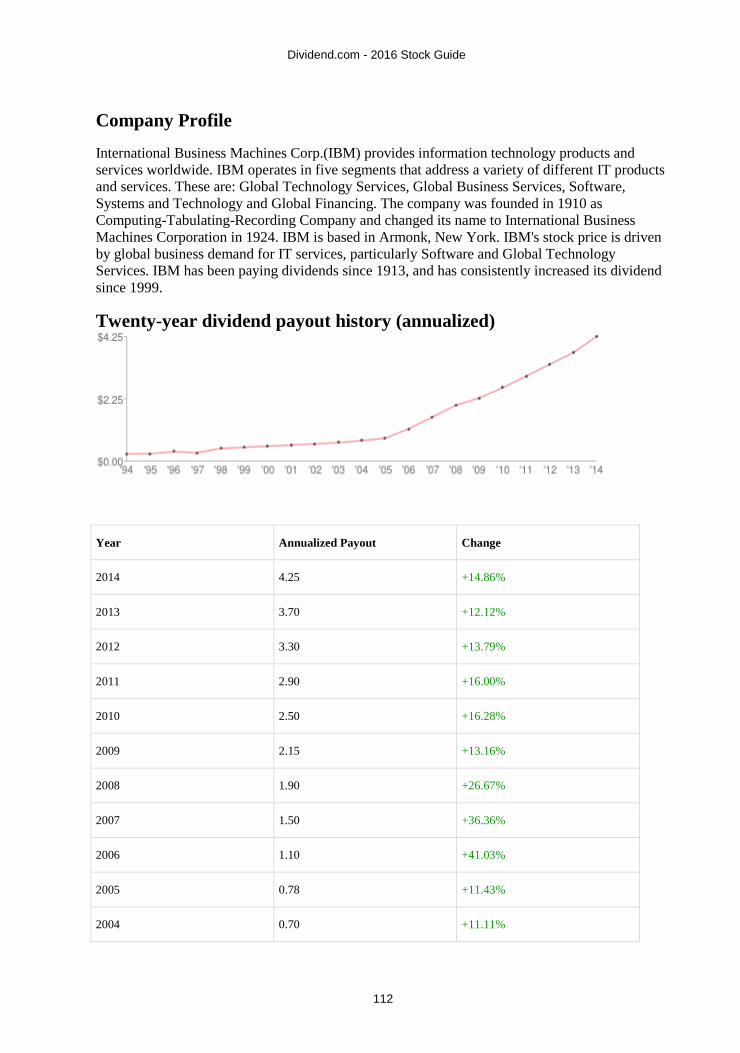
Dividend.com - 2016 Stock Guide
112
Company Profile
International Business Machines Corp.(IBM) provides information technology products and
services worldwide. IBM operates in five segments that address a variety of different IT products
and services. These are: Global Technology Services, Global Business Services, Software,
Systems and Technology and Global Financing. The company was founded in 1910 as
Computing-Tabulating-Recording Company and changed its name to International Business
Machines Corporation in 1924. IBM is based in Armonk, New York. IBM's stock price is driven
by global business demand for IT services, particularly Software and Global Technology
Services. IBM has been paying dividends since 1913, and has consistently increased its dividend
since 1999.
Twenty-year dividend payout history (annualized)
Year Annualized Payout Change
2014 4.25 +14.86%
2013 3.70 +12.12%
2012 3.30 +13.79%
2011 2.90 +16.00%
2010 2.50 +16.28%
2009 2.15 +13.16%
2008 1.90 +26.67%
2007 1.50 +36.36%
2006 1.10 +41.03%
2005 0.78 +11.43%
2004 0.70 +11.11%

Dividend.com - 2016 Stock Guide
113
2003 0.63 +6.78%
2002 0.59 +7.27%
2001 0.55 +7.84%
2000 0.51 +8.51%
1999 0.47 +9.30%
1998 0.43 +49.57%
1997 0.29 -11.54%
1996 0.33 +30.00%
1995 0.25 --
1994 0.25 -86.61%
Dividend.com DARS™ Ratings for IBM
Below are Dividend.com's proprietary DARS™ Ratings for IBM as of Dec. 2, 2015. Each value
is based on a scale of 1 to 5.
Relative Strength
2.0
IBM is slightly underperforming relative to its peers.
Overall Yield Attractiveness
3.5
IBM's dividend yield is above the industry average.
Dividend Reliability
4.0
IBM has been paying dividends for 98 years, and we its dividend yield is safe.
Dividend Uptrend
4.0
IBM has shown steady and generous dividends, and has increased its payouts each year.
Earnings Growth
3.0
IBM's earnings estimates are flat.
Read more about the DARS™ Rating System here.

Dividend.com - 2016 Stock Guide
114
Dividend.com 2016 Forecast for IBM
Potential Catalysts
● Above-average dividend growth. IBM has increased its quarterly dividend by 14%
compounded annually over the past five years. This is because the company continues to
generate strong free cash flow.
● High free cash flow generation. IBM's trailing 12-month dividend payments represent
just 34% of its free cash flow, which is a very modest level that leaves the door open for
another double-digit dividend raise next year.
● High dividend yield. IBM stock yields 3.7%, which represents a 10-year high for the
stock.
Potential Concerns
● Eroding hardware business. IBM’s total revenue has decreased for 14 consecutive
quarters, largely because of the divestitures of several hardware businesses, including
semiconductor manufacturing.
● The rising U.S. dollar is eroding revenue growth. Revenue fell 13% last quarter, and
negative foreign exchange translations caused 12% revenue decline.
Bottom Line
IBM is in the middle of a huge transformation. The company is getting out of technology
hardware, and instead is reinvesting in newer growth areas like the cloud, security and big data.
This is starting to bear fruit—as the high-growth businesses collectively grew revenue by 27%
year over year. Cloud revenue has now reached $9.4 billion in the trailing 12 months, but IBM is
a very large company, so this turnaround will take time. However, IBM has a high dividend yield
and strong dividend growth, and remains a good stock for dividend investors.
Additional Resources for IBM
● Dividend.com Profile Page for IBM
● Full Dividend Payout History for IBM
Intel Corporation (INTC)
2015 Range: 24.870 - 37.740 Avg. Volume: 27,761,700
Market Cap: 165.05B P/E Ratio (2016): 14.76
2015 EPS Est: 2.230 2016 EPS Est: 2.370
Annualized Div: 0.96 Div. Yield: 2.79%
Payout Ratio (2015): 0.43 Payout Ratio (2016): 0.41
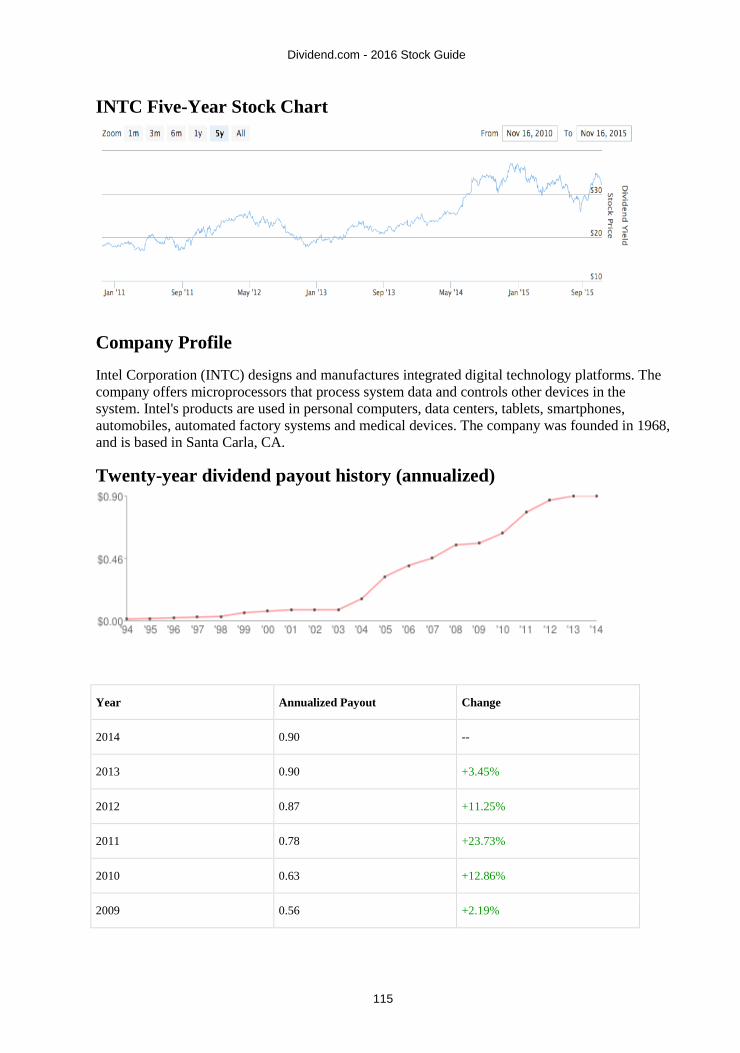
Dividend.com - 2016 Stock Guide
115
INTC Five-Year Stock Chart
Company Profile
Intel Corporation (INTC) designs and manufactures integrated digital technology platforms. The
company offers microprocessors that process system data and controls other devices in the
system. Intel's products are used in personal computers, data centers, tablets, smartphones,
automobiles, automated factory systems and medical devices. The company was founded in 1968,
and is based in Santa Carla, CA.
Twenty-year dividend payout history (annualized)
Year Annualized Payout Change
2014 0.90 --
2013 0.90 +3.45%
2012 0.87 +11.25%
2011 0.78 +23.73%
2010 0.63 +12.86%
2009 0.56 +2.19%

Dividend.com - 2016 Stock Guide
116
2008 0.55 +21.24%
2007 0.45 +13.00%
2006 0.40 +25.00%
2005 0.32 +100.00%
2004 0.16 +100.00%
2003 0.08 --
2002 0.08 --
2001 0.08 +14.29%
2000 0.07 +16.67%
1999 0.06 +84.62%
1998 0.03 +18.18%
1997 0.03 +22.22%
1996 0.02 +28.57%
1995 0.02 +27.18%
1994 0.01 -99.68%
Dividend.com DARS™ Ratings for INTC
Below are Dividend.com's proprietary DARS™ Ratings for INTC as of Dec. 2, 2015. Each value
is based on a scale of 1 to 5.
Relative Strength
4.0
INTC is outperforming much of the market.
Overall Yield Attractiveness
3.0
INTC's dividend yield is just average.
Dividend Reliability
3.0
INTC has been paying dividends for 19 years, and we feel its dividend yield is relatively
safe.

Dividend.com - 2016 Stock Guide
117
Dividend Uptrend
3.0
INTC has shown consistency in its payouts, but any increases have been small.
Earnings Growth
4.0
INTC's earnings estimates have been raised nicely.
Read more about the DARS™ Rating System here.
Dividend.com 2016 Forecast for INTC
Potential Catalysts
● High growth in data centers and the Internet of Things should boost earnings growth next
year.
● Intel is a cheap stock. Trading for 14 times earnings, Intel trades for a 26% discount to
the S&P 500 valuation.
● Intel stock yields 3.7%, which is significantly above both the market and the technology
sector.
Potential Concerns
● As consumers and businesses perform more computing functions on smartphones and
tablets, sales of PCs are falling. Global PC shipments fell 10% last quarter.
● An inability to meaningfully penetrate mobile. Intel’s mobile devices business lost $4
billion last year.
Bottom Line
Intel is investing aggressively in high-growth areas like mobile, but the results have not been seen
yet. Thankfully, Intel grew revenue in data centers by 12% last quarter. Revenue in data centers
hit a record $4.1 billion last quarter. And, the Internet of Things grew by 10%, year-over-year.
Intel’s dividend growth has slowed in recent years, but the stock offers a high yield and is a
worthwhile stock for income investors.
Additional Resources for INTC
● Dividend.com Profile Page for INTC
● Full Dividend Payout History for INTC

Dividend.com - 2016 Stock Guide
118
Johnson & Johnson (JNJ)
2015 Range: 81.7900 - 107.3900 Avg. Volume: 8,015,500
Market Cap: 287.10B P/E Ratio (2016): 16.16
2015 EPS Est: 6.1800 2016 EPS Est: 6.4200
Annualized Div: 3.00 Div. Yield: 2.94%
Payout Ratio (2015): 0.49 Payout Ratio (2016): 0.47
JNJ Five-Year Stock Chart
Company Profile
Johnson & Johnson (JNJ) is a holding company that researches, develops, and manufactures a
diversified range of products in the healthcare field. The company has three segments: Consumer,
Pharmaceutical, and Medical Devices and Diagnostics. JNJ was founded in 1887, and is based in
New Brunswick, NJ. As a consumer-facing company, JNJ is widely affected by the general
economic environment. Other factors include government policy regarding regulation, challenges
inherent in new product development, such as patents and regulatory approval, and trends
towards health care cost containment. Johnson & Johnson has been paying dividends since 1963,
and has consistently increased them every year. Johnson & Johnson is a dividend aristocrat, and
pays its dividend every quarter.

Dividend.com - 2016 Stock Guide
119
Twenty-year dividend payout history (annualized)
Year Annualized Payout Change
2014 2.76 +43.01%
2013 1.93 -19.58%
2012 2.40 +6.67%
2011 2.25 +6.64%
2010 2.11 +9.33%
2009 1.93 +7.52%
2008 1.80 +10.80%
2007 1.62 +11.34%
2006 1.46 +14.12%
2005 1.28 +16.44%
2004 1.10 +18.38%
2003 0.93 +16.35%
2002 0.80 +13.57%
2001 0.70 +12.90%
2000 0.62 +13.76%
1999 0.55 +12.37%
1998 0.49 +14.12%

Dividend.com - 2016 Stock Guide
120
1997 0.43 +15.65%
1996 0.37 +14.84%
1995 0.32 +13.27%
1994 0.28 -68.61%
Dividend.com DARS™ Ratings for JNJ
Below are Dividend.com's proprietary DARS™ Ratings for JNJ as of Dec. 2, 2015. Each value is
based on a scale of 1 to 5.
Relative Strength
3.0
JNJ is performing in-line with the market or better.
Overall Yield Attractiveness
3.0
JNJ's dividend yield is just average.
Dividend Reliability
4.5
JNJ has been paying dividends for 67 years, and we feel its dividend yield is extremely safe.
Dividend Uptrend
4.5
JNJ has been increasing its dividends at a superb pace, and is well-positioned to continue to
do so.
Earnings Growth
2.0
JNJ has seen its earnings estimates slightly lowered.
Read more about the DARS™ Rating System here.
Dividend.com 2016 Forecast for JNJ
Potential Catalysts
● A diversified and high-quality business model. Approximately 70% of revenue comes
from No. 1 or No. 2 global leadership positions in its respective markets.
● An excellent balance sheet. Johnson & Johnson is one of only three U.S. companies to
hold a triple-A credit rating from Standard & Poor’s.
● Strong dividend growth. Johnson & Johnson has increased its dividend for 53 years in a
row, which places it on the Dividend Aristocrat list.

Dividend.com - 2016 Stock Guide
121
Potential Concerns
● The strong U.S. dollar. As a major multinational, Johnson & Johnson’s revenue growth
was cut by eight full percentage points last quarter, due to unfavorable currency
translations.
● Generic competition. Sales of Olysio fell 96% in the United States last quarter, due to
intensifying competition from generic drugs.
Bottom Line
Johnson & Johnson is seeing near-term pressure on earnings from the rising U.S. dollar and
generic competition. But the company remains highly profitable, and generates a lot of cash flow.
This is used to regularly increase dividends each year. The stock yields 3% and can be the
foundation of a dividend portfolio.
Additional Resources for JNJ
● Dividend.com Profile Page for JNJ
● Full Dividend Payout History for JNJ
J.P. Morgan Chase & Co. (JPM)
2015 Range: 50.07 - 70.61 Avg. Volume: 14,657,000
Market Cap: 241.60B P/E Ratio (2016): 10.57
2015 EPS Est: 5.95 2016 EPS Est: 6.21
Annualized Div: 1.76 Div. Yield: 2.74%
Payout Ratio (2015): 0.3 Payout Ratio (2016): 0.28
JPM Five-Year Stock Chart

Dividend.com - 2016 Stock Guide
122
Company Profile
JPMorgan Chase & Co. (JPM) is a multinational banking and financial services company. The
company provides investment banking, financial services for consumers and small businesses,
commercial banking, financial transaction processing, asset management and private equity
management. Based out of New York, New York, it is the largest bank in the United States in
term of assets. It was formed in 2000 when JP Morgan & Co. merged with Chase Manhattan
Corporation. The JP Morgan brand is used for investment and private banking while the Chase
brand is used for credit card services, retail, and commercial banking. Following the financial
crisis, JPMorgan Chase & Co. is subject to substantial regulation from the Securities and
Exchange Commission (SEC). JPM settled a case with the Justice Department over the value of
mortgage backed securities it sold prior to the financial crisis and paid a fine of $13B. JPM has
been paying dividends since 1993, and while the dividends were cut following the financial crisis,
they have been steadily increased since 2011. JPM pays its dividend quarterly.
Twenty-year dividend payout history (annualized)
Year Annualized Payout Change
2014 1.56 +14.71%
2013 1.36 +18.26%
2012 1.15 +43.75%
2011 0.80 +300.00%
2010 0.20 -62.26%
2009 0.53 -65.13%
2008 1.52 +5.56%
2007 1.44 +5.88%
2006 1.36 --
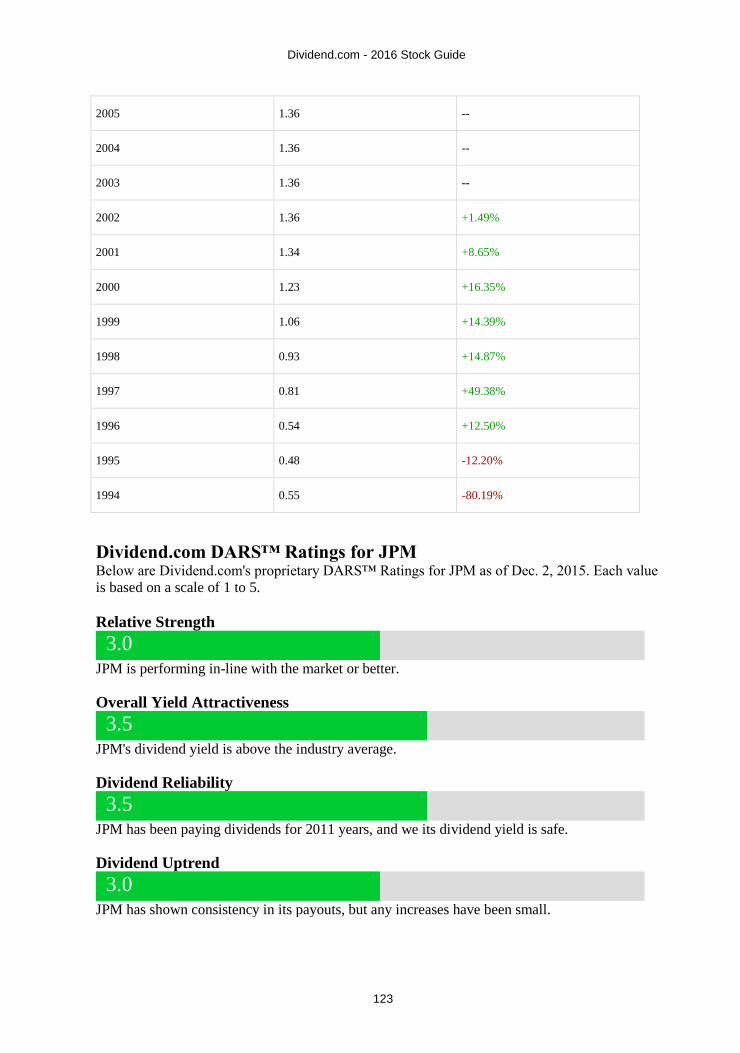
Dividend.com - 2016 Stock Guide
123
2005 1.36 --
2004 1.36 --
2003 1.36 --
2002 1.36 +1.49%
2001 1.34 +8.65%
2000 1.23 +16.35%
1999 1.06 +14.39%
1998 0.93 +14.87%
1997 0.81 +49.38%
1996 0.54 +12.50%
1995 0.48 -12.20%
1994 0.55 -80.19%
Dividend.com DARS™ Ratings for JPM
Below are Dividend.com's proprietary DARS™ Ratings for JPM as of Dec. 2, 2015. Each value
is based on a scale of 1 to 5.
Relative Strength
3.0
JPM is performing in-line with the market or better.
Overall Yield Attractiveness
3.5
JPM's dividend yield is above the industry average.
Dividend Reliability
3.5
JPM has been paying dividends for 2011 years, and we its dividend yield is safe.
Dividend Uptrend
3.0
JPM has shown consistency in its payouts, but any increases have been small.

Dividend.com - 2016 Stock Guide
124
Earnings Growth
3.0
JPM's earnings estimates are flat.
Read more about the DARS™ Rating System here.
Dividend.com 2016 Forecast for JPM
Potential Catalysts
● Rising investment banking activity across the world – driven by increased mergers and
acquisitions activity – is a promising catalyst heading into 2016.
● Improving Tier ratios will allow the company greater access to liquidity and higher
earnings growth. JP Morgan achieved a strong 11.4% common equity Tier 1 ratio last
quarter.
● The stock yields 2.6% and trades for an attractive valuation of 11 times earnings and 1.1
times book value.
Potential Concerns
● The company continues to suffer high legal costs. JP Morgan set aside $1 billion last
quarter for legal expenses. This is negative for earnings growth.
● Revenue fell 6% last quarter, due to poor performance in the company’s mortgage
business.
Bottom Line
As the financial sector recovers from the financial crisis and Great Recession, JP Morgan is
growing its dividend at high rates. The company increased its dividend by 10% this year. Future
dividend growth is likely, as corporate finance activity continues to be robust. With an above-
average dividend yield plus dividend growth, JP Morgan is an attractive dividend stock in the
financial sector.
Additional Resources for JPM
● Dividend.com Profile Page for JPM
● Full Dividend Payout History for JPM

Dividend.com - 2016 Stock Guide
125
Kellogg Company (K)
2015 Range: 61.13 - 72.34 Avg. Volume: 1,997,160
Market Cap: 25.28B P/E Ratio (2016): 19.33
2015 EPS Est: 3.49 2016 EPS Est: 3.69
Annualized Div: 2.00 Div. Yield: 2.81%
Payout Ratio (2015): 0.57 Payout Ratio (2016): 0.54
K Five-Year Stock Chart
Company Profile
Kellogg Company (K) is a food manufacturer that focuses on cereals and snack foods. It makes
its various cereals, cookies, crackers, and snacks under the brands Kellogg's, Keebler, Cheez-It,
Murray, Austin, and Famous Amos brands. These products are manufactured by the company in
17 countries and marketed in more than 180 countries. Kellogg was founded in 1906 and is
headquartered in Battle Creek, Michigan. Kellogg is affected by price increases in agricultural
commodities, fuel, and labor. As well, Kellogg is regulated for food quality and safety, which can
largely affect Kellogg’s brand and results. Kellogg has been paying dividends since 1925, and has
increased them annually since 2005. Kellogg pays its dividends quarterly.
Twenty-year dividend payout history (annualized)

Dividend.com - 2016 Stock Guide
126
Year Annualized Payout Change
2014 1.90 +5.56%
2013 1.80 +3.45%
2012 1.74 +4.19%
2011 1.67 +7.05%
2010 1.56 +9.09%
2009 1.43 +10.00%
2008 1.30 +8.15%
2007 1.20 +5.62%
2006 1.14 +7.16%
2005 1.06 +4.94%
2004 1.01 --
2003 1.01 --
2002 1.01 --
2001 1.01 +1.61%
2000 1.00 +3.75%
1999 0.96 +4.35%
1998 0.92 +5.75%
1997 0.87 +7.41%
1996 0.81 +8.00%
1995 0.75 +7.14%
1994 0.70 -55.13%
Dividend.com DARS™ Ratings for K
Below are Dividend.com's proprietary DARS™ Ratings for K as of Dec. 2, 2015. Each value is
based on a scale of 1 to 5.

Dividend.com - 2016 Stock Guide
127
Relative Strength
3.0
K is performing in-line with the market or better.
Overall Yield Attractiveness
3.5
K's dividend yield is above the industry average.
Dividend Reliability
4.5
K has been paying dividends for 88 years, and we feel its dividend yield is extremely safe.
Dividend Uptrend
3.0
K has shown consistency in its payouts, but any increases have been small.
Earnings Growth
3.0
K's earnings estimates are flat.
Read more about the DARS™ Rating System here.
Dividend.com 2016 Forecast for K
Potential Catalysts
● Stable core business model. As a major food company, Kellogg enjoys a recession-
resistant business. Consumers will always need to eat, even when the economy enters
recession. This provides a great deal of stability to the company.
● Reliable dividends. Kellogg has paid dividends to shareholders since 1925.
● Strong brand name. Along with General Mills, Kellogg forms a virtual duopoly in the
cereal industry.
Potential Concerns
● Cereal is not a growth industry. Health-conscious consumers are taking a more negative
view of cereal for its lack of nutritional benefits and high sugar content.
● Low dividend growth. As the company invests in higher-growth businesses, dividend
growth is slowing. Kellogg only increased its dividend by 2% this year, which barely
meets inflation.
● The strengthening U.S. dollar caused total sales to decline by 6% through the first three
quarters of the fiscal year.

Dividend.com - 2016 Stock Guide
128
Bottom Line
Kellogg is a stable dividend stock with a long history of reliable payouts, but it is a company
struggling to keep up with changing consumer preferences. Kellogg has not made a meaningful
entry into organics, arguably the best growth area in the food business. Along with the rising U.S.
dollar, investors should not expect much growth. With that said, the stock offers a secure 3%
yield.
Additional Resources for K
● Dividend.com Profile Page for K
● Full Dividend Payout History for K
(KHC)
2015 Range: 61.42 - 81.20 Avg. Volume: 3,263,200
Market Cap: 87.48B P/E Ratio (2016): 24.19
2015 EPS Est: 3.24 2016 EPS Est: 2.98
Annualized Div: 2.30 Div. Yield: 3.08%
Payout Ratio (2015): 0.71 Payout Ratio (2016): 0.77
KHC Five-Year Stock Chart

Dividend.com - 2016 Stock Guide
129
Twenty-year dividend payout history (annualized)
Year Annualized Payout Change
Dividend.com DARS™ Ratings for KHC
Below are Dividend.com's proprietary DARS™ Ratings for KHC as of Dec. 2, 2015. Each value
is based on a scale of 1 to 5.
Relative Strength
3.0
KHC is performing in-line with the market or better.
Overall Yield Attractiveness
3.5
KHC's dividend yield is above the industry average.
Dividend Reliability
4.5
KHC has been paying dividends for 2011 years, and we feel its dividend yield is extremely
safe.
Dividend Uptrend
3.5
KHC has shown steady and generous dividends, and has increased its payouts each year.
Earnings Growth
3.0
KHC's earnings estimates are flat.
Read more about the DARS™ Rating System here.

Dividend.com - 2016 Stock Guide
130
Dividend.com 2016 Forecast for KHC
Potential Catalysts
● A global powerhouse in the food and beverage industry. With the merger complete, the
combined company has a huge portfolio of more than 200 brands, eight of which each
generate at least $1 billion in annual sales.
● A high dividend yield and dividend growth. The stock yields 3.1% and recently raised its
dividend by 4%, which is solidly above inflation.
● Significant potential for cost synergies related to the merger. Management believes it can
eliminate $1.5 billion in annual expenses by the end of 2017. This would be a catalyst for
future earnings growth.
Potential Concerns
● The merger between Kraft and Heinz has been very costly. Kraft-Heinz lost $303 million
last quarter. This was far worse than the $8 million loss reported in the same quarter last
year.
● Falling organic sales are a concern. Even when excluding foreign exchange effects,
Kraft-Heinz reported a 2% decline in currency-neutral sales, an indication of lower
demand for its products.
Bottom Line
Kraft-Heinz is in the middle of a long process to combine two of the world’s biggest food
companies. This is weighing on its results, but the company will likely return to growth
next year. In the meantime, Kraft-Heinz is a strong dividend stock with dividend growth
likely to reach the mid-single digits over the next several years.
Additional Resources for KHC
● Dividend.com Profile Page for KHC
● Full Dividend Payout History for KHC
Kimberly-Clark Corporation (KMB)
2015 Range: 103.04 - 124.81 Avg. Volume: 1,595,950
Market Cap: 45.15B P/E Ratio (2016): 20.12
2015 EPS Est: 5.76 2016 EPS Est: 6.18
Annualized Div: 3.52 Div. Yield: 2.87%
Payout Ratio (2015): 0.61 Payout Ratio (2016): 0.57

Dividend.com - 2016 Stock Guide
131
KMB Five-Year Stock Chart
Company Profile
Kimberly-Clark Corp (KMB) is a personal care product manufacturer. The company is known for
its various products, including Kleenex, Huggies, Kotex, Depend, and Scott. Kimberly-Clark
operates in four segments: Personal Care, Consumer Tissue, K-C Professional, and Other and
Healthcare. The company was founded in 1872, and is based in Dallas, TX. Kimberly-Clark has
been paying dividends since 1972. Kimberly-Clark is a dividend aristocrat that has been
increasing dividends consistently annually since 1973. Kimberly-Clark pays its dividends
quarterly.
Twenty-year dividend payout history (annualized)
Year Annualized Payout Change
2014 3.36 +3.70%
2013 3.24 +9.46%
2012 2.96 +5.71%
2011 2.80 +6.06%
2010 2.64 +10.00%
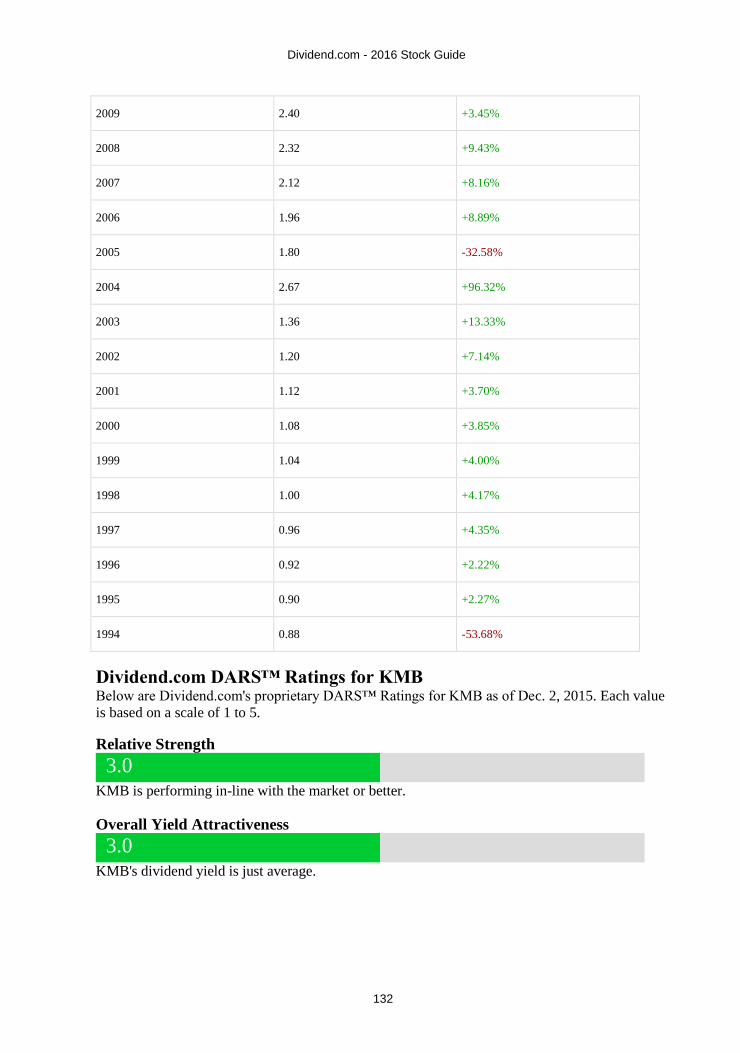
Dividend.com - 2016 Stock Guide
132
2009 2.40 +3.45%
2008 2.32 +9.43%
2007 2.12 +8.16%
2006 1.96 +8.89%
2005 1.80 -32.58%
2004 2.67 +96.32%
2003 1.36 +13.33%
2002 1.20 +7.14%
2001 1.12 +3.70%
2000 1.08 +3.85%
1999 1.04 +4.00%
1998 1.00 +4.17%
1997 0.96 +4.35%
1996 0.92 +2.22%
1995 0.90 +2.27%
1994 0.88 -53.68%
Dividend.com DARS™ Ratings for KMB
Below are Dividend.com's proprietary DARS™ Ratings for KMB as of Dec. 2, 2015. Each value
is based on a scale of 1 to 5.
Relative Strength
3.0
KMB is performing in-line with the market or better.
Overall Yield Attractiveness
3.0
KMB's dividend yield is just average.
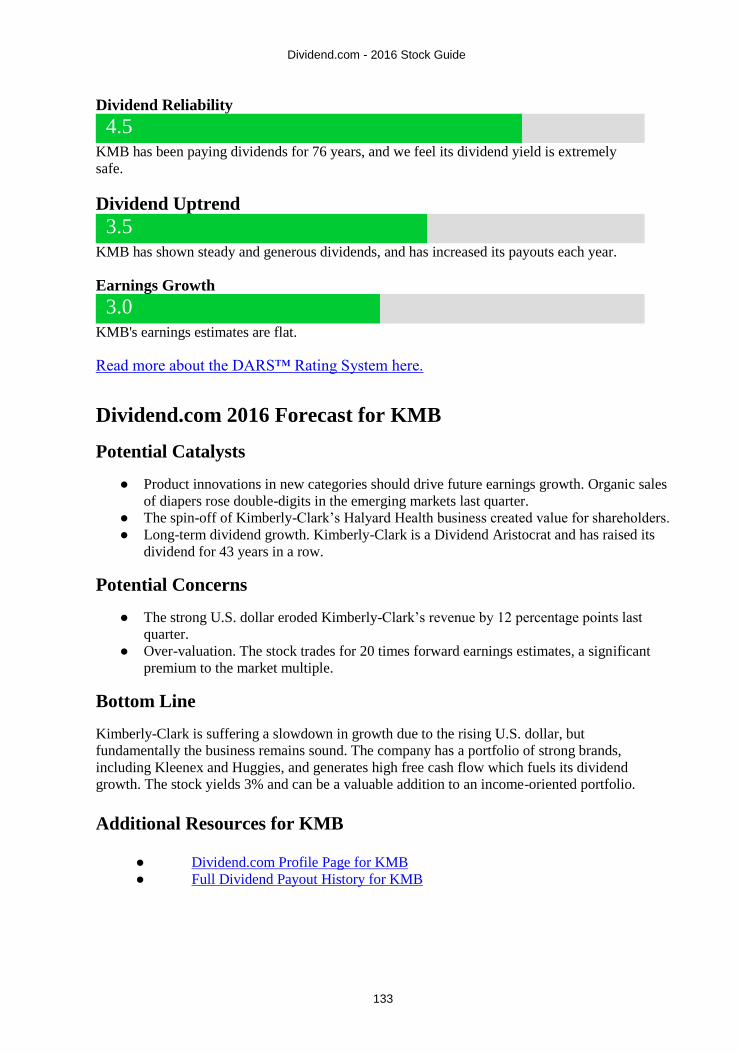
Dividend.com - 2016 Stock Guide
133
Dividend Reliability
4.5
KMB has been paying dividends for 76 years, and we feel its dividend yield is extremely
safe.
Dividend Uptrend
3.5
KMB has shown steady and generous dividends, and has increased its payouts each year.
Earnings Growth
3.0
KMB's earnings estimates are flat.
Read more about the DARS™ Rating System here.
Dividend.com 2016 Forecast for KMB
Potential Catalysts
● Product innovations in new categories should drive future earnings growth. Organic sales
of diapers rose double-digits in the emerging markets last quarter.
● The spin-off of Kimberly-Clark’s Halyard Health business created value for shareholders.
● Long-term dividend growth. Kimberly-Clark is a Dividend Aristocrat and has raised its
dividend for 43 years in a row.
Potential Concerns
● The strong U.S. dollar eroded Kimberly-Clark’s revenue by 12 percentage points last
quarter.
● Over-valuation. The stock trades for 20 times forward earnings estimates, a significant
premium to the market multiple.
Bottom Line
Kimberly-Clark is suffering a slowdown in growth due to the rising U.S. dollar, but
fundamentally the business remains sound. The company has a portfolio of strong brands,
including Kleenex and Huggies, and generates high free cash flow which fuels its dividend
growth. The stock yields 3% and can be a valuable addition to an income-oriented portfolio.
Additional Resources for KMB
● Dividend.com Profile Page for KMB
● Full Dividend Payout History for KMB

Dividend.com - 2016 Stock Guide
134
Kinder Morgan Inc (KMI)
2015 Range: 15.06 - 44.71 Avg. Volume: 32,441,400
Market Cap: 35.73B P/E Ratio (2016): 21.07
2015 EPS Est: 0.70 2016 EPS Est: 0.76
Annualized Div: 2.04 Div. Yield: 12.75%
Payout Ratio (2015): 2.91 Payout Ratio (2016): 2.68
KMI Five-Year Stock Chart
Company Profile
Kinder Morgan, Inc. (KMI) is a transportation and energy storage company in North America.
The company operates in five segments: Products Pipelines-KMP, Natural Gas Pipelines-KMP,
CO2-KMP, Terminals-KMP and Kinder Morgan Canada-KMP. KMI was founded 1997, and is
based in Houston, TX. It operates largely through its subsidiary, Kinder Morgan Energy Partners,
L.P. (KMP), as well as El Paso Pipeline Partners, L.P. (EPB), and KMI relies greatly on the
performance of these two limited partnerships. KMI is affected by pipeline tariff rates and other
regulatory requirements. KMI has been paying a dividend since 1993, and has been increasing it
steadily since 2011. KMI pays its dividend quarterly.
Twenty-year dividend payout history (annualized)

Dividend.com - 2016 Stock Guide
135
Year Annualized Payout Change
2014 1.70 +44.07%
2013 1.18 -11.94%
2012 1.34 +123.33%
2011 0.60 -82.14%
Dividend.com DARS™ Ratings for KMI
Below are Dividend.com's proprietary DARS™ Ratings for KMI as of Dec. 2, 2015. Each value
is based on a scale of 1 to 5.
Relative Strength
2.0
KMI is slightly underperforming relative to its peers.
Overall Yield Attractiveness
3.5
KMI's dividend yield is above the industry average.
Dividend Reliability
4.0
KMI has been paying dividends for 2011 years, and we its dividend yield is safe.
Dividend Uptrend
3.5
KMI has shown steady and generous dividends, and has increased its payouts each year.
Earnings Growth
2.5
KMI's earnings estimates are flat.
Read more about the DARS™ Rating System here.

Dividend.com - 2016 Stock Guide
136
Dividend.com 2016 Forecast for KMI
Potential Catalysts
● A fee-based business that operates similarly to a toll road. Kinder Morgan collects fees
based on volumes, not on the price of the underlying commodity.
● Only Kinder Morgan’s carbon dioxide business relies heavily on a supportive commodity
price. This allows Kinder Morgan to continue generating high amounts of cash flow,
even when oil prices decline.
● A very high yield of 8.5%, which is significantly higher than the S&P 500 Index average
of just 2%.
Potential Concerns
● Lower demand for oil in the United States will slow demand for new energy
infrastructure projects.
● Kinder Morgan is exposed to higher interest rates, which will increase its cost of capital.
Midstream companies have high financing requirements to build and maintain their asset
base.
Bottom Line
Kinder Morgan has continued to increase its dividend this year, even though commodity prices
are falling. That speaks to the reliability of its fee-based business model. Kinder Morgan expects
to grow its dividend by 6%-10% next year. Its current 8.5% yield should be very attractive for
dividend investors.
Additional Resources for KMI
● Dividend.com Profile Page for KMI
● Full Dividend Payout History for KMI
The Coca-Cola Company (KO)
2015 Range: 36.56 - 43.85 Avg. Volume: 15,282,600
Market Cap: 186.75B P/E Ratio (2016): 20.74
2015 EPS Est: 1.99 2016 EPS Est: 2.07
Annualized Div: 1.32 Div. Yield: 3.11%
Payout Ratio (2015): 0.66 Payout Ratio (2016): 0.64

Dividend.com - 2016 Stock Guide
137
KO Five-Year Stock Chart
Company Profile
The Coca-Cola Company (KO) is the world’s largest beverage company. The company has more
than 500 beverage products on the market including softdrinks, waters, enhanced waters, juices
and juice drinks, ready-to-drink teas and coffees, and energy and sports drinks. The company was
founded in 1919 and is based in Atlanta, GA. Coca-Cola is largely affected by health trends, as
obesity and other health concerns reduce demand for some of Coca-Cola’s products. Coca-Cola is
also affected by increasing competition and changing consumer tastes in the nonalcoholic
beverage market. Coca-Cola has been paying dividends since 1920, and has increased dividends
annually since 1963. It is known as a dividend aristocrat, which means it has been increasing
dividends for more than 25 years consecutively. Coca-Cola pays its dividends quarterly.
Twenty-year dividend payout history (annualized)
Year Annualized Payout Change
2014 1.22 +8.93%
2013 1.12 -26.80%
2012 1.53 -18.62%
2011 1.88 +6.82%
2010 1.76 +7.32%
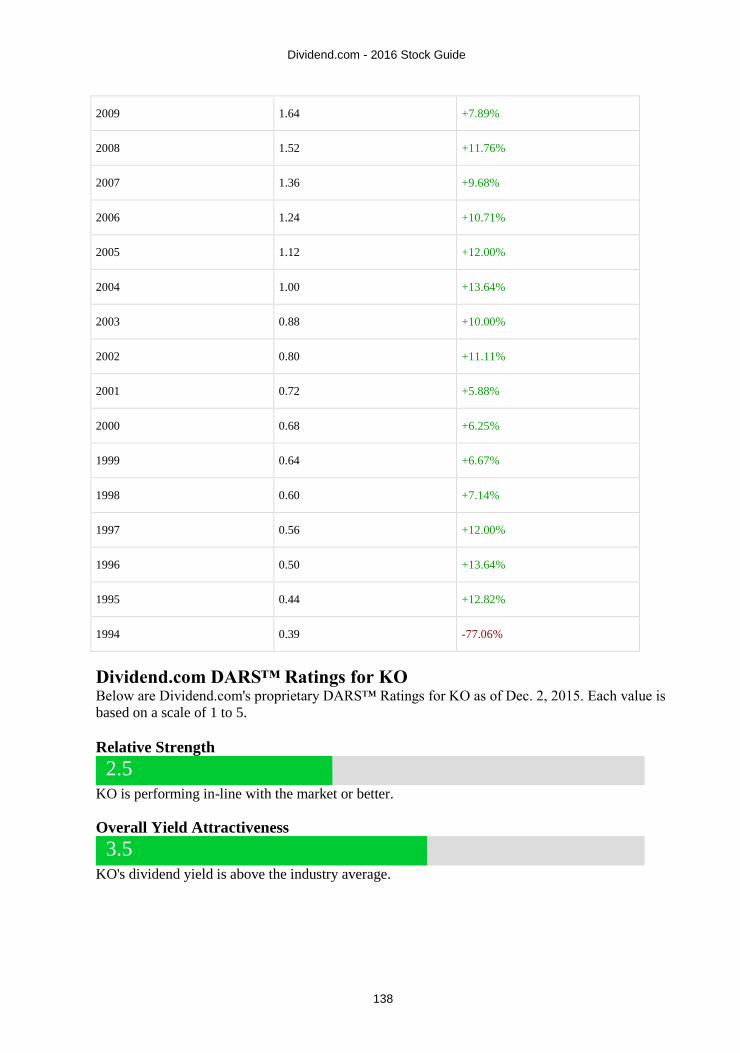
Dividend.com - 2016 Stock Guide
138
2009 1.64 +7.89%
2008 1.52 +11.76%
2007 1.36 +9.68%
2006 1.24 +10.71%
2005 1.12 +12.00%
2004 1.00 +13.64%
2003 0.88 +10.00%
2002 0.80 +11.11%
2001 0.72 +5.88%
2000 0.68 +6.25%
1999 0.64 +6.67%
1998 0.60 +7.14%
1997 0.56 +12.00%
1996 0.50 +13.64%
1995 0.44 +12.82%
1994 0.39 -77.06%
Dividend.com DARS™ Ratings for KO
Below are Dividend.com's proprietary DARS™ Ratings for KO as of Dec. 2, 2015. Each value is
based on a scale of 1 to 5.
Relative Strength
2.5
KO is performing in-line with the market or better.
Overall Yield Attractiveness
3.5
KO's dividend yield is above the industry average.

Dividend.com - 2016 Stock Guide
139
Dividend Reliability
4.5
KO has been paying dividends for 91 years, and we feel its dividend yield is extremely safe.
Dividend Uptrend
4.5
KO has been increasing its dividends at a superb pace, and is well-positioned to continue to
do so.
Earnings Growth
2.0
KO has seen its earnings estimates slightly lowered.
Read more about the DARS™ Rating System here.
Dividend.com 2016 Forecast for KO
Potential Catalysts
● Coca-Cola is one of the most valuable and easily recognized brands in the world. The
company enjoys pricing power and vast economies of scale thanks to its superb
distribution.
● High leverage over retailers creates a sizable economic moat and high barriers to entry in
its industry.
● A long history of dividend growth. The stock yields 3% and Coca-Cola has increased its
dividend for more than 50 years in a row.
Potential Concerns
● Slowing sales of soft drinks in developed nations could be a significant structural
headwind going forward.
● The rising U.S. dollar is eroding sales growth, and that will likely continue into next year.
● Overly reliant on soft drinks like soda, which constitute the majority of Coca-Cola’s
revenue.
Bottom Line
Coca-Cola needs to more effectively respond to changing consumer tastes. Consumers,
particularly in developed markets like the United States, are taking a harsher view of soda for its
calorie and sugar content. Coca-Cola has a presence in teas and juices, but will need to invest
more in these higher-growth businesses in order to continue growing its dividend at high rates.
Additional Resources for KO
● Dividend.com Profile Page for KO
● Full Dividend Payout History for KO

Dividend.com - 2016 Stock Guide
140
Lockheed Martin Corporation (LMT)
2015 Range: 181.91 - 227.91 Avg. Volume: 1,390,730
Market Cap: 66.53B P/E Ratio (2016): 17.73
2015 EPS Est: 11.35 2016 EPS Est: 12.21
Annualized Div: 6.60 Div. Yield: 3.05%
Payout Ratio (2015): 0.58 Payout Ratio (2016): 0.54
LMT Five-Year Stock Chart
Company Profile
Lockheed Martin Corporation (LMT) is a global aerospace, defense, security, and technology
company engaged in the research, design, development, manufacture, integration and sustainment
of advanced technology systems, products and services. The company operates in four business
segments: Aeronautics, Electronic Systems, Information Systems & Global Solutions, and Space
Systems. The firm is one of the largest defense contractors with much of its revenue coming from
military sales. Lockheed was established in 1995 with the merger of Lockheed Corporation and
Martin Marietta, and is headquartered in Bethesda, Maryland. Government policy on military
spending can greatly affect Lockheed’s business. Lockheed has been paying dividends since
1995, and has increased them consistently annually since 2003. Lockheed pays its dividends
quarterly.

Dividend.com - 2016 Stock Guide
141
Twenty-year dividend payout history (annualized)
Year Annualized Payout Change
2014 5.49 +14.85%
2013 4.78 +15.18%
2012 4.15 +27.69%
2011 3.25 +23.11%
2010 2.64 +12.82%
2009 2.34 +27.87%
2008 1.83 +24.49%
2007 1.47 +17.60%
2006 1.25 +19.05%
2005 1.05 +15.38%
2004 0.91 +59.65%
2003 0.57 +29.55%
2002 0.44 --
2001 0.44 --
2000 0.44 -50.00%
1999 0.88 +7.32%
1998 0.82 +2.50%

Dividend.com - 2016 Stock Guide
142
1997 0.80 --
1996 0.80 +14.31%
1995 0.70 +1.85%
1994 0.69 -43.68%
Dividend.com DARS™ Ratings for LMT
Below are Dividend.com's proprietary DARS™ Ratings for LMT as of Dec. 2, 2015. Each value
is based on a scale of 1 to 5.
Relative Strength
3.0
LMT is performing in-line with the market or better.
Overall Yield Attractiveness
3.5
LMT's dividend yield is above the industry average.
Dividend Reliability
4.5
LMT has been paying dividends for 16 years, and we feel its dividend yield is extremely
safe.
Dividend Uptrend
3.5
LMT has shown steady and generous dividends, and has increased its payouts each year.
Earnings Growth
3.0
LMT's earnings estimates are flat.
Read more about the DARS™ Rating System here.
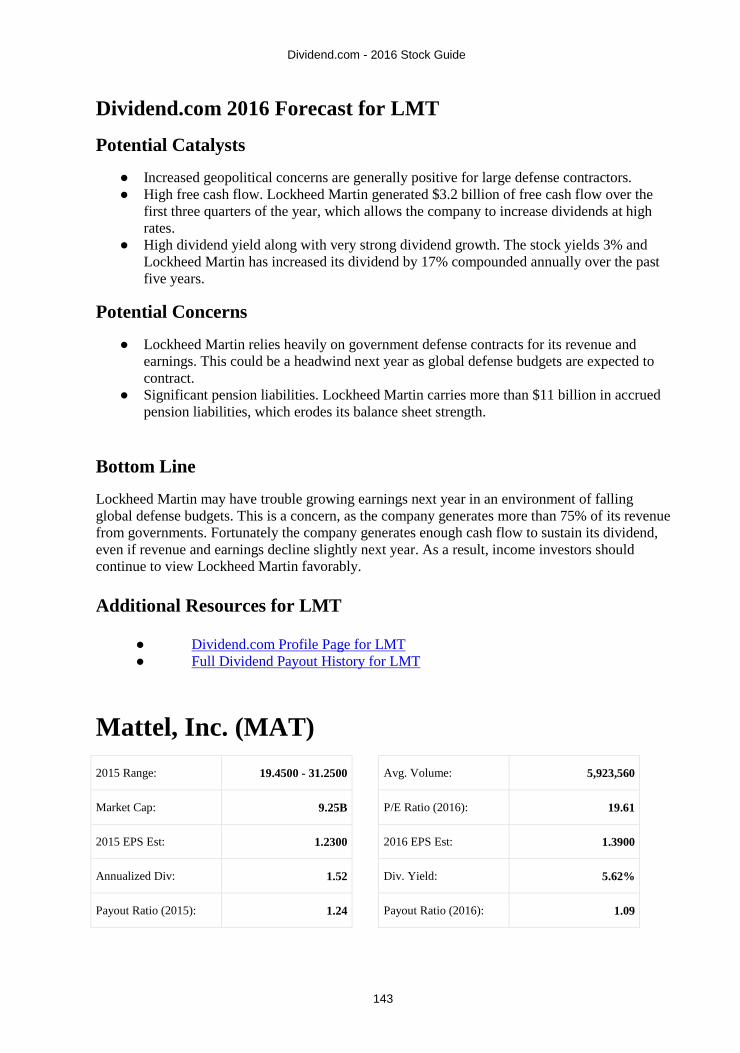
Dividend.com - 2016 Stock Guide
143
Dividend.com 2016 Forecast for LMT
Potential Catalysts
● Increased geopolitical concerns are generally positive for large defense contractors.
● High free cash flow. Lockheed Martin generated $3.2 billion of free cash flow over the
first three quarters of the year, which allows the company to increase dividends at high
rates.
● High dividend yield along with very strong dividend growth. The stock yields 3% and
Lockheed Martin has increased its dividend by 17% compounded annually over the past
five years.
Potential Concerns
● Lockheed Martin relies heavily on government defense contracts for its revenue and
earnings. This could be a headwind next year as global defense budgets are expected to
contract.
● Significant pension liabilities. Lockheed Martin carries more than $11 billion in accrued
pension liabilities, which erodes its balance sheet strength.
Bottom Line
Lockheed Martin may have trouble growing earnings next year in an environment of falling
global defense budgets. This is a concern, as the company generates more than 75% of its revenue
from governments. Fortunately the company generates enough cash flow to sustain its dividend,
even if revenue and earnings decline slightly next year. As a result, income investors should
continue to view Lockheed Martin favorably.
Additional Resources for LMT
● Dividend.com Profile Page for LMT
● Full Dividend Payout History for LMT
Mattel, Inc. (MAT)
2015 Range: 19.4500 - 31.2500 Avg. Volume: 5,923,560
Market Cap: 9.25B P/E Ratio (2016): 19.61
2015 EPS Est: 1.2300 2016 EPS Est: 1.3900
Annualized Div: 1.52 Div. Yield: 5.62%
Payout Ratio (2015): 1.24 Payout Ratio (2016): 1.09

Dividend.com - 2016 Stock Guide
144
MAT Five-Year Stock Chart
Company Profile
Mattel, Inc. (MAT) is the largest toy and game manufacturer in the United States. The company
makes toys under the brands Mattel, Barbie, Hot Wheels, Matchbox, Yu-Gi-Oh, Batman, Justice
League, Megaman, Fisher-Price, View-Master, Sesame Street, Barney, Dora the Explorer,
Winnie the Pooh, Power Wheels, American Girl, and many more. Mattel was founded in 1945
and is headquartered in El Segundo, California. Mattel is largely affected by the increasing
preference of children for video games, particularly in the mobile space. Mattel has been paying
dividends since 1991, and has increased them consecutively annually since 2010. Mattel pays its
dividends quarterly.
Twenty-year dividend payout history (annualized)
Year Annualized Payout Change
2014 1.52 +5.56%
2013 1.44 +16.13%
2012 1.24 +34.78%
2011 0.92 +10.84%
2010 0.83 +10.67%
2009 0.75 --

Dividend.com - 2016 Stock Guide
145
2008 0.75 --
2007 0.75 +15.38%
2006 0.65 +30.00%
2005 0.50 +11.11%
2004 0.45 +12.50%
2003 0.40 +700.00%
2002 0.05 -64.29%
2001 0.14 -48.15%
2000 0.27 -22.86%
1999 0.35 +2.04%
1998 0.34 +27.04%
1997 0.27 +12.50%
1996 0.24 +25.00%
1995 0.19 +25.00%
1994 0.15 -97.20%
Dividend.com DARS™ Ratings for MAT
Below are Dividend.com's proprietary DARS™ Ratings for MAT as of Dec. 2, 2015. Each value
is based on a scale of 1 to 5.
Relative Strength
2.5
MAT is performing in-line with the market or better.
Overall Yield Attractiveness
3.5
MAT's dividend yield is above the industry average.
Dividend Reliability
3.5
MAT has been paying dividends for 21 years, and we its dividend yield is safe.

Dividend.com - 2016 Stock Guide
146
Dividend Uptrend
3.5
MAT has shown steady and generous dividends, and has increased its payouts each year.
Earnings Growth
3.0
MAT's earnings estimates are flat.
Read more about the DARS™ Rating System here.
Dividend.com 2016 Forecast for MAT
Potential Catalysts
● Mattel is trying to turn its business around. Its acquisition of MEGA Brands allows the
company entry to a growth segment in the toy industry: construction toys.
● The stock yields 6.2%, which is more than three times the average dividend yield in the
S&P 500 Index.
Potential Concerns
● A structural shift threatens Mattel’s core business. Consumers are not buying dolls nearly
to the same extent as previous generation, as demand has declined.
● Mattel is burning through cash. Over the first six months of 2015, Mattel generated
negative free cash flow of $354 million.
● Without supporting free cash flow, Mattel is at risk of a dividend cut.
Bottom Line
Mattel stock carries a very high dividend yield, but this could prove to be a warning signal of a
future dividend cut.
Additional Resources for MAT
● Dividend.com Profile Page for MAT
● Full Dividend Payout History for MAT
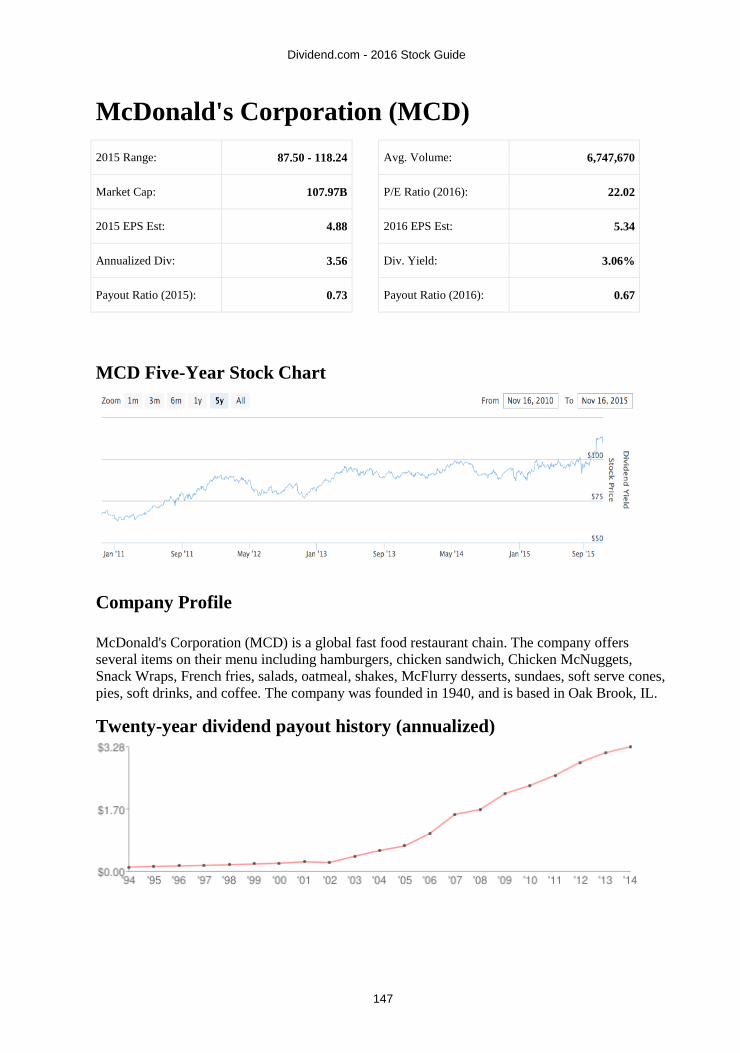
Dividend.com - 2016 Stock Guide
147
McDonald's Corporation (MCD)
2015 Range: 87.50 - 118.24 Avg. Volume: 6,747,670
Market Cap: 107.97B P/E Ratio (2016): 22.02
2015 EPS Est: 4.88 2016 EPS Est: 5.34
Annualized Div: 3.56 Div. Yield: 3.06%
Payout Ratio (2015): 0.73 Payout Ratio (2016): 0.67
MCD Five-Year Stock Chart
Company Profile
McDonald's Corporation (MCD) is a global fast food restaurant chain. The company offers
several items on their menu including hamburgers, chicken sandwich, Chicken McNuggets,
Snack Wraps, French fries, salads, oatmeal, shakes, McFlurry desserts, sundaes, soft serve cones,
pies, soft drinks, and coffee. The company was founded in 1940, and is based in Oak Brook, IL.
Twenty-year dividend payout history (annualized)

Dividend.com - 2016 Stock Guide
148
Year Annualized Payout Change
2014 3.28 +5.13%
2013 3.12 +8.71%
2012 2.87 +13.44%
2011 2.53 +11.95%
2010 2.26 +10.24%
2009 2.05 +26.15%
2008 1.63 +8.33%
2007 1.50 +50.00%
2006 1.00 +49.25%
2005 0.67 +21.82%
2004 0.55 +37.50%
2003 0.40 +70.21%
2002 0.24 -7.84%
2001 0.26 +18.60%
2000 0.22 +8.59%
1999 0.20 +12.50%
1998 0.18 +9.66%
1997 0.16 +9.56%
1996 0.15 +10.98%
1995 0.13 +13.06%
1994 0.12 -92.32%

Dividend.com - 2016 Stock Guide
149
Dividend.com DARS™ Ratings for MCD
Below are Dividend.com's proprietary DARS™ Ratings for MCD as of Dec. 2, 2015. Each value
is based on a scale of 1 to 5.
Relative Strength
2.5
MCD is performing in-line with the market or better.
Overall Yield Attractiveness
4.0
MCD's dividend yield is above the industry average.
Dividend Reliability
3.5
MCD has been paying dividends for 35 years, and we its dividend yield is safe.
Dividend Uptrend
3.5
MCD has shown steady and generous dividends, and has increased its payouts each year.
Earnings Growth
2.0
MCD has seen its earnings estimates slightly lowered.
Read more about the DARS™ Rating System here.
Dividend.com 2016 Forecast for MCD
Potential Catalysts
● The move to all-day breakfast could be a growth catalyst into 2016 and beyond. This was
a major catalyst for McDonald’s 4% growth in comparable restaurant sales last quarter.
● McDonald’s is accelerating franchising activity going forward. The company recently
raised its global franchise target to 4,000 restaurants by 2018, with a long-term goal to be
95% franchised.
● The new value menu could generate higher traffic, which would be a tailwind for sales
growth next year.
Potential Concerns
● Consumers are taking a harsher view of fast food, particularly in the United States. Fast-
casual competitors with healthier menu options are taking market share.
● McDonald’s suffered significant damage to its brand in China after a series of food
quality issues there. This caused emerging market sales to decline throughout 2015.

Dividend.com - 2016 Stock Guide
150
Bottom Line
McDonald’s sales and earnings are declining, but the company continues to generate enough free
cash flow to raise its dividend. McDonald’s has increased its dividend each year since paying its
first dividend in 1976. The stock yields 3.2% and provides regular dividend growth. For those
reasons, McDonald’s is a good stock pick for dividend investors.
Additional Resources for MCD
● Dividend.com Profile Page for MCD
● Full Dividend Payout History for MCD
3M Company (MMM)
2015 Range: 134.00 - 170.50 Avg. Volume: 2,532,780
Market Cap: 92.54B P/E Ratio (2016): 17.89
2015 EPS Est: 7.63 2016 EPS Est: 8.40
Annualized Div: 4.10 Div. Yield: 2.60%
Payout Ratio (2015): 0.54 Payout Ratio (2016): 0.49
MMM Five-Year Stock Chart

Dividend.com - 2016 Stock Guide
151
Company Profile
3M Company (MMM) is a diversified technology company. The company operates in six
business segments: Industrial and Transportation, Health Care, Consumer and Office,Safety,
Security and Protection Services, Display and Graphics, and Electro and Communications. 3M
was founded in 1929, and is based in St. Paul, MN. In February 2014, 3M acquired Treo
Solutions, a healthcare data intelligence and analytics company. 3M is largely affected by prices
for raw materials and purchased components, as well as improving operational efficiency and
productivity. 3M is a dividend aristocrat and has been consecutively increasing its dividend
annually since 1959. 3M pays its dividend quarterly.
Twenty-year dividend payout history (annualized)
Year Annualized Payout Change
2014 3.42 +7.72%
2013 3.18 +34.53%
2012 2.36 +7.27%
2011 2.20 +4.76%
2010 2.10 +2.94%
2009 2.04 +2.00%
2008 2.00 +4.17%
2007 1.92 +4.35%
2006 1.84 +9.52%
2005 1.68 +16.67%
2004 1.44 +9.09%
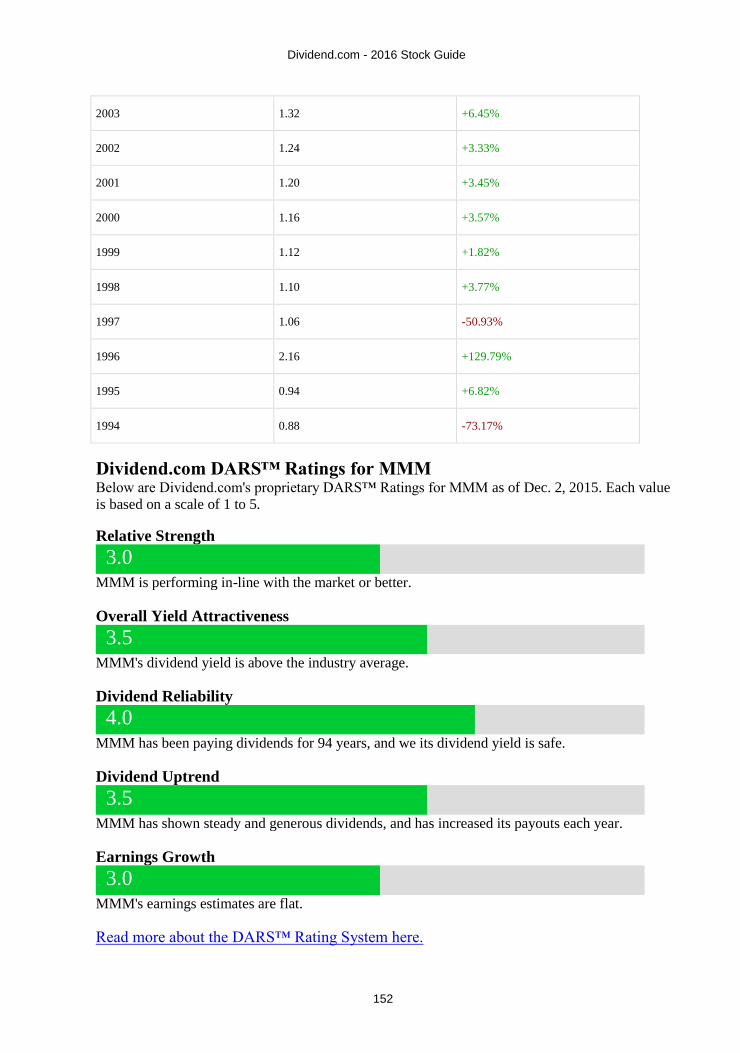
Dividend.com - 2016 Stock Guide
152
2003 1.32 +6.45%
2002 1.24 +3.33%
2001 1.20 +3.45%
2000 1.16 +3.57%
1999 1.12 +1.82%
1998 1.10 +3.77%
1997 1.06 -50.93%
1996 2.16 +129.79%
1995 0.94 +6.82%
1994 0.88 -73.17%
Dividend.com DARS™ Ratings for MMM
Below are Dividend.com's proprietary DARS™ Ratings for MMM as of Dec. 2, 2015. Each value
is based on a scale of 1 to 5.
Relative Strength
3.0
MMM is performing in-line with the market or better.
Overall Yield Attractiveness
3.5
MMM's dividend yield is above the industry average.
Dividend Reliability
4.0
MMM has been paying dividends for 94 years, and we its dividend yield is safe.
Dividend Uptrend
3.5
MMM has shown steady and generous dividends, and has increased its payouts each year.
Earnings Growth
3.0
MMM's earnings estimates are flat.
Read more about the DARS™ Rating System here.
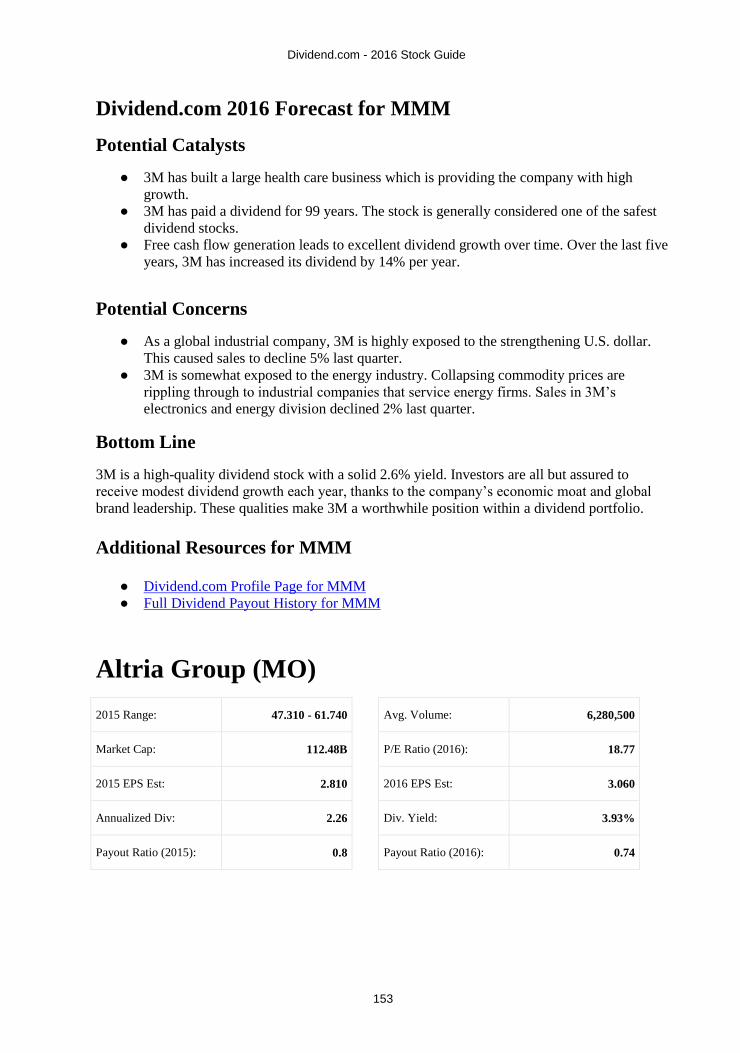
Dividend.com - 2016 Stock Guide
153
Dividend.com 2016 Forecast for MMM
Potential Catalysts
● 3M has built a large health care business which is providing the company with high
growth.
● 3M has paid a dividend for 99 years. The stock is generally considered one of the safest
dividend stocks.
● Free cash flow generation leads to excellent dividend growth over time. Over the last five
years, 3M has increased its dividend by 14% per year.
Potential Concerns
● As a global industrial company, 3M is highly exposed to the strengthening U.S. dollar.
This caused sales to decline 5% last quarter.
● 3M is somewhat exposed to the energy industry. Collapsing commodity prices are
rippling through to industrial companies that service energy firms. Sales in 3M’s
electronics and energy division declined 2% last quarter.
Bottom Line
3M is a high-quality dividend stock with a solid 2.6% yield. Investors are all but assured to
receive modest dividend growth each year, thanks to the company’s economic moat and global
brand leadership. These qualities make 3M a worthwhile position within a dividend portfolio.
Additional Resources for MMM
● Dividend.com Profile Page for MMM
● Full Dividend Payout History for MMM
Altria Group (MO)
2015 Range: 47.310 - 61.740 Avg. Volume: 6,280,500
Market Cap: 112.48B P/E Ratio (2016): 18.77
2015 EPS Est: 2.810 2016 EPS Est: 3.060
Annualized Div: 2.26 Div. Yield: 3.93%
Payout Ratio (2015): 0.8 Payout Ratio (2016): 0.74

Dividend.com - 2016 Stock Guide
154
MO Five-Year Stock Chart
Company Profile
Altria Group, Inc. (MO) is a holding company that owns cigarette maker Philip Morris USA. The
company also offers cigars through its John Middleton subsidiary and holds a portfolio of
leveraged and direct finance lease investments through its Philip Morris Capital Corporation. In
addition, MO owns an approximate 27% interest in beer brewer SABMiller plc. Altria was
founded in 1919 and is based in Richmond, Virginia.
Twenty-year dividend payout history (annualized)
Year Annualized Payout Change
2014 2.00 +8.70%
2013 1.84 +8.24%
2012 1.70 +7.59%
2011 1.58 +8.22%
2010 1.46 +10.61%
2009 1.32 -21.43%

Dividend.com - 2016 Stock Guide
155
2008 1.68 -44.92%
2007 3.05 -8.13%
2006 3.32 +8.50%
2005 3.06 +8.51%
2004 2.82 +6.82%
2003 2.64 +8.20%
2002 2.44 +48.78%
2001 1.64 -18.81%
2000 2.02 +9.78%
1999 1.84 +9.52%
1998 1.68 +5.00%
1997 1.60 +9.09%
1996 1.47 +20.55%
1995 1.22 +20.46%
1994 1.01 -70.47%
Dividend.com DARS™ Ratings for MO
Below are Dividend.com's proprietary DARS™ Ratings for MO as of Dec. 2, 2015. Each value is
based on a scale of 1 to 5.
Relative Strength
3.5
MO is outperforming much of the market.
Overall Yield Attractiveness
3.5
MO's dividend yield is above the industry average.
Dividend Reliability
5.0
MO has been paying dividends for 83 years, and we feel its dividend yield is extremely safe.
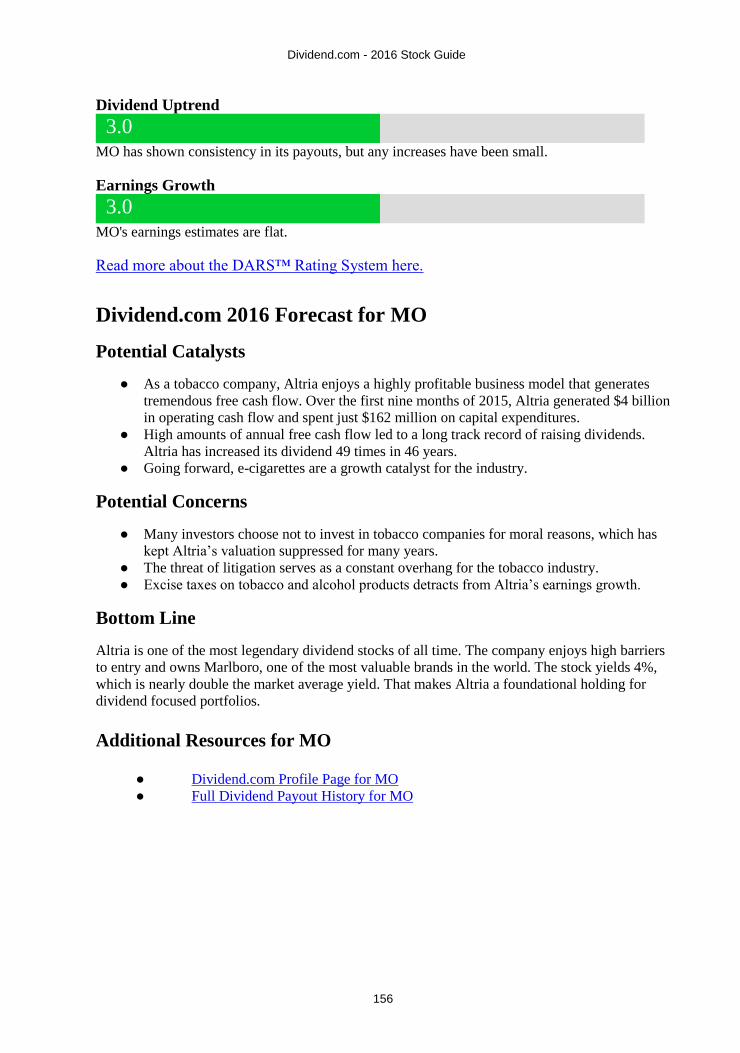
Dividend.com - 2016 Stock Guide
156
Dividend Uptrend
3.0
MO has shown consistency in its payouts, but any increases have been small.
Earnings Growth
3.0
MO's earnings estimates are flat.
Read more about the DARS™ Rating System here.
Dividend.com 2016 Forecast for MO
Potential Catalysts
● As a tobacco company, Altria enjoys a highly profitable business model that generates
tremendous free cash flow. Over the first nine months of 2015, Altria generated $4 billion
in operating cash flow and spent just $162 million on capital expenditures.
● High amounts of annual free cash flow led to a long track record of raising dividends.
Altria has increased its dividend 49 times in 46 years.
● Going forward, e-cigarettes are a growth catalyst for the industry.
Potential Concerns
● Many investors choose not to invest in tobacco companies for moral reasons, which has
kept Altria’s valuation suppressed for many years.
● The threat of litigation serves as a constant overhang for the tobacco industry.
● Excise taxes on tobacco and alcohol products detracts from Altria’s earnings growth.
Bottom Line
Altria is one of the most legendary dividend stocks of all time. The company enjoys high barriers
to entry and owns Marlboro, one of the most valuable brands in the world. The stock yields 4%,
which is nearly double the market average yield. That makes Altria a foundational holding for
dividend focused portfolios.
Additional Resources for MO
● Dividend.com Profile Page for MO
● Full Dividend Payout History for MO

Dividend.com - 2016 Stock Guide
157
Merck & Company Inc. (MRK)
2015 Range: 45.690 - 63.620 Avg. Volume: 11,984,500
Market Cap: 146.06B P/E Ratio (2016): 14.02
2015 EPS Est: 3.570 2016 EPS Est: 3.730
Annualized Div: 1.84 Div. Yield: 3.52%
Payout Ratio (2015): 0.52 Payout Ratio (2016): 0.49
MRK Five-Year Stock Chart
Company Profile
Merck & Co., Inc (MRK) is a Whitehouse Station, NJ based pharmaceutical company founded in
1891. The company is a global health care company that delivers health solutions through its
prescription medicines, vaccines, biologic therapies, animal health, and consumer care products,
which it markets directly and through its joint ventures. It is one of the seven largest
pharmaceutical companies in the world measured by market capitalization. Merck relies heavily
on patent protection, and when market exclusivity on their products expire the company generally
sees heavy losses in sales. As well, Merck relies on R&D to produce commercially successful
products. Merck is largely affected by regulations on its products. Merck has been paying a
dividend since 1970, and has increased its dividends annually since then, except for when
dividends remained stable from 2007 through 2009. Merck pays its dividends quarterly.

Dividend.com - 2016 Stock Guide
158
Twenty-year dividend payout history (annualized)
Year Annualized Payout Change
2014 1.77 +2.31%
2013 1.73 +2.37%
2012 1.69 +8.33%
2011 1.56 +2.63%
2010 1.52 --
2009 1.52 --
2008 1.52 --
2007 1.52 --
2006 1.52 --
2005 1.52 +1.33%
2004 1.50 -65.41%
2003 4.34 +205.35%
2002 1.42 +2.90%
2001 1.38 +9.52%
2000 1.26 +12.50%
1999 1.12 +13.13%
1998 0.99 +13.79%

Dividend.com - 2016 Stock Guide
159
1997 0.87 +17.57%
1996 0.74 +15.63%
1995 0.64 +10.34%
1994 0.58 -71.00%
Dividend.com DARS™ Ratings for MRK
Below are Dividend.com's proprietary DARS™ Ratings for MRK as of Dec. 2, 2015. Each value
is based on a scale of 1 to 5.
Relative Strength
3.0
MRK is performing in-line with the market or better.
Overall Yield Attractiveness
4.0
MRK's dividend yield is above the industry average.
Dividend Reliability
4.0
MRK has been paying dividends for 76 years, and we its dividend yield is safe.
Dividend Uptrend
2.5
MRK has shown consistency in its payouts, but any increases have been small.
Earnings Growth
3.5
MRK's earnings estimates have been raised nicely.
Read more about the DARS™ Rating System here.
Dividend.com 2016 Forecast for MRK
Potential Catalysts
● The aging population in the United States resulting in increased demand for health care
and higher health care spending.
● A robust portfolio and a diverse pipeline of new drugs could result in strong earnings
growth.

Dividend.com - 2016 Stock Guide
160
Potential Concerns
● Generic competition is a constant challenge for Big Pharma stocks such as Merck.
● Global exposure is a headwind because of the U.S. dollar. Last quarter, Merck’s sales
were reduced by 9 percentage points because of foreign exchange.
Bottom Line
Merck has a fundamental advantage because of its late-stage drug pipeline in critical growth areas
such as cancer, antibiotic resistance, hepatitis C and Alzheimer’s disease. Progress in any of these
areas should provide for significant revenue growth. Merck stock yields 3.4%, which is a
satisfactory yield and qualifies it as a good dividend stock.
Additional Resources for MRK
● Dividend.com Profile Page for MRK
● Full Dividend Payout History for MRK
Microsoft Corporation (MSFT)
2015 Range: 39.7200 - 56.2300 Avg. Volume: 35,613,100
Market Cap: 444.05B P/E Ratio (2016): 17.82
2015 EPS Est: 2.7600 2016 EPS Est: 3.1200
Annualized Div: 1.44 Div. Yield: 2.61%
Payout Ratio (2015): 0.52 Payout Ratio (2016): 0.46
MSFT Five-Year Stock Chart

Dividend.com - 2016 Stock Guide
161
Company Profile
Microsoft (MSFT) is a software company that focuses on developing and licensing products. The
company also designs and sells hardware, and delivers online advertisements to customers. MSFT
has five segments: Windows & Windows Live Division (Windows Division), Server and Tools,
Online Services Division (OSD), Microsoft Business Division (MBD), and Entertainment and
Devices Division (EDD). The company was founded in 1981, and is based in Redmond, WA.
Twenty-year dividend payout history (annualized)
Year Annualized Payout Change
2014 1.15 +18.56%
2013 0.97 +16.87%
2012 0.83 +22.06%
2011 0.68 +23.64%
2010 0.55 +5.77%
2009 0.52 +13.04%
2008 0.46 +12.20%
2007 0.41 +10.81%
2006 0.37 +15.63%
2005 0.32 +300.00%
2004 0.08 -66.67%
2003 0.24 -86.44%

Dividend.com - 2016 Stock Guide
162
Dividend.com DARS™ Ratings for MSFT
Below are Dividend.com's proprietary DARS™ Ratings for MSFT as of Dec. 2, 2015. Each value
is based on a scale of 1 to 5.
Relative Strength
3.5
MSFT is outperforming much of the market.
Overall Yield Attractiveness
3.5
MSFT's dividend yield is above the industry average.
Dividend Reliability
3.5
MSFT has been paying dividends for 8 years, and we its dividend yield is safe.
Dividend Uptrend
4.0
MSFT has shown steady and generous dividends, and has increased its payouts each year.
Earnings Growth
2.5
MSFT's earnings estimates are flat.
Read more about the DARS™ Rating System here.
Dividend.com 2016 Forecast for MSFT
Potential Catalysts
● Microsoft is one of the most valuable brands in the world, with software including
Microsoft Office and the Windows operating system, used everyday by millions of
people.
● The company is enjoying high growth from new areas such as the cloud. Office 365
revenue grew 70% last quarter, year-over-year.
● An excellent balance sheet. Microsoft is one of three U.S. companies to hold the triple-A
credit rating from Standard & Poor’s. The company holds $99 billion in cash and short-
term investments with just $27 billion of long-term debt.
Potential Concerns
● Slowing economic growth in the emerging markets such as Asia will threaten Microsoft’s
future growth potential.
● The Lumia phone business continues to perform poorly. Microsoft made a mistake
acquiring the Nokia handset division, which has cost the company billions of dollars in
write-downs.

Dividend.com - 2016 Stock Guide
163
Bottom Line
Microsoft has increased its dividend by 17% compounded annually over the past five years. And,
the stock yields 2.6%, which is above the S&P 500 average yield. The company generates
significant free cash flow and that should continue to fuel high dividend increases each year
going forward. That makes Microsoft an ideal holding for dividend investors.
Additional Resources for MSFT
● Dividend.com Profile Page for MSFT
● Full Dividend Payout History for MSFT
Nike Inc. (NKE)
2015 Range: 90.69 - 135.30 Avg. Volume: 4,488,790
Market Cap: 109.80B P/E Ratio (2016): 26.19
2015 EPS Est: 4.31 2016 EPS Est: 4.92
Annualized Div: 1.28 Div. Yield: 1.00%
Payout Ratio (2015): 0.3 Payout Ratio (2016): 0.26
Company Profile
Nike Inc (NKE) is a multinational manufacturer and retailer of footwear, apparel, equipment, and
accessories. The company markets its products in seven categories including Running,
Basketball, Soccer, Men's Training, Women's Training, NIKE Sportswear, and Action Sports.
The company sells its products in 190 countries, and employs 44,000 people worldwide. Nike
was established in 1964, and is headquartered in Washington County, Oregon. Nike operates in a
very competitive industry and greatly relies on its reputation and brand image. As well, demand
for Nike’s products is largely seasonal. Nike has been paying a dividend since 1984, and has
consecutively increased its dividend since 2002. Nike pays its dividend quarterly.
Twenty-year dividend payout history (annualized)

Dividend.com - 2016 Stock Guide
164
Year Annualized Payout Change
2014 1.00 +14.94%
2013 0.87 -32.56%
2012 1.29 --
2011 1.29 +15.18%
2010 1.12 +9.80%
2009 1.02 +8.51%
2008 0.94 +19.75%
2007 0.79 +20.77%
2006 0.65 +22.64%
2005 0.53 +24.71%
2004 0.43 +37.10%
2003 0.31 +24.00%
2002 0.25 +38.89%
2001 0.18 -25.00%
2000 0.24 --
1999 0.24 --
1998 0.24 +14.29%
1997 0.21 +29.23%
1996 0.16 +23.81%
1995 0.13 +23.53%
1994 0.11 -90.76%

Dividend.com - 2016 Stock Guide
165
Dividend.com DARS™ Ratings for NKE
Below are Dividend.com's proprietary DARS™ Ratings for NKE as of Dec. 2, 2015. Each value
is based on a scale of 1 to 5.
Relative Strength
4.0
NKE is outperforming much of the market.
Overall Yield Attractiveness
2.5
NKE's dividend yield is just average.
Dividend Reliability
4.0
NKE has been paying dividends for 27 years, and we its dividend yield is safe.
Dividend Uptrend
3.5
NKE has shown steady and generous dividends, and has increased its payouts each year.
Earnings Growth
3.0
NKE's earnings estimates are flat.
Read more about the DARS™ Rating System here.
Dividend.com 2016 Forecast for NKE
Potential Catalysts
● High growth. Nike grew earnings by 23% last quarter, even with the strong U.S. dollar as
a headwind.
● Nike is building a massive women’s apparel business. Its women’s line is now a $5
billion business by annual revenue, and is growing faster than the men’s business.
Potential Concerns
● The strong U.S. dollar has significantly impacted Nike’s growth, as Nike generates a
significant amount of revenue from the emerging markets.
● Over-valuation is a concern. Nike stock trades for 32 times earnings, which is a 68%
premium valuation to the S&P 500 average.
● Low dividend yield of less than 1% is not suitable for investors looking to generate
income.

Dividend.com - 2016 Stock Guide
166
Bottom Line
Nike is a high-quality company with a very strong brand. The company is growing, but the stock
offers investors little margin of safety. With over-valuation and a low dividend yield, income
investors would be better off picking a different dividend stock with a higher yield.
Additional Resources for NKE
● Dividend.com Profile Page for NKE
● Full Dividend Payout History for NKE
Pepsico Inc. (PEP)
2015 Range: 76.48 - 103.44 Avg. Volume: 4,603,280
Market Cap: 143.12B P/E Ratio (2016): 20.26
2015 EPS Est: 4.56 2016 EPS Est: 4.85
Annualized Div: 2.81 Div. Yield: 2.87%
Payout Ratio (2015): 0.62 Payout Ratio (2016): 0.58
PEP Five-Year Stock Chart
Company Profile
PepsiCo, Inc. (PEP) is a beverage maker and bottler, and a producer of snack foods. Its famous
beverage brands include its namesake Pepsi-Cola, Mountain Dew, Tropicana, Gatorade and Diet
Pepsi. Its snack foods units makes products under the Doritos, Ruffles, Lays, and Fritos brands.
PepsiCo was founded in 1898 and is headquartered in Purchase, New York. PepsiCo is largely
affected by tough competition, economic conditions, and the ability to source raw materials. As
well, PepsiCo relies heavily on promoting a positive brand image, and any damage to that brand
image could have large negative consequences on PepsiCo’s stock. PepsiCo is a dividend
aristocrat, and has been increasing its dividends since 1973. PepsiCo pays its dividend quarterly.

Dividend.com - 2016 Stock Guide
167
Twenty-year dividend payout history (annualized)
Year Annualized Payout Change
2014 2.53 +13.06%
2013 2.24 +5.29%
2012 2.13 +5.06%
2011 2.03 +7.14%
2010 1.89 +6.48%
2009 1.78 -43.65%
2008 3.15 +121.05%
2007 1.43 +22.84%
2006 1.16 +14.85%
2005 1.01 +18.82%
2004 0.85 +34.92%
2003 0.63 +5.88%
2002 0.60 +3.48%
2001 0.58 +3.60%
2000 0.56 +3.74%
1999 0.54 +3.88%
1998 0.52 +5.10%
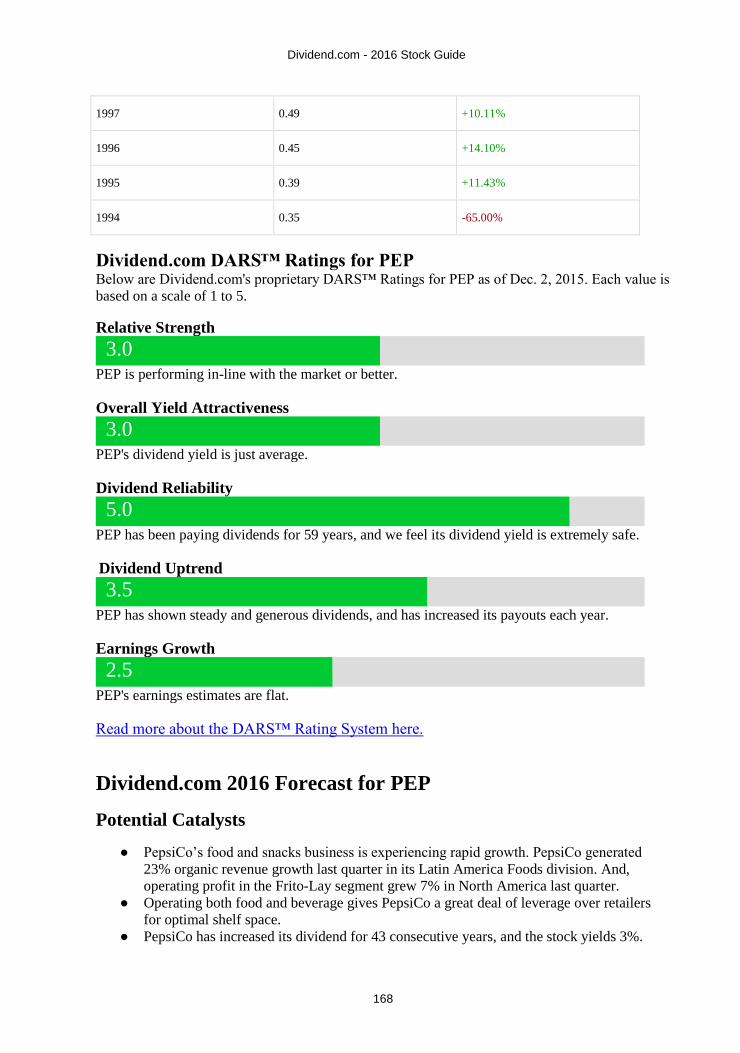
Dividend.com - 2016 Stock Guide
168
1997 0.49 +10.11%
1996 0.45 +14.10%
1995 0.39 +11.43%
1994 0.35 -65.00%
Dividend.com DARS™ Ratings for PEP
Below are Dividend.com's proprietary DARS™ Ratings for PEP as of Dec. 2, 2015. Each value is
based on a scale of 1 to 5.
Relative Strength
3.0
PEP is performing in-line with the market or better.
Overall Yield Attractiveness
3.0
PEP's dividend yield is just average.
Dividend Reliability
5.0
PEP has been paying dividends for 59 years, and we feel its dividend yield is extremely safe.
Dividend Uptrend
3.5
PEP has shown steady and generous dividends, and has increased its payouts each year.
Earnings Growth
2.5
PEP's earnings estimates are flat.
Read more about the DARS™ Rating System here.
Dividend.com 2016 Forecast for PEP
Potential Catalysts
● PepsiCo’s food and snacks business is experiencing rapid growth. PepsiCo generated
23% organic revenue growth last quarter in its Latin America Foods division. And,
operating profit in the Frito-Lay segment grew 7% in North America last quarter.
● Operating both food and beverage gives PepsiCo a great deal of leverage over retailers
for optimal shelf space.
● PepsiCo has increased its dividend for 43 consecutive years, and the stock yields 3%.

Dividend.com - 2016 Stock Guide
169
Potential Concerns
● Consumers in the United States are taking a harsher view of soda for its high calorie and
sugar. As a result, soda sales have been in a decade-long decline.
● The rising U.S. dollar is a big challenge for PepsiCo. Unfavorable currency fluctuations
cut PepsiCo’s revenue growth by 10 percentage points last quarter.
Bottom Line
PepsiCo is not as vulnerable as Coca-Cola to declining demand for soda, since its revenue is
evenly split between food and beverages. This is helping PepsiCo continue to grow earnings and
its dividend. The company raised its dividend by 7% this year. PepsiCo stock is a high quality
holding for income investors.
Additional Resources for PEP
● Dividend.com Profile Page for PEP
● Full Dividend Payout History for PEP
Pfizer Inc. (PFE)
2015 Range: 28.47 - 36.46 Avg. Volume: 35,223,500
Market Cap: 200.31B P/E Ratio (2016): 13.75
2015 EPS Est: 2.18 2016 EPS Est: 2.36
Annualized Div: 1.20 Div. Yield: 3.73%
Payout Ratio (2015): 0.55 Payout Ratio (2016): 0.51
PFE Five-Year Stock Chart

Dividend.com - 2016 Stock Guide
170
Company Profile
Pfizer Inc. (PFE) is a research-based, global biopharmaceutical company. The company operates
in five segments: Primary Care; Specialty Care and Oncology; Established Products and
Emerging Markets; Animal Health and Consumer Healthcare, and Nutrition. The company offers
several types of products, including human and animal biologic and small molecule medicines
and vaccines, as well as nutritional products and consumer healthcare products. PFE was founded
in 1942, and is based in New York. In May 2014, Pfizer put in a bid of $117 billion for
AstraZeneca, its competitor, that was rejected. Pfizer's sales and stock price are affected by
industry-specific factors such as generic drugs, intellectual property rights, and regulatory
pressures. As well, as Pfizer has multiple international operations, significant portions of Pfizer's
revenues are affected by foreign exchange rates. Pfizer's dividend was cut in 2009, but has
increased annually since then. Pfizer has been paying dividends since 1980 and has not missed
one since then.
Twenty-year dividend payout history (annualized)
Year Annualized Payout Change
2014 1.04 +8.33%
2013 0.96 +9.09%
2012 0.88 +10.00%
2011 0.80 +11.11%
2010 0.72 -10.00%
2009 0.80 -37.50%
2008 1.28 +10.34%
2007 1.16 +20.83%
2006 0.96 +26.32%
2005 0.76 +11.76%

Dividend.com - 2016 Stock Guide
171
2004 0.68 +13.33%
2003 0.60 +15.38%
2002 0.52 +18.18%
2001 0.44 +22.22%
2000 0.36 +17.39%
1999 0.31 +21.06%
1998 0.25 +11.75%
1997 0.23 +13.34%
1996 0.20 +15.39%
1995 0.17 +10.62%
1994 0.16 -93.81%
Dividend.com DARS™ Ratings for PFE
Below are Dividend.com's proprietary DARS™ Ratings for PFE as of Dec. 2, 2015. Each value is
based on a scale of 1 to 5.
Relative Strength
3.0
PFE is performing in-line with the market or better.
Overall Yield Attractiveness
3.5
PFE's dividend yield is above the industry average.
Dividend Reliability
4.5
PFE has been paying dividends for 110 years, and we feel its dividend yield is extremely
safe.
Dividend Uptrend
3.5
PFE has shown steady and generous dividends, and has increased its payouts each year.

Dividend.com - 2016 Stock Guide
172
Earnings Growth
3.0
PFE's earnings estimates are flat.
Read more about the DARS™ Rating System here.
Dividend.com 2016 Forecast for PFE
Potential Catalysts
● Pfizer made a large acquisition of Hospira, which gives the company entry into new
markets and should result in significant cost savings each year.
● Pfizer generates significant cash flow that it uses to pay dividends. The stock yields
3.5%, which is significantly above the market average.
● A successful merger with Allergan will provide even more margin expansion
opportunity.
Potential Concerns
● Pfizer continues to suffer from the loss of Lipitor to generic competition. Lipitor was
formerly Pfizer’s best-selling drug.
● Pfizer does not have a diversified business model. The company is nearly entirely reliant
on pharmaceuticals. Unlike many of its competitors, Pfizer does not have a significant
consumer business.
Bottom Line
Pfizer is still trying to build its pipeline in the aftermath of losing Lipitor to generic competition.
This is working, as Pfizer has 10 assets in immuno-oncology, an emerging growth area. For
dividend investors, Pfizer offers a strong yield backed by cash flow and dividend growth.
Additional Resources for PFE
● Dividend.com Profile Page for PFE
● Full Dividend Payout History for PFE
The Procter & Gamble Company (PG)
2015 Range: 65.020 - 93.890 Avg. Volume: 9,064,530
Market Cap: 216.35B P/E Ratio (2016): 18.8
2015 EPS Est: 3.760 2016 EPS Est: 4.230
Annualized Div: 2.65 Div. Yield: 3.38%
Payout Ratio (2015): 0.7 Payout Ratio (2016): 0.63

Dividend.com - 2016 Stock Guide
173
PG Five-Year Stock Chart
Company Profile
The Procter & Gamble Company (PG) is a consumer goods provider. The company sells its
products in more than 180 countries, and sells various items including beauty and grooming
products and home-good products. Currently, the company has two main segments: Global
Business Units and Beauty and Grooming and Household Care. P&G was founded in 1837 and
incorporated in 1905, and is based in Cincinnati, OH. P&G has 22 brands that have more than a
billion dollars in net annual sales. In April 2014, P&G sold its Pet Food brands Iams, Eukanuba
and Natura to the confectionery company Mars. As a consumer based company, P&G's stock
price generally moves in line with the economy as a whole. P&G has raised its dividends for 58
consecutive years, and has paid dividends for 124 consecutive years. The dividend has grown at
an annualized rate of 8.5% for the last five years.
Twenty-year dividend payout history (annualized)
Year Annualized Payout Change
2014 2.53 +7.01%
2013 2.37 +7.03%
2012 2.21 +7.49%
2011 2.06 +9.07%

Dividend.com - 2016 Stock Guide
174
2010 1.89 +9.65%
2009 1.72 +10.97%
2008 1.55 +13.97%
2007 1.36 +12.40%
2006 1.21 +11.01%
2005 1.09 +11.51%
2004 0.98 +13.01%
2003 0.87 -23.79%
2002 1.14 +55.48%
2001 0.73 +8.96%
2000 0.67 +10.74%
1999 0.61 +12.66%
1998 0.54 +12.52%
1997 0.48 +12.29%
1996 0.43 +13.33%
1995 0.38 +13.64%
1994 0.33 -68.27%
Dividend.com DARS™ Ratings for PG
Below are Dividend.com's proprietary DARS™ Ratings for PG as of Dec. 2, 2015. Each value is
based on a scale of 1 to 5.
Relative Strength
3.0
PG is performing in-line with the market or better.
Overall Yield Attractiveness
3.0
PG's dividend yield is just average.

Dividend.com - 2016 Stock Guide
175
Dividend Reliability
5.0
PG has been paying dividends for 120 years, and we feel its dividend yield is extremely safe.
Dividend Uptrend
4.0
PG has shown steady and generous dividends, and has increased its payouts each year.
Earnings Growth
2.5
PG's earnings estimates are flat.
Read more about the DARS™ Rating System here.
Dividend.com 2016 Forecast for PG
Potential Catalysts
● P&G holds a huge portfolio of top brands including Crest, Tide, Charmin and Pampers.
● A long history of raising dividends. The company has increased dividends for more than
50 years.
● P&G is aggressively selling off low-growth brands. It can reinvest the proceeds in buying
back stock, which will be a catalyst for earnings growth next year.
Potential Concerns
● The strong U.S. dollar has severely impacted growth. Foreign exchange fluctuations cut
P&G’s revenue growth by 11 percentage points last quarter.
● P&G may still be too big to grow. The company may need another year of further
divestments to effectively streamline its portfolio.
Bottom Line
P&G stock yields 3.5%, which is close to a ten-year high for the stock. Dividend growth has
slowed down in recent years as the company focuses on its huge restructuring—but its dividend
increases still beat inflation. As a result, risk-averse investors should view P&G stock favorably
for its reliable dividend.
Additional Resources for PG
● Dividend.com Profile Page for PG
● Full Dividend Payout History for PG

Dividend.com - 2016 Stock Guide
176
Philip Morris International (PM)
2015 Range: 75.27 - 90.08 Avg. Volume: 4,090,030
Market Cap: 135.38B P/E Ratio (2016): 18.75
2015 EPS Est: 4.43 2016 EPS Est: 4.66
Annualized Div: 4.08 Div. Yield: 4.68%
Payout Ratio (2015): 0.92 Payout Ratio (2016): 0.88
PM Five-Year Stock Chart
Company Profile
Philip Morris International Inc. (PM) is a global cigarette and tobacco company. The company,
which sells its products in over 200 countries, offers several products including cigarettes, cigars,
fine-cut rolling tobacco, snuff, rolling papers and tubes. PM was found in 1900, and is based in
New York, New York. PM faces quite a bit of regulatory pressure with regard to the sale and
advertising of its products. Global trends away from cigarette usage have also placed pressure on
PM. PM has been paying a dividend since 2008, and has consistently raised its dividend annually
since then.
Twenty-year dividend payout history (annualized)

Dividend.com - 2016 Stock Guide
177
Year Annualized Payout Change
2014 3.88 +8.38%
2013 3.58 +10.49%
2012 3.24 +14.89%
2011 2.82 +15.57%
2010 2.44 +8.93%
2009 2.24 +45.45%
2008 1.54 -39.19%
Dividend.com DARS™ Ratings for PM
Below are Dividend.com's proprietary DARS™ Ratings for PM as of Dec. 2, 2015. Each value is
based on a scale of 1 to 5.
Relative Strength
2.5
PM is performing in-line with the market or better.
Overall Yield Attractiveness
4.0
PM's dividend yield is above the industry average.
Dividend Reliability
3.5
PM has been paying dividends for 3 years, and we its dividend yield is safe.
Dividend Uptrend
3.5
PM has shown steady and generous dividends, and has increased its payouts each year.
Earnings Growth
3.5
PM's earnings estimates have been raised nicely.
Read more about the DARS™ Rating System here.

Dividend.com - 2016 Stock Guide
178
Dividend.com 2016 Forecast for PM
Potential Catalysts
● Exposure to emerging markets, where strong economic growth and high smoking rates
are positive forward catalysts.
● High free cash flow generation. Tobacco is a low capital intensive business, which
provides for minimal capital expenditures.
● High dividend yield of 4.8% is near the top of the consumer staples sector.
Potential Concerns
● The strong U.S. dollar cut Philip Morris International’s revenue by 16 percentage points
last quarter.
● High risk of increased political and regulatory scrutiny of cigarettes in underdeveloped
nations.
Bottom Line
Tobacco companies face high regulatory risk and constant threat of litigation. But, they have still
been able to pass along regular dividend increases each year. Philip Morris offers a very high
yield which should be viewed positively by investors interested in income generation.
Additional Resources for PM
● Dividend.com Profile Page for PM
● Full Dividend Payout History for PM
Public Storage Inc. (PSA)
2015 Range: 178.4200 - 251.7400 Avg. Volume: 685,858
Market Cap: 42.90B P/E Ratio (2016): 25.65
2015 EPS Est: 8.7700 2016 EPS Est: 9.6600
Annualized Div: 6.80 Div. Yield: 2.73%
Payout Ratio (2015): 0.78 Payout Ratio (2016): 0.7

Dividend.com - 2016 Stock Guide
179
PSA Five-Year Stock Chart
Company Profile
Public Storage (PSA) is a real estate investment trust (REIT) that owns and operates self-storage
facilities in the United States and Europe. The company operates in three segments: Domestic
Self-Storage segment, Europe Self-Storage segment, and Commercial. Public Storage was
founded in 1972 and is based in Glendale, California.
Twenty-year dividend payout history (annualized)
Year Annualized Payout Change
2014 5.60 +8.74%
2013 5.15 +17.05%
2012 4.40 +20.55%
2011 3.65 +35.04%
2010 2.70 +22.86%
2009 2.20 -21.43%

Dividend.com - 2016 Stock Guide
180
2008 2.80 +40.00%
2007 2.00 --
2006 2.00 +5.26%
2005 1.90 +5.56%
2004 1.80 --
2003 1.80 --
2002 1.80 +102.25%
2001 0.89 -39.86%
2000 1.48 -1.33%
1999 1.50 +70.45%
1998 0.88 --
1997 0.88 --
1996 0.88 -20.72%
1995 1.11 +30.59%
1994 0.85 -78.09%
Dividend.com DARS™ Ratings for PSA
Below are Dividend.com's proprietary DARS™ Ratings for PSA as of Dec. 2, 2015.
Each value is based on a scale of 1 to 5.
Relative Strength
3.0
PSA is performing in-line with the market or better.
Overall Yield Attractiveness
3.0
PSA's dividend yield is just average.
Dividend Reliability
4.5
PSA has been paying dividends for 30 years, and we feel its dividend yield is extremely safe.

Dividend.com - 2016 Stock Guide
181
Dividend Uptrend
3.5
PSA has shown steady and generous dividends, and has increased its payouts each year.
Earnings Growth
3.0
PSA's earnings estimates are flat.
Read more about the DARS™ Rating System here.
Dividend.com 2016 Forecast for PSA
Potential Catalysts
● High growth in funds from operation – a crucial metric for REITs. Over the first nine
months of the fiscal year, FFO grew 9%, year-over-year.
● Unique niche. Public Storage operates in self-storage units, a relatively thin business in
terms of competition. This provides a wide economic moat and high barrier to entry.
● Rapid earnings growth leads to rapid dividend growth. Public Storage increased its
dividend by 21% in 2015.
Potential Concerns
● REITs are exposed to higher interest rate that raise costs of debt capital financing.
● Relatively low yield of 2.9%, which is well below the REIT average.
Bottom Line
Public Storage does not offer a high yield for a REIT, but it makes up for this with very high
dividend growth that is unusual for REITs. This is because it grows funds from operation at high
rates. As a result, investors should view Public Storage as a great option for dividend growth, but
not such a good option for those investors who need income now.
Additional Resources for PSA
● Dividend.com Profile Page for PSA
● Full Dividend Payout History for PSA

Dividend.com - 2016 Stock Guide
182
Reynolds American Inc (RAI)
2015 Range: 31.350 - 49.560 Avg. Volume: 6,311,990
Market Cap: 64.52B P/E Ratio (2016): 19.38
2015 EPS Est: 1.990 2016 EPS Est: 2.330
Annualized Div: 1.44 Div. Yield: 3.20%
Payout Ratio (2015): 0.72 Payout Ratio (2016): 0.62
RAI Five-Year Stock Chart
Company Profile
Reynolds American, Inc. (RAI) is a tobacco holding company in the U.S. Its holdings include R.
J. Reynolds Tobacco Company, American Snuff Company, Santa Fe Natural Tobacco Company
and Niconovum. RAI is 42% owned by the U.K.'s British American Tobacco. In 2013, Reynolds
American's operating companies sold about 26% of all cigarettes sold in the US. The company
was founded in 2004, and is based in Winston-Salem, NC. Reynolds American is largely affected
by a global consumer preference shift away from cigarette usage. As well, Reynolds American is
also affected by the deterioration of its brands, as it continues to lose market share in the U.S.
cigarette retail market. Reynolds American has been paying dividends since 2004, and has been
increasing them consecutively annually since then. Reynolds American pays its dividends
quarterly.
Twenty-year dividend payout history (annualized)

Dividend.com - 2016 Stock Guide
183
Year Annualized Payout Change
2014 2.68 +8.06%
2013 2.48 +6.44%
2012 2.33 +8.37%
2011 2.15 +16.85%
2010 1.84 +6.67%
2009 1.73 +1.47%
2008 1.70 +6.25%
2007 1.60 +16.36%
2006 1.38 +0.92%
2005 1.36 +29.76%
2004 1.05 --
2003 1.05 +4.35%
2002 1.01 +15.00%
2001 0.88 +12.90%
2000 0.78 +100.00%
1999 0.39 -93.08%
Dividend.com DARS™ Ratings for RAI
Below are Dividend.com's proprietary DARS™ Ratings for RAI as of Dec. 2, 2015. Each value is
based on a scale of 1 to 5.
Relative Strength
3.0
RAI is performing in-line with the market or better.
Overall Yield Attractiveness
3.5
RAI's dividend yield is above the industry average.

Dividend.com - 2016 Stock Guide
184
Dividend Reliability
4.5
RAI has been paying dividends for 7 years, and we feel its dividend yield is extremely safe.
Dividend Uptrend
3.5
RAI has shown steady and generous dividends, and has increased its payouts each year.
Earnings Growth
2.5
RAI's earnings estimates are flat.
Read more about the DARS™ Rating System here.
Dividend.com 2016 Forecast for RAI
Potential Catalysts
● The $25 billion takeover of Lorillard presents significant growth and synergy
opportunities.
● E-cigarettes are a growth catalyst for the industry.
● The divestment of Natural American Spirits for $5 billion can be utilized to buy back
stock, which would be a significant tailwind for earnings growth next year.
Potential Concerns
● Smoking rates are falling in the U.S., which means fewer customers going forward.
● A lack of product diversity. Competitor Altria owns a wine business and a large stake in
beer giant SABMiller. Reynolds American is almost entirely reliant on cigarettes for
revenue.
Bottom Line
Reynolds American generates significant free cash flow, like other tobacco companies, and it
passes this cash flow along to shareholders primarily through dividends. The stock yields 3.2%,
and raised its dividend 7.5% in 2015. This makes Reynolds American a strong holding for
income investors.
Additional Resources for RAI
● Dividend.com Profile Page for RAI
● Full Dividend Payout History for RAI

Dividend.com - 2016 Stock Guide
185
Starbucks Corporation (SBUX)
2015 Range: 39.22 - 64.00 Avg. Volume: 8,416,960
Market Cap: 89.62B P/E Ratio (2016): 27.69
2015 EPS Est: 1.89 2016 EPS Est: 2.18
Annualized Div: 0.80 Div. Yield: 1.34%
Payout Ratio (2015): 0.42 Payout Ratio (2016): 0.37
SBUX Five-Year Stock Chart
Company Profile
Starbucks Corporation (SBUX) is an American global coffee company, and the largest in the
world. SBUX, which is located in over 60 countries, sells various products including coffee
drinks, coffee beans, salads, hot and cold sandwiches, sweet pastries, snacks, and items such as
mugs and tumblers. Starbucks was founded in 1971 and is based in Seattle, WA. Starbucks is
largely affected by commodity prices, particularly coffee beans. Starbucks also faces a risk of
market saturation, particularly in the United States. Starbucks operates internationally and
constantly seeks new markets for growth. Starbucks established its dividend in 2010 and has been
increasing it consistently annually since then.
Twenty-year dividend payout history (annualized)
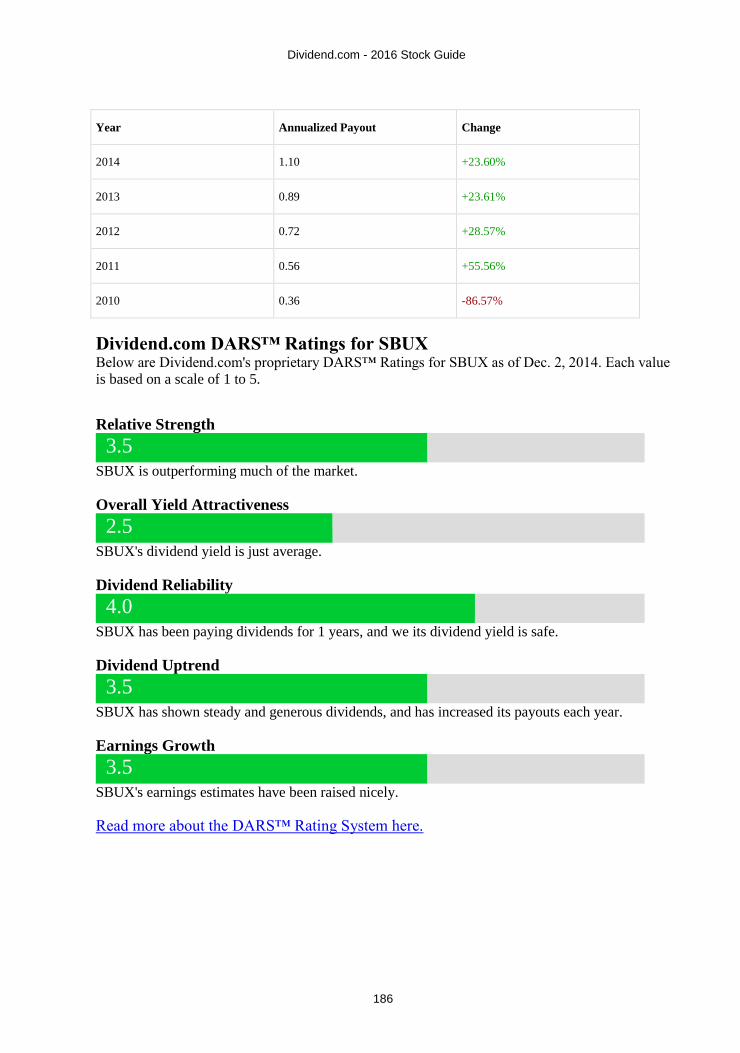
Dividend.com - 2016 Stock Guide
186
Year Annualized Payout Change
2014 1.10 +23.60%
2013 0.89 +23.61%
2012 0.72 +28.57%
2011 0.56 +55.56%
2010 0.36 -86.57%
Dividend.com DARS™ Ratings for SBUX
Below are Dividend.com's proprietary DARS™ Ratings for SBUX as of Dec. 2, 2014. Each value
is based on a scale of 1 to 5.
Relative Strength
3.5
SBUX is outperforming much of the market.
Overall Yield Attractiveness
2.5
SBUX's dividend yield is just average.
Dividend Reliability
4.0
SBUX has been paying dividends for 1 years, and we its dividend yield is safe.
Dividend Uptrend
3.5
SBUX has shown steady and generous dividends, and has increased its payouts each year.
Earnings Growth
3.5
SBUX's earnings estimates have been raised nicely.
Read more about the DARS™ Rating System here.

Dividend.com - 2016 Stock Guide
187
Dividend.com 2016 Forecast for SBUX
Potential Catalysts
● Starbucks enjoys one of the world’s most valuable and recognizable brands. This drives
tremendous pricing power and revenue growth. Comparable sales, a measure of sales at
store locations open at least one year, rose 7% in fiscal 2015.
● Starbucks is aggressively opening new restaurants around the world, which will drive
high top-line growth.
● Rapid sales growth and margin expansion leads to outsized earnings growth. Starbucks
grew earnings per share by 35% in fiscal 2015.
Potential Concerns
● Expectations are very high for Starbucks. The stock trades for 34 times earnings, a five-
year high.
● Due to its aggressive valuation, the dividend yield is very low, at 1.2%. This fails to meet
the S&P 500 average yield of 2%.
● As a luxury item in its industry, Starbucks’ growth is highly correlated to global
economic conditions. In a recession, revenue declines sharply.
Bottom Line
Starbucks is a high-growth stock. It increased its dividend by 25% in fiscal 2015. This should
appeal to dividend growth investors. On the other hand, its current dividend yield is still very low.
Investors who desire current income, such as retirees, should look elsewhere for higher-yielding
opportunities.
Additional Resources for SBUX
● Dividend.com Profile Page for SBUX
● Full Dividend Payout History for SBUX
AT&T Inc. (T)
2015 Range: 30.97 - 36.45 Avg. Volume: 24,376,700
Market Cap: 206.09B P/E Ratio (2016): 11.88
2015 EPS Est: 2.70 2016 EPS Est: 2.82
Annualized Div: 1.88 Div. Yield: 5.60%
Payout Ratio (2015): 0.7 Payout Ratio (2016): 0.67

Dividend.com - 2016 Stock Guide
188
T Five-Year Stock Chart
Company Profile
AT&T (T) is a holding company that providers telecommunication services worldwide. The
company offers several services including wireless communications, local exchange services and
long-distance services. AT&T sells both services and physical products which they have made
available at their own stores, as well as third party distributors. The company was founded in
1983 with its former name of SBC Communications, and then changed the company name to
AT&T in 2005. The company is based out of Dallas Texas.
Twenty-year dividend payout history (annualized)
Year Annualized Payout Change
2014 1.84 +2.22%
2013 1.80 +2.27%
2012 1.76 +2.33%
2011 1.72 +2.38%
2010 1.68 +2.44%
2009 1.64 +2.50%

Dividend.com - 2016 Stock Guide
189
2008 1.60 +12.68%
2007 1.42 +6.61%
2006 1.33 +3.10%
2005 1.29 +3.19%
2004 1.25 -8.55%
2003 1.37 +28.42%
2002 1.07 +4.41%
2001 1.02 +1.49%
2000 1.01 +4.68%
1999 0.96 +4.46%
1998 0.92 +3.72%
1997 0.89 +4.23%
1996 0.85 +4.35%
1995 0.82 +4.42%
1994 0.78 -29.00%
Dividend.com DARS™ Ratings for T
Below are Dividend.com's proprietary DARS™ Ratings for T as of Dec. 2, 2015. Each value is
based on a scale of 1 to 5.
Relative Strength
3.0
T is performing in-line with the market or better.
Overall Yield Attractiveness
4.0
T's dividend yield is above the industry average.
Dividend Reliability
4.5
T has been paying dividends for 130 years, and we feel its dividend yield is extremely safe.
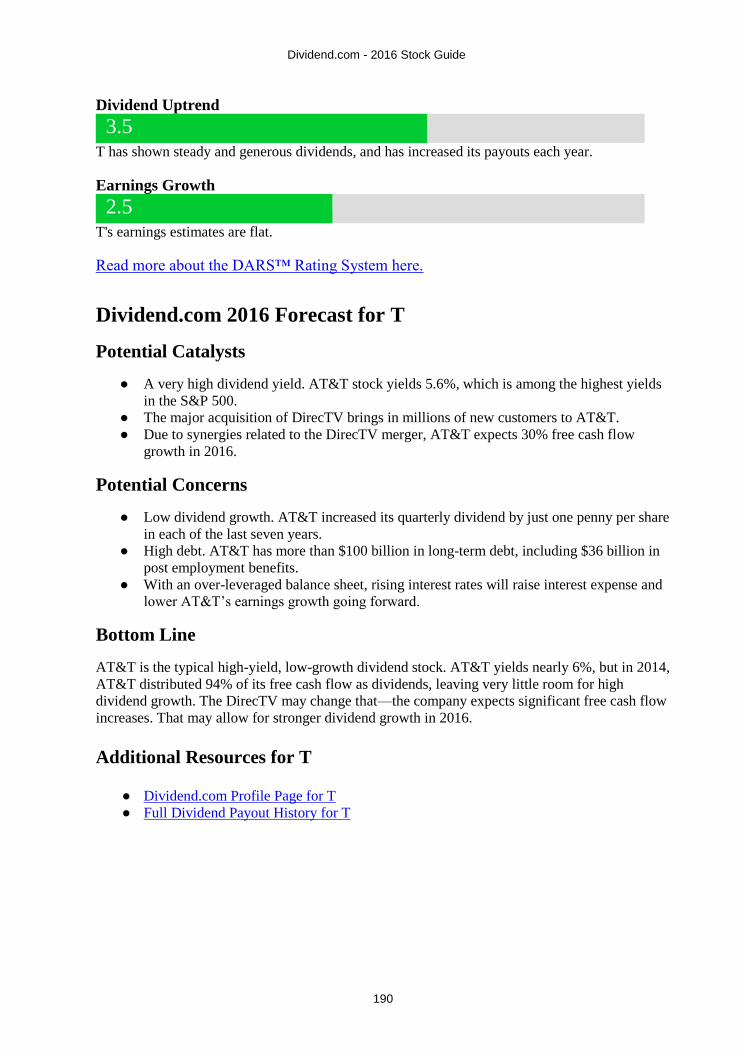
Dividend.com - 2016 Stock Guide
190
Dividend Uptrend
3.5
T has shown steady and generous dividends, and has increased its payouts each year.
Earnings Growth
2.5
T's earnings estimates are flat.
Read more about the DARS™ Rating System here.
Dividend.com 2016 Forecast for T
Potential Catalysts
● A very high dividend yield. AT&T stock yields 5.6%, which is among the highest yields
in the S&P 500.
● The major acquisition of DirecTV brings in millions of new customers to AT&T.
● Due to synergies related to the DirecTV merger, AT&T expects 30% free cash flow
growth in 2016.
Potential Concerns
● Low dividend growth. AT&T increased its quarterly dividend by just one penny per share
in each of the last seven years.
● High debt. AT&T has more than $100 billion in long-term debt, including $36 billion in
post employment benefits.
● With an over-leveraged balance sheet, rising interest rates will raise interest expense and
lower AT&T’s earnings growth going forward.
Bottom Line
AT&T is the typical high-yield, low-growth dividend stock. AT&T yields nearly 6%, but in 2014,
AT&T distributed 94% of its free cash flow as dividends, leaving very little room for high
dividend growth. The DirecTV may change that—the company expects significant free cash flow
increases. That may allow for stronger dividend growth in 2016.
Additional Resources for T
● Dividend.com Profile Page for T
● Full Dividend Payout History for T

Dividend.com - 2016 Stock Guide
191
Toronto-Dominion Bank (TD)
2015 Range: 35.930 - 48.110 Avg. Volume: 1,435,250
Market Cap: 72.84B P/E Ratio (2016): 7.62
2015 EPS Est: 4.840 2016 EPS Est: 5.150
Annualized Div: 2.04 Div. Yield: 3.95%
Payout Ratio (2015): 0.42 Payout Ratio (2016): 0.4
TD Five-Year Stock Chart
Company Profile
Toronto-Dominion Bank (TD) is a Canadian banking company, and is the second largest bank in
Canada. The company's subsidiaries include,TD Ameritrade, TD Asset Management, TD Bank,
N.A., TD Canada Trust, TD Commercial Banking, and TD Insurance. TD was founded in 1955
and is based in Toronto, ON. TD is largely affected by the general economic environment, as well
as risks such as information security and increasing fraud. TD has been expanding its footprint
largely in the United States in the last few years and has increased its growth prospects. TD has
been paying a dividend since 1998 and has increased it since 2011. TD pays its dividend every
quarter.
Twenty-year dividend payout history (annualized)

Dividend.com - 2016 Stock Guide
192
Year Annualized Payout Change
2014 2.27 -29.94%
2013 3.24 +12.66%
2012 2.88 +9.40%
2011 2.63 +11.68%
2010 2.35 -10.39%
2009 2.63 +11.93%
2008 2.35 +21.17%
2007 1.94 +60.75%
2006 1.21 -19.83%
2005 1.50 +7.36%
2004 1.40 +16.67%
2003 1.20 +7.14%
2002 1.12 --
2001 1.12 +16.67%
2000 0.96 +26.32%
1999 0.76 +13.43%
1998 0.67 +15.52%
1997 0.58 +118.87%
1996 0.27 -85.60%

Dividend.com - 2016 Stock Guide
193
Dividend.com DARS™ Ratings for TD
Below are Dividend.com's proprietary DARS™ Ratings for TD as of Dec. 2, 2015. Each value is
based on a scale of 1 to 5.
Relative Strength
3.0
TD is performing in-line with the market or better.
Overall Yield Attractiveness
3.5
TD's dividend yield is above the industry average.
Dividend Reliability
4.5
TD has been paying dividends for 154 years, and we feel its dividend yield is extremely safe.
Dividend Uptrend
3.5
TD has shown steady and generous dividends, and has increased its payouts each year.
Earnings Growth
3.0
TD's earnings estimates are flat.
Read more about the DARS™ Rating System here.
Dividend.com 2016 Forecast for TD
Potential Catalysts
● If interest rates rise, it will help increase TD Bank’s net interest margins, and be a catalyst
for higher earnings growth.
● Attractive valuation and dividend yield. The stock trades for 13 times earnings and yields
3.8%. TD Bank is much cheaper than the market average and offers a higher dividend
yield than the S&P 500 average.
● Diversified business and good financial position drives a strong 10% Tier 1 Capital Ratio.
Potential Concerns
● Margins have leveled off in TD Bank’s U.S. operations. As a financial institution, TD
Bank is suffering from the delay in raising interest rates in the United States. This could
weigh on future dividend growth.
● Increasing credit losses. TD Bank’s provision for credit losses rose 29% last quarter,
year-over-year.

Dividend.com - 2016 Stock Guide
194
Bottom Line
TD Bank stock yields 3.8%, which makes it an attractive stock for income investors. Future
dividend growth may disappoint, however, if rates remain low. TD Bank’s growth has slowed
this year. The company needs higher rates to increase its profit margins. If rates rise, investors
should expect a dividend increase next year.
Additional Resources for TD
● Dividend.com Profile Page for TD
● Full Dividend Payout History for TD
Target Corporation (TGT)
2015 Range: 68.15 - 85.81 Avg. Volume: 5,568,360
Market Cap: 45.32B P/E Ratio (2016): 14.2
2015 EPS Est: 4.74 2016 EPS Est: 5.18
Annualized Div: 2.24 Div. Yield: 3.08%
Payout Ratio (2015): 0.47 Payout Ratio (2016): 0.43
TGT Five-Year Stock Chart
Target (TGT) is a discount retailer in North America. Target operates in three segments, U.S.
Retail, U.S. Credit Card and Canadian. It offers products to customers through store locations as
well as online. As of January 2012, the company operated 1763 stores, and employed 365,000
people. The company was founded in 1902 as Dayton Dry Goods Company, and is based in
Minneapolis, Minnesota.

Dividend.com - 2016 Stock Guide
195
Twenty-year dividend payout history (annualized)
Year Annualized Payout Change
2014 1.90 +20.25%
2013 1.58 +19.70%
2012 1.32 +20.00%
2011 1.10 +30.95%
2010 0.84 +27.27%
2009 0.66 +10.00%
2008 0.60 +15.38%
2007 0.52 +18.18%
2006 0.44 +22.22%
2005 0.36 +20.00%
2004 0.30 +15.38%
2003 0.26 +8.33%
2002 0.24 +9.09%
2001 0.22 +4.76%
2000 0.21 +5.00%
1999 0.20 +11.11%
1998 0.18 +9.09%

Dividend.com - 2016 Stock Guide
196
1997 0.17 +7.60%
1996 0.15 +5.74%
1995 0.15 +3.58%
1994 0.14 -93.83%
Dividend.com DARS™ Ratings for TGT
Below are Dividend.com's proprietary DARS™ Ratings for TGT as of Dec. 2, 2015. Each value
is based on a scale of 1 to 5.
Relative Strength
3.0
TGT is performing in-line with the market or better.
Overall Yield Attractiveness
3.5
TGT's dividend yield is above the industry average.
Dividend Reliability
4.5
TGT has been paying dividends for 2011 years, and we feel its dividend yield is extremely
safe.
Dividend Uptrend
3.5
TGT has shown steady and generous dividends, and has increased its payouts each year.
Earnings Growth
3.0
TGT's earnings estimates are flat.
Read more about the DARS™ Rating System here.
Dividend.com 2016 Forecast for TGT
Potential Catalysts
● Target has invested heavily in its e-commerce business, which is vital for retailers.
Digital channel sales increased 20% last quarter.
● Target restructured its business by closing all of its stores in Canada. Those stores lost
$627 million before interest and taxes in its last three full quarters of operation. This
should significantly improve profitability next year.
● Target stock yields 3.2%, and the company has raised its dividend for 41 years in a row.

Dividend.com - 2016 Stock Guide
197
Potential Concerns
● Retail sales in the U.S. are weak. A poor fourth-quarter holiday shopping season would
severely impact Target.
● Increasing competition from Internet retailers like Amazon is a significant headwind
Bottom Line
Target offers a high dividend yield, and has a proven track record of dividend growth. The
company is a Dividend Aristocrat and, over the past five years, has lifted its payout by 17% per
year. This makes Target stock an ideal candidate for both dividend growth and high yield
investors.
Additional Resources for TGT
● Dividend.com Profile Page for TGT
● Full Dividend Payout History for TGT
Travelers (TRV)
2015 Range: 95.21 - 116.48 Avg. Volume: 1,961,040
Market Cap: 34.29B P/E Ratio (2016): 11.5
2015 EPS Est: 10.59 2016 EPS Est: 9.80
Annualized Div: 2.44 Div. Yield: 2.20%
Payout Ratio (2015): 0.23 Payout Ratio (2016): 0.25
TRV Five-Year Stock Chart
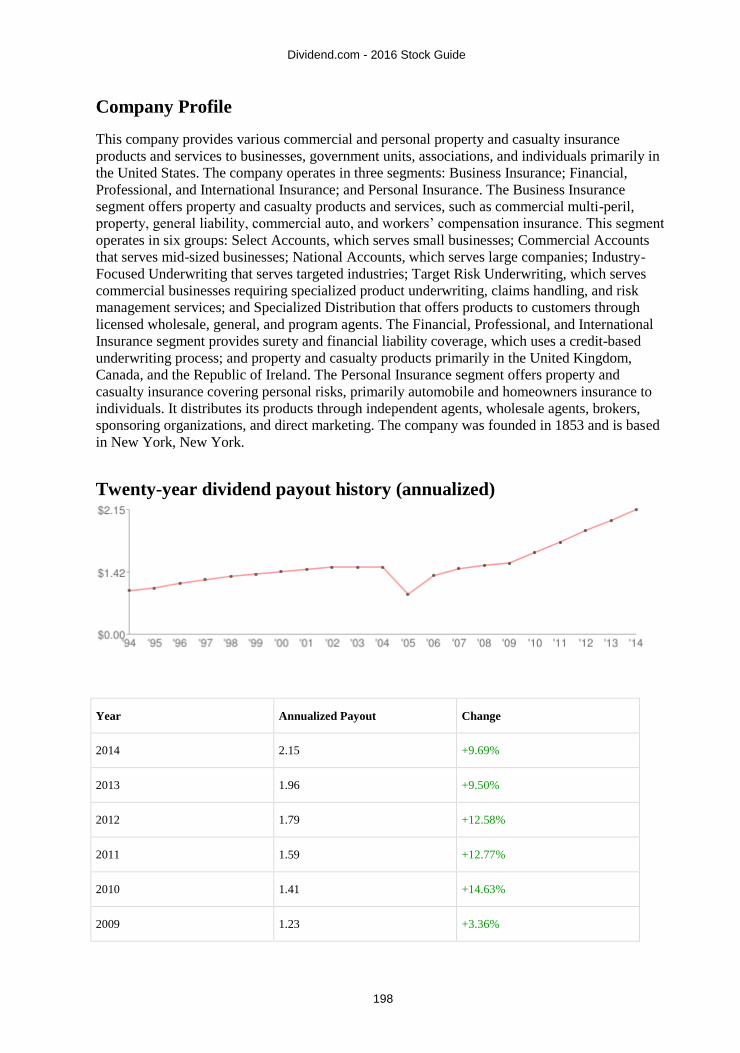
Dividend.com - 2016 Stock Guide
198
Company Profile
This company provides various commercial and personal property and casualty insurance
products and services to businesses, government units, associations, and individuals primarily in
the United States. The company operates in three segments: Business Insurance; Financial,
Professional, and International Insurance; and Personal Insurance. The Business Insurance
segment offers property and casualty products and services, such as commercial multi-peril,
property, general liability, commercial auto, and workers’ compensation insurance. This segment
operates in six groups: Select Accounts, which serves small businesses; Commercial Accounts
that serves mid-sized businesses; National Accounts, which serves large companies; Industry-
Focused Underwriting that serves targeted industries; Target Risk Underwriting, which serves
commercial businesses requiring specialized product underwriting, claims handling, and risk
management services; and Specialized Distribution that offers products to customers through
licensed wholesale, general, and program agents. The Financial, Professional, and International
Insurance segment provides surety and financial liability coverage, which uses a credit-based
underwriting process; and property and casualty products primarily in the United Kingdom,
Canada, and the Republic of Ireland. The Personal Insurance segment offers property and
casualty insurance covering personal risks, primarily automobile and homeowners insurance to
individuals. It distributes its products through independent agents, wholesale agents, brokers,
sponsoring organizations, and direct marketing. The company was founded in 1853 and is based
in New York, New York.
Twenty-year dividend payout history (annualized)
Year Annualized Payout Change
2014 2.15 +9.69%
2013 1.96 +9.50%
2012 1.79 +12.58%
2011 1.59 +12.77%
2010 1.41 +14.63%
2009 1.23 +3.36%
Dividend.com - 2016 Stock Guide
199
2008 1.19 +5.31%
2007 1.13 +11.88%
2006 1.01 +46.38%
2005 0.69 -40.52%
2004 1.16 --
2003 1.16 --
2002 1.16 +3.57%
2001 1.12 +3.70%
2000 1.08 +3.85%
1999 1.04 +4.00%
1998 1.00 +6.38%
1997 0.94 +6.82%
1996 0.88 +10.00%
1995 0.80 +6.67%
1994 0.75 -60.53%
Travelers (TRV)
Dividend.com DARS™ Ratings for TRV
Below are Dividend.com's proprietary DARS™ Ratings for TRV as of Dec. 2, 2015. Each value
is based on a scale of 1 to 5.
Relative Strength
3.5
TRV is outperforming much of the market.
Overall Yield Attractiveness
3.0
TRV's dividend yield is just average.

Dividend.com - 2016 Stock Guide
200
Dividend Reliability
4.0
TRV has been paying dividends for 21 years, and we its dividend yield is safe.
Dividend Uptrend
3.5
TRV has shown steady and generous dividends, and has increased its payouts each year.
Earnings Growth
3.0
TRV's earnings estimates are flat.
Read more about the DARS™ Rating System here.
Dividend.com 2016 Forecast for TRV
Potential Catalysts
● Higher interest rates are a tailwind for insurance companies, which will earn higher net
interest margins if rates begin to rise.
● Insurance companies enjoy a lucrative business model. They earn cash flow two ways: by
collecting premiums and by investing capital to earn returns.
● High growth. This year, Travelers raised its dividend by 11%, and added $5 billion to its
share repurchase program.
Potential Concerns
● If interest rates remain low, it will suppress investment income. Travelers’ total revenue
declined 1% through the first nine months of 2015 because of lower investment income.
● Foreign currency risk. Travelers’ shareholder equity declined 3% since the beginning of
the year because of unfavorable foreign exchange fluctuations.
Bottom Line
Travelers is a good stock pick for value and income investors. The stock trades for 10 times
earnings and yields 2.1%. The company has grown dividends at a high rate, but future dividend
growth may disappoint if interest rates remain unchanged heading into 2016.
Additional Resources for TRV
● Dividend.com Profile Page for TRV
● Full Dividend Payout History for TRV

Dividend.com - 2016 Stock Guide
201
United Parcel Service Inc. (UPS)
2015 Range: 93.64 - 114.40 Avg. Volume: 3,037,030
Market Cap: 87.88B P/E Ratio (2016): 17.11
2015 EPS Est: 5.29 2016 EPS Est: 5.77
Annualized Div: 2.92 Div. Yield: 2.98%
Payout Ratio (2015): 0.55 Payout Ratio (2016): 0.51
UPS Five-Year Stock Chart
Company Profile
United Parcel Service, Inc. (UPS) is an international shipping service company, and is the largest
package delivery company in the world. UPS operates in three business segments: U.S. Domestic
Package operations, International Package operations, and Supply Chain & Freight operations. Its
services are offered to consumers and businesses in nearly 220 countries worldwide. The
company was founded in 1907 and is headquartered in Atlanta, Georgia. UPS faces significant
competition worldwide, and changes in the competitive landscape can greatly affect UPS’s
results. As well, UPS faces large amounts of regulation, on local, state, federal, and international
levels, particularly tariffs, trade policies, and export requirements. UPS has been paying
dividends since 1999 and has increased them consistently since 2009. UPS has never cut their
dividend. UPS pays its dividend quarterly.

Dividend.com - 2016 Stock Guide
202
Twenty-year dividend payout history (annualized)
Year Annualized Payout Change
2014 2.68 +8.06%
2013 2.48 +8.77%
2012 2.28 +9.62%
2011 2.08 +10.64%
2010 1.88 +4.44%
2009 1.80 --
2008 1.80 +7.14%
2007 1.68 +10.53%
2006 1.52 +15.15%
2005 1.32 +17.86%
2004 1.12 +21.74%
2003 0.92 +21.05%
2002 0.76 --
2001 0.76 +11.76%
2000 0.68 +126.67%
1999 0.30 -86.05%

Dividend.com - 2016 Stock Guide
203
Dividend.com DARS™ Ratings for UPS
Below are Dividend.com's proprietary DARS™ Ratings for UPS as of Dec. 2, 2015. Each value
is based on a scale of 1 to 5.
Relative Strength
3.0
UPS is performing in-line with the market or better.
Overall Yield Attractiveness
3.5
UPS's dividend yield is above the industry average.
Dividend Reliability
4.0
UPS has been paying dividends for 12 years, and we its dividend yield is safe.
Dividend Uptrend
3.5
UPS has shown steady and generous dividends, and has increased its payouts each year.
Earnings Growth
3.0
UPS's earnings estimates are flat.
Read more about the DARS™ Rating System here.
Dividend.com 2016 Forecast for UPS
Potential Catalysts
● UPS operates in an essential duopoly industry, with extremely high barriers to entry. This
protects its earnings power. Earnings per share grew 39% over the first nine months of
2015.
● As a major transport, UPS will benefit from the continued recovery in the global
economy.
● UPS is also a major beneficiary of low oil prices, which are one of its biggest costs each
year.
Potential Concerns
● The rising U.S. dollar reduced UPS’ revenue growth by 2% last quarter, and will remain
a headwind in 2016.
● Slowing economic growth in the emerging markets is a significant concern going
forward.
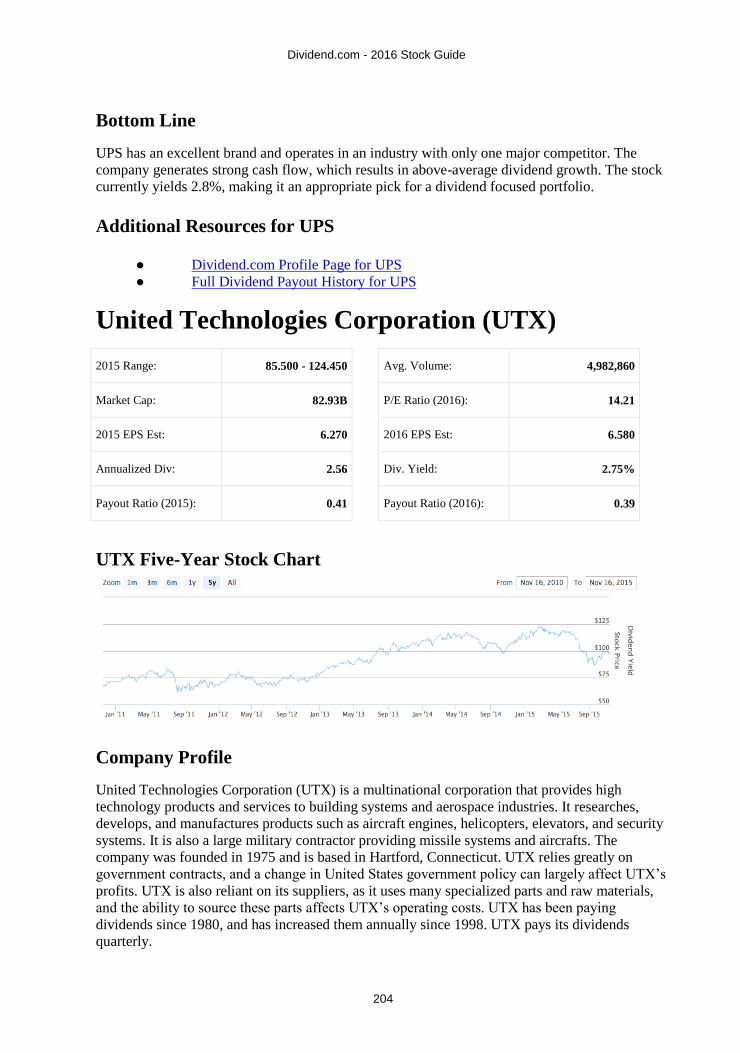
Dividend.com - 2016 Stock Guide
204
Bottom Line
UPS has an excellent brand and operates in an industry with only one major competitor. The
company generates strong cash flow, which results in above-average dividend growth. The stock
currently yields 2.8%, making it an appropriate pick for a dividend focused portfolio.
Additional Resources for UPS
● Dividend.com Profile Page for UPS
● Full Dividend Payout History for UPS
United Technologies Corporation (UTX)
2015 Range: 85.500 - 124.450 Avg. Volume: 4,982,860
Market Cap: 82.93B P/E Ratio (2016): 14.21
2015 EPS Est: 6.270 2016 EPS Est: 6.580
Annualized Div: 2.56 Div. Yield: 2.75%
Payout Ratio (2015): 0.41 Payout Ratio (2016): 0.39
UTX Five-Year Stock Chart
Company Profile
United Technologies Corporation (UTX) is a multinational corporation that provides high
technology products and services to building systems and aerospace industries. It researches,
develops, and manufactures products such as aircraft engines, helicopters, elevators, and security
systems. It is also a large military contractor providing missile systems and aircrafts. The
company was founded in 1975 and is based in Hartford, Connecticut. UTX relies greatly on
government contracts, and a change in United States government policy can largely affect UTX’s
profits. UTX is also reliant on its suppliers, as it uses many specialized parts and raw materials,
and the ability to source these parts affects UTX’s operating costs. UTX has been paying
dividends since 1980, and has increased them annually since 1998. UTX pays its dividends
quarterly.

Dividend.com - 2016 Stock Guide
205
Twenty-year dividend payout history (annualized)
Year Annualized Payout Change
2014 2.36 +7.52%
2013 2.20 +8.13%
2012 2.03 +8.85%
2011 1.87 +9.71%
2010 1.70 +10.39%
2009 1.54 +14.50%
2008 1.35 +14.96%
2007 1.17 +15.27%
2006 1.02 +15.34%
2005 0.88 +25.71%
2004 0.70 +23.35%
2003 0.57 +15.82%
2002 0.49 +8.89%
2001 0.45 +9.09%
2000 0.41 +11.49%
1999 0.37 +6.47%

Dividend.com - 2016 Stock Guide
206
1998 0.35 +12.10%
1997 0.31 +12.73%
1996 0.28 +7.32%
1995 0.26 +7.89%
1994 0.24 -91.14%
Dividend.com DARS™ Ratings for UTX
Below are Dividend.com's proprietary DARS™ Ratings for UTX as of Dec. 2, 2015. Each value
is based on a scale of 1 to 5.
Relative Strength
3.5
UTX is outperforming much of the market.
Overall Yield Attractiveness
3.0
UTX's dividend yield is just average.
Dividend Reliability
4.0
UTX has been paying dividends for 41 years, and we its dividend yield is safe.
Dividend Uptrend
3.5
UTX has shown steady and generous dividends, and has increased its payouts each year.
Earnings Growth
3.0
UTX's earnings estimates are flat.
Read more about the DARS™ Rating System here.

Dividend.com - 2016 Stock Guide
207
Dividend.com 2016 Forecast for UTX
Potential Catalysts
● The steady recovery in the global economy and the divestiture of the Sikorsky aircraft
business are positive for United Technologies’ dividend, which yields 2.6%.
● Focus on commercial markets versus government defense contracts provides valuable
protection from cuts in global defense budgets.
● Strong dividend growth—over the past five years, the stock has raised its dividend by 8%
compounded annually.
Potential Concerns
● As a global industrial, United Technologies is vulnerable to the economic slowdown in
the emerging markets such as China.
● United Technologies’ industrial products and services cater to some degree to the energy
market, which is a concern given the steep declines in commodity prices this year.
Bottom Line
United Technologies is a diversified business. It generates approximately 45% of its revenue from
the commercial markets, which is a structural tailwind heading into 2016. The company generates
high free cash flow which powers its dividend growth. As a result, United Technologies stock is
attractive for both current dividend income and future dividend growth potential.
Additional Resources for UTX
● Dividend.com Profile Page for UTX
● Full Dividend Payout History for UTX
Visa Inc (V)
2015 Range: 60.000 - 81.010 Avg. Volume: 9,286,440
Market Cap: 190.46B P/E Ratio (2016): 23.32
2015 EPS Est: 2.880 2016 EPS Est: 3.360
Annualized Div: 0.56 Div. Yield: 0.73%
Payout Ratio (2015): 0.19 Payout Ratio (2016): 0.17

Dividend.com - 2016 Stock Guide
208
V Five-Year Stock Chart
Company Profile
Visa (V) is a multinational financial services company, which is best known for its payment
services, including credit cards and debit cards. The company serves consumers, businesses,
banks and governments in more than 200 countries. The Company owns, manages and promotes
several products including, Visa, Visa Electron, PLUS and Interlink. Visa was established in
1970, and is headquartered in San Francisco, CA.
Twenty-year dividend payout history (annualized)
Year Annualized Payout Change
2014 1.68 +20.86%
2013 1.39 +40.40%
2012 0.99 +120.00%
2011 0.45 -14.29%
2010 0.53 +19.32%
2009 0.44 +109.52%
2008 0.21 -91.10%

Dividend.com - 2016 Stock Guide
209
Dividend.com DARS™ Ratings for V
Below are Dividend.com's proprietary DARS™ Ratings for V as of Dec. 2, 2015. Each value is
based on a scale of 1 to 5.
Relative Strength
4.0
V is outperforming much of the market.
Overall Yield Attractiveness
2.0
V's dividend yield is below average and thus unattractive.
Dividend Reliability
4.0
V has been paying dividends for 2011 years, and we its dividend yield is safe.
Dividend Uptrend
3.5
V has shown steady and generous dividends, and has increased its payouts each year.
Earnings Growth
3.5
V's earnings estimates have been raised nicely.
Read more about the DARS™ Rating System here.
Dividend.com 2016 Forecast for V
Potential Catalysts
● An excellent brand name that separates it from the competition.
● Global payments is a high-growth industry. Visa’s earnings rose 16% in fiscal 2015.
● The acquisition of Visa Europe should present significant cost synergies and will likely
be accretive to earnings next year and beyond.
Potential Concerns
● Low current dividend yield that is well below the market average.
● Increasing competition from companies like Apple could threaten Visa’s position in
global financial transfers.
Bottom Line
Visa is an excellent dividend growth stock. The company raised its dividend by 16% this year.
However, Visa stock only yields 0.7%. Visa is a phenomenal growth stock, but it is not an
attractive option for investors looking for dividend income.
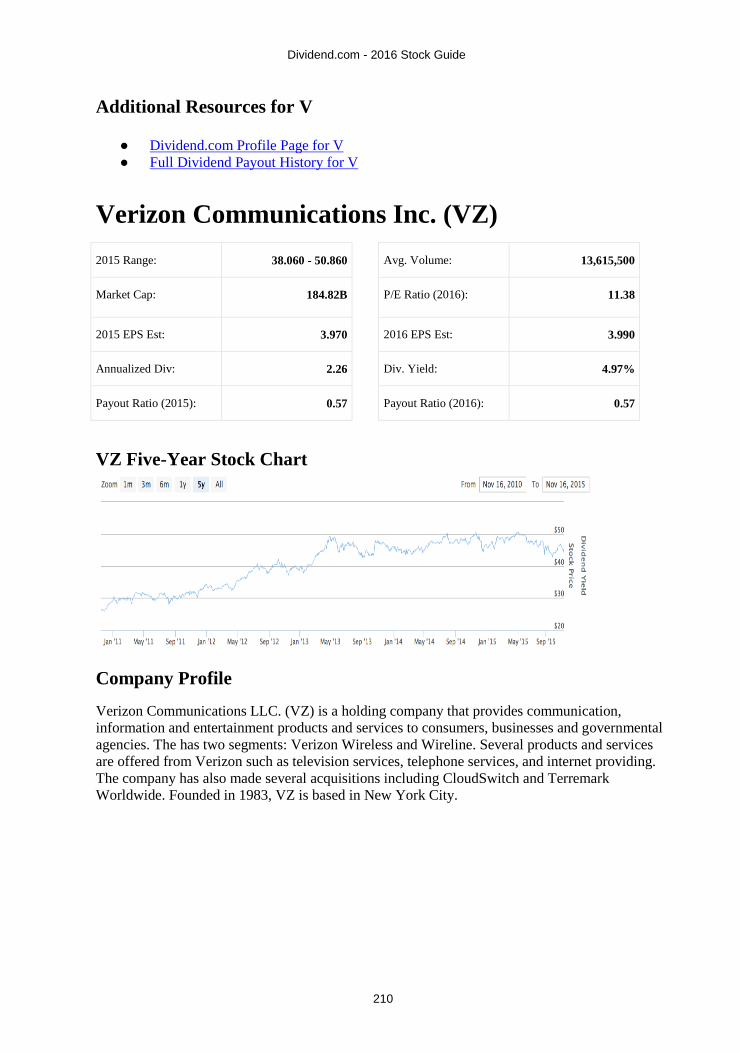
Dividend.com - 2016 Stock Guide
210
Additional Resources for V
● Dividend.com Profile Page for V
● Full Dividend Payout History for V
Verizon Communications Inc. (VZ)
2015 Range: 38.060 - 50.860 Avg. Volume: 13,615,500
Market Cap: 184.82B P/E Ratio (2016): 11.38
2015 EPS Est: 3.970 2016 EPS Est: 3.990
Annualized Div: 2.26 Div. Yield: 4.97%
Payout Ratio (2015): 0.57 Payout Ratio (2016): 0.57
VZ Five-Year Stock Chart
Company Profile
Verizon Communications LLC. (VZ) is a holding company that provides communication,
information and entertainment products and services to consumers, businesses and governmental
agencies. The has two segments: Verizon Wireless and Wireline. Several products and services
are offered from Verizon such as television services, telephone services, and internet providing.
The company has also made several acquisitions including CloudSwitch and Terremark
Worldwide. Founded in 1983, VZ is based in New York City.

Dividend.com - 2016 Stock Guide
211
Twenty-year dividend payout history (annualized)
Year Annualized Payout Change
2014 2.14 +3.13%
2013 2.08 +2.98%
2012 2.02 +2.60%
2011 1.96 +2.67%
2010 1.91 +3.13%
2009 1.86 -3.39%
2008 1.92 +16.72%
2007 1.65 -43.91%
2006 2.93 +83.31%
2005 1.60 +3.90%
2004 1.54 --
2003 1.54 --
2002 1.54 --
2001 1.54 -2.96%
2000 1.59 +2.99%
1999 1.54 +0.06%
1998 1.54 +38.12%
Dividend.com - 2016 Stock Guide
212
1997 1.12 -22.03%
1996 1.43 +2.51%
1995 1.40 +1.82%
1994 1.37 -18.45%
Dividend.com DARS™ Ratings for VZ
Below are Dividend.com's proprietary DARS™ Ratings for VZ as of Dec. 2, 2015. Each value is
based on a scale of 1 to 5.
Relative Strength
3.0
VZ is performing in-line with the market or better.
Overall Yield Attractiveness
3.5
VZ's dividend yield is above the industry average.
Dividend Reliability
4.5
VZ has been paying dividends for 27 years, and we feel its dividend yield is extremely safe.
Dividend Uptrend
3.5
VZ has shown steady and generous dividends, and has increased its payouts each year.
Earnings Growth
3.0
VZ's earnings estimates are flat.
Read more about the DARS™ Rating System here.
Dividend.com 2016 Forecast for VZ
Potential Catalysts
● The acquisition of AOL is a major catalyst that can meaningfully extend Verizon’s
revenue from advertising and mobile entertainment.
● Verizon now owns 100% of Verizon Wireless, which is the most profitable wireless
carrier in the United States. Verizon’s wireless business grew revenue by 5% last quarter.
● High dividend yield. Verizon yields 5%, more than double the average yield of the S&P
500 Index.
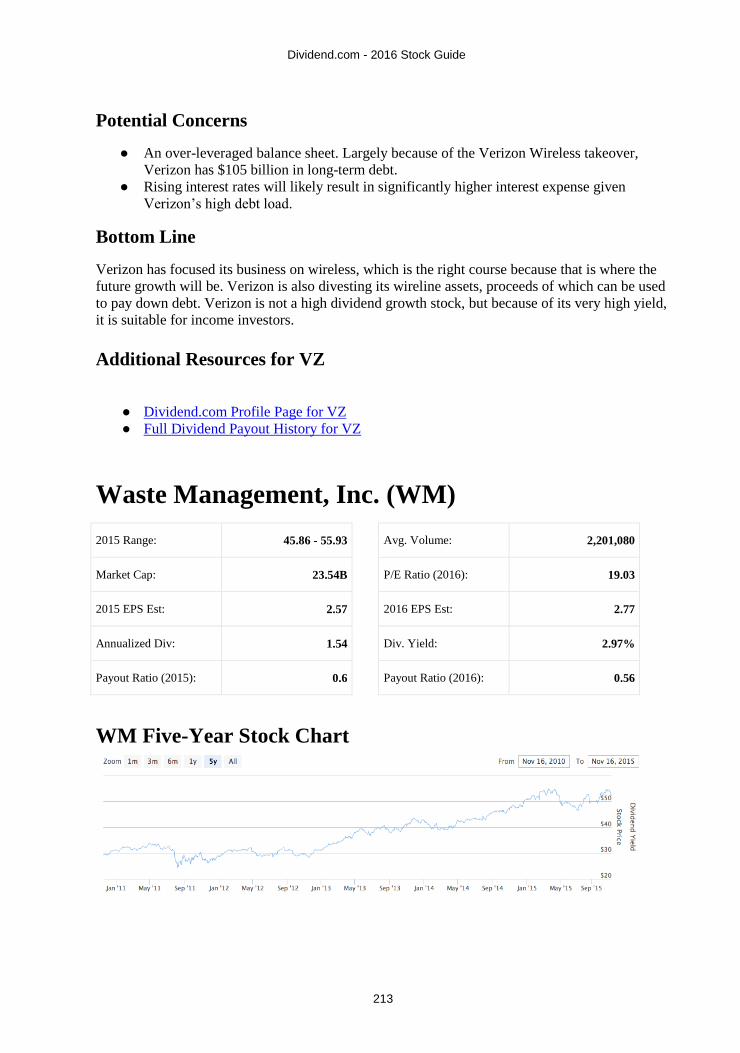
Dividend.com - 2016 Stock Guide
213
Potential Concerns
● An over-leveraged balance sheet. Largely because of the Verizon Wireless takeover,
Verizon has $105 billion in long-term debt.
● Rising interest rates will likely result in significantly higher interest expense given
Verizon’s high debt load.
Bottom Line
Verizon has focused its business on wireless, which is the right course because that is where the
future growth will be. Verizon is also divesting its wireline assets, proceeds of which can be used
to pay down debt. Verizon is not a high dividend growth stock, but because of its very high yield,
it is suitable for income investors.
Additional Resources for VZ
● Dividend.com Profile Page for VZ
● Full Dividend Payout History for VZ
Waste Management, Inc. (WM)
2015 Range: 45.86 - 55.93 Avg. Volume: 2,201,080
Market Cap: 23.54B P/E Ratio (2016): 19.03
2015 EPS Est: 2.57 2016 EPS Est: 2.77
Annualized Div: 1.54 Div. Yield: 2.97%
Payout Ratio (2015): 0.6 Payout Ratio (2016): 0.56
WM Five-Year Stock Chart
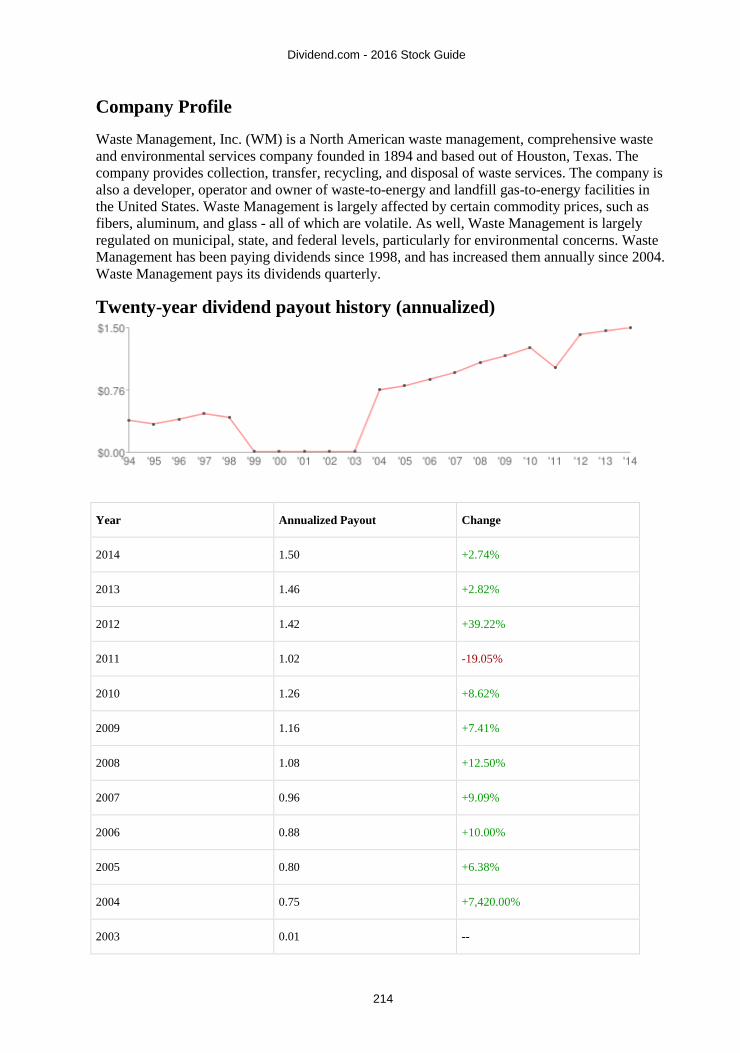
Dividend.com - 2016 Stock Guide
214
Company Profile
Waste Management, Inc. (WM) is a North American waste management, comprehensive waste
and environmental services company founded in 1894 and based out of Houston, Texas. The
company provides collection, transfer, recycling, and disposal of waste services. The company is
also a developer, operator and owner of waste-to-energy and landfill gas-to-energy facilities in
the United States. Waste Management is largely affected by certain commodity prices, such as
fibers, aluminum, and glass - all of which are volatile. As well, Waste Management is largely
regulated on municipal, state, and federal levels, particularly for environmental concerns. Waste
Management has been paying dividends since 1998, and has increased them annually since 2004.
Waste Management pays its dividends quarterly.
Twenty-year dividend payout history (annualized)
Year Annualized Payout Change
2014 1.50 +2.74%
2013 1.46 +2.82%
2012 1.42 +39.22%
2011 1.02 -19.05%
2010 1.26 +8.62%
2009 1.16 +7.41%
2008 1.08 +12.50%
2007 0.96 +9.09%
2006 0.88 +10.00%
2005 0.80 +6.38%
2004 0.75 +7,420.00%
2003 0.01 --
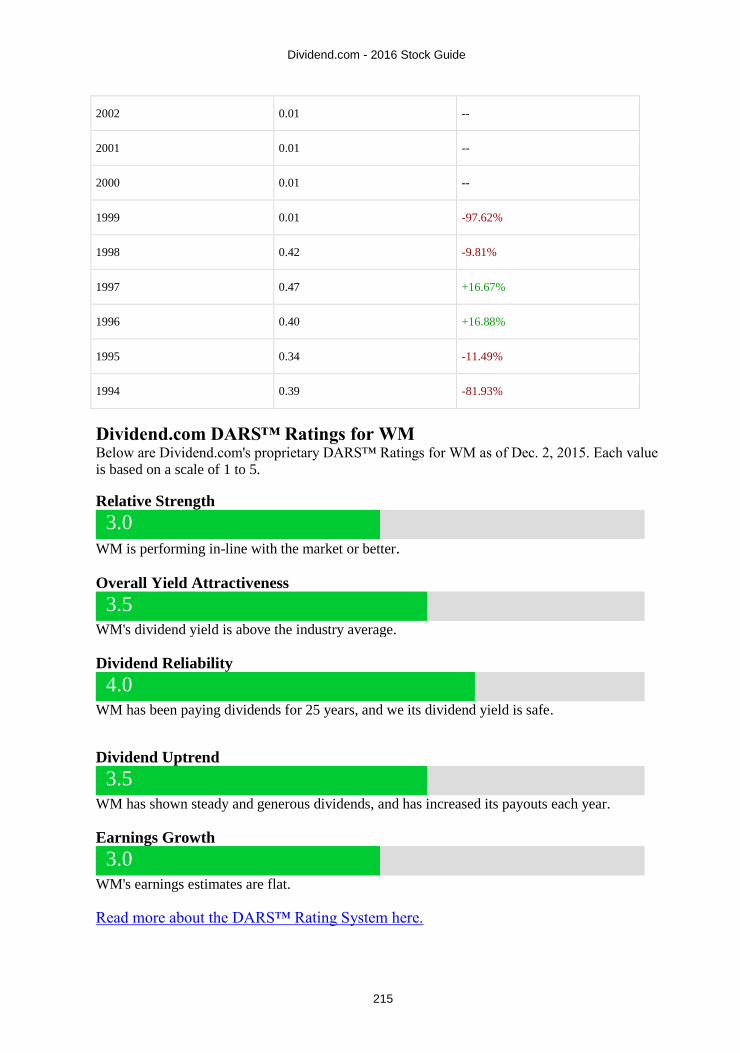
Dividend.com - 2016 Stock Guide
215
2002 0.01 --
2001 0.01 --
2000 0.01 --
1999 0.01 -97.62%
1998 0.42 -9.81%
1997 0.47 +16.67%
1996 0.40 +16.88%
1995 0.34 -11.49%
1994 0.39 -81.93%
Dividend.com DARS™ Ratings for WM
Below are Dividend.com's proprietary DARS™ Ratings for WM as of Dec. 2, 2015. Each value
is based on a scale of 1 to 5.
Relative Strength
3.0
WM is performing in-line with the market or better.
Overall Yield Attractiveness
3.5
WM's dividend yield is above the industry average.
Dividend Reliability
4.0
WM has been paying dividends for 25 years, and we its dividend yield is safe.
Dividend Uptrend
3.5
WM has shown steady and generous dividends, and has increased its payouts each year.
Earnings Growth
3.0
WM's earnings estimates are flat.
Read more about the DARS™ Rating System here.

Dividend.com - 2016 Stock Guide
216
Dividend.com 2016 Forecast for WM
Potential Catalysts
● As the nation’s biggest recycler, Waste Management benefits from the move to clean
power and renewable energy.
● Very wide economic moat. There are only a few smaller competitors, and extremely high
barrier to entry in the trash removal business.
Potential Concerns
● Waste disposal and management is a low-growth industry. Waste Management’s earnings
will likely only grow slightly higher than inflation.
● A high debt load. Waste Management carries $8.8 billion in long-term debt, compared to
just $5 billion in shareholder’s equity. Rising interest rates will make this debt more
expensive, which will reduce earnings growth.
Bottom Line
Waste Management is a strong dividend stock with a 2.8% yield, which is above the S&P 500
average. However, due to its slowing earnings growth and high debt, Waste Management’s
dividend growth is low. The company has increased its dividend by just 4% per year over the past
five years. As a result, the stock will generate suitable current income, but Waste Management is
not an ideal dividend growth stock.
Additional Resources for WM
● Dividend.com Profile Page for WM
● Full Dividend Payout History for WM
Wal-Mart Stores Inc. (WMT)
2015 Range: 56.30 - 90.97 Avg. Volume: 12,242,100
Market Cap: 192.75B P/E Ratio (2016): 14.44
2015 EPS Est: 4.57 2016 EPS Est: 4.17
Annualized Div: 1.96 Div. Yield: 3.25%
Payout Ratio (2015): 0.43 Payout Ratio (2016): 0.47

Dividend.com - 2016 Stock Guide
217
WMT Five-Year Stock Chart
Company Profile
Wal-Mart Stores, Inc. (WMT) is an American multinational retailer corporation that owns and
operates discount department and wholesale stores worldwide. Everyday low prices is the
company’s pricing philosophy. Wal-Mart was founded in 1962 and is headquartered in
Bentonville, Arkansas. It owns more than 10,800 stores in 27 countries and is the largest private
employer in the world. General economic conditions, such as higher interest rates, higher fuel or
other costs, weakness in the housing market or higher unemployment may adversely affect Wal-
Mart. Wal-Mart has a strong history of investor friendly dividend policy. Not only is the company
a consistent dividend payer, but it has also shown a propensity to increase the dividend payout on
an annual basis. Over time, investors have seen Wal-Mart achieve a steadily increasing dividend
yield and have received good advanced notice of upcoming dividend dates. Wal-Mart is a
dividend aristocrat that has increased its annual cash dividend every year since it established a
$0.05 dividend in 1974.
Twenty-year dividend payout history (annualized)
Year Annualized Payout Change
2014 1.92 +2.13%
2013 1.88 +18.24%
2012 1.59 +45.21%

Dividend.com - 2016 Stock Guide
218
2011 1.10 -9.65%
2010 1.21 +10.99%
2009 1.09 +14.71%
2008 0.95 +8.18%
2007 0.88 +30.95%
2006 0.67 +12.00%
2005 0.60 +15.38%
2004 0.52 +44.44%
2003 0.36 +20.00%
2002 0.30 +7.14%
2001 0.28 +16.67%
2000 0.24 +20.00%
1999 0.20 +28.21%
1998 0.16 +14.71%
1997 0.14 +30.77%
1996 0.10 +4.00%
1995 0.10 +19.05%
1994 0.08 -94.40%
Dividend.com DARS™ Ratings for WMT
Below are Dividend.com's proprietary DARS™ Ratings for WMT as of Dec. 2, 2015. Each value
is based on a scale of 1 to 5.
Relative Strength
3.5
WMT is outperforming much of the market.
Overall Yield Attractiveness
3.5
WMT's dividend yield is above the industry average.

Dividend.com - 2016 Stock Guide
219
Dividend Reliability
4.0
WMT has been paying dividends for 37 years, and we its dividend yield is safe.
Dividend Uptrend
4.0
WMT has shown steady and generous dividends, and has increased its payouts each
year.
Earnings Growth
2.0
WMT has seen its earnings estimates slightly lowered.
Read more about the DARS™ Rating System here.
Dividend.com 2016 Forecast for WMT
Potential Catalysts
● E-commerce sales are growing at a very high rate, as consumers are performing more
shopping online. WalMart’s global e-commerce sales grew 10% last quarter.
● Comparable sales are growing led by WalMart’s small store format, the Neighborhood
Markets banner, which grew comparable sales by 8% last quarter.
● WalMart has a strong balance sheet and generates high returns on capital. This bodes
well for continued dividend growth.
Potential Concerns
● Investments in its employee wages and training will impact earnings growth. The
company expects to spend $1.2 billion on raising employee wages, and another $1.1
billion in costs related to building its e-commerce and mobile businesses.
● WalMart’s brand image has suffered in recent years, as consumers flock to competitors
who are taking share.
Bottom Line
WalMart has experienced a rapid slowdown in growth. However, the stock is cheap, at just 13
times earnings. And, WalMart’s 3.2% dividend yield is near a five-year high. WalMart does not
expect earnings to grow until fiscal 2019. But the company generates enough cash flow to keep
raising its dividend through its turnaround.
Additional Resources for WMT
● Dividend.com Profile Page for WMT
● Full Dividend Payout History for WMT

Dividend.com - 2016 Stock Guide
220
W.P. Carey & Co. (WPC)
2015 Range: 56.01 - 73.88 Avg. Volume: 335,016
Market Cap: 6.24B P/E Ratio (2016): 33.97
2015 EPS Est: 1.57 2016 EPS Est: 1.76
Annualized Div: 3.86 Div. Yield: 6.47%
Payout Ratio (2015): 2.46 Payout Ratio (2016): 2.19
WPC Five-Year Stock Chart
Company Profile
W. P. Carey Inc. (WPC) is an independent equity real estate investment trust. The firm also
provides long-term sale-leaseback and build-to-suit financing for companies. It invests in the real
estate markets across the globe. The firm primarily invests in commercial properties that are
generally triple-net leased to single corporate tenants including office, warehouse, industrial,
logistics, retail, hotel, R&D, and self-storage properties. W. P. Carey Inc. was founded in 1973
and is based in New York, New York.
Twenty-year dividend payout history (annualized)

Dividend.com - 2016 Stock Guide
221
Year Annualized Payout Change
2014 3.69 +8.70%
2013 3.39 +38.82%
2012 2.44 +50.55%
2011 1.62 -20.02%
2010 2.03 -11.67%
2009 2.30 +17.44%
2008 1.96 -8.99%
2007 2.15 +18.02%
2006 1.82 +1.79%
2005 1.79 +1.88%
2004 1.76 +1.27%
2003 1.73 +0.99%
2002 1.72 +0.88%
2001 1.70 +0.53%
2000 1.69 +1.20%
1999 1.67 +1.46%
1998 1.65 -14.17%
Dividend.com DARS™ Ratings for WPC
Below are Dividend.com's proprietary DARS™ Ratings for WPC as of Dec. 2, 2015. Each value
is based on a scale of 1 to 5.
Relative Strength
3.0
WPC is performing in-line with the market or better.
Overall Yield Attractiveness
4.5
WPC's dividend yield extremely attractive for dividend investors.

Dividend.com - 2016 Stock Guide
222
Dividend Reliability
4.0
WPC has been paying dividends for 2011 years, and we its dividend yield is safe.
Dividend Uptrend
4.0
WPC has shown steady and generous dividends, and has increased its payouts each year.
Earnings Growth
2.0
WPC has seen its earnings estimates slightly lowered.
● Read more about the DARS™ Rating System here.
Dividend.com 2016 Forecast for WPC
Potential Catalysts
● Extremely high dividend yield. W.P. Carey currently yields 6.3% which is triple the yield
of the S&P 500 Index.
● High quality tenant portfolio, which provides steady growth. Adjusted funds from
operation grew 5% last quarter, year-over-year.
● Diversified portfolio provides long-term stability. The company holds long-term leases
which will lock in steady revenue growth for many years.
Potential Concerns
● Rising interest rates are a headwind for companies like REITs that heavily utilize debt in
their capital structures.
● Clouded operating structure. The company operates in business development companies,
which are outside its core competency.
Bottom Line
W.P. Carey is a high-quality REIT with a strong portfolio. Rising interest rates are a concern, as
the company has $264 million in variable rate debt due next year, and $954 million due in 2018.
But the company should generate enough cash flow to maintain a strong balance sheet, and grow
the dividend. The 6.3% yield should be very attractive to income investors.
Additional Resources for WPC
● Dividend.com Profile Page for WPC
● Full Dividend Payout History for WPC
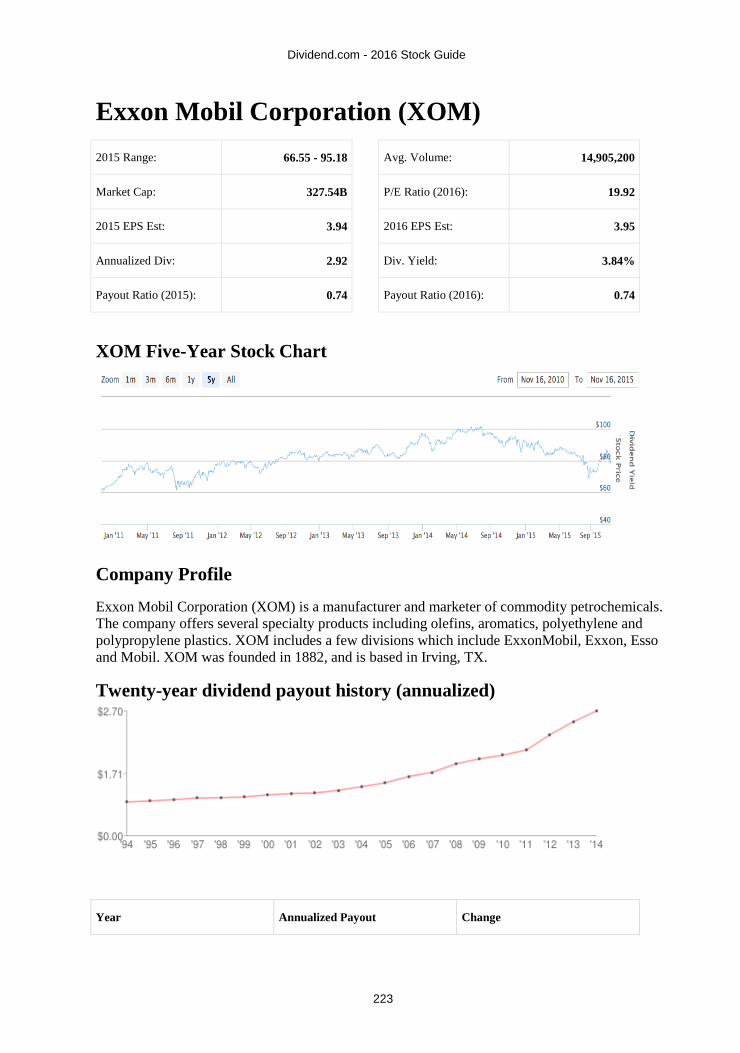
Dividend.com - 2016 Stock Guide
223
Exxon Mobil Corporation (XOM)
2015 Range: 66.55 - 95.18 Avg. Volume: 14,905,200
Market Cap: 327.54B P/E Ratio (2016): 19.92
2015 EPS Est: 3.94 2016 EPS Est: 3.95
Annualized Div: 2.92 Div. Yield: 3.84%
Payout Ratio (2015): 0.74 Payout Ratio (2016): 0.74
XOM Five-Year Stock Chart
Company Profile
Exxon Mobil Corporation (XOM) is a manufacturer and marketer of commodity petrochemicals.
The company offers several specialty products including olefins, aromatics, polyethylene and
polypropylene plastics. XOM includes a few divisions which include ExxonMobil, Exxon, Esso
and Mobil. XOM was founded in 1882, and is based in Irving, TX.
Twenty-year dividend payout history (annualized)
Year Annualized Payout Change

Dividend.com - 2016 Stock Guide
224
2014 2.70 +9.76%
2013 2.46 +12.84%
2012 2.18 +17.84%
2011 1.85 +6.32%
2010 1.74 +4.82%
2009 1.66 +7.10%
2008 1.55 +13.14%
2007 1.37 +7.03%
2006 1.28 +12.28%
2005 1.14 +7.55%
2004 1.06 +8.16%
2003 0.98 +6.52%
2002 0.92 +1.10%
2001 0.91 +3.41%
2000 0.88 +5.39%
1999 0.84 +1.83%
1998 0.82 +0.92%
1997 0.81 +4.17%
1996 0.78 +4.00%
1995 0.75 +3.09%
1994 0.73 -80.26%
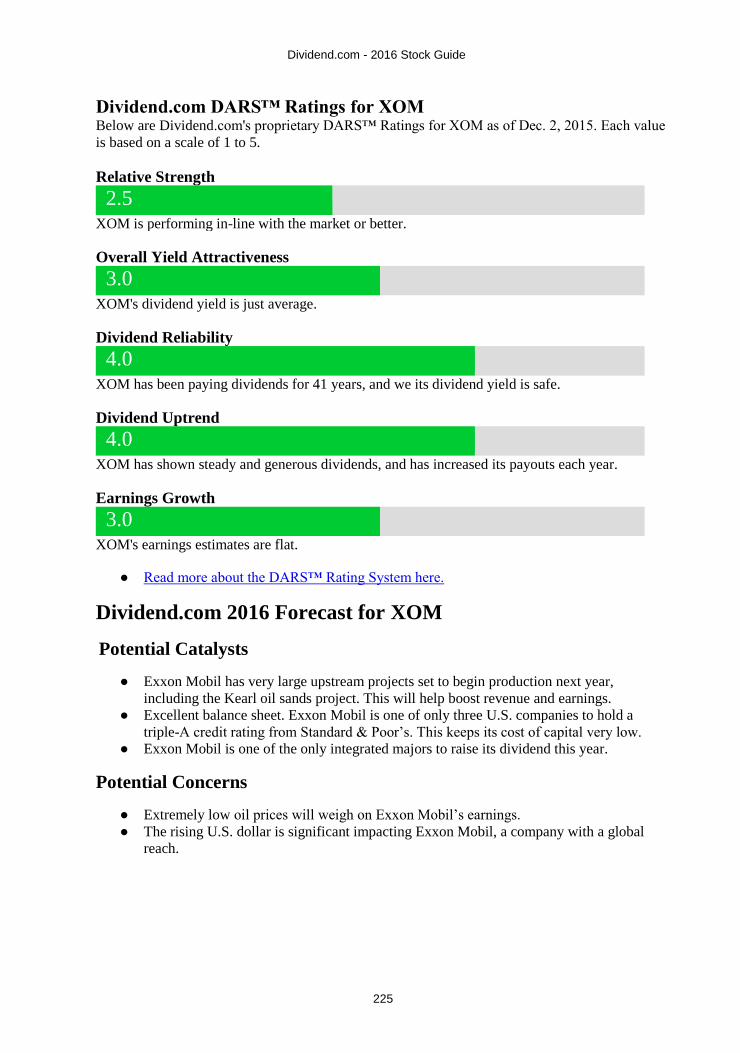
Dividend.com - 2016 Stock Guide
225
Dividend.com DARS™ Ratings for XOM
Below are Dividend.com's proprietary DARS™ Ratings for XOM as of Dec. 2, 2015. Each value
is based on a scale of 1 to 5.
Relative Strength
2.5
XOM is performing in-line with the market or better.
Overall Yield Attractiveness
3.0
XOM's dividend yield is just average.
Dividend Reliability
4.0
XOM has been paying dividends for 41 years, and we its dividend yield is safe.
Dividend Uptrend
4.0
XOM has shown steady and generous dividends, and has increased its payouts each year.
Earnings Growth
3.0
XOM's earnings estimates are flat.
● Read more about the DARS™ Rating System here.
Dividend.com 2016 Forecast for XOM
Potential Catalysts
● Exxon Mobil has very large upstream projects set to begin production next year,
including the Kearl oil sands project. This will help boost revenue and earnings.
● Excellent balance sheet. Exxon Mobil is one of only three U.S. companies to hold a
triple-A credit rating from Standard & Poor’s. This keeps its cost of capital very low.
● Exxon Mobil is one of the only integrated majors to raise its dividend this year.
Potential Concerns
● Extremely low oil prices will weigh on Exxon Mobil’s earnings.
● The rising U.S. dollar is significant impacting Exxon Mobil, a company with a global
reach.

Dividend.com - 2016 Stock Guide
226
Bottom Line
Exxon Mobil yields more than 3% and raised its dividend by 6% this year, even in an
environment of very low commodity prices. This speaks to the strength of Exxon Mobil’s
business. Its refining segment is providing a valuable offset against lower oil and gas prices.
Exxon Mobil can be a core holding in a dividend portfolio.
Additional Resources for XOM
● Dividend.com Profile Page for XOM
● Full Dividend Payout History for XOM

Dividend.com - 2016 Stock Guide
227
Disclaimer: This eBook is intended for use ONLY by the subscriber whose name appears on our subscription records.
It may not be copied, faxed or forwarded without written consent from Dividend.com. If you are reading this report and
are not a subscriber, you may be in violation of laws regarding the copyrights for this publication, which are held by
Dividend.com.
Contact e-mail: [email protected]
Website: http://www.dividend.com/
All content in this eBook is Copyright © 2015-2016 Mitre Media Corporation. All rights reserved.