![The Official Guide for GMAT Quantitative Review by Graduate Management Admission Council [GMAC] (1st Edition)](https://static.fdocuments.us/doc/165x107/5492ee50ac7959412e8b4732/the-official-guide-for-gmat-quantitative-review-by-graduate-management-admission-council-gmac-1st-edition.jpg)
© 2014 Graduate Management Admission Council® (GMAC®) All rights reserved. Graduate Management...
39
© 2014 Graduate Management Admission Council® (GMAC®) All rights reserved. Graduate Management Education Trends 2014 Glenda Lucas | Market Development, Senior Manager, Americas Graduate Management Admission Council MAACBA| October 2014
-
Upload
jean-lester -
Category
Documents
-
view
218 -
download
0
Transcript of © 2014 Graduate Management Admission Council® (GMAC®) All rights reserved. Graduate Management...

© 2014 Graduate Management Admission Council® (GMAC®) All rights reserved.
Graduate Management Education Trends 2014
Glenda Lucas | Market Development, Senior Manager, AmericasGraduate Management Admission Council
MAACBA| October 2014

© 2014 Graduate Management Admission Council® (GMAC®) All rights reserved.
Agenda
• Global Student Demand
Application Trends and Candidate Messaging
US Market Specifics
• Jobs and Corporate Recruiters

© 2014 Graduate Management Admission Council® (GMAC®) All rights reserved.
GMAC Research
GMAT Trend Analysis
GMAC Survey Research
GMASS Search Service

© 2014 Graduate Management Admission Council® (GMAC®) All rights reserved.
Global Demand for Graduate Management DegreesGMAT Exams Taken Worldwide Since Testing Year 2001
TY01 TY02 TY03 TY04 TY05 TY06 TY07 TY08 TY09 TY10 TY11 TY12 TY13 TY14
244,655265,613
286,529
243,529Exams Taken
TY2014
Source: GMAT® Exams Taken Data: TY2001 to TY2014
IR Impact

© 2014 Graduate Management Admission Council® (GMAC®) All rights reserved.

© 2014 Graduate Management Admission Council® (GMAC®) All rights reserved.
Global Demand for Graduate Management Degrees
243,529Exams Taken
TY2014
“Unique” Rate = 78% 188,927
Unique Examinees TY2014
Regional Differences:North America: 85% unique | APAC: 69% unique
Source: GMAT® Data Analysis

© 2014 Graduate Management Admission Council® (GMAC®) All rights reserved.
Discovering Talent Worldwide188,927 Unique GMAT Examinees in TY2014
North American 79,037 Examinees-9% Compound Annual Growth Rate Since ‘10
European19,248, -1%
Mexican &Latin American5,585, -2%
Middle Eastern& African11,279, -5%
Asian-Pacific73,778, +4%
Source: GMAT® Examinees by Region of Citizenship

© 2014 Graduate Management Admission Council® (GMAC®) All rights reserved.
Student Characteristic Trends
Younger Candidates
Women
Specialized Masters
Global Trends‘10 to ‘14
Younger than 2542% 48%
Women40% 42%
Scores Sent22% 30%
Source: Unique GMAT examinees and scores reports sent.

© 2014 Graduate Management Admission Council® (GMAC®) All rights reserved.
Asia-Pacific Europe North America Middle East- Africa
LATAM
47% 47%42%
29%20%
57% 57%
41%
29%20%
TY2010 TY2014
Region of Citizenship
Youth Movement in Europe and Asia% of GMAT Examinees Younger Than 25
Regional Variation – European ExampleYounger: France (69%), Germany (68%) | Older: UK (31%), Portugal (35%)
Source: GMAT® Unique Examinees by Citizenship

© 2014 Graduate Management Admission Council® (GMAC®) All rights reserved.
More Women in Asia% Women among GMAT Examinees
Asia-Pacific North America Europe Middle East- Africa
LATAM
43% 39% 38% 36% 35%
49%38% 37% 39% 35%
TY2010 TY2014
Region of Citizenship
Regional Variation – APAC Example
More Women: China (66%), Vietnam (59%) | Fewer Women: India (28%), S. Korea (33%)
Source: GMAT® Unique Examinees by Citizenship
© 2014 Graduate Management Admission Council® (GMAC®) All rights reserved.
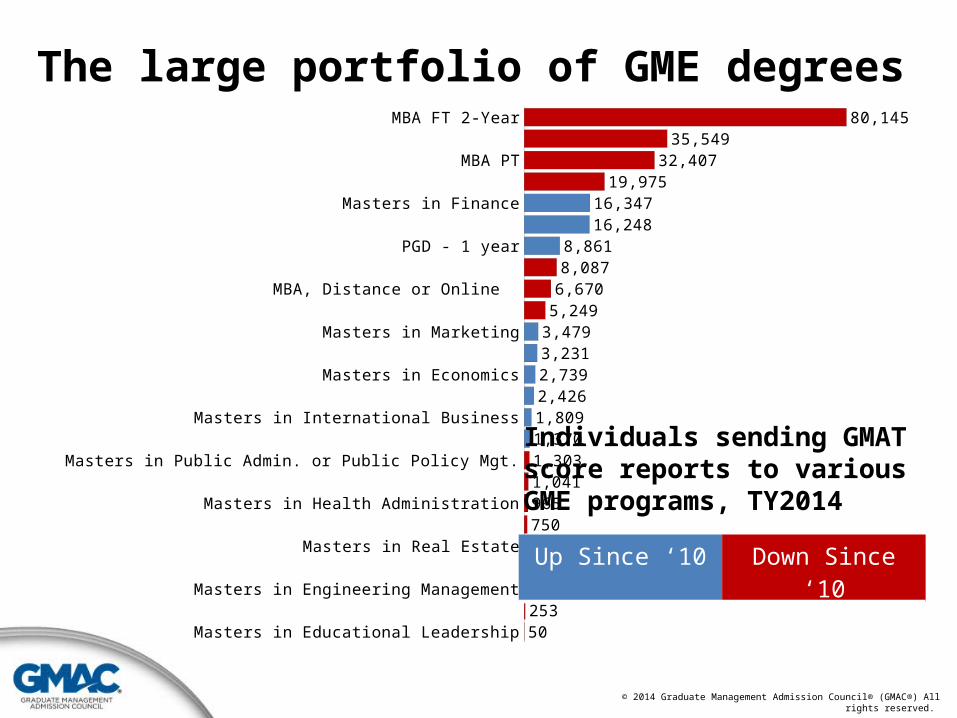
Masters in Educational LeadershipMasters in Communications
Masters in Engineering ManagementMasters in Entrepreneurship
Masters in Real EstateMasters in Hospitality
Masters in Health AdministrationMasters in HR, Ind. Relations, or Org. BehaviorMasters in Public Admin. or Public Policy Mgt.
Masters in Supply Chain Mgt, Logistics, or Ops.Masters in International Business
PGD - 2yearMasters in Economics
Masters in ITMasters in Marketing
PhD in BusinessMBA, Distance or Online
EMBA, 2 YearsPGD - 1 year
Masters in Business or ManagementMasters in Finance
Masters in AccountingMBA PT
MBA FT 1-YearMBA FT 2-Year
502533705737357509651,0411,3031,3701,8092,4262,7393,2313,479
5,2496,670
8,0878,861
16,24816,347
19,97532,407
35,54980,145
The large portfolio of GME degrees
Individuals sending GMAT score reports to various GME programs, TY2014
Up Since ‘10 Down Since ‘10

© 2014 Graduate Management Admission Council® (GMAC®) All rights reserved.
Interest in specialized business master’s programs has increased over the past five years, but MBA programs remain the dominant program type that mba.com registrants consider for their advanced business education
% of mba.com Prospective Students indicating program consideration, 2013

© 2014 Graduate Management Admission Council® (GMAC®) All rights reserved.
Women Men < 25 25 to 30 31+ 0 1 to 3 4 to 9 10+ Gender Age Years of Work Experiecne
37%
63%
36%45%
18% 16%
37% 36%
11%
49% 51%
68%
23%
9%
46%
32%
15%6%
MBA Degrees Non-MBA Business Masters Degrees
Unique Examinees Sending Scores in TY2014 by Degree Type
Note: Unique GMAT examinees sending scores by program group 3 classification
Distinct Pipelines
© 2014 Graduate Management Admission Council® (GMAC®) All rights reserved.
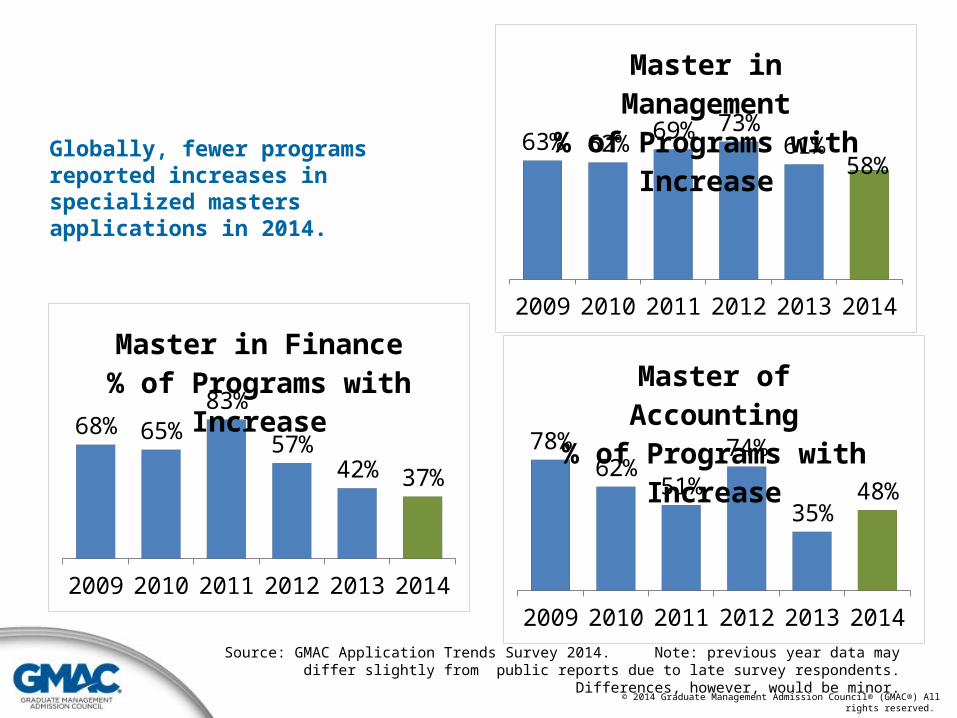
Globally, fewer programs reported increases in specialized masters applications in 2014.
2009 2010 2011 2012 2013 2014
63% 62% 69% 73%61%
58%
Master in Management% of Programs with In-
crease
2009 2010 2011 2012 2013 2014
68% 65%83%
57%42% 37%
Master in Finance% of Programs with
Increase
2009 2010 2011 2012 2013 2014
78%62%
51%
74%
35%48%
Master of Accounting% of Programs with
Increase
Source: GMAC Application Trends Survey 2014. Note: previous year data may differ slightly from public reports due to late survey respondents. Differences, however, would be minor.

© 2014 Graduate Management Admission Council® (GMAC®) All rights reserved.
One Possible Reason
TY2010 TY2011 TY2012s TY2013s TY20140
5,000
10,000
15,000
20,000
25,000
30,000
35,000
40,000
23,331
29,613
35,22637,383 36,085
Chinese Citizens: Unique GMAT Examinees
Source: GMAT® Examinees by Citizenship. TY2012 and TY2013 smoothed to adjust for IR testing spike in TY2012.
Note: Testing in China has jumped in July and Aug 2014
© 2014 Graduate Management Admission Council® (GMAC®) All rights reserved.
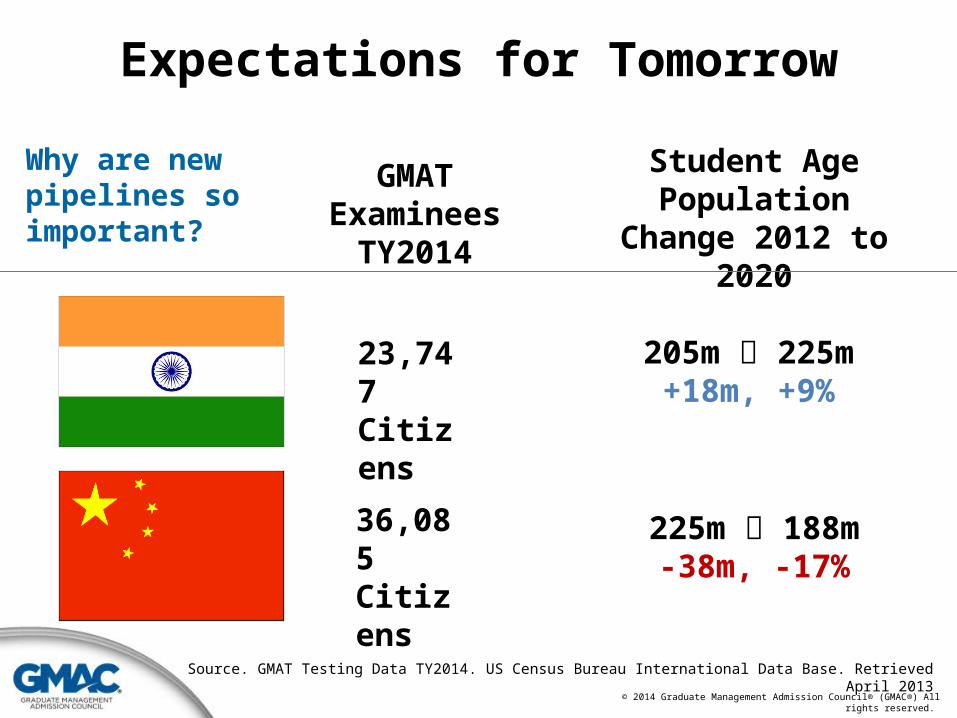
Why are new pipelines so important?
36,085 Citizens
23,747 Citizens
GMAT Examinees TY2014
Student Age Population Change
2012 to 2020
205m 225m+18m, +9%
225m 188m-38m, -17%
Source. GMAT Testing Data TY2014. US Census Bureau International Data Base. Retrieved April 2013
Expectations for Tomorrow

© 2014 Graduate Management Admission Council® (GMAC®) All rights reserved.
Globally, FT MBA programs show signs of stabilization while PT MBAs struggle
2009 2010 2011 2012 2013 2014
42% 43% 41% 44%
29%
44%
PT MBA% of Programs with
Increase
2009 2010 2011 2012 2013 2014
69%
49%33%
47% 49%37%
FT MBA 1-Year% of Programs with
Increase
2009 2010 2011 2012 2013 2014
64%
41%28%
43%50%
61%
FT MBA 2-Year% of Programs with
Increase
Source: GMAC Application Trends Survey 2014. Note: previous year data may differ slightly from public reports due to late survey respondents. Differences, however, would be minor.

© 2014 Graduate Management Admission Council® (GMAC®) All rights reserved.
Will Specialized Masters Degrees ErodeMBA Pipelines of Tomorrow?
Accounting Masters Finance Masters Management Masters
31%
46%38%
19%8%
24%
50% 46%38%
Likely Uncertain Unlikely
How likely are you to consider an MBAnow that you’ve earned a specialized masters?
Source. GMAC Graduate Management Education Graduate Survey (GMEGS) 2014.
Question answered by 2014 grads!

© 2014 Graduate Management Admission Council® (GMAC®) All rights reserved.
Time Frame When Students Develop Short List of Business Schools, by Average Number of Months Beforethe GMAT Exam, and by Citizenship
mba.com Prospective Students, 2013

© 2014 Graduate Management Admission Council® (GMAC®) All rights reserved.
Top Motivations
Increase Job Opportunities (66%)Increase Salary Potential (64%)Develop Business Knowledge,
Skills, & Abilities (63%)
Source: GMAC mba.com Prospective Students Survey, 2013
Moving Beyond One-Dimensional Student Motivations
ReligionPolitics and public life
Volunteer workEntertainment
CommunityThe environment
WealthTravel
RelativesFree time and relaxation
Friends and acquaintancesFamily and children
Career and workFinancial security
4.04.3
4.75.25.25.35.45.55.55.6
5.96.06.16.1
1 = Not at all Important
7 = Extremely Important
Psychographic Drivers of Prospects

© 2014 Graduate Management Admission Council® (GMAC®) All rights reserved.
US Testing Specifics

© 2014 Graduate Management Admission Council® (GMAC®) All rights reserved.
US Business Schools – Professional Degrees % of Programs with Application Growth by Year
2009 2010 2011 2012 2013 2014
39% 39% 40% 42%
28%34%
PT MBA (n=92)
2009 2010 2011 2012 2013 2014
32%45% 42%
55%
32%39%
EMBA (n=33)
Source: GMAC Application Trends Survey 2013. Note: previous year data may differ slightly from public reports due to late survey respondents. Differences, however, would be minor.
2009 2010 2011 2012 2013 2014
75%58%
33%
62%43% 43%
Online MBA (n=15)

© 2014 Graduate Management Admission Council® (GMAC®) All rights reserved.
US Business Schools – Full-Time Degrees % of Programs with Application Growth by Year
2009 2010 2011 2012 2013 2014
61%
40%29% 32%
52%62%
FT MBA 2-Year (n=101)
Source: GMAC Application Trends Survey 2013. Note: previous year data may differ slightly from public reports due to late survey respondents. Differences, however, would be minor.
2012 2013 2014Domestic Candidates 22% 38% 48%Foreign Candidates 41% 56% 65%
US FT 2-Year MBA Programs withincreasing applications by applicant type
Programs with Growth by US RegionOverall Apps vs. Domestic Apps
• Midwest: 67% vs. 34%• West: 65% vs. 52%• South: 63% vs. 55%• Northeast: 54% vs. 44%

© 2014 Graduate Management Admission Council® (GMAC®) All rights reserved.
US SchoolsGMAT Scores
Received % of total
1. FT MBA 2-Year 246,540 49%
2. PT MBA 59,535 12%
3. Master's in Accounting 58,715 12%
4. Master's in Finance 33,322 7%
5. FT MBA 1-Year 21,084 4%
Top 5 Subtotal 419,196 83%
US Total 503,708 100%
Top 5 Program Types ReceivingGMAT Score Reports in TY2014
Source: GMAT Score-Sending Trends TY2014

© 2014 Graduate Management Admission Council® (GMAC®) All rights reserved.
US Student Pipeline Characteristics
Middle At-lantic
Midwest Northeast South Southwest West
38% 38% 41% 42% 41% 38%39% 40% 41% 42% 40% 40%
TY2010TY2014
Middle At-lantic
Midwest Northeast South Southwest West
41% 43% 42%47%
40%
30%
40%46% 44%
51%42%
33%
TY2010TY2014
% Women
% Younger Than 25
Source: GMAT® Unique Examinees by Residence

© 2014 Graduate Management Admission Council® (GMAC®) All rights reserved.
GMAT Examinees by US Metro Area of Residence TY20145 Year
Growth Rate
Change from
TY2013New York-Northern New Jersey-Long Island, NY-NJ-PA 10,384 -9% -4%Los Angeles-Long Beach-Santa Ana, CA 4,114 -9% 1%Chicago-Naperville-Joliet, IL-IN-WI 3,925 -9% -5%Washington-Arlington-Alexandria, DC-VA-MD-WV 3,319 -8% 0%Boston-Cambridge-Quincy, MA-NH 3,038 -11% -7%Houston-Sugar Land-Baytown, TX 2,793 -6% 1%Dallas-Fort Worth-Arlington, TX 2,500 -8% -10%San Francisco-Oakland-Fremont, CA 2,393 -8% 0.3%Atlanta-Sandy Springs-Marietta, GA 2,186 -11% -7%Philadelphia-Camden-Wilmington, PA-NJ-DE-MD 2,137 -8% -1%Seattle-Tacoma-Bellevue, WA 1,509 -5% 4%Miami-Fort Lauderdale-Pompano Beach, FL 1,445 -6% 4%San Diego-Carlsbad-San Marcos, CA 1,239 -6% -1%Minneapolis-St. Paul-Bloomington, MN-WI 1,184 -10% -7%Detroit-Warren-Livonia, MI 1,121 -8% -5%San Jose-Sunnyvale-Santa Clara, CA 1,100 -11% -4%Denver-Aurora, CO 1,039 -8% -6%Pittsburgh, PA 914 -4% -2%Tampa-St. Petersburg-Clearwater, FL 882 -5% -11%St. Louis, MO-IL 849 -8% -6%
Source: GMAT® Unique Examinees by Residence
Change in GMAT Examinees from
TY2013
Growth• Seattle: 4%• Miami: 4%• Houston: 1%• LA: 1%
Decline• Atlanta: -11%• Boston: -11%• San Jose: -11%• Minneapolis:
-10%
GMAT Examinees by US Metro Area

GMAT Examinees by US Metro Area of Residence Women Younger Than 25
MBA or EMBA Interest
Business Undergrads
New York-Northern New Jersey-Long Island, NY-NJ-PA 41% 40% 74% 51%Los Angeles-Long Beach-Santa Ana, CA 41% 32% 76% 45%Chicago-Naperville-Joliet, IL-IN-WI 37% 33% 77% 50%Washington-Arlington-Alexandria, DC-VA-MD-WV 39% 29% 79% 40%Boston-Cambridge-Quincy, MA-NH 40% 39% 74% 45%Houston-Sugar Land-Baytown, TX 42% 36% 69% 54%Dallas-Fort Worth-Arlington, TX 40% 41% 61% 57%San Francisco-Oakland-Fremont, CA 44% 29% 79% 40%Atlanta-Sandy Springs-Marietta, GA 40% 40% 66% 61%Philadelphia-Camden-Wilmington, PA-NJ-DE-MD 38% 39% 76% 53%Seattle-Tacoma-Bellevue, WA 42% 33% 71% 48%Miami-Fort Lauderdale-Pompano Beach, FL 42% 56% 55% 66%San Diego-Carlsbad-San Marcos, CA 37% 30% 75% 44%Minneapolis-St. Paul-Bloomington, MN-WI 40% 34% 80% 51%Detroit-Warren-Livonia, MI 38% 45% 73% 55%San Jose-Sunnyvale-Santa Clara, CA 42% 26% 80% 34%Denver-Aurora, CO 41% 39% 56% 55%Pittsburgh, PA 39% 48% 79% 57%Tampa-St. Petersburg-Clearwater, FL 41% 49% 59% 68%St. Louis, MO-IL 40% 52% 65% 61%
Source: GMAT® Unique Examinees by Residence
Characteristics of GMAT Examinees by US Metro Area

© 2014 Graduate Management Admission Council® (GMAC®) All rights reserved.
GMAT Scores Received by School Location TY2014 5 Year Growth
RateChange Since
TY2013California 72,327 -3% 8%New York 62,829 -4% -2%Massachusetts 52,563 -4% 2%Illinois 39,678 -4% 1%Texas 36,893 -3% 1%Pennsylvania 30,801 -5% 2%North Carolina 19,483 -5% 1%Florida 16,593 -6% -6%Michigan 12,936 -5% -1%Georgia 11,271 -9% -2%Ohio 11,162 -8% -5%Indiana 10,388 -5% 2%Virginia 9,045 -6% -2%Maryland 8,959 6% 15%District Of Columbia 8,257 -8% -2%Connecticut 8,229 -2% 7%Washington 8,040 -1% 14%Missouri 7,013 -5% 1%Tennessee 6,992 -5% 3%New Jersey 6,528 -9% -9%
Source: GMAT® Score Sending Data
GMAT Score Reports Received by US State
Change in GMAT Score Volume from
TY2013
Growth• Maryland: 15%• Washington: 14%• California: 8%• Connecticut: 7%
Decline• New Jersey: -9%• Florida: -6%• Ohio: -5%• New York: -2%

GMAT Scores Received by School Location
% Non-US Citizens
% US Citizens
% MBA and EMBA Programs
% Non-MBA Masters Programs
% Other Programs (e.g., PhD)
California 56% 44% 79% 19% 2%New York 62% 38% 65% 32% 3%Massachusetts 65% 35% 75% 22% 3%Illinois 56% 44% 75% 22% 2%Texas 47% 53% 60% 35% 4%Pennsylvania 55% 45% 78% 18% 3%North Carolina 42% 58% 71% 26% 3%Florida 38% 62% 52% 42% 5%Michigan 52% 48% 71% 26% 3%Georgia 38% 62% 70% 26% 4%Ohio 55% 45% 57% 39% 4%Indiana 54% 46% 72% 24% 4%Virginia 41% 59% 70% 27% 3%Maryland 68% 32% 41% 56% 3%District Of Columbia 51% 49% 63% 36% 2%Connecticut 56% 44% 82% 16% 3%Washington 47% 53% 67% 28% 5%Missouri 44% 56% 51% 30% 20%Tennessee 24% 76% 66% 31% 2%New Jersey 51% 49% 58% 38% 4%
Characteristics of GMAT Examinees Sending Scores to Top 20 US States

© 2014 Graduate Management Admission Council® (GMAC®) All rights reserved.
Job Outcomes in 2014

© 2014 Graduate Management Admission Council® (GMAC®) All rights reserved.
How students view their economy% of prospects perceiving regional economy as stable or strong
Jan 2009
Jun 2009
Nov 2009
Apr 2010
Sep 2010
Feb 2011
Jul 2
011
Dec 2011
May
2012
Oct 2012
Mar
2013
Aug 2013
0%10%20%30%40%50%60%70%80%90%
APAC North America Europe
Until 2011, prospects worldwide sensed a modest recovery
Source: GMAC mba.com Prospective Students Survey. Data by residence and smoothed by three months.

© 2014 Graduate Management Admission Council® (GMAC®) All rights reserved.
A tale of three regions since 2011
How students view their economy% of prospects perceiving regional economy as stable or strong
Jan 2009
Jun 2009
Nov 2009
Apr 2010
Sep 2010
Feb 2011
Jul 2
011
Dec 2011
May
2012
Oct 2012
Mar
2013
Aug 2013
0%10%20%30%40%50%60%70%80%90%
APAC North America Europe
Source: GMAC mba.com Prospective Students Survey. Data by residence and smoothed by three months.

© 2014 Graduate Management Admission Council® (GMAC®) All rights reserved.
More Companies are Hiring
2007 2008 2009 2010 2011 2012 2013 2014*
64% 59%50%
62%72% 71% 73%
80%
% of Companies HiringMBA Graduates
* 2014 Planned MBA HiringSource: GMAC Corporate Recruiters Survey, 2014
The percent of companies planning to hire MBAs reached 8-year high in 2014.

© 2014 Graduate Management Admission Council® (GMAC®) All rights reserved.
Northeast South Midwest West
84% 81% 83%76%
87%81%
91% 87%
% companies hiring MBAs
2013 (actual) 2014 (planned)
% o
f com
pani
esHiring Expectations Among US Companies
Source: GMAC Corporate Recruiters Survey 2014. Not enough 2014 data available for Middle Atlantic and Southwest. 2012 planned shown for these regions.
© 2014 Graduate Management Admission Council® (GMAC®) All rights reserved.
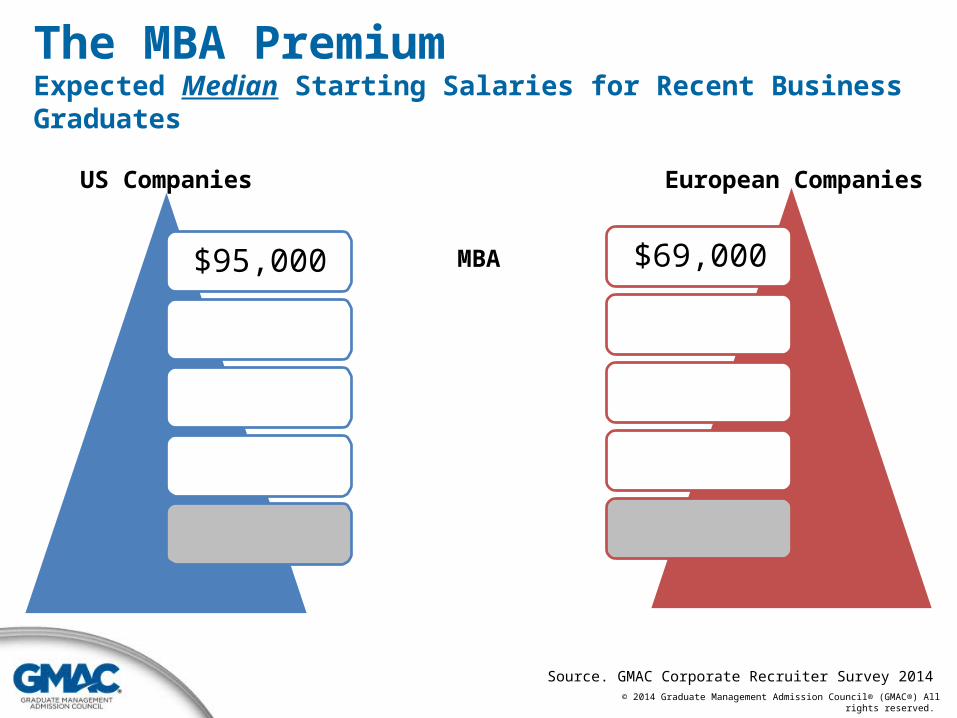
The MBA PremiumExpected Median Starting Salaries for Recent Business Graduates
$95,000
US Companies
$69,000
European Companies
MBA
Source. GMAC Corporate Recruiter Survey 2014

© 2014 Graduate Management Admission Council® (GMAC®) All rights reserved.
The MBA PremiumExpected Median Starting Salaries for Recent Business Graduates
$95,000
$75,000*
$73,000
$63,000
US Companies
$69,000
$55,000
$57,000
$52,000
European Companies
MBA
Masters in Management
Masters in Finance
Masters of Accounting
Source. GMAC Corporate Recruiter Survey 2014*Source. GMAC Corporate Recruiter Survey 2013

© 2014 Graduate Management Admission Council® (GMAC®) All rights reserved.
The MBA PremiumExpected Median Starting Salaries for Recent Business Graduates
$95,000
$75,000*
$73,000
$63,000
$50,000
US Companies
$69,000
$55,000
$57,000
$52,000
$41,000
European Companies
MBA
Masters in Management
Masters in Finance
Masters of Accounting
Bachelors Degree (All Fields)
Source. GMAC Corporate Recruiter Survey 2014*Source. GMAC Corporate Recruiter Survey 2013

© 2014 Graduate Management Admission Council® (GMAC®) All rights reserved.
Summary
• GMAT trends indicate general softening
• World regions with strong interest in specialized masters programs tend to have a greater share of women and younger candidates taking the GMAT
• App trends show a mixed picture for MBAs and moderating for specialized masters as China slows
• The US job market continues to stabilize for graduates

© 2014 Graduate Management Admission Council® (GMAC®) All rights reserved.
Questions?Glenda Lucas I [email protected]
Thank You!