© 2012 Cengage Learning. All Rights Reserved. May not be...
42
© 2012 Cengage Learning. All Rights Reserved. May not be copied, scanned, or duplicated, in whole or in part, except for use as permitted in a license distributed with a certain product or service or otherwise on a password-protected website for classroom use. © 2012 Cengage Learning. All Rights Reserved. May not be copied, scanned, or duplicated, in whole or in part, except for use as permitted in a license distributed with a certain product or service or otherwise on a password-protected website for classroom use. 7 1
Transcript of © 2012 Cengage Learning. All Rights Reserved. May not be...
© 2012 Cengage Learning. All Rights Reserved. May not be copied, scanned, or duplicated, in whole or in part, except for use as
permitted in a license distributed with a certain product or service or otherwise on a password-protected website for classroom use.
© 2012 Cengage Learning. All Rights Reserved. May not be copied, scanned, or duplicated, in whole or in part, except for use as
permitted in a license distributed with a certain product or service or otherwise on a password-protected website for classroom use.
7 1

© 2012 Cengage Learning. All Rights Reserved. May not be copied, scanned, or duplicated, in whole or in part, except for use as
permitted in a license distributed with a certain product or service or otherwise on a password-protected website for classroom use.
© 2012 Cengage Learning. All Rights Reserved. May not be copied, scanned, or duplicated, in whole or in part, except for use as
permitted in a license distributed with a certain product or service or otherwise on a password-protected website for classroom use.
Unemployment
• Unemployment
– Personal cost
– Cost on the economy
• Measuring unemployment
– Civilian non-institutional adult population
– Labor force
• Employed + Unemployed
– Unemployment rate
• Percentage of unemployed in the labor force
2

© 2012 Cengage Learning. All Rights Reserved. May not be copied, scanned, or duplicated, in whole or in part, except for use as
permitted in a license distributed with a certain product or service or otherwise on a password-protected website for classroom use.
© 2012 Cengage Learning. All Rights Reserved. May not be copied, scanned, or duplicated, in whole or in part, except for use as
permitted in a license distributed with a certain product or service or otherwise on a password-protected website for classroom use.
Unemployment
• Civilian non-institutional adult population
– All civilians 16 years of age and older
– Except those in prison, in mental
facilities, or in homes for the aged
• Labor force
– Those 16 years of age and older
– Working or looking for work
• Civilian population
– Not in the military 3

© 2012 Cengage Learning. All Rights Reserved. May not be copied, scanned, or duplicated, in whole or in part, except for use as
permitted in a license distributed with a certain product or service or otherwise on a password-protected website for classroom use.
© 2012 Cengage Learning. All Rights Reserved. May not be copied, scanned, or duplicated, in whole or in part, except for use as
permitted in a license distributed with a certain product or service or otherwise on a password-protected website for classroom use.
Unemployment
• Adult population
– Employed
• Working full time or part time
– Not working
• Unemployed (looking for work)
• Not in labor force
– Retired; Students; Don’t want to work
– Discouraged workers
4

© 2012 Cengage Learning. All Rights Reserved. May not be copied, scanned, or duplicated, in whole or in part, except for use as
permitted in a license distributed with a certain product or service or otherwise on a password-protected website for classroom use.
Exhibit 1
5
The Adult Population = the Employed, Unemployed,
and Those Not in the Labor Force: 4/2010 (millions)
The labor force, depicted by the left circle, consists of those employed plus those unemployed.
Those not working, depicted by the right circle, consists of those not in the labor force and those
unemployed. The adult population sums the employed, the unemployed, and those not in the
labor force.

© 2012 Cengage Learning. All Rights Reserved. May not be copied, scanned, or duplicated, in whole or in part, except for use as
permitted in a license distributed with a certain product or service or otherwise on a password-protected website for classroom use.
© 2012 Cengage Learning. All Rights Reserved. May not be copied, scanned, or duplicated, in whole or in part, except for use as
permitted in a license distributed with a certain product or service or otherwise on a password-protected website for classroom use.
Unemployment
• Unemployment rate
– Number unemployed as a percentage of
the labor force
• Discouraged workers
– Drop out of the labor force in frustration
because they can’t find work
6

© 2012 Cengage Learning. All Rights Reserved. May not be copied, scanned, or duplicated, in whole or in part, except for use as
permitted in a license distributed with a certain product or service or otherwise on a password-protected website for classroom use.
© 2012 Cengage Learning. All Rights Reserved. May not be copied, scanned, or duplicated, in whole or in part, except for use as
permitted in a license distributed with a certain product or service or otherwise on a password-protected website for classroom use.
Unemployment
• Labor force participation rate
– Labor force as percentage of adult
population
• Unemployment over time
– Rise during contractions
– Fall during expansions
– 1980s to 2000: Overall downward trend
• Growing economy
• Fewer teenagers in workforce
7

© 2012 Cengage Learning. All Rights Reserved. May not be copied, scanned, or duplicated, in whole or in part, except for use as
permitted in a license distributed with a certain product or service or otherwise on a password-protected website for classroom use.
© 2012 Cengage Learning. All Rights Reserved. May not be copied, scanned, or duplicated, in whole or in part, except for use as
permitted in a license distributed with a certain product or service or otherwise on a password-protected website for classroom use.
Unemployment
• Unemployment over time
– 2000 to 2010: Overall upward trend
• Recession of 2001
• Sharper recession of 2008-2009
• Slower job creation
• Number of unemployed
– 6 million in 2000
– 15 million in 2010
• Unemployment rate
– Increased form 4 to 10%
8
© 2012 Cengage Learning. All Rights Reserved. May not be copied, scanned, or duplicated, in whole or in part, except for use as
permitted in a license distributed with a certain product or service or otherwise on a password-protected website for classroom use.
Exhibit 2
9
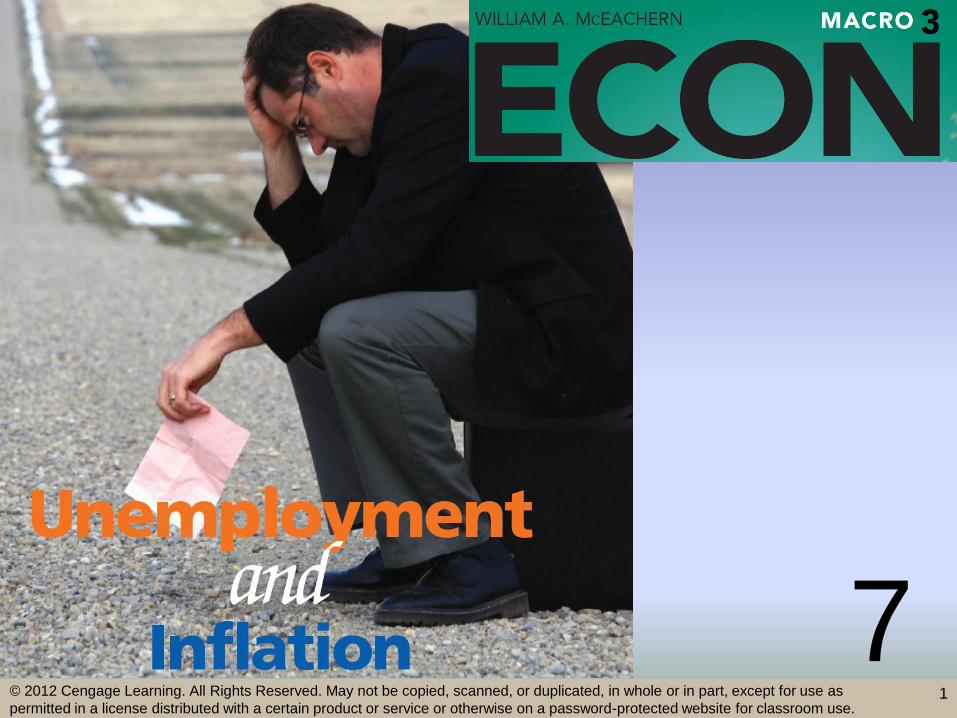
The U.S. Unemployment Rate Since 1900
Since 1900, the unemployment rate has fluctuated widely, rising during contractions and
falling during expansions. During the Great Depression of the 1930s, the rate spiked to
25 percent.

© 2012 Cengage Learning. All Rights Reserved. May not be copied, scanned, or duplicated, in whole or in part, except for use as
permitted in a license distributed with a certain product or service or otherwise on a password-protected website for classroom use.
© 2012 Cengage Learning. All Rights Reserved. May not be copied, scanned, or duplicated, in whole or in part, except for use as
permitted in a license distributed with a certain product or service or otherwise on a password-protected website for classroom use.
Unemployment
• Unemployment in various groups
– More education
• Lower unemployment
– Age
• Higher unemployment among teenagers
– Race and ethnicity
• Lower unemployment among white workers
– Gender
• Lower unemployment rate for women
10
© 2012 Cengage Learning. All Rights Reserved. May not be copied, scanned, or duplicated, in whole or in part, except for use as
permitted in a license distributed with a certain product or service or otherwise on a password-protected website for classroom use.
Exhibit 3
11
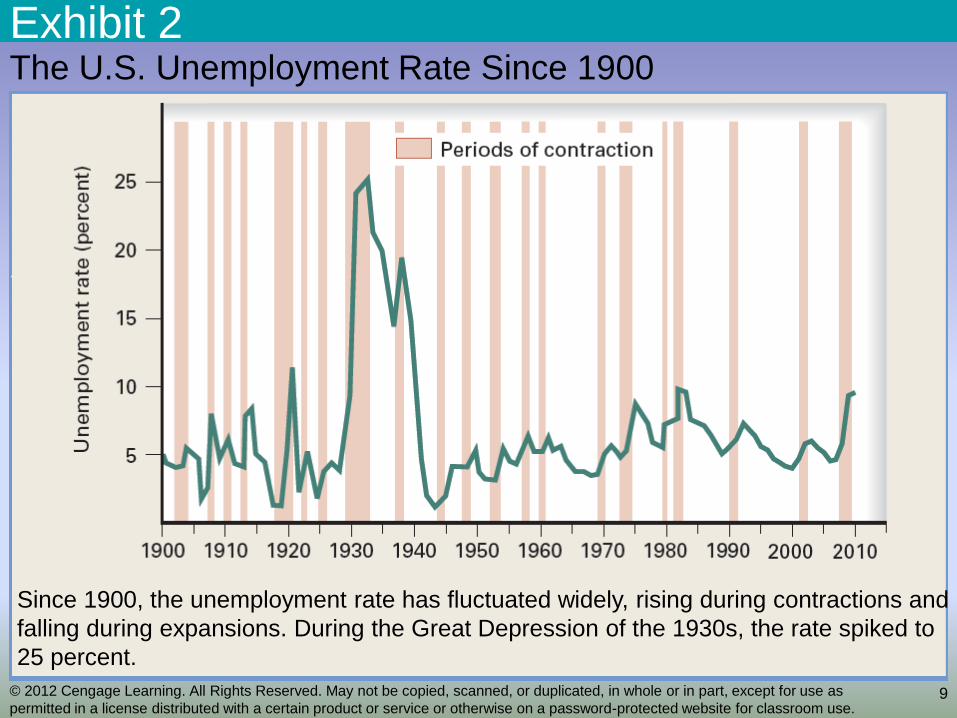
Unemployment Rates for Various Groups (a)
Different groups face different unemployment rates. The unemployment rate is higher
for black workers than for white and higher for teenagers than for those 20 and older.
© 2012 Cengage Learning. All Rights Reserved. May not be copied, scanned, or duplicated, in whole or in part, except for use as
permitted in a license distributed with a certain product or service or otherwise on a password-protected website for classroom use.
Exhibit 3
12
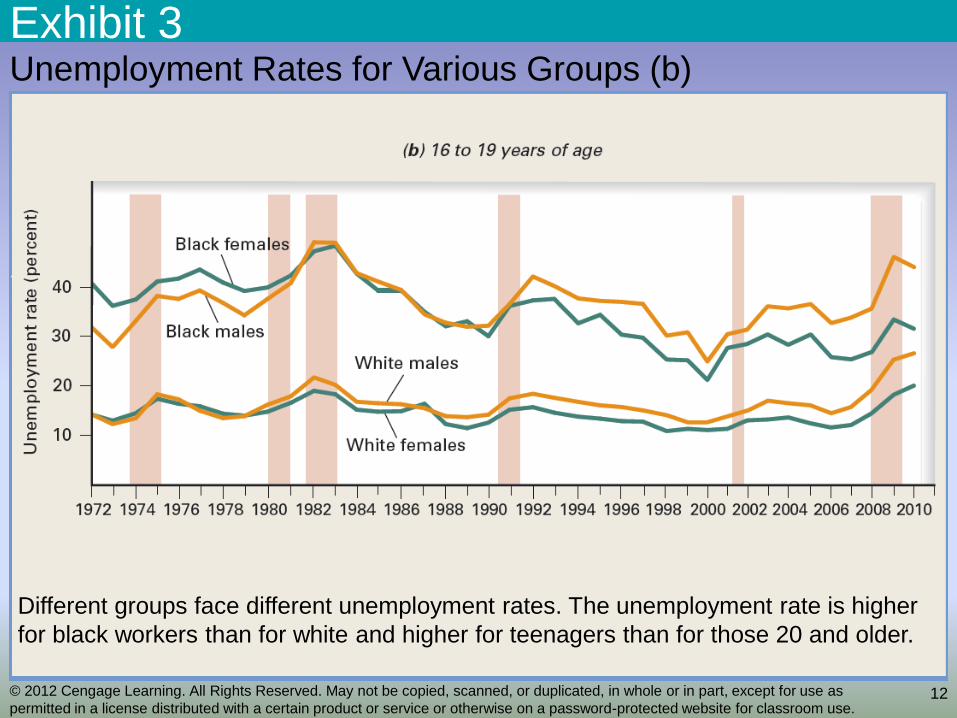
Unemployment Rates for Various Groups (b)
Different groups face different unemployment rates. The unemployment rate is higher
for black workers than for white and higher for teenagers than for those 20 and older.

© 2012 Cengage Learning. All Rights Reserved. May not be copied, scanned, or duplicated, in whole or in part, except for use as
permitted in a license distributed with a certain product or service or otherwise on a password-protected website for classroom use.
© 2012 Cengage Learning. All Rights Reserved. May not be copied, scanned, or duplicated, in whole or in part, except for use as
permitted in a license distributed with a certain product or service or otherwise on a password-protected website for classroom use.
Unemployment
• Varies by occupation
– Blue-collar workers
• Higher unemployment rates
– Professional and technical workers
• Lower unemployment rates
– Construction workers
• High unemployment rates at times
– Seasonal and subject to wide swings over the
business cycle
13

© 2012 Cengage Learning. All Rights Reserved. May not be copied, scanned, or duplicated, in whole or in part, except for use as
permitted in a license distributed with a certain product or service or otherwise on a password-protected website for classroom use.
© 2012 Cengage Learning. All Rights Reserved. May not be copied, scanned, or duplicated, in whole or in part, except for use as
permitted in a license distributed with a certain product or service or otherwise on a password-protected website for classroom use.
Unemployment
• Varies across regions
– Certain occupations dominate labor
markets in certain regions
– Even within a state
• National unemployment rate
– Masks differences across the country
– Masks differences across an individual
state
14

© 2012 Cengage Learning. All Rights Reserved. May not be copied, scanned, or duplicated, in whole or in part, except for use as
permitted in a license distributed with a certain product or service or otherwise on a password-protected website for classroom use.
Exhibit 4
15
Unemployment Rates Differ Across U.S. Metropolitan Areas
© 2012 Cengage Learning. All Rights Reserved. May not be copied, scanned, or duplicated, in whole or in part, except for use as
permitted in a license distributed with a certain product or service or otherwise on a password-protected website for classroom use.
© 2012 Cengage Learning. All Rights Reserved. May not be copied, scanned, or duplicated, in whole or in part, except for use as
permitted in a license distributed with a certain product or service or otherwise on a password-protected website for classroom use.
Sources of Unemployment
• Frictional unemployment
– Bring together employers and job
seekers
– Doesn’t last long
– Better match workers and jobs
• Seasonal unemployment
– Seasonal changes in labor demand
16

© 2012 Cengage Learning. All Rights Reserved. May not be copied, scanned, or duplicated, in whole or in part, except for use as
permitted in a license distributed with a certain product or service or otherwise on a password-protected website for classroom use.
© 2012 Cengage Learning. All Rights Reserved. May not be copied, scanned, or duplicated, in whole or in part, except for use as
permitted in a license distributed with a certain product or service or otherwise on a password-protected website for classroom use.
Sources of Unemployment
• Structural unemployment
– Mismatch of skills or geographic location
– Occurs because changes in tastes,
technology, taxes, and competition
• Reduce the demand for certain skills
• Increase the demand for other skills
• Cyclical unemployment
– Increases during recessions
– Decreases during expansions
17
© 2012 Cengage Learning. All Rights Reserved. May not be copied, scanned, or duplicated, in whole or in part, except for use as
permitted in a license distributed with a certain product or service or otherwise on a password-protected website for classroom use.
© 2012 Cengage Learning. All Rights Reserved. May not be copied, scanned, or duplicated, in whole or in part, except for use as
permitted in a license distributed with a certain product or service or otherwise on a password-protected website for classroom use.
Sources of Unemployment
• Duration of unemployment
– April 2010, unemployment rate = 9.9%
• Average duration of unemployment = 33
weeks
– 18% - unemployed less than 5 weeks
– 20% - unemployed 5–14 weeks
– 16% - unemployed 15–26 weeks
– 46% - unemployed 27 weeks or longer
• Long-term unemployed
– Those out of work for 27 weeks or longer
18

© 2012 Cengage Learning. All Rights Reserved. May not be copied, scanned, or duplicated, in whole or in part, except for use as
permitted in a license distributed with a certain product or service or otherwise on a password-protected website for classroom use.
© 2012 Cengage Learning. All Rights Reserved. May not be copied, scanned, or duplicated, in whole or in part, except for use as
permitted in a license distributed with a certain product or service or otherwise on a password-protected website for classroom use.
Full Employment
• Full employment
– No cyclical unemployment
– Some unemployment
• Frictional
• Structural
• Seasonal
– Estimates: 4-6%
19

© 2012 Cengage Learning. All Rights Reserved. May not be copied, scanned, or duplicated, in whole or in part, except for use as
permitted in a license distributed with a certain product or service or otherwise on a password-protected website for classroom use.
© 2012 Cengage Learning. All Rights Reserved. May not be copied, scanned, or duplicated, in whole or in part, except for use as
permitted in a license distributed with a certain product or service or otherwise on a password-protected website for classroom use.
Unemployment Compensation
• Unemployment benefits
– Half of the unemployed
– Criteria
• Lost job and looking for work
– Time limit: 6 months
• Longer during recessions
– 50% of take-home pay
– May reduce the incentive to find work
20

© 2012 Cengage Learning. All Rights Reserved. May not be copied, scanned, or duplicated, in whole or in part, except for use as
permitted in a license distributed with a certain product or service or otherwise on a password-protected website for classroom use.
© 2012 Cengage Learning. All Rights Reserved. May not be copied, scanned, or duplicated, in whole or in part, except for use as
permitted in a license distributed with a certain product or service or otherwise on a password-protected website for classroom use.
International Comparisons
• Unemployment trends
– US: down
– Japan: up
• Low unemployment : Job security
• Bankruptcy
– Western Europe: remained high
• Higher unemployment benefits
• Last longer
• Government regulations
21

© 2012 Cengage Learning. All Rights Reserved. May not be copied, scanned, or duplicated, in whole or in part, except for use as
permitted in a license distributed with a certain product or service or otherwise on a password-protected website for classroom use.
Exhibit 5
22
In the Last Quarter Century, U.S. Unemployment
Rate Fell, Europe’s Stayed High, Japan’s Rose

© 2012 Cengage Learning. All Rights Reserved. May not be copied, scanned, or duplicated, in whole or in part, except for use as
permitted in a license distributed with a certain product or service or otherwise on a password-protected website for classroom use.
© 2012 Cengage Learning. All Rights Reserved. May not be copied, scanned, or duplicated, in whole or in part, except for use as
permitted in a license distributed with a certain product or service or otherwise on a password-protected website for classroom use.
Problems
• Official unemployment figures
– Understate unemployment
• Discouraged workers
• Marginally attached to the labor force
• Underemployed
– Only part-time (want full-time)
– Overqualified
23

© 2012 Cengage Learning. All Rights Reserved. May not be copied, scanned, or duplicated, in whole or in part, except for use as
permitted in a license distributed with a certain product or service or otherwise on a password-protected website for classroom use.
© 2012 Cengage Learning. All Rights Reserved. May not be copied, scanned, or duplicated, in whole or in part, except for use as
permitted in a license distributed with a certain product or service or otherwise on a password-protected website for classroom use.
Problems
• Official unemployment figures
– Overstate unemployment
• Looking for work
– Only to qualify for unemployment benefits
• Only full-time (want part-time)
• Underground economy
• Official U.S. unemployment figures
– Tend to underestimate unemployment
24

© 2012 Cengage Learning. All Rights Reserved. May not be copied, scanned, or duplicated, in whole or in part, except for use as
permitted in a license distributed with a certain product or service or otherwise on a password-protected website for classroom use.
© 2012 Cengage Learning. All Rights Reserved. May not be copied, scanned, or duplicated, in whole or in part, except for use as
permitted in a license distributed with a certain product or service or otherwise on a password-protected website for classroom use.
Inflation
• Inflation
– Sustained increase in economy’s
average price level
• Annual inflation rate
– Percentage increase in the average price
level from one year to the next
25

© 2012 Cengage Learning. All Rights Reserved. May not be copied, scanned, or duplicated, in whole or in part, except for use as
permitted in a license distributed with a certain product or service or otherwise on a password-protected website for classroom use.
© 2012 Cengage Learning. All Rights Reserved. May not be copied, scanned, or duplicated, in whole or in part, except for use as
permitted in a license distributed with a certain product or service or otherwise on a password-protected website for classroom use.
Inflation
• Hyperinflation
– Extremely high inflation
• Deflation
– Sustained decrease in price level
• Disinflation
– Reduction in the rate of inflation
26

© 2012 Cengage Learning. All Rights Reserved. May not be copied, scanned, or duplicated, in whole or in part, except for use as
permitted in a license distributed with a certain product or service or otherwise on a password-protected website for classroom use.
© 2012 Cengage Learning. All Rights Reserved. May not be copied, scanned, or duplicated, in whole or in part, except for use as
permitted in a license distributed with a certain product or service or otherwise on a password-protected website for classroom use.
Two Sources of Inflation
• Increase in AD
– Demand-pull inflation
– Increased government spending
– Social programs
• Decrease in AS
– Cost-push inflation
– Increase cost of production
• Push up the price level
– Stagflation 27

© 2012 Cengage Learning. All Rights Reserved. May not be copied, scanned, or duplicated, in whole or in part, except for use as
permitted in a license distributed with a certain product or service or otherwise on a password-protected website for classroom use.
Exhibit 6
28
Inflation Caused by Shifts of Aggregate Demand
and Aggregate Supply Curves
Aggregate output 0
Price
level
P’
P
AS
AD’
AD
(a) Demand-pull inflation: inflation caused
by an increase of aggregate demand
Aggregate output 0
Price
level
P’
P
AS
AD
(b) Cost-push inflation: inflation caused
by a decrease of aggregate supply
Panel (a) illustrates demand-pull inflation. An outward shift of the aggregate demand to
AD’ “pulls” the price level up from P to P’. Panel (b) shows cost-push inflation. A
decrease of aggregate supply to AS’ “pushes” the price level up from P to P'.
AS’

© 2012 Cengage Learning. All Rights Reserved. May not be copied, scanned, or duplicated, in whole or in part, except for use as
permitted in a license distributed with a certain product or service or otherwise on a password-protected website for classroom use.
© 2012 Cengage Learning. All Rights Reserved. May not be copied, scanned, or duplicated, in whole or in part, except for use as
permitted in a license distributed with a certain product or service or otherwise on a password-protected website for classroom use.
A Historical Look
• Price level, US, since 1913
– Steady increase
• Inflation or deflation, US, since 1913
– Before 1950s
• High inflation – war related
– Followed by deflation
– Since 1950s
• Inflation: 3.7% per year
29

© 2012 Cengage Learning. All Rights Reserved. May not be copied, scanned, or duplicated, in whole or in part, except for use as
permitted in a license distributed with a certain product or service or otherwise on a password-protected website for classroom use.
Exhibit 7
30
Consumer Price Index Since 1913 (a)
Panel (a) shows that, despite fluctuations, the price level, as measured by the consumer
price index, was lower in 1940 than in 1920. The price level began rising in the 1940s.
© 2012 Cengage Learning. All Rights Reserved. May not be copied, scanned, or duplicated, in whole or in part, except for use as
permitted in a license distributed with a certain product or service or otherwise on a password-protected website for classroom use.
Exhibit 7
31
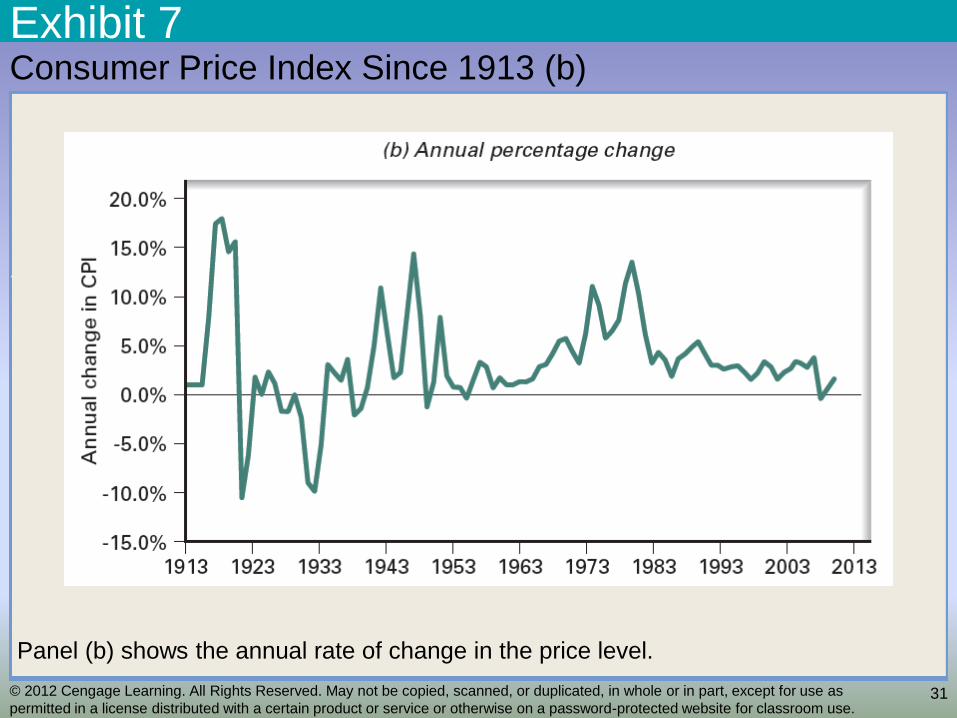
Consumer Price Index Since 1913 (b)
Panel (b) shows the annual rate of change in the price level.

© 2012 Cengage Learning. All Rights Reserved. May not be copied, scanned, or duplicated, in whole or in part, except for use as
permitted in a license distributed with a certain product or service or otherwise on a password-protected website for classroom use.
© 2012 Cengage Learning. All Rights Reserved. May not be copied, scanned, or duplicated, in whole or in part, except for use as
permitted in a license distributed with a certain product or service or otherwise on a password-protected website for classroom use.
Anticipated vs. Unanticipated
• Anticipated inflation
– Expected inflation
• If inflation > expected
– Sellers lose
– Buyers gain
• If inflation < expected
– Sellers gain
– Buyers lose
32

© 2012 Cengage Learning. All Rights Reserved. May not be copied, scanned, or duplicated, in whole or in part, except for use as
permitted in a license distributed with a certain product or service or otherwise on a password-protected website for classroom use.
© 2012 Cengage Learning. All Rights Reserved. May not be copied, scanned, or duplicated, in whole or in part, except for use as
permitted in a license distributed with a certain product or service or otherwise on a password-protected website for classroom use.
Inflation
• Unpopular
• Imposes transaction costs
• Obscures relative price changes
• Differ across metropolitan areas
– Housing prices
33

© 2012 Cengage Learning. All Rights Reserved. May not be copied, scanned, or duplicated, in whole or in part, except for use as
permitted in a license distributed with a certain product or service or otherwise on a password-protected website for classroom use.
Exhibit 8
34
Average Annual Inflation from 2005 to 2009
Differed Across U.S. Metropolitan Areas

© 2012 Cengage Learning. All Rights Reserved. May not be copied, scanned, or duplicated, in whole or in part, except for use as
permitted in a license distributed with a certain product or service or otherwise on a password-protected website for classroom use.
© 2012 Cengage Learning. All Rights Reserved. May not be copied, scanned, or duplicated, in whole or in part, except for use as
permitted in a license distributed with a certain product or service or otherwise on a password-protected website for classroom use.
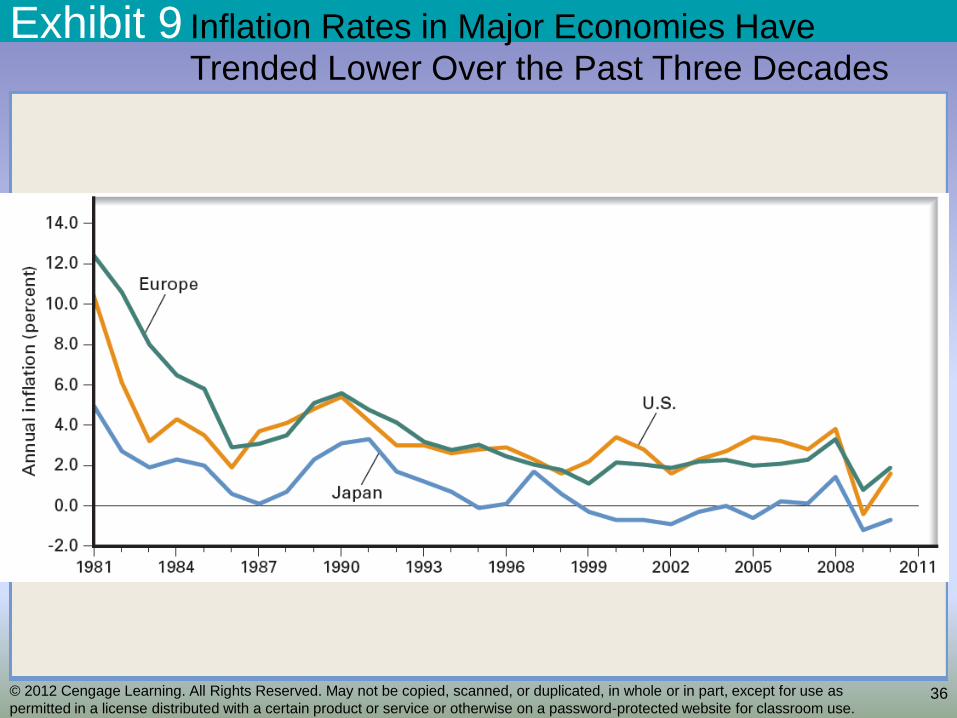
International Comparisons
• First half of 1980s
– Declining inflation
• Mid-1980s to early 1990s
– Rising inflation
• Overall trend since 1980s
– Lower inflation
• 2009
– Price level declined in U.S. and Japan
35
© 2012 Cengage Learning. All Rights Reserved. May not be copied, scanned, or duplicated, in whole or in part, except for use as
permitted in a license distributed with a certain product or service or otherwise on a password-protected website for classroom use.
Exhibit 9
36
Inflation Rates in Major Economies Have
Trended Lower Over the Past Three Decades

© 2012 Cengage Learning. All Rights Reserved. May not be copied, scanned, or duplicated, in whole or in part, except for use as
permitted in a license distributed with a certain product or service or otherwise on a password-protected website for classroom use.
© 2012 Cengage Learning. All Rights Reserved. May not be copied, scanned, or duplicated, in whole or in part, except for use as
permitted in a license distributed with a certain product or service or otherwise on a password-protected website for classroom use.
Inflation and Interest Rates
• Interest
– Dollar amount paid by borrowers to
lenders
• Interest rate
– Interest per year
– As a percentage of the amount loaned
37

© 2012 Cengage Learning. All Rights Reserved. May not be copied, scanned, or duplicated, in whole or in part, except for use as
permitted in a license distributed with a certain product or service or otherwise on a password-protected website for classroom use.
© 2012 Cengage Learning. All Rights Reserved. May not be copied, scanned, or duplicated, in whole or in part, except for use as
permitted in a license distributed with a certain product or service or otherwise on a password-protected website for classroom use.
Inflation and Interest Rates
• Supply of loanable funds
– Amount of money people are willing to
lend
– Upward sloping
• Demand of loanable funds
– Amount of funds demanded by
households, firms, and governments
– Downward sloping
38
© 2012 Cengage Learning. All Rights Reserved. May not be copied, scanned, or duplicated, in whole or in part, except for use as
permitted in a license distributed with a certain product or service or otherwise on a password-protected website for classroom use.
© 2012 Cengage Learning. All Rights Reserved. May not be copied, scanned, or duplicated, in whole or in part, except for use as
permitted in a license distributed with a certain product or service or otherwise on a password-protected website for classroom use.
Inflation and Interest Rates
• Interest rate
– Inversely related with the quantity of
loanable funds demanded
• Downward-sloping demand curve
– Directly related with the quantity of
loanable funds supplied
• Upward-sloping supply curve
39

© 2012 Cengage Learning. All Rights Reserved. May not be copied, scanned, or duplicated, in whole or in part, except for use as
permitted in a license distributed with a certain product or service or otherwise on a password-protected website for classroom use.
Exhibit 10
40
The Market for Loanable Funds
Loanable funds per period 0
Nom
inal in
tere
st
rate
i
D
S
The upward-sloping supply curve, S, shows that more loanable funds are supplied at
higher interest rates. The downward-sloping demand curve, D, shows that the quantity
of loanable funds demanded is greater at lower interest rates. The two curves intersect
to determine the market interest rate, i.
© 2012 Cengage Learning. All Rights Reserved. May not be copied, scanned, or duplicated, in whole or in part, except for use as
permitted in a license distributed with a certain product or service or otherwise on a password-protected website for classroom use.
© 2012 Cengage Learning. All Rights Reserved. May not be copied, scanned, or duplicated, in whole or in part, except for use as
permitted in a license distributed with a certain product or service or otherwise on a password-protected website for classroom use.
Inflation and Interest Rates
• Nominal interest rate
– Interest rate expressed in dollars of
current value
• Not adjusted for inflation
– Specified on the loan agreement
• Real interest rate
– Interest rate expressed in dollars of
constant purchasing power
=Nominal interest rate – Inflation rate
41

© 2012 Cengage Learning. All Rights Reserved. May not be copied, scanned, or duplicated, in whole or in part, except for use as
permitted in a license distributed with a certain product or service or otherwise on a password-protected website for classroom use.
© 2012 Cengage Learning. All Rights Reserved. May not be copied, scanned, or duplicated, in whole or in part, except for use as
permitted in a license distributed with a certain product or service or otherwise on a password-protected website for classroom use.
Why is Inflation Unpopular?
• Pay higher prices
– Inflation = Penalty
• Receive higher receipts
– Higher income
• ‘well-deserved’ reward
• Fixed nominal income
– Unadjusted for inflation
• Social Security
– Adjusted for inflation (COLA) 42