© 2010 Jiajie Diao - IDEALS
130
© 2010 Jiajie Diao
Transcript of © 2010 Jiajie Diao - IDEALS

© 2010 Jiajie Diao
SINGLE-MOLECULE FLUORESCENCE RESONANCE ENERGY TRANSFER STUDY OF SNARE-MEDIATED MEMBRANE FUSION
BY
JIAJIE DIAO
DISSERTATION
Submitted in partial fulfillment of the requirements for the degree of Doctor of Philosophy in Physics
in the Graduate College of the University of Illinois at Urbana-Champaign, 2010
Urbana, Illinois
Doctoral Committee:
Assistant Professor Yann Chemla, Chair Professor Taekjip Ha, Director of Research Professor John Rogers Assistant Professor Aleksei Aksimentiev

ABSTRACT
This is a comprehensive study of protein-mediated membrane fusion through
single-molecule fluorescence resonance energy transfer (smFRET). Membrane fusion is
one of the important cellular processes by which two initially distinct lipid bilayers merge
their hydrophobic cores, resulting in one interconnected structure. For example,
exocytosis, fertilization of an egg by a sperm and communication between neurons are a
few among many processes that rely on some form of fusion. Proteins called soluble
N-ethylmaleimide-sensitive factor attachment protein receptor (SNARE) play a central
role in fusion processes which is also regulated by many accessory proteins, such as
synaptotagmin, complexin and Munc18.
By a new lipid mixing method at the single-vesicle level, we are able to accurately
detect different stages of SNARE-mediated membrane fusion including docking, hemi
and full fusion via FRET value of single donor/acceptor vesicle pair. Through this
single-vesicle lipid mixing assay, we discovered the vesicle aggregation induced by
C2AB/Ca2+, the dual function of complexin, and the fusion promotion role of
Munc18/SNARE-core binding mode.
While this new method provides the information regarding the extent of the
ensemble lipid mixing, the fusion pore opening between two vesicular cavities and the
interaction between proteins cannot be detected. In order to overcome these limitations,
we then developed a single-vesicle content mixing method to reveal the key factor of
ii
pore expansion by detecting the FRET change of dual-labeled DNA probes encapsulated
in vesicles. Through our single-vesicle content mixing assay, we found the fusion pore
expansion role of yeast SNAREs as well as neuronal SNAREs plus synaptotagmin 1.
iii

To my family
iv

ACKNOWLEDGMENTS
Dr. Taekjip Ha has been a good advisor for his profound insights and continuous
encouragement during my graduate study. It is needless to say that this work would not
be possible without his outstanding guidance and support. I also want to thank Dr. Sua
Myong, who kindly supported everyone in the lab.
I really appreciate Dr. Yeon-Kyun Shin in Iowa State University and Dr. Tae-Young
Yoon in KAIST for guiding me into this interesting SNARE field.
I also want to say thanks to all lab members in Dr. Ha’s, Dr. Shin’s, and Dr. Yoon’s
Lab, especially, to Yuji Ishitsuka, Zengliu Su, Xiaobin Lu, Bin Lu, Jiansong Tong,
Janghyun Yoo, and Han-Ki Lee, who used to work together with me. In addition, supports
from Julia Wright, Salman Syed, and Chirlmin Joo are important for my work.
I would like to thank the committee of Professors Yann Chemla, John Rogers and
Alek Aksimentiev for overseeing my graduate study.
I hope to thank all my friends and my homeland, China.
Most importantly, I would like to take this chance to thank my family. My
grandparents, my mother, my uncles, and my brother always stand with me and give me
their sincere supports.
Finally, I want to say that all glory belongs to an important person in my life, Ms.
Chen Shen, who sacrificed a lot to support me.
This work was supported by the National Institutes of Health (NIH R21 GM074526)
v
grant, the pilot fund from the Siteman Center for Cancer Nanotechnology Excellence
(SCCNE), and L.S. Edelheit Family fellowship.
vi

TABLE OF CONTENTS
LIST OF ABBREVIATIONS ........................................................................................... ix
CHAPTER 1: INTRODUCTION ..................................................................................... 1
1.1 Membrane fusion.................................................................................................... 1
1.2 SNARE proteins..................................................................................................... 2
1.3 SNARE-mediated fusion pathway.......................................................................... 3
1.4 SNARE accessory proteins..................................................................................... 4
1.5 Questions................................................................................................................ 6
Chapter 1 Figures......................................................................................................... 8
CHAPTER 2: METHODOLOGY ................................................................................... 12
2.1 Biological aspect................................................................................................... 12
2.2 Physical aspect...................................................................................................... 17
Chapter 2 Figures........................................................................................................ 27
CHAPTER 3: LIPID MIXING ........................................................................................ 31
3.1 Technique.............................................................................................................. 31
3.2 Study on complexin.............................................................................................. 32
3.3 Study on Munc18-1............................................................................................... 42
vii

3.4 Study on C2AB..................................................................................................... 45
Chapter 3 Figures........................................................................................................ 49
CHAPTER 4: CONTENT MIXING ................................................................................ 65
4.1 Motivation............................................................................................................. 65
4.2 Experimental design.............................................................................................. 66
4.3 Study on yeast SNARE......................................................................................... 69
4.4 Study on neuronal SNARE................................................................................... 72
Chapter 4 Figures........................................................................................................ 77
CHAPTER 5: OUTLOOK ............................................................................................... 98
5.1 Remaining issues.................................................................................................. 98
5.2 Future work........................................................................................................... 99
Chapter 5 Figures...................................................................................................... 101
REFERENCES .............................................................................................................. 103
AUTHOR'S BIOGRAPHY ........................................................................................... 119
viii
LIST OF ABBREVIATIONS
APD Avalanche photodiode
βME 2-mercaptoethanol
bp base pair(s)
Biotin-DPPE 1,2-dipalmitoyl-sn-glycero-3-phosphoethanolamine-N-(biotinyl)
BSA Bovine serum albumin
CCD Charge-coupled device
Cy Cyanine dye
DiD 1,1'-dioctadecyl-3,3,3',3'-tetramethylindodicarbocyanine perchlorate
DiI 1,1'-dioctadecyl-3,3,3',3'-tetramethylindocarbocyanine perchlorate
DNA Deoxyribonucleic acid
dsDNA Double-stranded DNA
DOPE 1,2-Dioleoyl-sn-glycero-3-phosphoethanolamine
DOPS 1,2-dioleoyl-sn-glycero-3-[phospho-L-serine]
E FRET efficiency
Eapp Apparent FRET efficiency
EGTA Ethylene glycol tetraacetic acid
EPR Electron paramagnetic resonance
FRET Föster (Fluorescence) resonance energy transfer
HEPES A buffer solution containing 5 mM HEPES/KOH, 100 mM KCl (pH 7.4)
IA Emission intensity of an acceptor molecule
ID Emission intensity of a donor molecule
MW Molecular weight
MD Molecular dynamics
OG n-octyl-D-glucopyranoside
PEG Polyethylene glycol
ix
PIP2 Phosphatidylinositol 4,5-bisphosphate
POPC 1-palmitoyl-2-oleoyl-sn-glycero-3-phosphocholine
smFRET Single-molecule FRET
SNARE Soluble N-ethylmaleimide-sensitive factor attachment protein receptors
ssDNA Single-stranded DNA
TIR Total internal reflection
Tris trishydroxymethylaminomethane
Trolox 6-Hydroxy-2,5,7,8-tetramethylchromane-2-carboxylic acid
T50 A buffer solution containing 10mM Tris/HCl, 50mM NaCl (pH 8.0)
x
CHAPTER 1
INTRODUCTION
1.1 Membrane fusion
A biological membrane is a lipid bilayer made of two layers of lipid molecules,
which forms a continuous barrier around cells to keep ions, proteins and other molecules.
Natural bilayers are usually made mostly of phospholipids with a hydrophilic head and
two hydrophobic tails. When phospholipids are exposed to water, they arrange
themselves into a two-layered sheet (a bilayer) with all of their tails pointing toward the
center of the sheet. Membrane fusion is a process by which two initially distinct lipid
bilayers merge their hydrophobic cores, resulting in one interconnected structure. When
fusion proceeds completely through both leaflets of both bilayers, a water-filled bridge is
formed and the solutions contained by the bilayers can mix. Many important cellular
processes, such as exocytosis, fertilization of an egg by sperm and communication
between neurons, rely on some form of membrane fusion.
Four fundamental steps are in the fusion process [1]. First, two membranes approach
each other to within several nanometers. Second, the two membranes come into very
close contact (less than one nanometer). Third, a destabilization nucleates at one point
between the two membranes with a highly localized rearrangement of the two bilayers.
Finally, as this point defect grows, the components of the two membranes mix and
diffuse away from the site of contact. At this point, the internal contents of the
membranes may start to mix.
1

Biological fusion is almost always regulated by the action of membrane-associated
proteins with one of them called soluble N-ethylmaleimide-sensitive factor attachment
protein receptors (SNAREs) which play a critical role in eukaryotic cell system. SNARE-
mediated membrane fusion is a ubiquitous process involved in a wide variety of
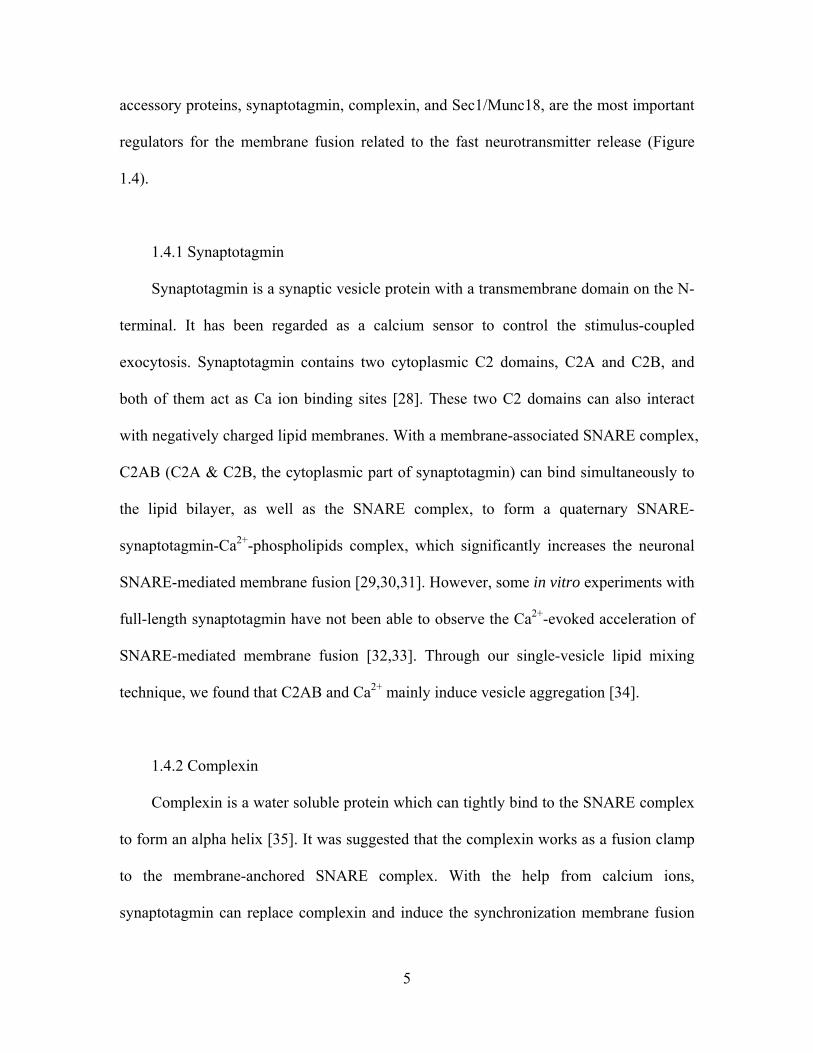
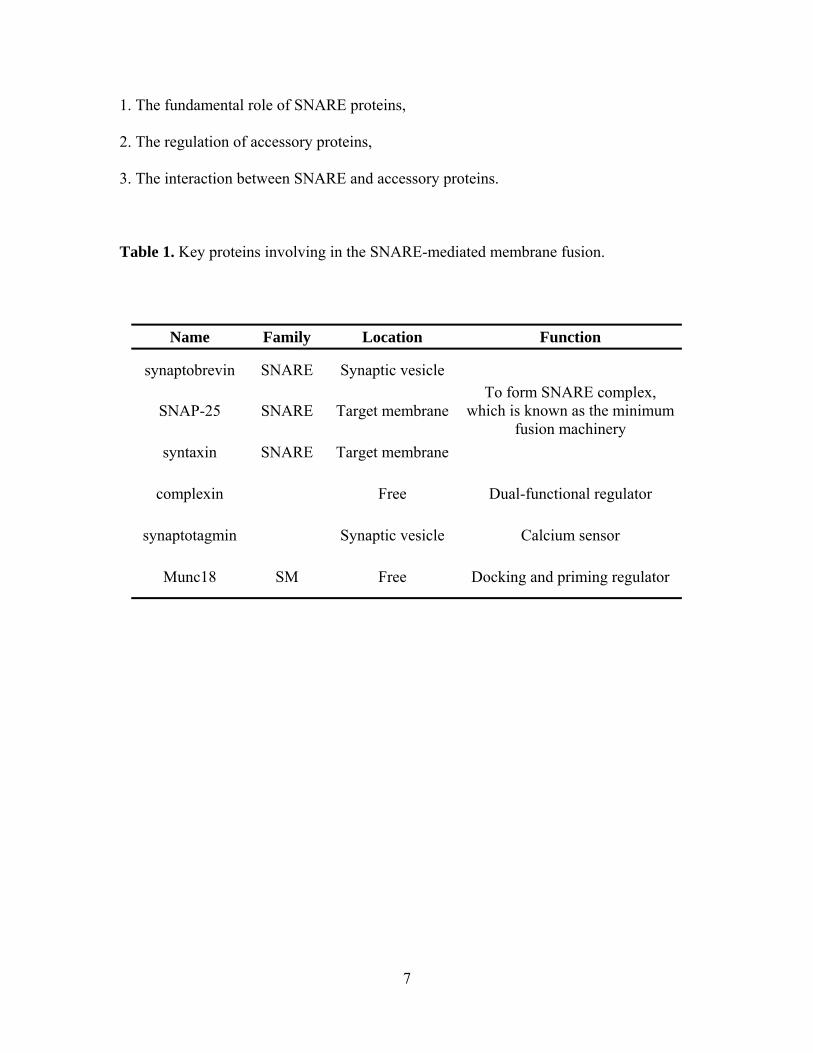
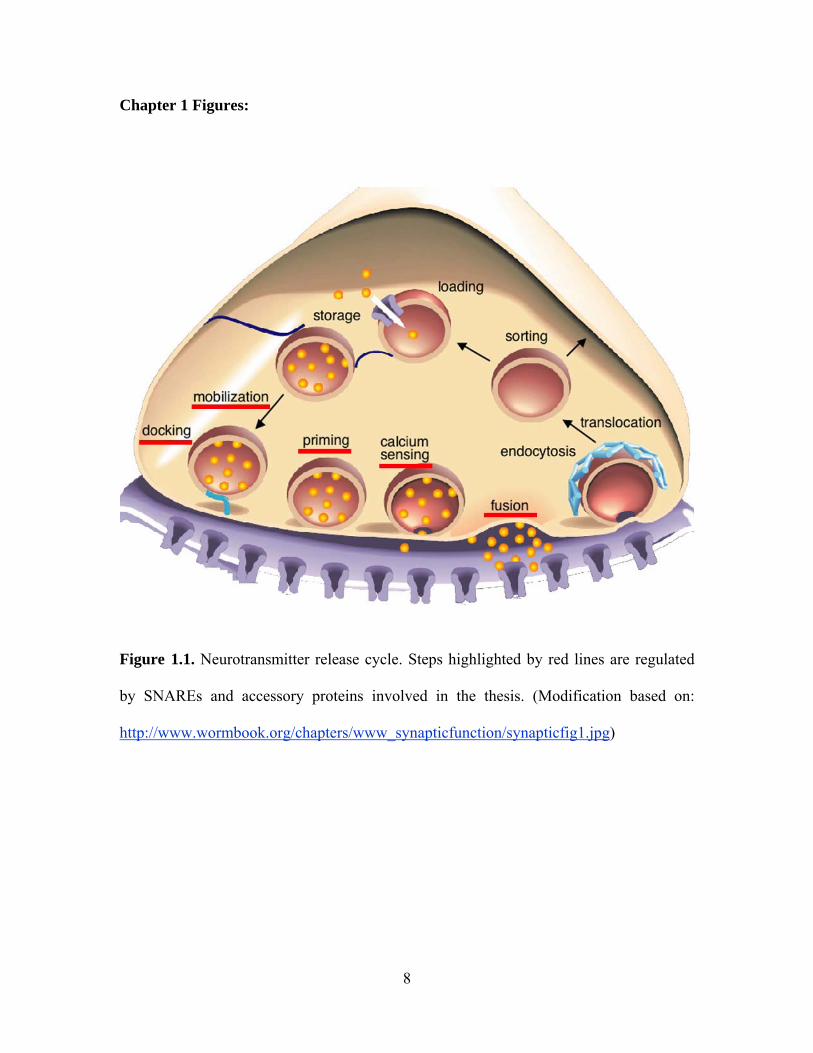
important life activities, such as neurotransmitter release [2]. Neurons communicate
through molecules called neurotransmitters which relay messages across the synaptic
cleft between two neurons at the synapse. Synaptic vesicles in the axon bulb containing
neurotransmitters are produced by the neuron and are released in the submillisecond time
scale by exocytosis into the synaptic cleft (Figure 1.1). This fast neurotransmitter release
is triggered by calcium influx and is tightly controlled by a number of regulators, such as
SNARE proteins, synaptotagmin, complexin, and Munc18 [3,4,5,6].
1.2 SNARE proteins
With extensive evidence of proving them as minimal fusion machinery [7,8],
SNARE proteins have been accepted as the engine that can pull the opposing membranes
together and then somehow merge them into one continuous bilayer structure [9,10]. We
mainly focus on two SNARE systems; either yeast mediated post-Golgi protein
trafficking on the plasma membrane or synapse mediated neurotransmitter release
triggered by calcium ions. Both of these SNARE systems consist of three components.
According to their compartment distribution in the cell, they are classified as v-SNARE
including synaptobrevin in neuron and Snc2p in yeast, and t-SNARE, which are
composed of SNAP-25 & syntaxin in neuron and Sec9 & Sso1p in yeast (Figure 1.2).
2

As shown in Figure 1.2, the three SNARE components can form a ternary complex
in the ratio of 1:1:1 via the association of their ‘SNARE motifs’. In this ternary complex,
three ‘SNARE motifs’ from t-SNARE proteins and one ‘SNARE motif’ from v-SNARE
assemble into a four-helix bundle composed of 15 hydrophobic layers [11,12].
1.3 SNARE-mediated fusion pathway
Membrane fusion involves a concerted assembly of proteins and an exquisite
rearrangement of lipid bilayers. It has been suggested that multiple steps are needed to
accomplish membrane fusion. First, the assembly of the SNARE ternary complex brings
opposing membranes together and achieves the intimate contact of the outer leaflets.
Then, the contacting outer leaflets merge and form a lipid ‘stalk’, an intermediate state
called hemifusion in which the opposing outer leaflets merge together while the inner
leaflets remain intact [13,14,15,16]. Next, the rupture of the hemifusion diagram leads to
a fusion pore. At last, the expanding of the fusion pore enables content mixing and
finishes the full fusion (Figure 1.3). The essence of this hemifusion model is that the
initial connection of two merging outer leaflet is lipids. An alterative model suggests that
there exists a protein hemi-channel lined with the SNARE transmembrane segments in
each membrane [17,18]. The assembly of the trans-SNARE complex brings the two
opposing membranes close and connects the protein channels to form a protein fusion
pore, directly leading to the content communication.
The evidence of the protein pore was provided by combined amperometry
capacitance measurements. Jackson’s group suggested that a protein pore was formed by
a circular arrangement of five to eight syntaxin transmembrane segments in the plasma
3
membrane [18]. However, in a previous study using the same PC12 cells, Hua and
Scheller deduced that only three syntaxin-containing complexes are required for Ca2+-
triggered excocytosis [19]. Based on the protein pore model, a vesicle-membrane
counterpart formed by VAMP transmembrane segments was needed to complete their
model, the EPR data from Dr. Shin’s laboratory in Iowa State University indicated that
there is no strong interaction between the transmembrane domains of VAMP, which did
not support the protein pore model.
Hemifusion to full fusion transition is an accepted model for viral systems
[20,21,22,23]. With viral fusion, proteins in only one of the opposing membrane were
minimally required. Hemifusion intermediate was also visualized indirectly using x-ray
diffraction [24]. By modifying the transmembrane domain or lowering the concentration
of the fusion protein, a hemifusion intermediate was observed in Dr. Shin’s laboratory
[16]. After that, a large amount of evidence was provided in different laboratories to
support that SNARE protein-mediated membrane fusion transits through a hemifusion
intermediate state [15,25,26,27].
1.4 SNARE accessory proteins
It has widely accepted that SNARE proteins play a central role in membrane fusion.
In living cells, the neurotransmitter release finishes in the submillisecond time scale upon
coming to calcium ions. However, in vitro studies show that the lipid mixing induced by
SNARE proteins needs hours to finish. Thus, it is reasonable to predict that the assembly
of the SNARE complex and the fusion pathway are regulated extensively by other
accessory proteins in vivo [3]. As identified by in vivo knockout method, three SNARE
4
accessory proteins, synaptotagmin, complexin, and Sec1/Munc18, are the most important
regulators for the membrane fusion related to the fast neurotransmitter release (Figure
1.4).
1.4.1 Synaptotagmin
Synaptotagmin is a synaptic vesicle protein with a transmembrane domain on the N-
terminal. It has been regarded as a calcium sensor to control the stimulus-coupled
exocytosis. Synaptotagmin contains two cytoplasmic C2 domains, C2A and C2B, and
both of them act as Ca ion binding sites [28]. These two C2 domains can also interact
with negatively charged lipid membranes. With a membrane-associated SNARE complex,
C2AB (C2A & C2B, the cytoplasmic part of synaptotagmin) can bind simultaneously to
the lipid bilayer, as well as the SNARE complex, to form a quaternary SNARE-
synaptotagmin-Ca2+-phospholipids complex, which significantly increases the neuronal
SNARE-mediated membrane fusion [29,30,31]. However, some in vitro experiments with
full-length synaptotagmin have not been able to observe the Ca2+-evoked acceleration of
SNARE-mediated membrane fusion [32,33]. Through our single-vesicle lipid mixing
technique, we found that C2AB and Ca2+ mainly induce vesicle aggregation [34].
1.4.2 Complexin
Complexin is a water soluble protein which can tightly bind to the SNARE complex
to form an alpha helix [35]. It was suggested that the complexin works as a fusion clamp
to the membrane-anchored SNARE complex. With the help from calcium ions,
synaptotagmin can replace complexin and induce the synchronization membrane fusion
5
[36,37,38]. However, some results show that complexin plays a positive role in
membrane fusion as well. Recently, our lab revealed a dual function of complexin, as, on
one hand, it inhibits the formation of SNARE complexes, while on the other hand, once
SNARE complexes are formed, it enhances membrane fusion [39].
1.4.3 Sec1/Munc18
Sec1/Munc18 is crucial for SNARE-mediated membrane fusion. Neurotransmitter
release was totally abolished in Munc18 knockout mice [40,41]. Munc18 binds tightly to
the closed conformation of syntaxin, which stabilizes the syntaxin during its
transportation process to the plasma membrane in vivo [42,43]. In addition, it has been
suggested that the N-terminal segment of syntaxin, Habc domain, is necessary for
interacting with Munc18 to promote SNARE complex assembly [44,45,46,47,48]. Most
recently, our single-pair vesicle-vesicle lipid mixing experiments indicated that Munc18
could increase the lipid mixing both for full-length syntaxin and syntaxin without Habc
domain [49].
1.5 Questions
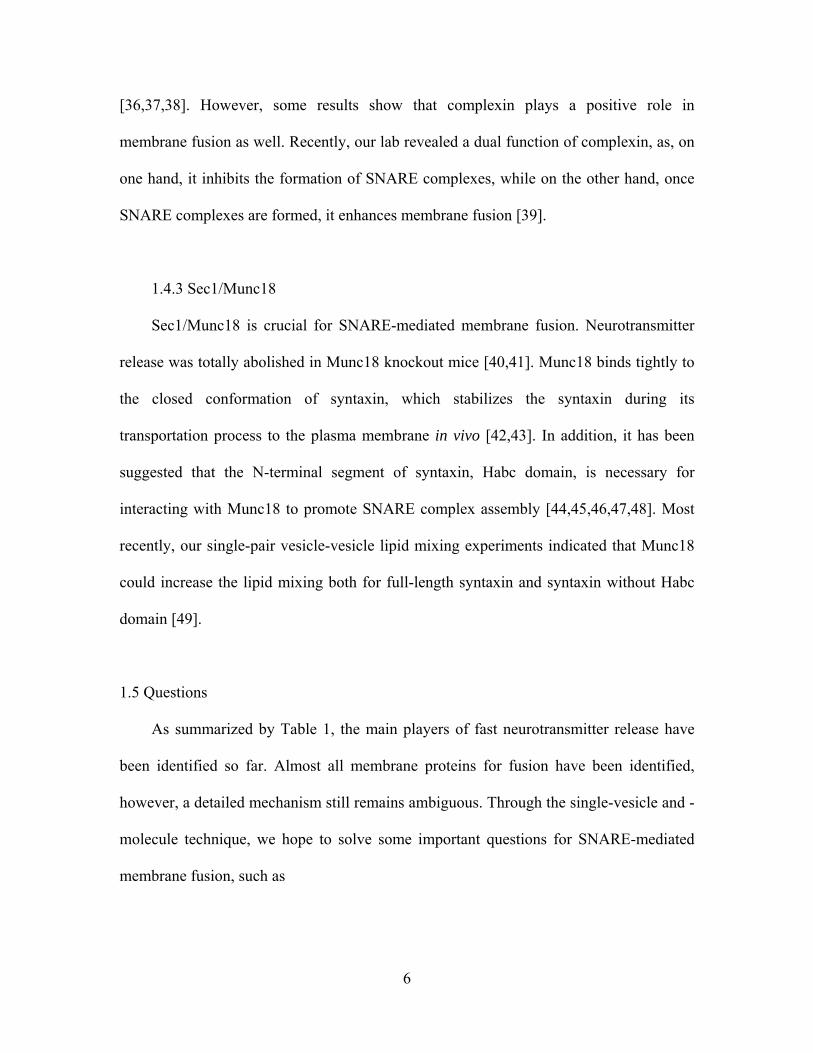
As summarized by Table 1, the main players of fast neurotransmitter release have
been identified so far. Almost all membrane proteins for fusion have been identified,
however, a detailed mechanism still remains ambiguous. Through the single-vesicle and -
molecule technique, we hope to solve some important questions for SNARE-mediated
membrane fusion, such as
6
1. The fundamental role of SNARE proteins,
2. The regulation of accessory proteins,
3. The interaction between SNARE and accessory proteins.
Table 1. Key proteins involving in the SNARE-mediated membrane fusion.
Name Family Location Function
synaptobrevin SNARE Synaptic vesicle
SNAP-25 SNARE Target membrane
syntaxin SNARE Target membrane
To form SNARE complex, which is known as the minimum
fusion machinery
complexin Free Dual-functional regulator
synaptotagmin Synaptic vesicle Calcium sensor
Munc18 SM Free Docking and priming regulator
7
Chapter 1 Figures:
Figure 1.1. Neurotransmitter release cycle. Steps highlighted by red lines are regulated
by SNAREs and accessory proteins involved in the thesis. (Modification based on:
http://www.wormbook.org/chapters/www_synapticfunction/synapticfig1.jpg)
8

Figure 1.2. Neuronal SNARE proteins. (Modification based on:
http://en.wikipedia.org/wiki/File:Exocytosis-machinery.jpg)
9
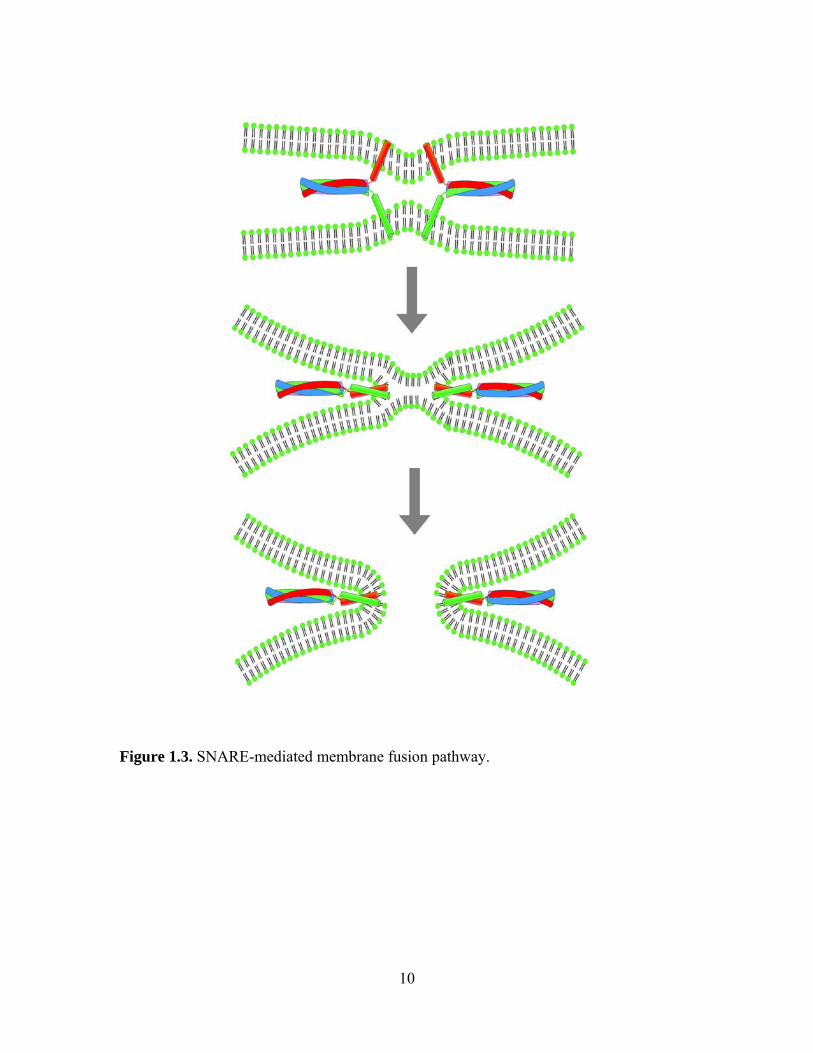
Figure 1.3. SNARE-mediated membrane fusion pathway.
10

Figure 1.4. Neuronal SNARE accessory proteins.
11
CHAPTER 2
METHODOLOGY
2.1 Biological aspect
Traditionally, most studies rely on two major techniques, in vivo knockout and in
vitro reconstitution methods [3,9]. While these two methods have many advantages, they
come short in either isolating the function of the single contributing factor or revealing
the fast and transient fusion dynamics.
2.1.1 Yeast SNARE proteins
Plasmid construction, protein expression and purification for yeast SNAREs were
described in detail previously [50]. In brief, Sso1pHT (amino acids 185-290), which the
N-terminal α-helical Habc domain was truncated and full-length Snc2p (amino acids 1-
115) were expressed as the N-terminal glutathione S-transferase (GST) fusion proteins.
Sec9c (amino acids 401–651 of Sec9) was expressed as a C-terminal His6-tagged protein.
Recombinant proteins were expressed in E. coli Rosetta (DE3) pLysS (Novagen). The
glutathione-agarose beads (Sigma) were used to purify Sso1pHT and Snc2p. The protein-
bound GST beads were washed excessively with washing buffer (PBS, pH 7.4)
containing 0.2% (v/v) Triton X-100. Following the buffer exchange with (PBS, pH 7.4)
containing 0.8% (w/v) n-octyl-D-glucopyranoside (OG, Research Product International),
the protein of interest was cleaved on column by thrombin in cleavage buffer (50 mM
Tris/HCl, 150 mM NaCl, 0.8% OG, pH 8.0). His6-tagged Sec9c was purified using the
Ni-NTA agarose beads (QIAGEN). The beads were washed with washing buffer (25 mM
12

HEPES, 100 mM KCl with 20 mM immidazole, pH 7.4), and then the protein was eluted
out by the elution buffer (25 mM HEPES, 100 mM KCl with 150 mM immidazole, pH
7.4).
2.1.2 Neuronal SNARE proteins
Recombinant neuronal SNARE proteins syntaxin 1A (amino acids 1-288), SNAP-25
(amino acids 1–206), and VAMP2 (amino acids 1-116) are from rat. All of these proteins
were expressed as N-terminal GST fusion proteins in E. coli Rosetta (DE3) pLysS. The
cells were grown at 37 oC in LB medium with 100 mg/ml ampicillin until OD600 reached
0.6-0.8. The cells were further grown for 6 hours after adding IPTG (0.5 mM final
concentration) at 16 oC for syntaxin 1A and VAMP2 or at 24 oC for SNAP-25. Cell
pellets were resuspended in 10 ml PBS buffer, pH 7.4, containing 0.5% (v/v) Triton X-
100, with a final concentration of 1 mM 4-(2-aminoethyl)-benzenesulfonyl fluoride
(AEBSF), 2mM DTT. Cells were lysed by the sonication in an ice bath and centrifuged at
13,000 g for 20 minutes at 4 oC. The supernatant was mixed with glutathione-agarose
beads in PBS buffer and nutated in the cold room (4 oC) for 2 hours. Proteins were
cleaved by thrombin in cleavage buffer (50mM Tris/HCl, 150 mM NaCl, pH 8.0) with
0.8% OG.
2.1.3 Accessory proteins
Complexin 1: The plasmid for complexin 1 (amino acids 4-134) from rat was kindly
provided by Dr. Josep Rizo (University of Texas Southwestern Medical Center).
Complexin 1 was expressed as a glutathione S-transferase fusion protein. Recombinant
13
proteins were expressed in E. coli Rosetta (DE3) pLysS (Novagene, Madison, Wisconsin).
The cells were grown at 37 °C in LB with 100 g/ml ampicillin until OD600 reached 0.6-
0.8. The cells were further grown for 4-6 hours after adding isopropylthio-b-d-
galactopyranoside (0.5 mM) at 24 °C. Recombinant proteins were purified using
glutathione-agarose chromatography. Cell pellet was resuspended in 10 ml PBS buffer
(phosphate-buffered saline with 0.5% (v/v) TritonX-100, pH 7.4) with the final
concentrations of 1 mM AEBSF, 5 mM DTT. Cells were broken by sonication on the ice
bath and centrifuged at 13000 g for 20 minutes at 4 °C. The supernatant was mixed with
2 mL glutathione-agarose beads in PBS and nutated in cold room for 2 hours. The
proteins were then cleaved by thrombin in HEPES buffer (25 mM HEPES, 100 mM KCl,
pH 7.4). Purified proteins were examined with 15% SDS-PAGE, and the purity was at
least 90%.
C2AB: The plasmid for C2AB (amino acids 140-421) of rat Synaptotagmin 1 was a
kindly gift from Dr. Josep Rizo (University of Texas South Western Medical Center).
The C2AB was inserted into PGEX-KG expression plasmid and expressed in E. coli
Rosetta (DE3) pLysS (Novagen). To purify C2AB, cell pellet was resuspended in 10 mL
PBS buffer (pH 7.4, with 0.5% (v/v) TritonX-100) with the final concentrations of 2 mM
AEBSF, 2 mM EDTA, and 2 mM DTT. The cell was broken by sonication on the ice
bath and centrifuged at 13000 g for 20 minutes at 4 ºC. The supernatant was mixed with 2
ml glutathione-agrose beads and nutated in cold room for 2 h. After nutation, the beads
were washed with a high salt buffer (25 mM HEPES, 1 M NaCl, PH 7.4) four times. In
the high salt buffer, 1 mM MgCl2, DNase (20 lg/ml) and RNase (4 lg/ml) were added and
incubated for 6 h at 4 ºC. After washing by high salt buffer twice and low salt buffer (50
14
mM Hepes, 0.1M NaCl, PH 7.4) five times, the protein was cleaved from GST beads by
thrombin in low salt buffer.
Munc18-1: C-terminal His6-tagged Munc18-1 plasmid is a kind gift from Dr. James
McNew at Rice University. The Mucn18-1 protein was expressed in E. coli Rosetta (DE3)
pLysS (Novagene). The cells were grown at 37 oC in LB medium with 30 μg/ml of
kanamycin until the A600 reached 0.6-0.8. Isopropyl-β-D-thiogalactopyranoside (IPTG)
was added to a final concentration of 0.5 mM. The cells were grown further for three
more hours at 37 oC, and then collected by centrifugation at 6000 r.p.m. for 10 minutes.
The cell pellets were resuspended in lysis buffer (25 mM HEPES/KOH, 100 mM KCl, 20
mM immidazole, 2 mM AEBSF, and 2 mM dithiothreitol (DTT), pH7.4). After
sonication on ice, the cell lysate was centrifuged at 15000 g for 20 minutes at 4 oC. The
supernatant was mixed with nickel-nitrilotriacetic acid-agarose beads (Qiagen) and
nutated for binding at 4 oC for one hour. After binding, the beads were washed with
washing buffer (25 mM HEPES/KOH, 100mM KCl, and 20 mM immidazole, pH 7.4).
Then the protein was eluted out by elution buffer (25 mM HEPES/KOH, 100mM KCl,
150 mM immidazole, pH 7.4). Purified proteins dialyzed overnight against dialysis buffer
(25 mM HEPES/KOH, 200 mM KCl, 10% glycerol, and 1mM DTT, pH 7.4).
2.1.4 Lipid mixing protein reconstitution
Unilamellar vesicles containing 45:15:40 (mol/mol/mol) 1-palmitoyl-2-oleoyl-sn-
glycero-3-phosphocholine (POPC):1,2-dioleoyl-sn-glycero-3-[phospho-L-serine]
(DOPS):cholesterol (Avanti Polar Lipids) and 2 mol% DiI (1,1'-dioctadecyl-3,3,3',3'-
tetramethylindocarbocyanine perchlorate, Molecular Probes/Invitrogen, Carlsbad,
15
California) were formed by the extrusion method (Mini-Extruder, Avanti Polar Lipids).
The t-SNARE protein complexes, 1:1 (mol/mol) Syntaxin:SNAP-25, were then
reconstituted in the unilamellar vesicles through dialysis. The v-SNARE protein (VAMP2)
was reconstituted in a different population of unilamellar vesicles that were doped with 2
mol% DiD (1,1'-dioctadecyl-3,3,3',3'-tetramethylindodicarbocyanine perchlorate,
Molecular Probes) and 0.1 mol% biotinylated lipids 1,2-dipalmitoyl-sn-glycero-3-
phosphoethanolamine-N-(biotinyl) (Biotin-DPPE, Avanti Polar Lipids). In both t- and v-
SNARE vesicles, the lipid to protein ratio was kept at 200:1.
2.1.5 Content mixing protein reconstitution
One tube of mixture of POPC, DOPS, and cholesterol (molar ratio of 45:15:40) in
chloroform was dried to form a lipid film on the wall of the glass tube. The same
procedures and lipid components were applied to prepare another tube of lipid mixture
except containing 0.1 mol% biotinylated lipid. The dried lipid film was resuspended with
Tris-HCl buffer (10 mM Tris/HCl, 50 mM NaCl, pH 8.0) containing 10 μM target DNAs
or 2 μM Cy3-Cy5 dual-labeled DNA probes (Integrated DNA Technologies), separately.
After 5 freeze-thaw cycles, unilamellar vesicles were prepared by extrusion through
polycarbonate filters (100 nm pore size, Avanti Polar Lipids).
For yeast SNARE system, Sso1pHT and Snc2p proteins were mixed with vesicles
containing target DNA or vesicles containing dual-labeled DNA probes, separately, at a
lipid/protein molar ratio of 200:1. The concentration of OG was kept at ~0.8% (w/v)
during the reconstitution. After 4 oC incubation for 20 minutes, the protein/lipid mixtures
were diluted two times to make the concentration of OG below the critical micelle
16

concentration (~0.6% w/v). The mixtures were then dialyzed overnight against HEPES
buffer (25 mM HEPES/KOH, 100 mM KCl, pH 7.4) at 4 oC.
For neuronal content mixing, syntaxin and SNAP25 were mixed together to pre-
form the t-SNARE complex for 1 hour at room temperature. Then, t-SNARE complex
was mixed with vesicles containing target DNAs and v-SNARE proteins were mixed
with vesicles containing dual-labeled DNA hairpin probes at a lipid/protein molar ratio of
200:1 at 4 oC for 20 minutes (~0.8% OG). The protein/lipid mixtures were diluted two
times. The t-vesicle mixture was dialyzed overnight against HEPES buffer (25 mM
HEPES/KOH, 100 mM KCl, pH 7.4) at 4 oC. However, the v-vesicle mixture was
dialyzed overnight against acetate buffer (20 mM HAc/KOH, 100 mM KCl, pH 4.5) and
then transferred to the HEPES buffer (25 mM HEPES/KOH, 100 mM KCl, pH 7.4) for
additional 5 hours of dialysis before use. For the synaptotagmin 1 study, DOPE and PIP2
were used to recover the Calcium respond in vitro.
2.2 Physical aspect
Since 90’s, ensemble Förster Resonance Energy Transfer or Fluorescence
Resonance Energy Transfer (FRET) [51] has been a standard in vitro tool for studying
SNARE-mediated membrane fusion of protein-reconstituted liposomes. [7] Recently, the
single-molecule FRET has been applied for protein-protein interactions and membrane
fusion process [52,53].
2.2.1 Förster Resonance Energy Transfer or Fluorescence Resonance Energy
Transfer (FRET)
17
FRET is a popular biological technique because it is a non-invasive and powerful
method to help observe reactions in biologically relevant conditions. Since the FRET
degree changes only when fluorophore-labeled molecules are within the range of several
nanometers, this helps us understand molecular interactions, such as protein-protein,
protein-DNA and antibody-antigen. FRET contributes to the understanding of structural
properties and dynamics of biomolecules.
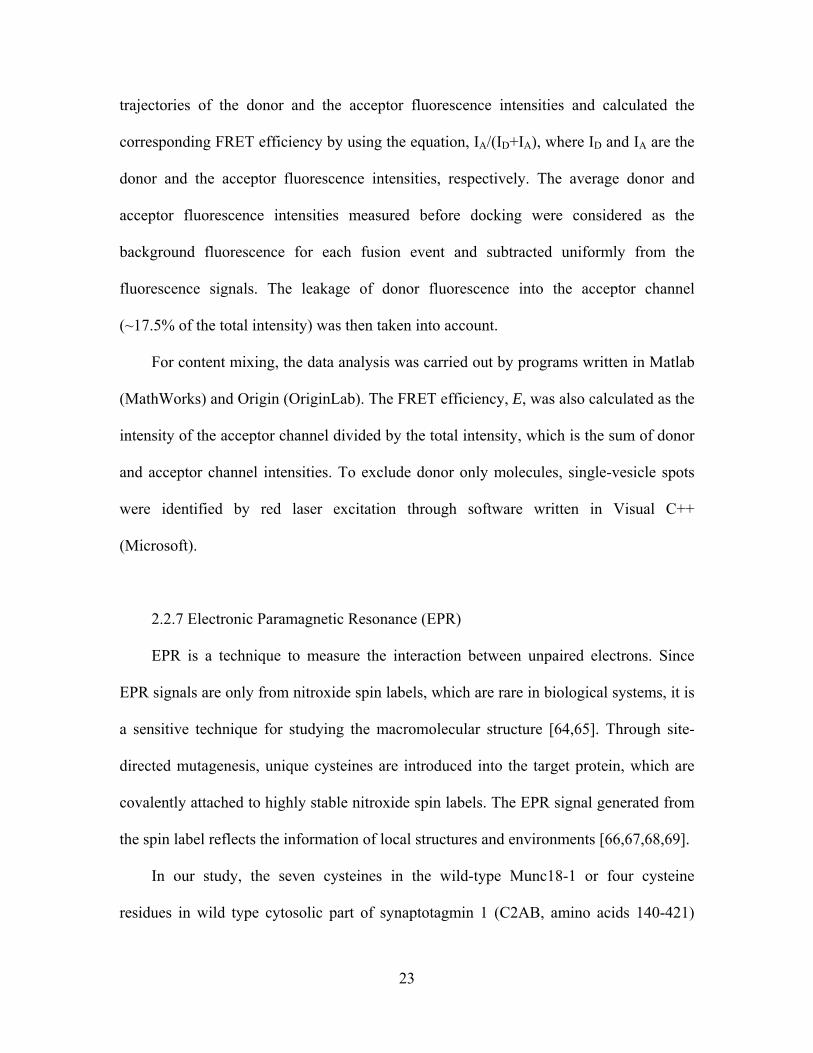
The basic mechanism of FRET is shown in Figure 2.1. When a fluorophore (dye 1)
is excited by a photon, it enters an excited state when the photon brings enough energy.
After a few nanoseconds, dye 1 emits another photon of longer wavelength due to the
vibration levels of the molecule. This is called fluorescence. When another fluorophore
(dye 2) is near dye 1 and the absorption spectrum of dye 2 significantly overlaps with the
emission spectrum of dye1, dye 2 absorbs the energy of dye 1. This is called fluorescence
resonance energy transfer (FRET). Dye 1 is called the donor, while dye 2 the acceptor.
Then, the acceptor emits another photon with an even longer wavelength. The FRET
efficiency follows the equation of 1/(1+(R/R0)6), where R0 is characterized by the spectral
overlap, the quantum yield of donor and other factors. In single-molecule measurements,
cyanine dyes are widely used because of their photostability. In our study, donor
molecules (Cy3 or DiI) are excited by a 530 nm solid-state laser. Acceptors (Cy5 or DiD)
are excited by Cy3 or DiI through FRET. The FRET value is ranging from 0 (donor only)
to 1 (100% efficiency) [54].
2.2.2 Single-molecule spectroscopy
18

There are numerous advantages of using a single-molecule spectroscopy. By
watching the motion of single molecules, we can see all details that would have been
averaged out in the ensemble measurement. Since different states in individual
fluorescence traces can be distinguished, we can synchronize brief states during post-
experiment analysis, even when they are not synchronized during the measurement. This
is called post-synchronization, which is one of the great advantages of the single-
molecule spectroscopy.
The single-molecule detection requires that signals from background should be
negligible compared to the intensity of the single molecule fluorescence. Thus, we use
total internal reflection (TIR) microscopy for our study. The laser light is reflected on the
interface between the glass and the water by TIR, but the evanescent wave goes into the
water up to ~200 nm and excites the molecules immobilized on the surface. The
fluorescence signals from dye molecules are collected by objective lens. And the signals
are separated by a dichroic mirror to producet two side-by-side images of the same spot
for donor (green) and acceptor (red) on a CCD camera for smFRET measurements
(Figure 2.2) [55,56].
The main advantage of single-molecule experiments is that they allow us to study
the behaviour of a single or countable number of molecules. The observation of
individual events allows us to perform statistical analysis of a population of individual
trajectories that is not possible in bulk because of ensemble averaging [55,56].
Through single-molecule FRET technique, several groups have developed single-
vesicle fusion assays in planar bilayers [53,57,58]. They were able to record single
vesicle fusion events, however these studies based on planar bilayers suffered from
19
ineffectively reproducing the known physiology and biochemistry. For example, SNAP-
25 was not required in the acceptor t-SNARE complex [53,58] or fusion depended on
calcium without the calcium sensor synaptotagmin [57]. Recently, several groups
recovered SNAP-25 dependence of single-vesicle fusion assays in planar bilayers by
directly inducing polyethylene glycol (PEG), a biologically irrelevant molecule, into the
fusion system [59,60].
The single vesicle fusion assay developed by our lab can unambiguously detect
different stages of fusion including docking, hemi and full fusion via FRET, which was
not able for previous ensemble assays (Figure 2.3). Comparing with single-vesicle fusion
assays in planar bilayers, we have advantages on reproducing the known physiology and
biochemistry, such as SNAP-25 dependence.
2.2.3 Lipid mixing measurement
Details of the single vesicle lipid-mixing FRET assay were previously reported [61].
A quartz slide is firstly processed with PEG molecules by the ratio of 99:1 (mol/mol)
PEG:biotin-PEG (Laysan Bio) to eliminate non-specific binding of vesicles. The slide is
then assembled into a flow chamber and coated with neutravidin in the concentration of
0.2 mg/mL. Through the specific interaction between biotin and neutravidin, the v-
SNARE vesicles are immobilized on the PEG-coated surface by an incubation at vesicle
concentration of 100~200 pM for 15 minutes. After washing the free v-SNARE vesicles
in the chamber, the t-SNARE vesicles are diluted to a final vesicle concentration of 200
pM with preset amounts of accessory proteins, and injected into the flow chamber for the
reaction at 37 (±2) °C in the buffer (25 mM HEPES and 100 mM KCl, pH 7.4). After
20

washing the free t-SNARE vesicles and accessory proteins, the FRET measurements by a
dual-color TIR fluorescence microscope are performed with the surrounding temperature
of 37 (±2) °C or at room temperature.
2.2.4 Content mixing measurement
A quartz slide was first coated with PEG molecules (99:1 (mol/mol) mPEG-
SVA:biotin-PEG-SVA (Laysan Bio)) to eliminate non-specific binding of vesicles and
DNAs [62]. The slide was then assembled into a flow chamber and coated with
neutravidin by flowing in 0.2 mg/ml solution. Through the specific interaction between
biotin and neutravidin, the v-SNARE vesicles with dual-labeled DNA hairpin probes
encapsulated inside were immobilized on the PEG-coated surface by an incubation at
vesicle concentration of 100~200 pM for 15 minutes. After washing out the free v-
SNARE vesicles in the chamber, the t-SNARE vesicles containing unlabeled single-
strand target DNAs were diluted to a final vesicle concentration of 200 pM with
accessory proteins, and injected into the flow chamber for the reaction at 37 (±2) °C in
the buffer (25 mM HEPES, 100 mM KCl, pH 7.4) for 30 minutes. After washing out the
free t-SNARE vesicles and accessory proteins, the FRET measurements by a TIR
fluorescence microscope were performed with an oxygen scavenger system (0.1 mg/ml
glucose oxidase, 0.02 mg/ml catalase, and 0.4% (wt/wt) β-D-glucose) and Trolox to
eliminate single-molecule blinking events [63]. The alternating laser excitation system
(530 nm and 638 nm) was used for content mixing measurement (Figure 2.4A). The
FRET histogram is plotted for green laser excitation while all spots are picked by red
21
laser excitation. The donor only peak at E = 0 can be excluded by using the green/red
laser alternating excitation (Figure 2.4B and 2.4C).
2.2.5 Data acquisition
Experiments were monitored in a wide-field TIR fluorescence microscope (IX70,
Olympus) using an electron multiplying charge-coupled device camera (iXon DV 887-BI,
Andor Technology). Details of the wide-field TIR fluorescence microscope have been
reported [62]. Briefly, the excitation beam was focused into a pellin broca prism (CVI
Laser), which was placed on top of a quartz slide with a thin layer of immersion oil in
between to match the index of refraction. Cy3 or DiI (donor) and Cy5 or DiD (acceptor)
dyes were excited through a 530nm laser or the alternating laser excitation system (530
nm and 638 nm) via TIR. The fluorescence signals from donor and acceptor that were
collected by a water immersion objective lens (60X, 1.2 N.A. Olympus) went through a
notch filter to block out excitation beams. The emission signals of acceptor dyes were
separated by a 630 nm dichroic mirror (645DCXR, Chroma Technology) and detected by
the electron-multiplying charge-coupled device camera (iXon DV 887-BI, Andor
Technology) with a time resolution of 100 ms. The fluorescence signal, recorded in real
time by using software written in Visual C++ (Microsoft), was amplified before camera
readout, which produced an arbitrary unit for the recorded fluorescence intensity.
2.2.6 Data analysis
For lipid mixing, single fusion events were visually identified by an IDL program
(Research Systems). A program written in Matlab (Mathworks) generated the time
22
trajectories of the donor and the acceptor fluorescence intensities and calculated the
corresponding FRET efficiency by using the equation, IA/(ID+IA), where ID and IA are the
donor and the acceptor fluorescence intensities, respectively. The average donor and
acceptor fluorescence intensities measured before docking were considered as the
background fluorescence for each fusion event and subtracted uniformly from the
fluorescence signals. The leakage of donor fluorescence into the acceptor channel
(~17.5% of the total intensity) was then taken into account.
For content mixing, the data analysis was carried out by programs written in Matlab
(MathWorks) and Origin (OriginLab). The FRET efficiency, E, was also calculated as the
intensity of the acceptor channel divided by the total intensity, which is the sum of donor
and acceptor channel intensities. To exclude donor only molecules, single-vesicle spots
were identified by red laser excitation through software written in Visual C++
(Microsoft).
2.2.7 Electronic Paramagnetic Resonance (EPR)
EPR is a technique to measure the interaction between unpaired electrons. Since
EPR signals are only from nitroxide spin labels, which are rare in biological systems, it is
a sensitive technique for studying the macromolecular structure [64,65]. Through site-
directed mutagenesis, unique cysteines are introduced into the target protein, which are
covalently attached to highly stable nitroxide spin labels. The EPR signal generated from
the spin label reflects the information of local structures and environments [66,67,68,69].
In our study, the seven cysteines in the wild-type Munc18-1 or four cysteine
residues in wild type cytosolic part of synaptotagmin 1 (C2AB, amino acids 140-421)
23

were spin-labeled for EPR spectrum detection. After the cell lysate was incubated with
beads and washed with HEPES buffer (25 mM HEPES/KOH, 100 mM KCl, pH 7.4)
three times, DTT was added to a final concentration of 2 mM, and nutation was continued
at 4 oC for another 30 min. The beads were then washed eight times with an excess
volume of washing buffer to remove DTT. An approximately 20-fold excess of (1-oxy-
2,2,5,5-tetramethylpyrrolinyl-3-methyl) methanethiosulfonate spin label (MTSSL) was
added into the column, and nutation at room temperature was continued for 40 min. The
spin-labeled proteins were eluted by elution buffer and dialyzed overnight against dialysis
buffer (25 mM HEPES/KOH, 200 mM KCl, 10% glycerol, pH 7.4).
EPR spectra were obtained using a Bruker ESP 300 spectrometer (Bruker) equipped
with a low-noise microwave amplifier (Miteq) and a loop-gap resonator (Medical
Advances). The modulation amplitude was set to be no greater than one-fourth of the line
width. Spectral data were collected at room temperature in first-derivative mode with 1
mM microwave power.
2.2.8 Molecular dynamics (MD) simulations
In order to calculate the size of our DNA probes for content mixing in Chapter 4, we
performed MD simulations. Two independent MD simulations were performed on single
strand DNA with different sequences corresponding to Cy3/Cy5 dual-labeled DNA
hairpin and unlabeled target DNA to probe their radius of gyration in equilibrium. Both
starting structures were generated using 3D-DART [70] and VMD [71] with
CHARMM27 topology [72]. The DNA hairpin was solvated using 22043 TIP3P water
molecules and neutralized with 100 mM KCl in a water box of 89 Å × 89 Å × 89 Å. The
24

unlabeled target DNA was immerged in a simulation box of 100 Å × 100 Å × 100 Å
including a POPC lipid patch, water, and 100 mM KCl. The DNA was kept in close with
lipid using a virtual bond connecting the sugar ring oxygen of A30 at 3’ end of target
DNA and the phosphate of a lipid. The all-atom MD simulations were performed using
the developing version of program NAMD 2.7 [73] with the TIP3P model for explicit
water and the CHARMM27 force field including the CMAP correction [72]. In all
simulations, periodic boundary condition was applied with a time step of 1 fs. Non-
bonded energies were calculated using particle mesh Ewald full electrostatics and a
smooth (1.0-1.2) cutoff of the van der Waals energy. Constant temperature was
maintained using Langevin thermostat with a damping coefficient of 1 ps-1. A Nosé-
Hoover Langevin piston barostat was employed to maintain a constant pressure with a
period of 200.0 fs and damping timescale of 100.0 fs. Each system was simulated for 75
ns, where the last 25-ns data were taken to calculate the radius of gyration.
The DNA hairpin probe composes of a 6bp stem and a poly-thymidine (T20) loop.
The unlabeled target DNA has a complementary sequence of poly-adenosine (A30). The
DNA hairpin stem was modeled with B-DNA-type geometry with a random
conformation for the poly-T loop. K+ and Cl- ions were added to the water box to obtain a
100 mM KCl solution. Additional K+ ions were added to neutralize the system. The
resulting system contains 67229 atoms including DNA, water, and ions. The starting
structure of target DNA was modeled by removing the complementary strand from a B-
form double helix DNA. A patch of POPC with 274 lipids was added to the system with
the membrane normal along the z-axis. The distance between the oxygen of A30 at 3’ end
of target DNA and the phosphate of one of lipids was harmonically restrained to be 10 Å
25

through a virtual bond. Such restrain mimic the 3’-cholesteryl TEG used in the
experiment to prevent the target DNA from moving away from membrane while allow
the target DNA diffuse along with the bonded lipid. Solvent was then added to both sides
of the membrane, and the system was neutralized with 100 mM KCl using the Solvate
and Autoionize plugins of VMD. The simulated system has about 183,000 atoms.
The simulated system of DNA hairpin was subject to 4000 steps of conjugate
gradient minimization and 500-ps NPT (constant pressure and temperature) equilibration
with DNA harmonically restrained. The system then was subject to 10-ns annealing at
500 K with the 6bp stem harmonically restrained in the NVT (constant volume and
temperature) ensemble. After cooling the system down, the 75-ns production run was
performed in the NVT ensemble at T = 310 K. The simulated system of unlabeled target
DNA was subject to 4000 steps of conjugate gradient minimization first. Then, lipid tails
were melted in a 1-ns NVT simulation at 310 K during which all other atoms were fixed.
The system was then equilibrated in the NPT simulation at 1 atm and 310 K for 1 ns with
DNA harmonically restrained and followed by 1-ns simulation with all restraint released.
Finally, the 75-ns production run was performed in the NPT ensemble with constant area
of the lipid bilayer and a constant normal pressure of 1 atm.
26
Chapter 2 Figures:
Figure 2.1. The FRET efficiency v.s. distance between donor and acceptor dye molecules.
The FRET efficiency follows the equation of 1/(1+ (R/R0)6). R0 is characterized by the
spectral overlap, the quantum yield of donor and other factors.
27

Figure 2.2. Total internal reflection (TIR) microscopy.
28
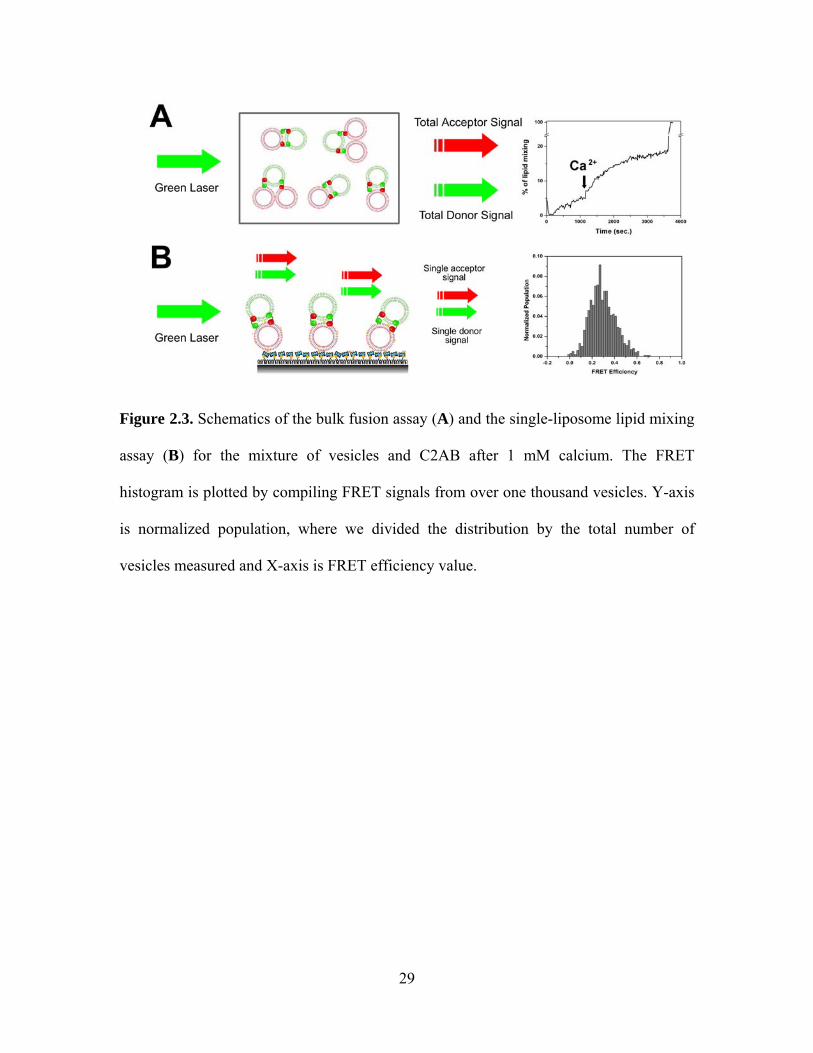
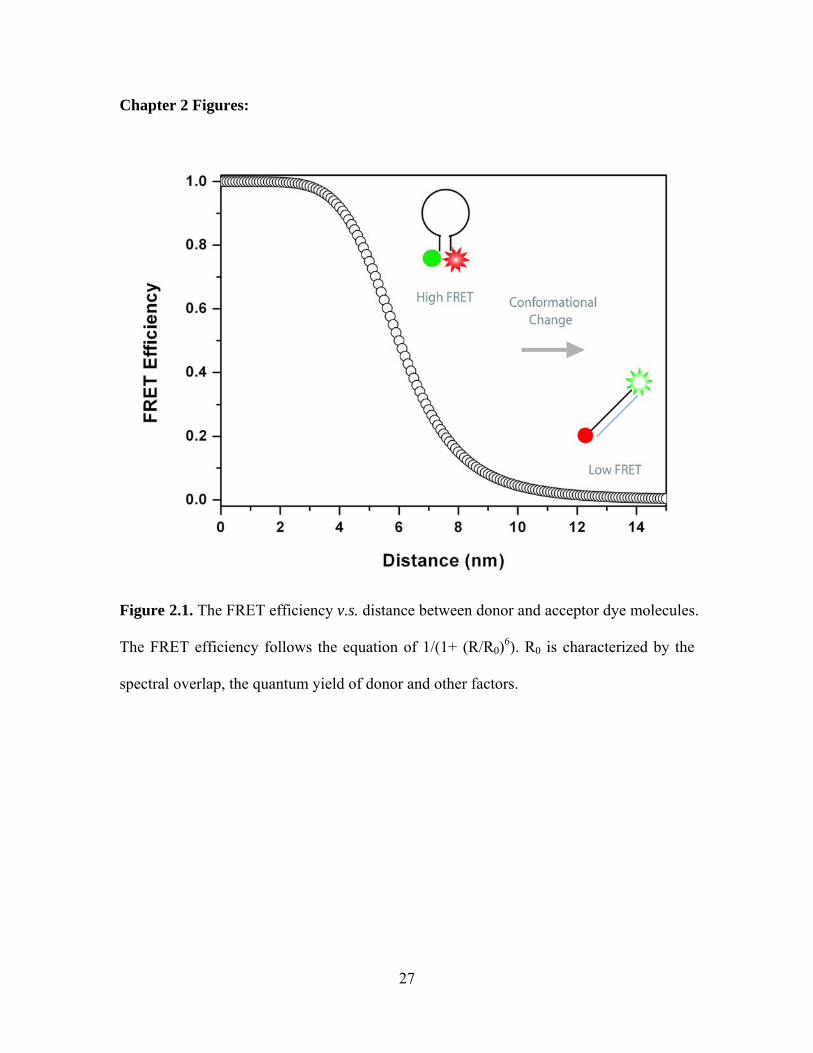
Figure 2.3. Schematics of the bulk fusion assay (A) and the single-liposome lipid mixing
assay (B) for the mixture of vesicles and C2AB after 1 mM calcium. The FRET
histogram is plotted by compiling FRET signals from over one thousand vesicles. Y-axis
is normalized population, where we divided the distribution by the total number of
vesicles measured and X-axis is FRET efficiency value.
29
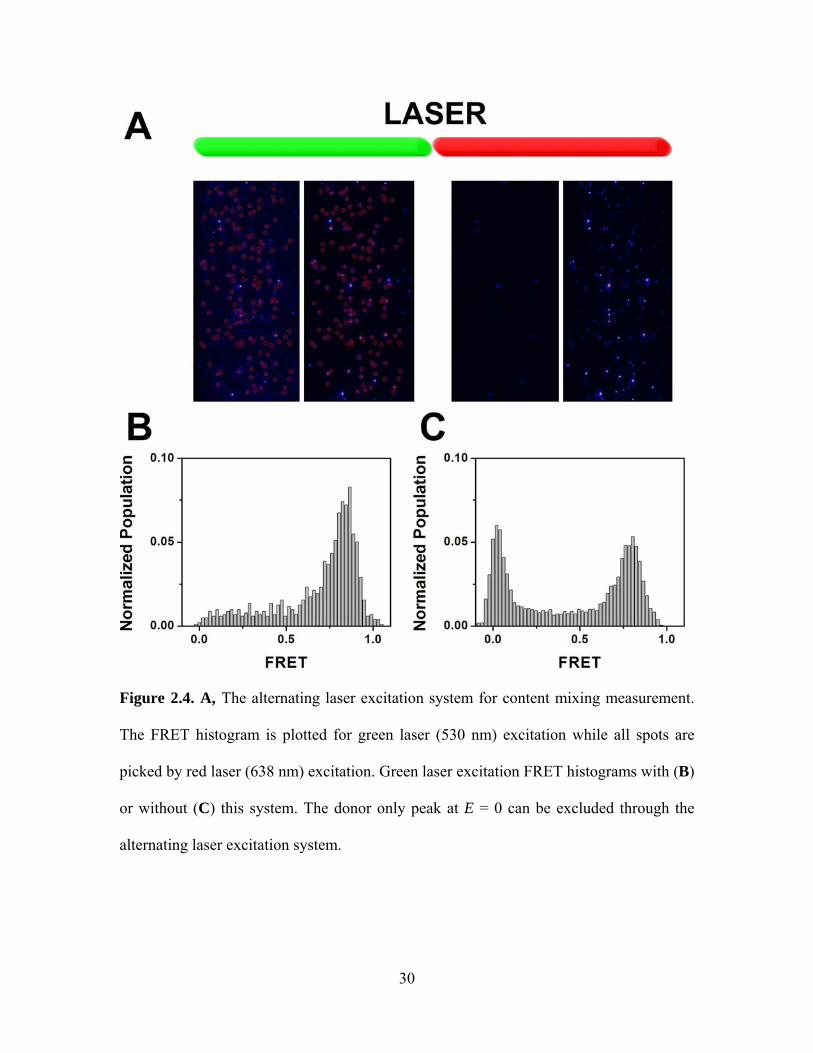
Figure 2.4. A, The alternating laser excitation system for content mixing measurement.
The FRET histogram is plotted for green laser (530 nm) excitation while all spots are
picked by red laser (638 nm) excitation. Green laser excitation FRET histograms with (B)
or without (C) this system. The donor only peak at E = 0 can be excluded through the
alternating laser excitation system.
30

CHAPTER 3
LIPID MIXING
3.1 Technique
In 2006, a single-liposome lipid mixing method based on FRET was developed in
our lab [61]. The v- and t-SNARE proteins are reconstituted in two independent
populations of liposomes that are labeled with acceptor (DiD) and donor (DiI)
fluorophores, respectively. The liposomes containing v-SNAREs and acceptors (v-
SNARE liposomes) are tethered to the bottom surface of a flow chamber, which is also
an imaging surface of TIR microscopy. Then, the liposomes containing t-SNAREs and
donors (t-SNARE liposomes) are flowed into the chamber to induce assembly of SNARE
complexes and membrane fusion between a single pair of t- and v-SNARE liposomes.
Real-time fusion intermediates with different degrees of lipid mixing are reported via
increasing values of the FRET efficiency. For example, the highest FRET value is
obtained when full fusion occurs in which both leaflets, inner and outer, mix. An
intermediate FRET is obtained for hemifusion where only the outer leaflets mix. From
the hemifusion state, a fusion pore opens to mix content as well as the inner leaflets. If
the fusion pore closes prematurely, FRET increase can stall until the pore opens again
which we have observed as additional intermediates in single liposome fusion.
Comparing with bulk fusion method, this new technique can separate intermediate states
of docking, hemi-fusion, and full fusion, and detect the kinetic transition between
individual intermediates, and post-fusion pathway such as the kiss-and-run event.
31

The detailed scheme of this single-liposome lipid mixing method is shown in Figure
3.1. A quartz slide is firstly processed with PEG molecules to eliminate non-specific
binding of liposomes. The slide is then assembled into a flow chamber and coated with
neutravidin. Through the specific interaction between biotin and neutravidin, the v-
SNARE liposomes are immobilized on the PEG-coated surface by a 15-minute
incubation. After washing the free v-SNARE liposomes in the chamber, the t-SNARE
liposomes are diluted with preset amounts of accessory proteins, and injected into the
flow chamber for the reaction at 37 °C in the buffer. The low concentration of t-SNARE
liposomes can dramatically reduce the probability of multiple liposome interactions to
warrant this method in single-liposome level. After washing the free t-SNARE liposomes
and accessory proteins, the FRET measurements by a TIR microscope are performed.
3.2 Study on complexin
[Related publication: Yoon, T.-Y., Lu, X., Diao, J., Lee, S.-M., Ha, T. & Shin, Y.-K.
Complexin and Ca2+ stimulate SNARE-mediated membrane fusion. Nat. Struct. Mol. Biol.
15, 707-713 (2008).]
The physiological studies of complexin, overexpression and knock out, yielded
conflicting observations, initiating a debate as to whether complexin is a fusion inhibitor
or stimulator. The three reports published in the 2006 primarily supported an inhibitory
role and positioned complexin as a clamp for SNARE-driven membrane fusion
[36,37,38]. Our single-vesicle FRET assay enables us to probe how individual fusion
steps are modulated by regulatory factors, during parallel imaging of over 100 fusion
events. We now directly show complexin 1 has indeed both inhibitory and stimulatory
32
effects on SNARE complexes: Inhibition of trans-SNARE complex formation and
stabilization of once assembled SNARE complexes. However, only the stimulation effect
becomes visible at physiologically relevant complexin concentrations, which accelerates
SNARE-mediated fusion by two orders of magnitude via an externally applied Ca2+ wave.
Our results suggest the existence of a ‘primed’ complex-consisting of trans-SNARE
assemblies, complexin, and lipid membranes-providing an essential substrate for Ca2+
and Ca2+ sensors in the neurotransmitter release.
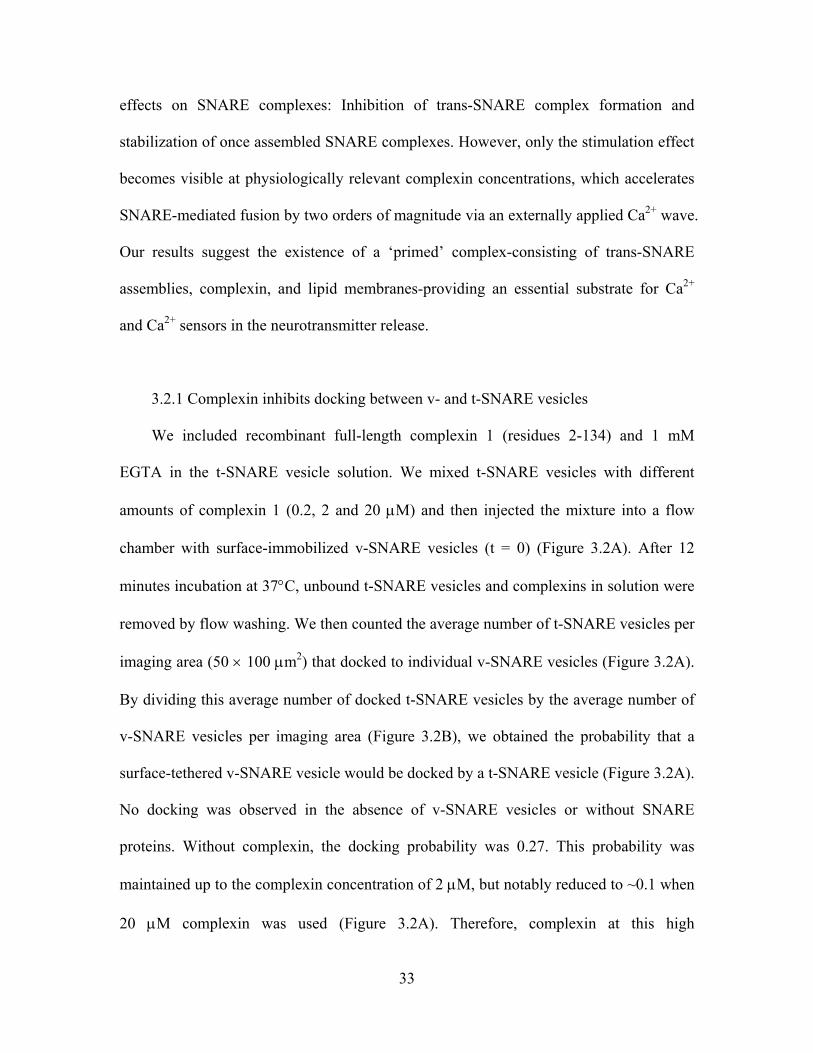
3.2.1 Complexin inhibits docking between v- and t-SNARE vesicles
We included recombinant full-length complexin 1 (residues 2-134) and 1 mM
EGTA in the t-SNARE vesicle solution. We mixed t-SNARE vesicles with different
amounts of complexin 1 (0.2, 2 and 20 μM) and then injected the mixture into a flow
chamber with surface-immobilized v-SNARE vesicles (t = 0) (Figure 3.2A). After 12
minutes incubation at 37°C, unbound t-SNARE vesicles and complexins in solution were
removed by flow washing. We then counted the average number of t-SNARE vesicles per
imaging area (50 × 100 μm2) that docked to individual v-SNARE vesicles (Figure 3.2A).
By dividing this average number of docked t-SNARE vesicles by the average number of
v-SNARE vesicles per imaging area (Figure 3.2B), we obtained the probability that a
surface-tethered v-SNARE vesicle would be docked by a t-SNARE vesicle (Figure 3.2A).
No docking was observed in the absence of v-SNARE vesicles or without SNARE
proteins. Without complexin, the docking probability was 0.27. This probability was
maintained up to the complexin concentration of 2 μM, but notably reduced to ~0.1 when
20 μM complexin was used (Figure 3.2A). Therefore, complexin at this high
33

concentration inhibits SNARE complex formation, which may explain the phenotype of
complexin overexpression.
3.2.2 Complexin binding to SNARE complex stimulates fusion
For the docked vesicle complexes, however, the FRET distribution analysis shows
that an increasing amount of complexin 1 significantly enhances the full fusion
population at E ≈ 0.7 (Figure 3.3A-3.3C). The normalized full fusion population was 0.18
at [Cpx I] = 0.2 μM and increased to 0.32 at 2 μM and 0.45 at 20 μM after 15 minutes
reaction each. To probe whether the complexin/SNARE complex interaction is directly
involved in this fusion reaction, we engineered double-point mutation in complexin 1
(C105A/R48C) to attach a nitroxide spin label at position 48, which is critically involved
in complexin binding to the SNARE complex [35,74]. This spin labeled R48C mutant
showed a minimal level of binding to the ternary SNARE complex. Consistent with this
diminished binding, the stimulation effect was significantly reduced (Figure 3.3D)
indicating complexin binding to the SNARE complex is essential for stimulation of
fusion. Furthermore, the stimulatory effect is specific to the complete SNARE complex
because drastically reduced full fusion population was observed without SNAP-25, even
with reaction time of 60 minutes and 1 mM Ca2+ (Figure 3.3E). In addition, Ca2+-
independent stimulation of full fusion by complexin 1 continued beyond 15 minutes
(Figure 3.3F).
3.2.3 Ca2+ accelerates complexin-assisted fusion events
The data described above suggests complexin is likely an independent fusion
34

stimulator, capable of directly lowering the fusion energy barrier without resorting to
other proteins including synaptotagmin 1. Then, one immediate question is if such an
independent stimulatory function of complexin even confers a Ca2+ sensitivity to the
SNARE-mediated fusion. To probe potential Ca2+ responses, we used real-time tracking
of single-vesicle fusion events. Here, we employed the vesicles of a physiologically
relevant lipid composition containing 15 mol% PS (phosphor-L-serine) and 40 mol%
cholesterol [75]. We incubated a solution of t-SNARE vesicles and complexin 1 (1-2 μM)
with surface-immobilized v-SNARE vesicles for 5~7 minutes and introduced 1 mM Ca2+
in the imaging area at t = 0 (at the speed of 2 ml/min), while donor and acceptor signals
from single-vesicle complexes were being recorded with the time resolution of 150 or
200 ms. Surprisingly, we observed a substantial fraction of vesicle complexes showing
fusion synchronized with the Ca2+ flow (Figure 3.4).
In a typical real-time trace of Ca2+-evoked fusion (Figure 3.4A), the vesicle complex
begins with the initial E value of ~0.35 that corresponds the hemifused state and starts
lipid mixing at t = 0.4 second (orange arrow) that reaches the full fusion state at E ≈ 0.75.
Likewise, many vesicle complexes start to show FRET increase following the arrival of
the Ca2+ buffer (Figure 3.4C, orange arrows). The cumulative time histogram of these
instances of initial FRET increase shows a rapid increase in number with the primary
time constant of 8.8 seconds (Figure 3.4B, green symbols with a red curve). Overall, in
the first 25-second window, 212 out of total 835 vesicle complexes imaged show the
initiation of fusion, indicating a significant fraction of vesicle complexes (~25 %)
undergoes Ca2+-evoked membrane fusion events synchronized on the seconds time scale.
When the Ca2+ concentration is reduced to 20 μM, that is a conservative estimate on the
35

Ca2+ concentration at the presynaptic active zone during neuronal stimulation [76], more
than 10 % of the total vesicle complexes show Ca2+-triggered fusion within the first 25
seconds. These percentages of Ca2+-responding vesicle complexes, 26 and 11%, are
underestimated values because we note that only ~30% of total vesicle complexes are
available for Ca2+-triggered fusion at the moment of the Ca2+ addition. In the in vitro
fusion assay, we find that on average 35% of total vesicle complexes are fusion-inactive
probably due to the absence of the auxiliary proteins, and at the same time, 36% of total
vesicle complexes become already fully fused before Ca2+ is added. Therefore, nearly 90
and 35% of the remaining “fusible” pool of vesicle complexes respond to 1 mM and 20
μM Ca2+ respectively, within the first 25-second window. In addition, the control
experiment of introducing a different type of divalent ion, 1 mM Mg2+, showed minimal
fusion activity (Figure 3.4B, red symbols).
This Ca2+-triggered fusion mode should be attributed to the stimulatory effect of
complexin because the fusion process mediated by solely SNARE proteins does not show
any progression towards full fusion in response to 1 mM Ca2+. It is highly likely that the
fusion energy barrier is first lowered by ternary SNARE complexes and complexin, and
the addition of Ca2+ ions enables many vesicle complexes to finally overcome the fusion
barrier, accelerating the fusion kinetics by additional two orders of magnitude (Figure
3.4B, green v.s. blue symbols). The distribution of the initial E values for the vesicle
complexes showing Ca2+-induced fusion has a major population between 0.2 and 0.5
(Figure 3.4D), and this FRET range approximately corresponds to the hemifusion state
[61].
Reducing negatively charged PS (phospho-L-serine) lipids from 35 mol% to 15
36
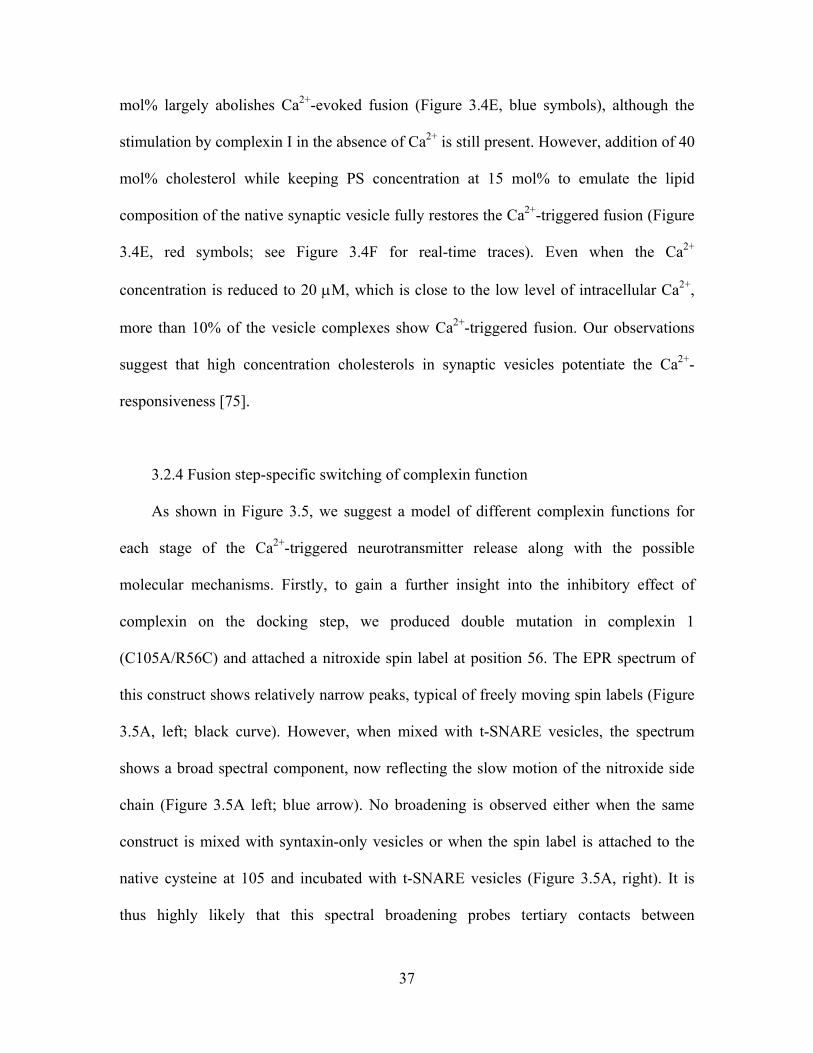
mol% largely abolishes Ca2+-evoked fusion (Figure 3.4E, blue symbols), although the
stimulation by complexin I in the absence of Ca2+ is still present. However, addition of 40
mol% cholesterol while keeping PS concentration at 15 mol% to emulate the lipid
composition of the native synaptic vesicle fully restores the Ca2+-triggered fusion (Figure
3.4E, red symbols; see Figure 3.4F for real-time traces). Even when the Ca2+
concentration is reduced to 20 μM, which is close to the low level of intracellular Ca2+,
more than 10% of the vesicle complexes show Ca2+-triggered fusion. Our observations
suggest that high concentration cholesterols in synaptic vesicles potentiate the Ca2+-
responsiveness [75].
3.2.4 Fusion step-specific switching of complexin function
As shown in Figure 3.5, we suggest a model of different complexin functions for
each stage of the Ca2+-triggered neurotransmitter release along with the possible
molecular mechanisms. Firstly, to gain a further insight into the inhibitory effect of
complexin on the docking step, we produced double mutation in complexin 1
(C105A/R56C) and attached a nitroxide spin label at position 56. The EPR spectrum of
this construct shows relatively narrow peaks, typical of freely moving spin labels (Figure
3.5A, left; black curve). However, when mixed with t-SNARE vesicles, the spectrum
shows a broad spectral component, now reflecting the slow motion of the nitroxide side
chain (Figure 3.5A left; blue arrow). No broadening is observed either when the same
construct is mixed with syntaxin-only vesicles or when the spin label is attached to the
native cysteine at 105 and incubated with t-SNARE vesicles (Figure 3.5A, right). It is
thus highly likely that this spectral broadening probes tertiary contacts between
37

complexin and the t-SNARE proteins, consistent with a recent finding of the complexin/t-
SNARE interaction using a floatation assay [77]. Spectral subtraction analysis [78] gives
the dissociation constant of ~50 μM, which is much weaker than that of the complexin
binding to the ternary SNARE complex [37,74]. This weak interaction would lead to
competition between v-SNARE and complexin for binding to t-SNAREs (Figure 3.5B).
When highly expressed, complexin outnumbers v-SNARE thereby inhibiting SNARE
complex assembly. This observation may explain the inhibitory phenotypes observed in
complexin overexpression and in vitro assays [36,37,38,79,80].
However, it appears that the primary function of complexin is to stimulate SNARE-
mediated fusion using the specific binding mode to the ternary SNARE complex (Figure
3.5C-F) [35,74]. Earlier structural studies positioned complexin as a potential fusion
stimulator because complexin was thought to stabilize assembly of SNARE complexes
[35,74]. By tracking the number of the docked t-SNARE vesicles in time, we indeed
observed stabilization of the number of single vesicle complexes in the presence of
complexin (Figure 3.6A). Without complexin 1, the number of docked t-SNARE vesicles
significantly decreases with time (Figure 3.6A, green circles), reflecting disassembly of
trans-SNARE complexes probably due to repulsion between t- and v-SNARE vesicles. In
contrast, we observe even a moderate concentration of complexin 1 (2 μM) has a
noticeable effect of keeping trans-SNARE complexes from being disassembled (Figure
3.6A, blue triangle). Such complexin-stabilized SNARE complexes may more effectively
transmit the tensions created during SNARE complex formation to fusing membranes.
Our observation demonstrates that complexin is neither a simple inhibitor nor a
stimulator, but has both functions in the same sequence. We note such dual roles have
38
been recently proposed for important presynaptic fusion regulators. A SM protein,
Munc18-1 was long anticipated to be a fusion inhibitor by stabilizing closed syntaxin 1,
but in vitro reconstitution experiments found Munc18-1 stimulates SNARE-mediated
fusion through direct interaction with assembled SNAREpins [45,46,47]. It was also
recently reported that complexin domains contribute differentially to rescuing its KO
phenotype [81], attributing different functions to different domains. Remarkably, we
observe both inhibition and stimulation of complexin in “one round” of single fusion
events−not in two independent experimental designs−and show that the transition from
inhibition to stimulation takes place “in phase with” SNARE complex assembly. Such
dual roles could be a common and salient feature of presynaptic fusion regulators
considering high degree of controllability required for neuronal exocytosis. Our
observation that the switching between dual roles is a sharp function of SNAREpin
assembly could be crucial because 1) as implied in the zippering model [82,83], the
degree of SNARE complex assembly is one of the physical parameters that define the
fusion step, 2) fusion regulators could then swap interaction modes across synergetic
cooperation to negative feedback loop for different fusion steps, tightly regulating fusion
progression to next steps and 3) our observation may provide a clue for understanding the
previous conflicting complexin phenotypes.
A noteworthy aspect of our results is the observation that the Ca2+ influx
synchronizes fusion of single vesicle complexes on the seconds time scale (Figure 3.4), a
totally unexpected finding that has been hidden in physiological analysis and in vitro
ensemble measurements. The stringent control experiments involving the single point
mutation in complexin, the SNAP-25-dependence of fusion, the different lipid
39
compositions, and the Ca2+-specificity test using Mg2+ ions argue that the observed Ca2+-
evoked fusion mode occurs in a way that is highly selective to physiologically relevant
conditions. We cannot rule out the possibility that complexin is an active Ca2+-sensor and
especially, the first 26 residues of complexin could play an active role upon Ca2+ influx
[81]. However, we find the Ca2+-response diminished in the absence of cholesterol
(Figure 3.4E) can be largely restored by increasing the PS concentration in the vesicle
lipid composition, indicating the fusion triggering is in part largely mediated through
interactions between divalent Ca2+ ions and negatively charged lipid membranes. On the
basis of our data, we suggest that the supramolecular complex consisting of ternary
SNARE complexes, complexin, and lipid membranes directly reacts with Ca2+ ions to
achieve fusion triggering.
This fusion mechanism is well described in the viewpoint of fusion energetics
[84,85,86]. Although our observation of the inhibitory effect is reminiscent of the fusion
clamp model [36,38], the underlying energetics suggested by our results is fundamentally
different from that of the clamp model. In the fusion clamp model, SNARE complex
assembly is thought to release sufficient free energy to overcome all the fusion energy
barriers, so its energy release needs to be spring-loaded by a ‘clamp’ to gain control over
the timing of fusion (Figure 3.6B, left). Our data suggest that the SNARE complexes
dramatically decrease the free energy barrier of a fusion event that would otherwise
exhibit negligible fusion progression on practical time scales (Figure 3.6B, right). The
single vesicle FRET imaging does show even with the molecular action of SNAREs,
there remains a significant energy barrier, giving the growth of the full fusion peak on the
time scale of tens of minutes. Complexin further lowers the energy barrier, and the
40
interaction of Ca2+ ions and lipid membranes helps vesicle complexes finally pass the
transition state on the seconds time scale (Figure 3.6B, right).
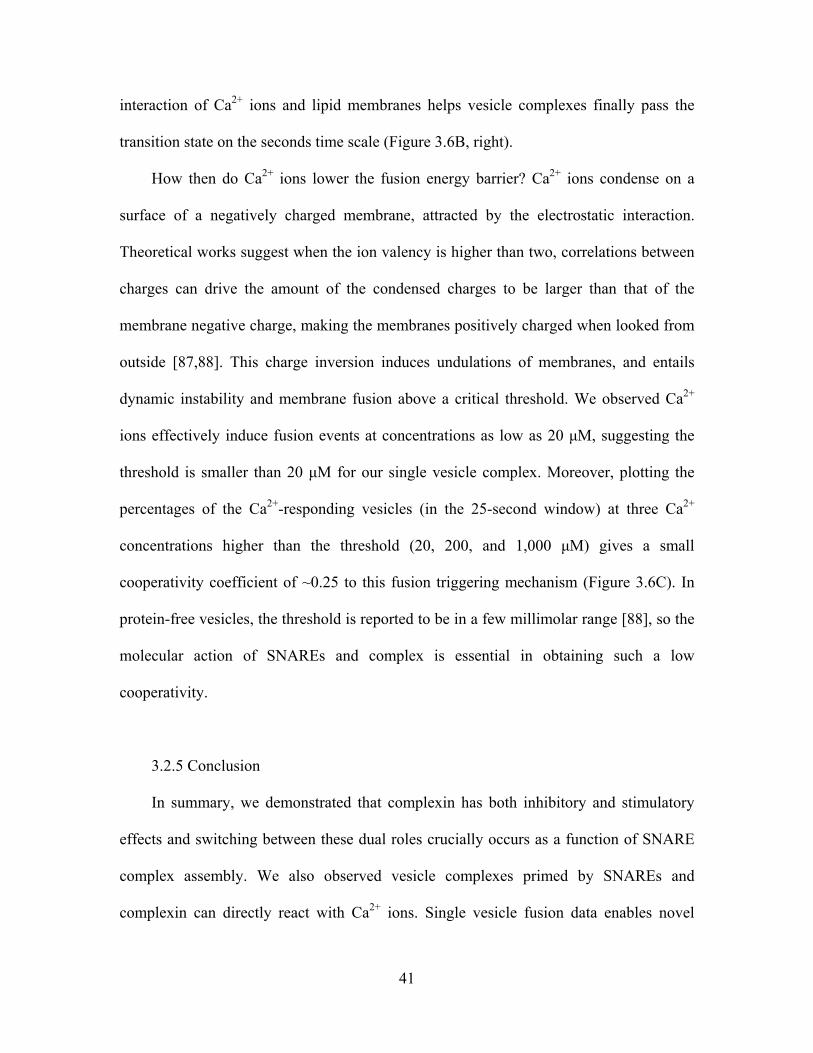
How then do Ca2+ ions lower the fusion energy barrier? Ca2+ ions condense on a
surface of a negatively charged membrane, attracted by the electrostatic interaction.
Theoretical works suggest when the ion valency is higher than two, correlations between
charges can drive the amount of the condensed charges to be larger than that of the
membrane negative charge, making the membranes positively charged when looked from
outside [87,88]. This charge inversion induces undulations of membranes, and entails
dynamic instability and membrane fusion above a critical threshold. We observed Ca2+
ions effectively induce fusion events at concentrations as low as 20 μM, suggesting the
threshold is smaller than 20 μM for our single vesicle complex. Moreover, plotting the
percentages of the Ca2+-responding vesicles (in the 25-second window) at three Ca2+
concentrations higher than the threshold (20, 200, and 1,000 μM) gives a small
cooperativity coefficient of ~0.25 to this fusion triggering mechanism (Figure 3.6C). In
protein-free vesicles, the threshold is reported to be in a few millimolar range [88], so the
molecular action of SNAREs and complex is essential in obtaining such a low
cooperativity.
3.2.5 Conclusion
In summary, we demonstrated that complexin has both inhibitory and stimulatory
effects and switching between these dual roles crucially occurs as a function of SNARE
complex assembly. We also observed vesicle complexes primed by SNAREs and
complexin can directly react with Ca2+ ions. Single vesicle fusion data enables novel
41

analyses, including assessing the synchrony level of given vesicle pools and finding the
Hill cooperativity coefficient, which can be directly compared with physiological
findings, positioning this new Ca2+-triggering pathway in relation to asynchronous release.
Incorporation of full-length synaptotagmin 1 in our system may further accelerate our
Ca2+-response and reveal the molecular details of synchronous release. The methodology
established in this work can be used to study a wide range of membrane fusion regulators
and uncover previously hidden molecular function.
3.3 Study on Munc18-1
[Related publication: Diao, J., Su, Z., Lu, X., Yoon, T.-Y., Shin, Y.-K. & Ha, T. Single
vesicle fusion assay reveals Munc18-1 binding to the SNARE core is sufficient for
stimulating membrane fusion. ACS Chem. Neurosci. 1, 168-174 (2010).]
Munc18-1 interacts with SNARE proteins at least in two different modes, namely
binding to Habc domain (amino acids 28–146) of syntanxin and binding to the SNARE
core complex. In the first mode, Munc18 interacts with monomeric syntaxin through the
N-terminal helical segment of syntaxin called the Habc domain to form a
Munc18/syxntaxin binary complex [40,41,42,43]. This Habc binding mode stabilizes the
closed conformation of syntaxin during its transportation to the plasma membrane in vivo.
Without this stabilization effect, the syntaxin level in sensory neurons was reduced by
70% in Munc18 knockout mice [89]. In the second mode, Munc18 also binds to the
SNARE core, a four helical bundle formed by syntaxin, VAMP and SNAP25
[44,45,46,47]. Ensemble proteoliposome fusion experiments showed that Munc18 binds
preassembled SNARE complexes, and effectively promotes SNARE-mediated fusion
42

with full-length syntaxin [45]. An interaction called N-peptide binding between Munc18
and N-terminal peptides (amino acids 1-24) of syntaxin besides this SNARE
core/Munc18 interaction is believed to be critical for this fusion promotion effect [44,45].
However, how Munc18 activates fusion remains unclear in part due to the inability of the
ensemble in vitro fusion assay to dissect different steps of fusion reaction.
3.3.1 Munc18-1 promotes lipid mixing with SNARE core complex
The resulting single vesicle FRET efficiency histograms of the reaction product
showed that Munc18-1 promotes full fusion represented at the FRET efficiency > 0.5 in a
concentration-dependent manner whether the full-length syntaxin 1A (syntaxin-full,
amino acids 1-288) or the truncated syntaxin 1A lacking N-peptide and Habc domain
(syntaxin-HT, Habc-truncated, amino acids 168-288) was used. After 20 minutes reaction,
we observed more than 50% full fusion populations (Figure 3.7), which is much faster
than the previous report of several hours [45]. The fusion promotion activity of Munc18-
1 is dependent on SNAP-25 for both syntaxin-full and syntaxin-HT cases because
omitting SNAP-25 led to a significant reduction in full fusion population (Figure 3.7A
and 3.7B). Because SNAP-25 is required for the formation of the complete SNARE
complex, it is likely that the interaction between Munc18-1 and the SNARE core
complex promotes fusion. Furthermore, this fusion promotion activity of Munc18-1 does
not seem to require additional interactions with the N-peptide of syntaxin 1A.
3.3.2 Munc18-1 interacts with the SNARE core complex reconstituted on vesicles
43
Spin labeling EPR has proven effective in detecting the intermolecular interaction
such the one between syntaxin 1A and Munc18-1. The seven native cysteines in wild-
type Munc18 hamper the site-specific attachment of the nitroxide spin labels. However,
we could at least non-selectively spin-label native cysteines to primitively probe the
putative intermolecular interaction. For this purpose, wild type Munc18-1 was labeled
with the methanethiosulfonate spin label. The EPR spectra for spin labeled Munc18-1 in
solution, with syntaxin 1A (full length and HT), and with the SNARE complex in
membrane were measured respectively at room temperature (Figure 3.8). The broadened
line shape of the EPR spectrum indicates that the Munc18-1 bind to full-length syntaxin
directly (Figure 3.8B, left panel). The EPR spectrum did not show any change when
incubated with syntaxin-HT only (Figure 3.8C, left panel). These data are consistent with
the previous conclusion that the Habc domain of syntaxin plays an important role in the
interaction between monomeric syntaxin and Munc18 in solution.
We found a different result when the EPR spectrum from Munc18 was measured
with the SNARE complex in the context of membrane. After full-length syntaxin or
syntaxin-HT was reconstituted into membrane and formed a ternary complex with SNAP-
25 and soluble VAMP 2 (amino acids 1-89), spin labeled Munc18-1 was added to the
complex. The EPR spectra of Munc18-1 were broadened for both SNARE complexes
containing full-length syntaxin and syntaxin-HT, indicating that the N-peptide of syntaxin
1A is not necessary for Munc18-1 interaction with the membrane associated SNARE
complexes (Figure 3.8B and 3.8C, right panels). Interestingly, Rothman’s group [45] also
found that Munc18-1 still binds to the membrane associated SNARE complex even with
the Habc domain removed (syntaxin-HT) or the N-peptide mutated (L8A). Overall, our
44

work shows that Munc18-1 could bind to the SNARE core complex reconstituted into the
lipid membrane even in the absence of the N-peptide interaction, and this SNARE
core/Munc18 binding mode is likely to be responsible for fusion acceleration by Munc18-
1. Meanwhile, the EPR analysis showed that there is no direct interaction between the
membrane and Munc18-1 (Figure 3.8A, right panel) which rules out the possibility that
the spectral broadening observed in the presence of SNARE complex (Figure 3.8C, right
panel) was caused by lipid molecules. We note here that we not only have the EPR line
broadening (Figure 3.8, indicated by arrows) due to the quaternary interaction between
Munc18 and SNAREs, but we also see some extra line broadening (Figure 3.8, indicated
by circles) due to the spin-spin interaction. The spin-spin interaction is most likely due to
the clustering of spin labeled Munc18, perhaps reflecting the binding of several Munc18
molecules to the oligomeric supramolecular SNARE complex [90].
3.3.3 Conclusion
In conclusion, Munc18-1 promotes neuronal SNARE-mediated fusion not only with
the full-length syntaxin 1A but also with Habc-truncated syntaxin 1A. The SNARE
complex/Munc18 interaction is mainly responsible for this effect. Furthermore, Munc18-
1 accelerates vesicle fusion significantly more rapidly than previously observed. With the
advent of new single molecule imaging technologies, these protein-protein interactions
critical for fusion may also become observable.
3.4 Study on C2AB
45

[Related publication: Diao, J., Yoon, T.-Y., Su, Z., Shin, Y.-K. & Ha, T. C2AB: a
molecular glue for lipid vesicles with negatively charged surface. Langmuir 25, 7177-
7180 (2009).]
C2AB, is the cytosolic part of synaptotagmin I, believed to be the primary calcium
sensor in synaptic vesicle exocytosis, and has two C2 domains referred as the C2A- and
C2B-domains [91,92]. C2A domain binds three calcium ions whereas the C2B domain
binds two calcium ions with their calcium binding pockets formed by two protruding
loops at the top of the beta sandwiches. The C2AB molecule interacts with both SNARE
(soluble N-ethylmaleimide-sensitive factor attachment protein receptor) complexes,
which is an essential part of the intracellular membrane fusion machinery, and negatively
charged phospholipids, such as phosphatidylserine (PS). In response to the calcium,
C2AB partially penetrates the membrane to deform the lipid bilayer and lower the
activation barrier to assist the membrane fusion [93]. The detailed mechanism of C2AB
binding on membrane with assistant from calcium ions has been studied by Rizo’s group
[93]. Simply, after calcium ion binding, C2AB molecules containing multiple binding
sites become very positively charged, which has a high affinity with negatively charged
lipid molecules.
3.4.1 C2AB and Ca2+ cause vesicle aggregation
As shown in Figure 3.9A, in the absence of Ca2+, we could not see appreciable
docking of the DiI-labeled donor liposomes. However, as this mixture was washed out by
subsequent injection of 0.1 mM Ca2+, DiI-labeled liposomes began to dock to surface-
immobilized, DiD-labeled liposomes rapidly with a time constant of hundreds of
46

milliseconds. The negative stain transmission electron microscopy also verified that the
separated liposomes containing 35 mol% PS plus 65 mol% PC clustered together quickly
after adding 1 μM C2AB and 0.1 mM Ca2+ (Figure 3.9B and 3.9C).
The negatively charged PS molecules play an important role in the interaction
between C2AB molecules and calcium ions. When we reduced PS concentration from 35
mol% to 5 mol%, the gluing of DiI liposomes was extinguished (Figure 3.10A). Since
only 5 calcium ion-binding sites are associated with each C2AB molecule, the 0.1 mM
Ca2+ was saturating for 1 μM C2AB. When calcium concentration was increased to 1
mM, the docking number of DiI liposomes, which is the number of donor spots in each
image area with the size of 25 μm × 50 μm, remained the same (Figure 3.10B). Under the
calcium-saturated condition, we can control the results by adjusting the amount of C2AB.
As shown in Figure 3.10B, the DiI-liposome docking number was greatly reduced when
C2AB concentration was lowered to 0.1 μM.
3.4.2 Factors influence C2AB and Ca2+ effect
The effect of the C2AB is specific in terms of the response to calcium ions and the
interaction between charged membranes. When we replaced calcium ions with the same
concentration of magnesium ions, the glue function of C2AB totally vanished (Figure
3.11A). This result indicates that this molecular glue is not simply caused by the
electrostatic interaction of any divalent ion and specific binding of calcium to C2AB
molecules is required [93]. When we partially destroyed pre-docked DiD liposome layer
by an air bubble before DiI liposomes were injected, as demonstrated in the upper part of
Figure 3.11B, no DiI liposome attachment was observed after calcium washing while the
47
lower part with intact DiD liposomes worked normally. We concluded that no DiI
liposome docking was observed without DiD liposomes. This experiment illuminates the
specificity of this molecular glue, which hints at wide applicability.
This abrupt and stable appearance of the DiI-labeled liposomes is ascribed to
specific docking to DiD-labeled liposomes because the FRET distribution peaked at a
non-zero efficiency value, E = IA/(IA+ID) = 0.3, where IA and ID are the sensitized
emission intensity of the acceptor and donor, respectively (Figure 3.11C). This FRET
efficiency value, strongly suggests that a close packaging state of vesicles, in which the
outer leaflets are about to mix, is induced by C2AB and calcium ions. As shown in Figure
3.9C, this close packaging state is also observed through the negative stain transmission
electron microscopy. After calcium ion binding, C2AB molecules become positively
charged, which has a high affinity with negatively charged lipid molecules of the
membrane [93]. We found that interaction between C2AB molecules with calcium ions
and charged membranes is strong and stable. Even after ten-rounds buffer washing, 150
μL for each round, more than 80% of the DiI liposomes still remained bonded on the
surface (Figure 3.11D).
3.4.3 Conclusion
In conclusion, we reported on C2AB molecules containing calcium ions, specifically
for aggregating negatively charged lipid vesicles. A high local concentration of lipid
vesicles can be achieved rapidly.
48

Chapter 3 Figures:
Figure 3.1. Schematics of the single-vesicle lipid mixing assay. (Left) DiD (acceptor)
labeled v-SNARE vesicles are immobilized on the bottom surface of a flow chamber,
which is also the imaging surface of the TIR microscopy. DiI (donor) labeled t-SNARE
vesicles and accessory protein are introduced to the chamber space using a flow system.
(Right) After a 37 oC incubation, some t-SNARE vesicles dock to single v-SNARE
vesicles through formation of trans-SNARE complexes, and accessory protein binds to
the trans-SNARE complexes. Membrane fusion between t- and v-SNARE vesicles and
resultant lipid mixing will entail an increase in the FRET efficiency.
49

Figure 3.2. A, Docking probability of a single v-SNARE vesicle measured at t = 15 min
as a function of the Cpx I concentration. Error bars, s.d. B, The number of v-SNARE
vesicles in an imaging area can be counted by selectively exciting v-SNARE vesicles
using a 633 nm red laser. (Left) An example image, directly obtained from TIR imaging,
shows excited v-SNARE vesicles in the acceptor channel. (Right) The measured average
is 1,052 ± 39 vesicles per imaging area. The docking probability of a v-SNARE vesicle
can be simply obtained by dividing the number of docked t-SNARE vesicles with the
average number of v-SNARE vesicles.
50

Figure 3.3. A-C, FRET histograms of single-vesicle complexes measured at t = 15 min at
[Cpx I] = 0.2 (A), 2 (B), and 20 μM (C). D, Control data using the C105A/R48C-spin
label complexin I mutant. The FRET population assay (green symbol: without complexin
I, red: with 2 μM mutant; t = 15 min) shows the stimulation effect is largely diminished,
coincident with the impaired complexin binding to ternary SNARE complexes. E,
Control data without SNAP-25. t-SNARE vesicles with only syntaxin HT (lipid/protein
ratio = 200:1) and [Cpx I] = 2 μM were used for incubation with v-SNARE vesicles.
Green symbols show the FRET distribution measured at t = 15 min. (Red) 1 mM Ca2+
was injected subsequent to flow washing of t-SNARE vesicles and complexin I, and
51

FRET values were imaged at t = 60 min. F, Time-course change of the single-vesicle
FRET histogram at [Cpx I] = 20 μM. Three FRET histograms, measured at t = 15 (green),
30 (red), 60 min (yellow), are shown.
52
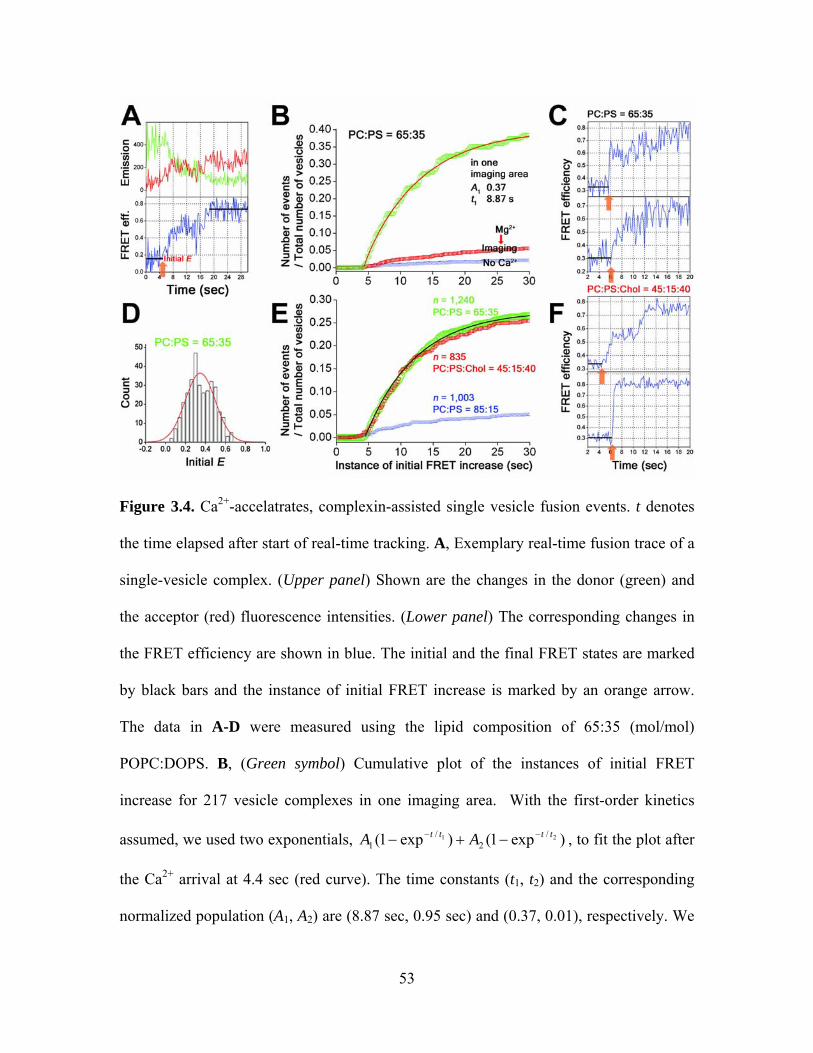
Figure 3.4. Ca2+-accelatrates, complexin-assisted single vesicle fusion events. t denotes
the time elapsed after start of real-time tracking. A, Exemplary real-time fusion trace of a
single-vesicle complex. (Upper panel) Shown are the changes in the donor (green) and
the acceptor (red) fluorescence intensities. (Lower panel) The corresponding changes in
the FRET efficiency are shown in blue. The initial and the final FRET states are marked
by black bars and the instance of initial FRET increase is marked by an orange arrow.
The data in A-D were measured using the lipid composition of 65:35 (mol/mol)
POPC:DOPS. B, (Green symbol) Cumulative plot of the instances of initial FRET
increase for 217 vesicle complexes in one imaging area. With the first-order kinetics
assumed, we used two exponentials, , to fit the plot after
the Ca
)exp1()exp1( 21 /2
/1
tttt AA −− −+−
2+ arrival at 4.4 sec (red curve). The time constants (t1, t2) and the corresponding
normalized population (A1, A2) are (8.87 sec, 0.95 sec) and (0.37, 0.01), respectively. We
53
thus find that the cumulative plot exhibits mainly one time constant of ~8.9 sec. (Red and
Blue symbols) Cumulative plots of the instances of initial FRET increase upon injection
of 1 mM Mg2+ (Red) or fusion buffer without Ca2+ (Blue). Both cumulative plots are
based on multiple numbers of flow experiments; Total number of vesicle complexes
studied are 1,161 (Red) and 1,900 (Blue). C, Exemplary real-time traces showing
synchronized FRET jumps. The instances of initial FRET increase, marked by orange
arrows, are 5.8 and 6.2 sec (from upper to lower). D, Distribution of the initial E values
for the single-vesicle complexes that show an FRET increase within the first 30 second
window. Fitting with a Gaussian distribution gives the center at E = 0.35 and the standard
deviation of 0.15 (red curve). Total 1,240 vesicles from five independent flow
experiments are included in statistics, and the corresponding cumulative time plot is
shown as green symbols in E. E, Cumulative plots of the instances of initial FRET
increase for different lipid compositions: (green symbol) 65:35 (mol/mol) POPC:DOPS,
(red) 45:15:40 (mol/mol/mol) POPC:DOPS:cholesterol, and (blue) 85:15 (mol/mol)
POPC:DOPS. n = 1,240 (green), 835 (red), and 1,003 (blue). F, Exemplary real-time
traces showing synchronized FRET jumps. The lipid composition of 45:15:40
(mol/mol/mol) POPC:DOPS:cholesterol was used. The instances of initial FRET increase,
marked by orange arrows, are 4.8 and 6.2 sec (from upper to lower).
54
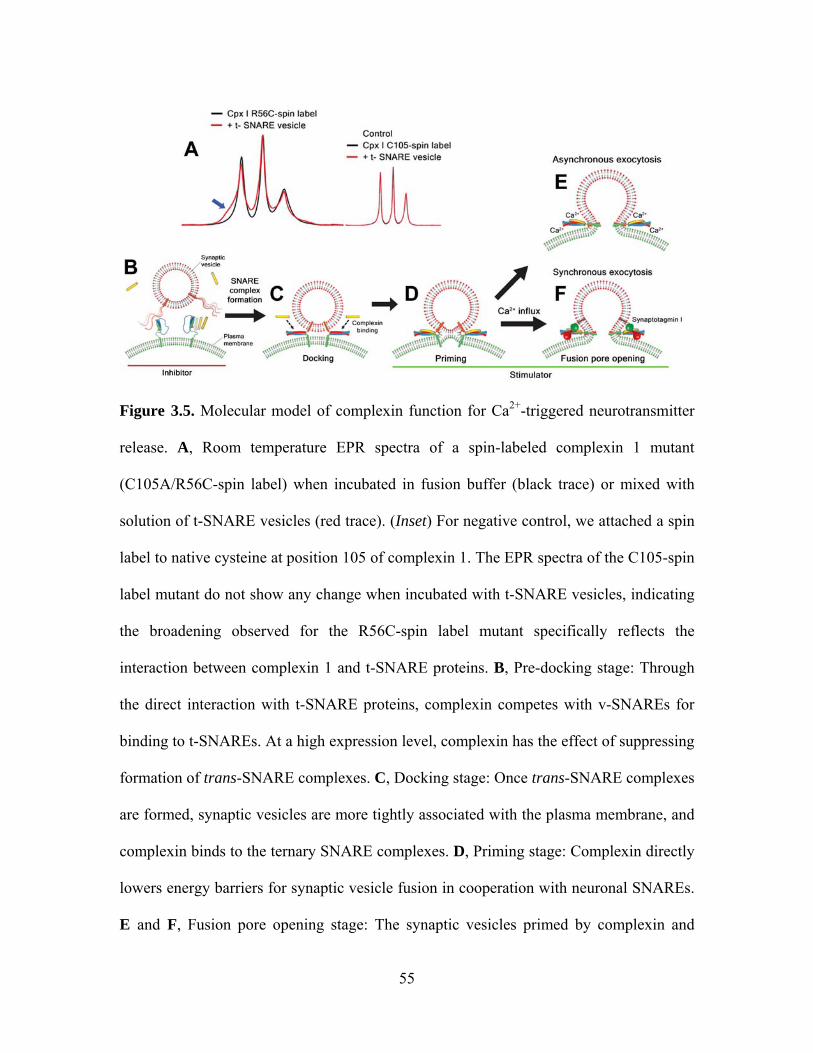
Figure 3.5. Molecular model of complexin function for Ca2+-triggered neurotransmitter
release. A, Room temperature EPR spectra of a spin-labeled complexin 1 mutant
(C105A/R56C-spin label) when incubated in fusion buffer (black trace) or mixed with
solution of t-SNARE vesicles (red trace). (Inset) For negative control, we attached a spin
label to native cysteine at position 105 of complexin 1. The EPR spectra of the C105-spin
label mutant do not show any change when incubated with t-SNARE vesicles, indicating
the broadening observed for the R56C-spin label mutant specifically reflects the
interaction between complexin 1 and t-SNARE proteins. B, Pre-docking stage: Through
the direct interaction with t-SNARE proteins, complexin competes with v-SNAREs for
binding to t-SNAREs. At a high expression level, complexin has the effect of suppressing
formation of trans-SNARE complexes. C, Docking stage: Once trans-SNARE complexes
are formed, synaptic vesicles are more tightly associated with the plasma membrane, and
complexin binds to the ternary SNARE complexes. D, Priming stage: Complexin directly
lowers energy barriers for synaptic vesicle fusion in cooperation with neuronal SNAREs.
E and F, Fusion pore opening stage: The synaptic vesicles primed by complexin and
55
other non-synaptotagmin fusion stimulators directly react with Ca2+ to produce the
asynchronous neurotransmitter release (E). The molecular action of Ca2+-bound
synaptotagmin 1 further accelerates fusion pore opening, achieving the synchronous
release (F).
56
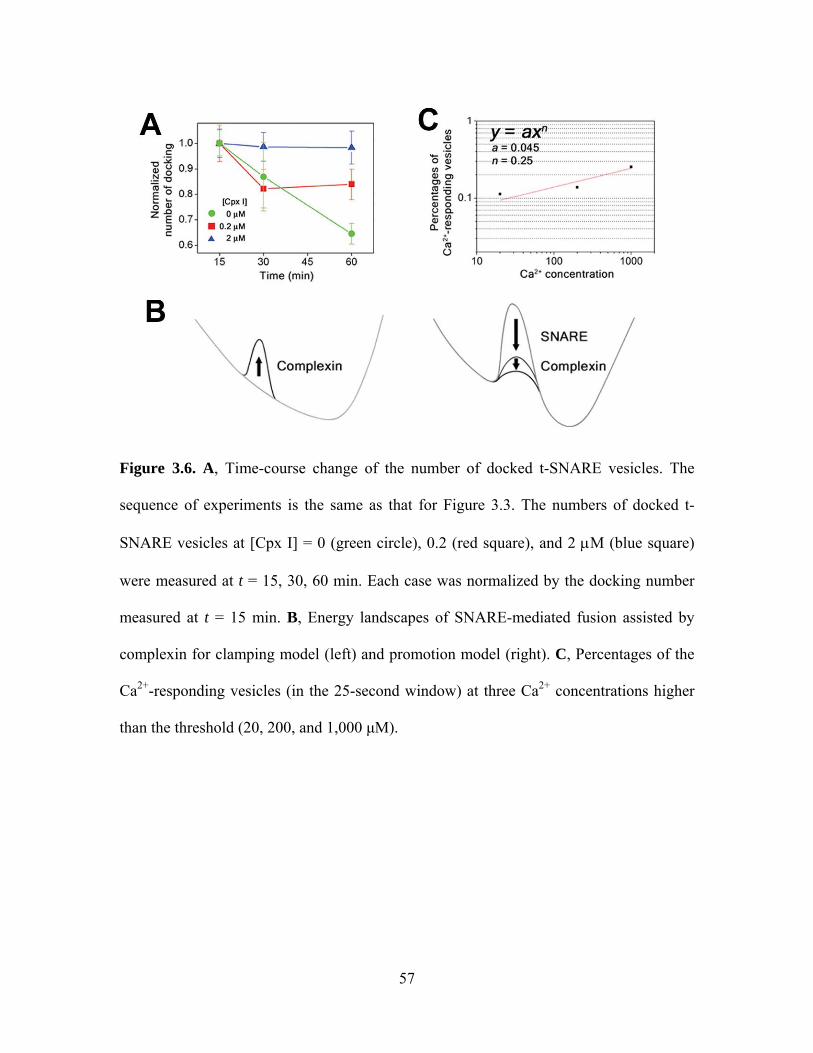
Figure 3.6. A, Time-course change of the number of docked t-SNARE vesicles. The
sequence of experiments is the same as that for Figure 3.3. The numbers of docked t-
SNARE vesicles at [Cpx I] = 0 (green circle), 0.2 (red square), and 2 μM (blue square)
were measured at t = 15, 30, 60 min. Each case was normalized by the docking number
measured at t = 15 min. B, Energy landscapes of SNARE-mediated fusion assisted by
complexin for clamping model (left) and promotion model (right). C, Percentages of the
Ca2+-responding vesicles (in the 25-second window) at three Ca2+ concentrations higher
than the threshold (20, 200, and 1,000 μM).
57

Figure 3.7. Fraction of vesicle complexes showing full fusion for various reaction
conditions. 1 μM Munc18-1 was used. Results obtained with the full length syntaxin (A),
and with a syntanxin-HT (B). Controls without SNAP-25 led to a significant reduction in
full fusion, likely due to the formation of incomplete SNARE complexes, which cannot
mediate efficient fusion. Full fusion population is calculated by summing all normalized
populations with E values > 0.5. Error bars denote the s.d. of 3 to 5 independent
experiments with different batches of SNARE and Munc18-1 proteins.
58
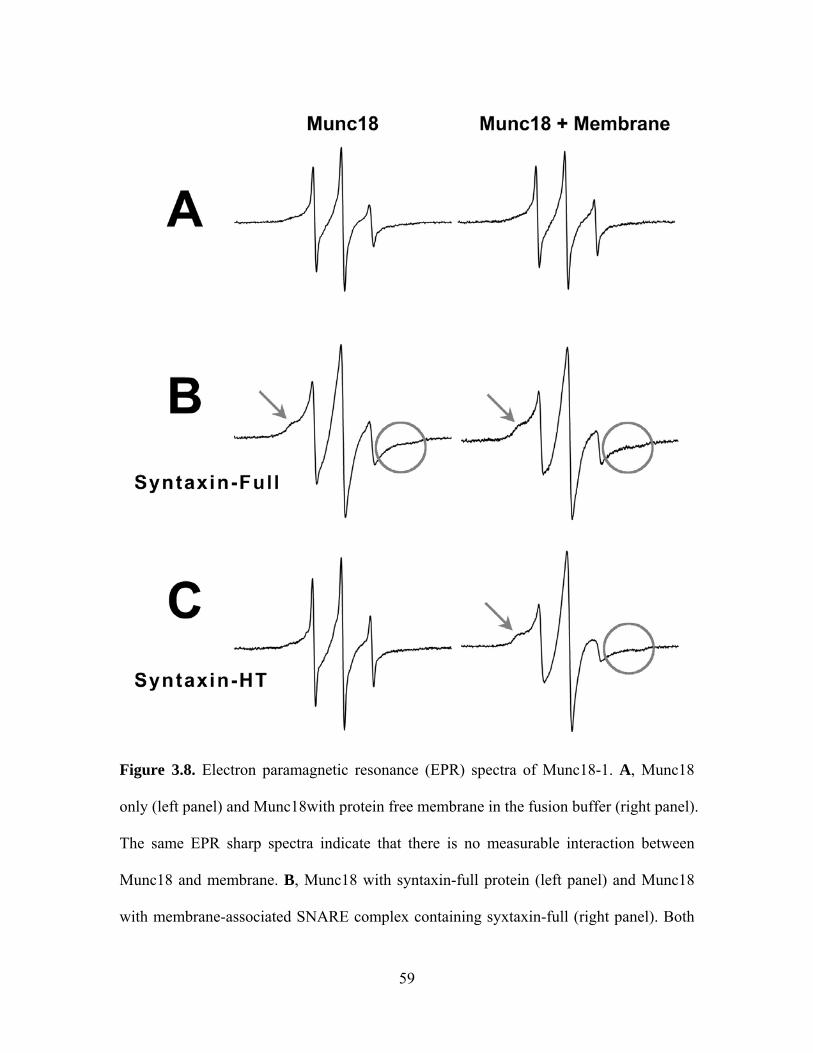
Figure 3.8. Electron paramagnetic resonance (EPR) spectra of Munc18-1. A, Munc18
only (left panel) and Munc18with protein free membrane in the fusion buffer (right panel).
The same EPR sharp spectra indicate that there is no measurable interaction between
Munc18 and membrane. B, Munc18 with syntaxin-full protein (left panel) and Munc18
with membrane-associated SNARE complex containing syxtaxin-full (right panel). Both
59
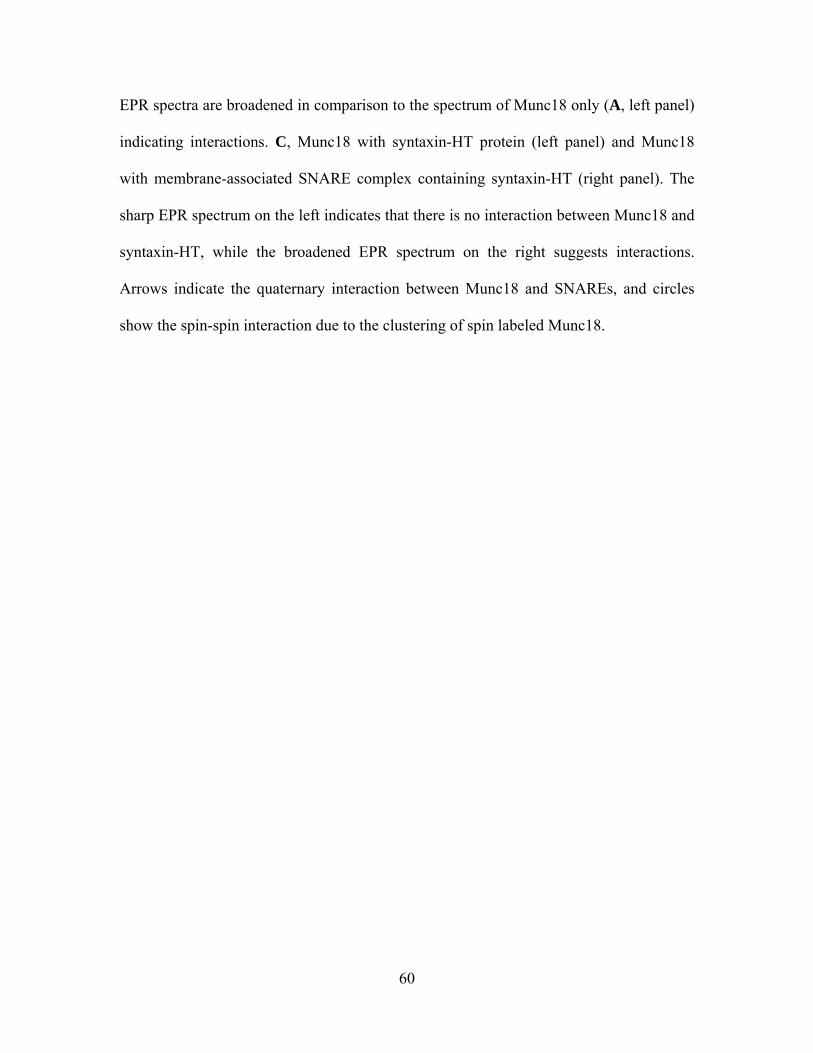
EPR spectra are broadened in comparison to the spectrum of Munc18 only (A, left panel)
indicating interactions. C, Munc18 with syntaxin-HT protein (left panel) and Munc18
with membrane-associated SNARE complex containing syntaxin-HT (right panel). The
sharp EPR spectrum on the left indicates that there is no interaction between Munc18 and
syntaxin-HT, while the broadened EPR spectrum on the right suggests interactions.
Arrows indicate the quaternary interaction between Munc18 and SNAREs, and circles
show the spin-spin interaction due to the clustering of spin labeled Munc18.
60

Figure 3.9. A, TIR images before and after 0.1 mM Ca2+ influx. The images are split into
donor and acceptor channels. Only a few fluorescent debris molecules were visible in
donor channel before calcium influx. A large number of bright donor spots in the TIR
image appeared shortly after calcium influx indicating the docking of DiI liposomes to
the surface-immobilized DiD liposomes. The negative stain transmission electron
micrographs of liposomes (35 mol% PS : 65 mol% PC) without (B) and with adding 1
µM C2AB and 0.1 mM Ca2+, (C).
61
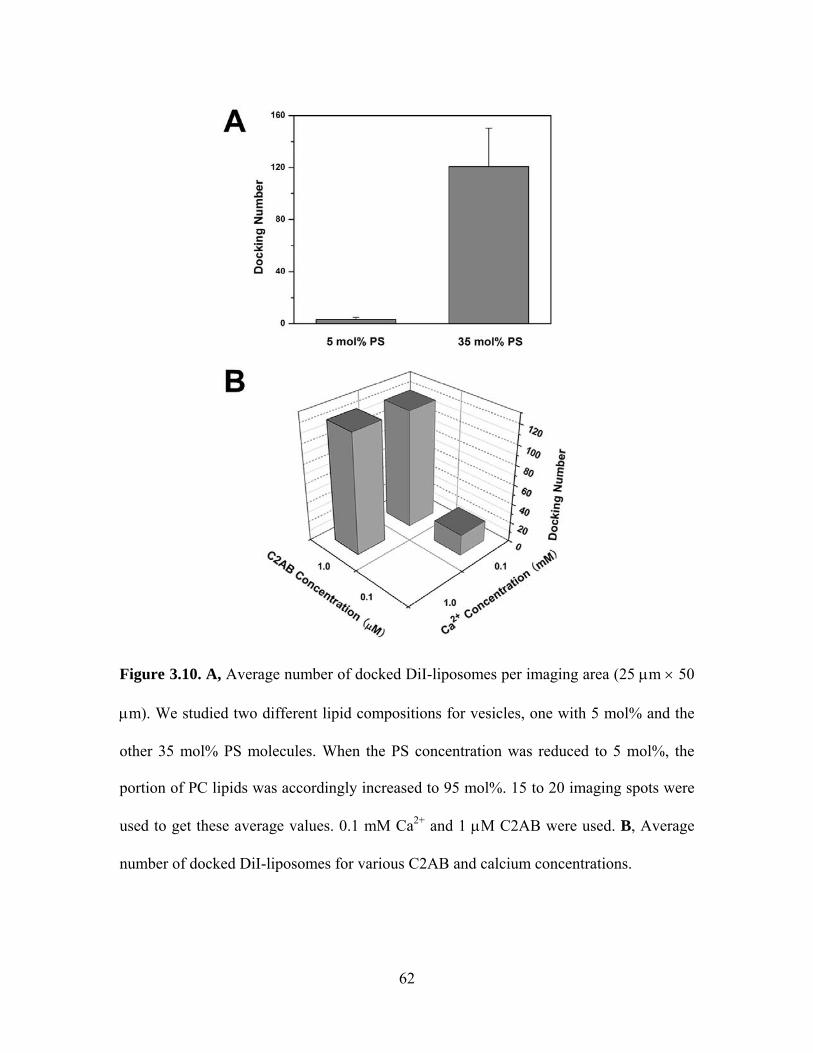
Figure 3.10. A, Average number of docked DiI-liposomes per imaging area (25 μm × 50
μm). We studied two different lipid compositions for vesicles, one with 5 mol% and the
other 35 mol% PS molecules. When the PS concentration was reduced to 5 mol%, the
portion of PC lipids was accordingly increased to 95 mol%. 15 to 20 imaging spots were
used to get these average values. 0.1 mM Ca2+ and 1 μM C2AB were used. B, Average
number of docked DiI-liposomes for various C2AB and calcium concentrations.
62
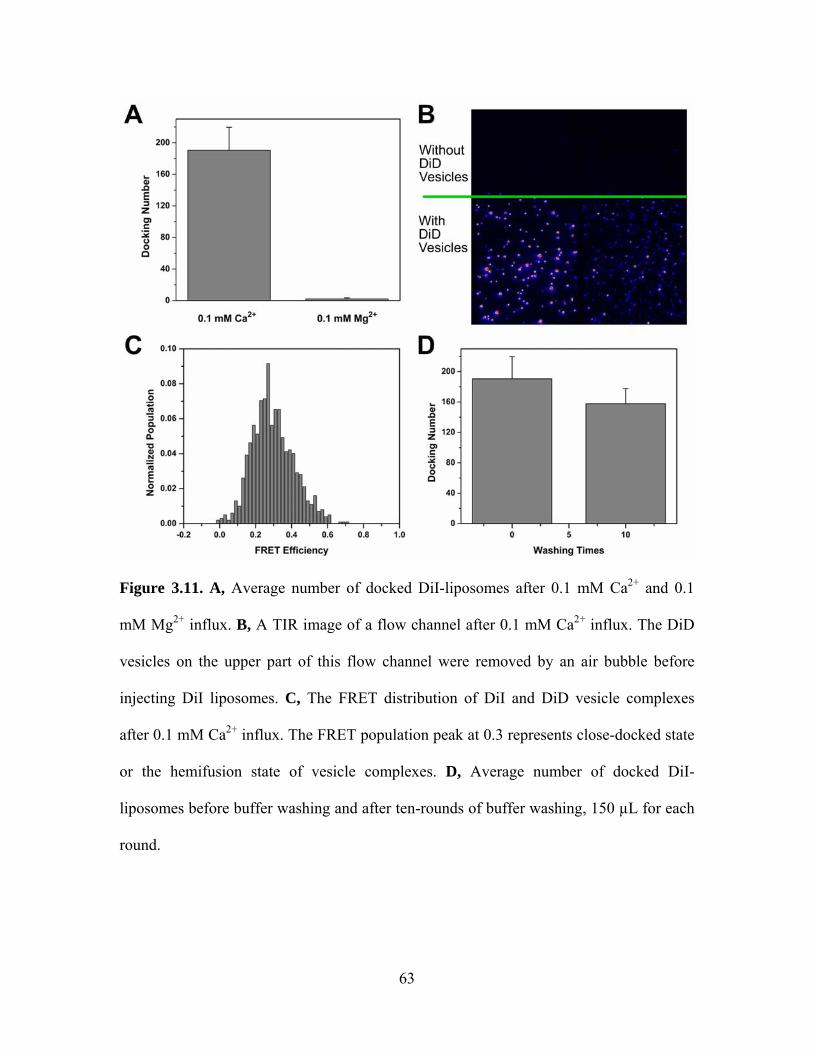
Figure 3.11. A, Average number of docked DiI-liposomes after 0.1 mM Ca2+ and 0.1
mM Mg2+ influx. B, A TIR image of a flow channel after 0.1 mM Ca2+ influx. The DiD
vesicles on the upper part of this flow channel were removed by an air bubble before
injecting DiI liposomes. C, The FRET distribution of DiI and DiD vesicle complexes
after 0.1 mM Ca2+ influx. The FRET population peak at 0.3 represents close-docked state
or the hemifusion state of vesicle complexes. D, Average number of docked DiI-
liposomes before buffer washing and after ten-rounds of buffer washing, 150 µL for each
round.
63

Figure 3.12. A, A real-time fluorescent trace of donor (DiI) channel, averaged over all
liposomes, upon the arrival of Ca2+ influx. B, TIR images for both donor and acceptor
channels of the same trace shown in part A at different times. For more information, see
the movie in supporting materials.
64
CHAPTER 4
CONTENT MIXING
4.1 Motivation
The lipid mixing method developed in our lab has been shown as a useful technique
through revealing the vesicle aggregation induced by C2AB/Ca2+, a dual function of
complexin, and the role of Munc18/SNARE-core binding mode [34,39,49]. This method
clearly shows the fusion process by observing the mixing of two lipid bilayers. Despite
the success with assays based on lipid-mixing, they cannot directly detect the content
release, which is one of the most rigorous definitions of membrane fusion [94]. Cellular
studies showed that the content release can proceed in two pathways, kiss-and-run, where
a small fusion pore opens transiently upon docking of an incoming vesicle, but closes
again as the vesicle ‘runs’ away, and the full-collapse fusion pathway, where the small
opening of the pore continues to expand to a large pore [95,96]. Unfortunately, both
current ensemble and single-vesicle lipid mixing assays are blind to the fusion pore
formation and expansion and, therefore, unable to tell how the regulatory proteins are
involved in this critical step.
There is a general assumption that the extent of lipid mixing between vesicles is
directly proportional to the extent of the content release. However, a recent study on
DNA-mediated vesicle fusion showed that high efficient lipid mixing (up to 80%) of both
inner and outer leaflets can occur without mixing of content (less than 2%) [97]. A
similar phenomena was observed with PEG-mediated membrane fusion [98]. These
65
studies suggest that lipid mixing is necessary for fusion, but lipid mixing alone is an
insufficient indicator for content mixing.
The original in vitro reconstruction of SNARE-induced membrane fusion used 33P-
labeled oligonucleotides and led to the conclusion that SNARE proteins constitute the
minimal machinery for membrane fusion [99]. However in that study, because the
content mixing signal was indirectly measured after vesicles were lysed by the detergent,
their result could not clearly separate fusion from vesicle docking and aggregation. Other
attempts of using small reporters, such as carboxyfluorescein, for the content mixing
studies have mainly failed due to the membrane leakiness after the SNARE protein
reconstitution at a physiological protein to lipid ratio (> 1:500) [98], unless a very low
protein and lipid ratio (< 1:1000) was used [100,101].
Thus, the formation of fusion pore, as well as the key factor of pore expansion,
remains to be confirmed by a new content mixing method. We have developed a reliable
and efficient single-vesicle content mixing assay for SNARE-mediated membrane fusion.
The main advantage of single-molecule experiments is that they allow us to study the
behaviour of a single or countable number of molecules. The observation of individual
events allows us to perform statistical analysis of a population of individual trajectories
that is not possible in bulk because of ensemble averaging [55,56,94].
4.2 Experimental design
To detect large fusion pores, with the inspiration from molecular beacons [102], we
designed a DNA hairpin composed of five base-pairs stem and poly-thymidine loop (T20)
labeled with a donor (Cy3) and an acceptor (Cy5) fluorophores at either ends of the stem
66
(Figure 4.1A). When the loop region of this Cy3/Cy5 dual-labeled DNA probe hybridize
with a second DNA strand having a complementary sequence (A30), the formation of a
longer double strand breaks apart the stem region, which moves apart the donor and the
acceptor fluorophores from one another. As a result of this distance change, the FRET
efficiency (E) switches from a high to a low value (Figure 4.1B and 4.1C). Dual-labeled
DNA and the complementary poly-adenosine (poly-A) strands are encapsulated inside
proteoliposomes reconstituted with vesicle SNARE (v-SNARE) and target membrane
SNARE (t-SNARE), respectively, and the FRET signal is used to monitor the extent of
the SNARE-mediated content mixing.
Because many earlier attempts suffered from probe leakage, we first tested the
stability of our dual-labeled DNA probe inside the vesicle. Dual-labeled DNA probe
encapsulated vesicles reconstituted with yeast v-SNARE protein (Snc2p) (1:200 protein
to lipid ratio) were immobilized on the polymer-coated imaging surface. Non-specific
binding of dual-labeled DNA probes outside the vesicle was prevented by the PEG
molecule coating flow cell surface, and these DNA molecules were washed away with
excess buffer (Figure 4.2A). Single molecule fluorescence signals from DNA molecules
in individual vesicles were collected and plotted as a histogram showing a distinct high E
as expected (Figure 4.3A left). In order to verify that these probes were inside the vesicle,
Deoxyribonuclease I (DNase) was added to the system. The number of molecules
showing the high FRET signal before and after the treatment did not show a significant
difference (Figure 4.3A) and no shift of the FRET distribution was observed. This shows
that DNA probes are inside vesicles and are protected by lipid bilayer from DNase
digestion. In contrast, DNase treatment effectively eliminated DNA probes unprotected
67
by vesicles (Figure 4.3B). These DNA probes did not leak out of vesicles over the course
of 60 minutes (Figure 4.3C), and showed stable high FRET distribution at 37 oC
incubation as well as in the presence of free poly-A DNA outside the vesicles (Figure
4.2B). These control experiments show that Cy3/Cy5 dual-labeled DNA probe could be
used as a reliable content mixing indicator [103].
A reliable and an efficient content-mixing assay based on the FRET switch caused
by the DNA hybridization has been developed at the single vesicle level. The DNA
hairpin probe used is thirty nucleotides long with a molecular weight of ~11 kD, whereas
most neurotransmitters are much smaller (~0.1 kD). A transient opening of fusion pores
allows passage of small molecules, but the larger molecular weight probes used here may
be difficult to pass. Our assay is most likely to report the content mixing resulting from
the stably expanded pore that results from the complete collapse of vesicle membranes.
4.2.1 Content probe size simulation
In order to estimate the minimal required fusion pore size, we performed a
Molecular Dynamics (MD) simulation to calculate the radius of gyration of both
Cy3/Cy5 dual-labeled DNA hairpin and unlabeled target DNA in equilibrium condition.
The average Rg over the last 25 ns of simulation for DNA hairpin is 1.91 ± 0.53 nm,
while 1.80 ± 0.28 nm for target DNA (Figure 4.4). We conclude that the radius of the
pore has to be ~2 nm for either DNA to pass through. In principle, the single-stranded
DNA can go through a narrow pore with a large Rg as in the case of stretched out.
However, in our case, it is unlikely for the unlabeled target DNA to adopt such extended
configuration without external force if one considers its high flexibility.
68
For a general membrane fusion process, the outer monolayer of a phospholipid
vesicle coalesces with the contacting monolayer of the planar phospholipid bilayer
membrane forming a trilaminar structure (hemifusion). A small fusion pore is formed in
this area. Once formed, the fusion pore can close again or expand to some critical size
when further expansion becomes irreversible [104]. For the critical size of pore, as
estimated by Jackson, the lipidic fusion pore has an energy minimum at a radius of ~0.5
nm [105,106]. Since the minimal fusion pore size (2 nm radius) to pass through our
content-mixing indicator is much larger than this critical size, fusion pore expansion, the
very late step of membrane fusion, is most likely reported through this assay.
4.3 Study on yeast SNARE
[Related publication: Diao, J., Su, Z., Ishitsuka, Y., Lu, B., Lee, K.S., Lai, Y., Shin, Y.-K.
& Ha, T. A single vesicle content mixing assay for SNARE-mediated membrane fusion.
Nat. Commun. 1, 54 (2010).]
We first applied our content mixing assay to the yeast SNAREs (Sso1p, Snc2p and
Sec9c) that mediate constitutive fusion of transport vesicles to the plasma membrane
[107]. Figure 4.5A shows the basic scheme of our assay. The v-SNARE vesicles, with
Snc2p in the membrane and DNA hairpin encapsulated inside, are immobilized on a
polymer-coated quartz surface via biotinylated lipids [61]. The t-SNARE vesicles
containing Sso1pHT and harboring multiple poly-A DNAs with a cholesterol
modification are added together with soluble Sec9c (1 μM), and the sample is incubated
at 37 oC. The average number of dual-labeled DNA probes inside the v-SNARE vesicle
quantified from the number of photobleaching steps is ~0.4 (Figure 4.6). Cholesterol
69
modification increases the incorporation efficiency of poly-A DNA in the t-SNARE
vesicle membrane, thus increasing the probability of two vesicles with DNA probes to
react (Figure 4.7). When two vesicles, both ~100 nm in diameter, dock and a large
enough fusion pore forms between them, the two DNA molecules should hybridize to
switch the FRET efficiency (E) between Cy3 and Cy5 from a high (Figure 4.3A) to a low
value (Figure 4.1C).
Figure 4.5B and 4.5C show actual E distributions before and after addition of t-
SNARE vesicle/Sec9c to the flow cell and incubated for 30 minutes at 37 oC. The E
distribution measured from thousands of single DNA hairpin probes clearly switched
from ~0.8 to ~0.2 (Figure 4.5B and 4.5C). We repeated the same experiment using DNA
without the cholesterol link to the target DNA and observed a similar shift in the E
distribution, but with a reduced extent of FRET population shift due to a lower DNA
encapsulation efficiency (Figure 4.7). To further ensure that the DNA hybridizations are
taking place inside vesicles, the sample was treated with DNase after the fusion reaction.
The E distribution remained the same and the average number of fluorescent spots did not
decrease, indicating that all observed signals came from DNA probes inside vesicles
(Figure 4.8A).
The formation of these stable pores was not caused by the surface immobilization
step. We verified this by first performing the fusion reaction in bulk solution, and then
immobilizing the product onto the surface. As shown in Figure 4.8B, the major low
FRET peak from DNA hybridization was observed as in the standard experimental
scheme. This FRET shift was driven in the DNA sequence dependent manner - and not
by protein or vesicle aggregation - for when we replaced target poly-A DNAs in t-
70
vesicles with non-complementary poly-T DNAs, no FRET switch was observed under the
same reaction condition on the surface (Figure 4.8C).
4.3.1 Real time content mixing
Through our single vesicle content mixing assay, we can also monitor single content
mixing event in real-time. For this experiment, we switched the surface immobilization
configuration. t-vesicles with the target DNAs are surface immobilized and v-vesicles
containing FRET beacons are flown into the solution. To eliminate DNA molecules
outside vesicles, DNase I treatment was applied before reactions. A typical real-time
content-mixing time traces are shown in Figure 4.9. Upper panel shows fluorescence
intensities, green curve representing the donor and red curve representing the acceptor
intensity. The lower panel shows the corresponding FRET efficiency in blue. Initially, the
surface immobilized vesicles containing unlabeled target DNAs shows no donor and
acceptor signals. Upon binding of the v-vesicle with FRET beacon is seen as a sudden
appearance of the fluorescence signal associating to a high FRET value. After a certain
time, DNA hybridization caused by content mixing decreases FRET value to ~0.2.
4.3.2 Yeast SNAREs are sufficient to induce content mixing.
The E shift we observed with our content mixing assay is SNARE dependent. A
control experiment without Sec9c showed no change in E, while lowering the Sec9c
concentration (0.1 μM) reduced the vesicle population with expanded pores (Figure
4.10A). Interestingly, 0.1 μM Sec9c, corresponding to ~2:1 Sec9/Sso1 ratio, showed a
much lower degree of content mixing than lipid mixing [61]. This seems to suggest that
71
in some instances, lipid mixing could progress without formation of stable pores across
the membrane. A time course study showed a progressive shift from E~0.8 population to
E~0.2 population over 30 minutes (Figure 4.10B).
Two helices of Sec9c both contribute in formation of the four-helix bundle
necessary for membrane fusion, but play slightly different roles. The N-terminal helix
(SN1) plays more dominant role in the initial docking of the vesicle, while the C-terminal
helix (SN2) drives the membrane lipid mixing [108]. Helix-breaking proline mutations
(L626P, L647P) on SN2 helix showed significantly stronger inhibitory effect on the lipid
mixing efficiency in comparison to the docking efficiency, but their effect on pore
formation has been unclear [108]. We also tested these mutants using our content mixing
assay and found a similar inhibitory effect on the pore formation efficiency (Figure 4.9C).
The proline mutation close to the C-terminal end of the helix (L647P) showed a stronger
inhibitory effect than what the L626P mutant did on both lipid and content mixing
supporting that complete engagement of SN2 helix in the SNARE complex is necessary
for completing membrane fusion.
4.3.3 Conclusion
Yeast SNARE proteins has been known to induce efficient and rapid lipid mixing
[109]. Our results further show that yeast SNARE proteins are necessary and sufficient
for expansion of the fusion pore.
4.4 Study on neuronal SNARE
72
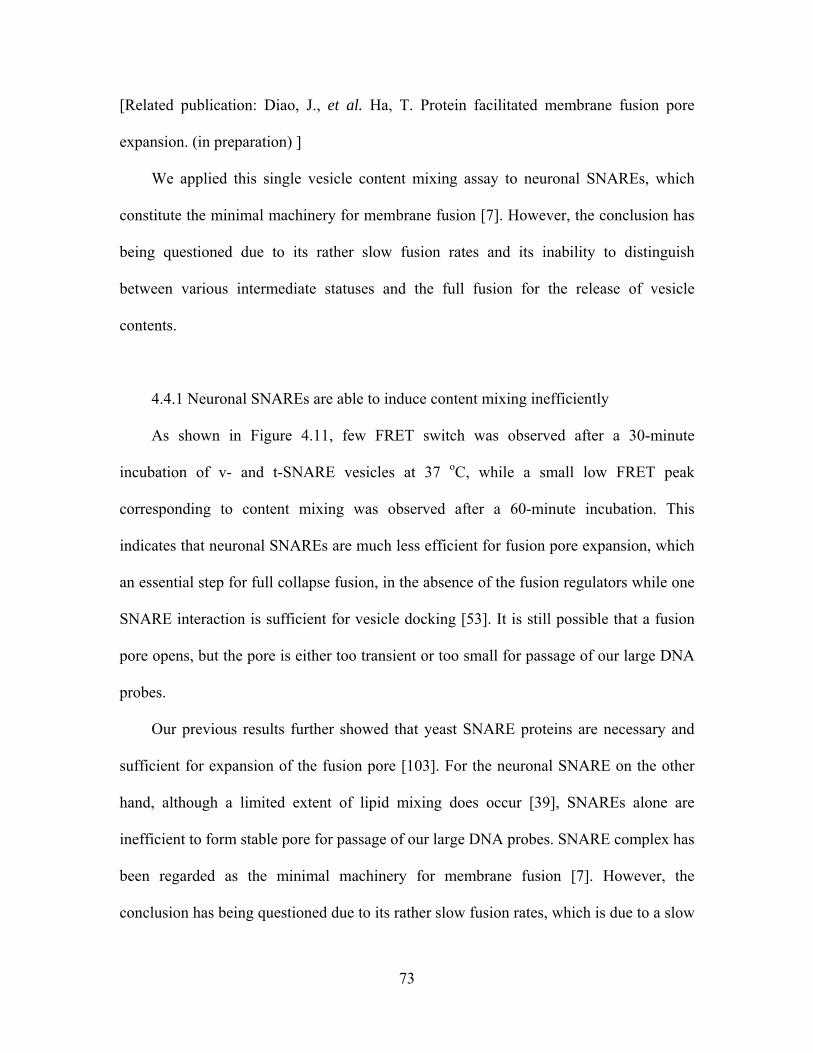
[Related publication: Diao, J., et al. Ha, T. Protein facilitated membrane fusion pore
expansion. (in preparation) ]
We applied this single vesicle content mixing assay to neuronal SNAREs, which
constitute the minimal machinery for membrane fusion [7]. However, the conclusion has
being questioned due to its rather slow fusion rates and its inability to distinguish
between various intermediate statuses and the full fusion for the release of vesicle
contents.
4.4.1 Neuronal SNAREs are able to induce content mixing inefficiently
As shown in Figure 4.11, few FRET switch was observed after a 30-minute
incubation of v- and t-SNARE vesicles at 37 oC, while a small low FRET peak
corresponding to content mixing was observed after a 60-minute incubation. This
indicates that neuronal SNAREs are much less efficient for fusion pore expansion, which
an essential step for full collapse fusion, in the absence of the fusion regulators while one
SNARE interaction is sufficient for vesicle docking [53]. It is still possible that a fusion
pore opens, but the pore is either too transient or too small for passage of our large DNA
probes.
Our previous results further showed that yeast SNARE proteins are necessary and
sufficient for expansion of the fusion pore [103]. For the neuronal SNARE on the other
hand, although a limited extent of lipid mixing does occur [39], SNAREs alone are
inefficient to form stable pore for passage of our large DNA probes. SNARE complex has
been regarded as the minimal machinery for membrane fusion [7]. However, the
conclusion has being questioned due to its rather slow fusion rates, which is due to a slow
73
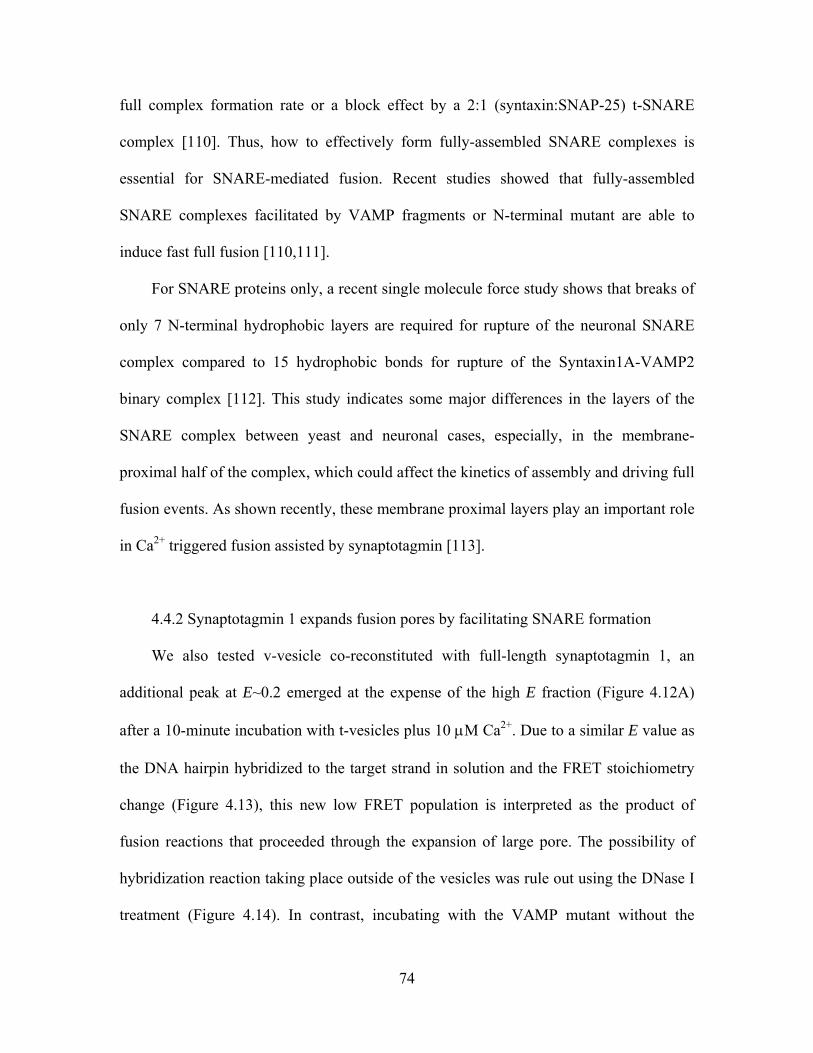
full complex formation rate or a block effect by a 2:1 (syntaxin:SNAP-25) t-SNARE
complex [110]. Thus, how to effectively form fully-assembled SNARE complexes is
essential for SNARE-mediated fusion. Recent studies showed that fully-assembled
SNARE complexes facilitated by VAMP fragments or N-terminal mutant are able to
induce fast full fusion [110,111].
For SNARE proteins only, a recent single molecule force study shows that breaks of
only 7 N-terminal hydrophobic layers are required for rupture of the neuronal SNARE
complex compared to 15 hydrophobic bonds for rupture of the Syntaxin1A-VAMP2
binary complex [112]. This study indicates some major differences in the layers of the
SNARE complex between yeast and neuronal cases, especially, in the membrane-
proximal half of the complex, which could affect the kinetics of assembly and driving full
fusion events. As shown recently, these membrane proximal layers play an important role
in Ca2+ triggered fusion assisted by synaptotagmin [113].
4.4.2 Synaptotagmin 1 expands fusion pores by facilitating SNARE formation
We also tested v-vesicle co-reconstituted with full-length synaptotagmin 1, an
additional peak at E~0.2 emerged at the expense of the high E fraction (Figure 4.12A)
after a 10-minute incubation with t-vesicles plus 10 μM Ca2+. Due to a similar E value as
the DNA hairpin hybridized to the target strand in solution and the FRET stoichiometry
change (Figure 4.13), this new low FRET population is interpreted as the product of
fusion reactions that proceeded through the expansion of large pore. The possibility of
hybridization reaction taking place outside of the vesicles was rule out using the DNase I
treatment (Figure 4.14). In contrast, incubating with the VAMP mutant without the
74

transmembrane region (6 μM, amino acids 1-92) or omitting synaptotagmin 1, during the
SNARE complex formation step significantly inhibited the increase in the low E fraction
(Figure 4.12B). A reduced low E fraction was observed when we removed Ca2+ ions
(Figure 4.12A).
Most recently, using a single-vesicle lipid mixing assay, H.-K. Lee et al. showed
that the membrane anchor synaptotagmin 1 and Ca2+ induce fast fusion through a trans-
conformer [114], which is the first in vitro study showing the fusion promotion from full-
length synaptotagmin 1 plus Ca2+. In vivo, the neurotransmitter release happens in the
submillisecond time scale and is induced by calcium with synaptotagmin 1 being the
calcium sensor. However, in vitro experimental results with full-length synaptotagmin 1
showed a Ca2+-independent promoted effect, while adding Ca2+ ions inhibits vesicle
fusion [29,32]. Furthermore, recent studies using native synaptic vesicles from the rat
brain showed that the final step in fusion is calcium independent even though the synaptic
vesicles contained endogenous synaptotagmin 1 [33]. Here, through our new single-
vesicle content mixing assay, we confirm that the fusion induced by synaptotagmin 1 and
Ca2+ by a trans-conformer is also associating with mixing of large contents, which is a
sign of expanded fusion pore. This observation agrees with previous in vivo studies
showing that synaptotagmin 1 promotes full fusion while synaptotagmin 4 stimulates
kiss-and-run events [115].
We observed some pore expansion processed by synaptotagmin 1 in the absence of
calcium, which also agrees with previous in vitro studies for full-length synaptotagmin 1
[29,32,33]. Since fully-assembled SNARE complexes are able to induce fast full fusion
[110] and synatotagmin 1 promotes SNARE complex formation through a Ca2+-
75

independent interaction with t-SNAREs [116,117,118,119], we conclude that
synaptotagmin 1 expands fusion pores by promoting SNARE complex formation. Ca2+
ions dramatically accelerate this interaction into a synchronized manner through a
structure reformation [120,121]. By using SNARE proteins purified directly from the
bovine brain, Rickman et al. also showed that synaptotagmin 1 binds to the SNARE
complex in a calcium-independent manner [122]. Through Electron paramagnetic
resonance (EPR), the Ca2+-independent interaction between synaptotagmin and SNARE
(Figure 4.15) is confirmed. Because of the Ca2+-independent interaction, the
synaptotagmin 1 binding blocked by complexin in the absence of Ca2+ is essential for the
synchronized fusion process [37]. Furthermore, a doubled content mixing observed in the
presence of Ca2+ ions (Figure 4.12A) also implies an additional fusion promotion by
Ca2+-bound synaptotagmin 1, for instance, membrane bending [30,123] or adhering
[29,93].
4.4.3 Conclusion
Based on our content mixing current results presented in this paper, we suggest that
synaptotagmin 1 expands fusion pore by facilitating SNARE complex formation.
Calcium ions are important to synchronize the pore opening events by accelerating the
synaptotagmin-facilitated SNARE complex formation.
76
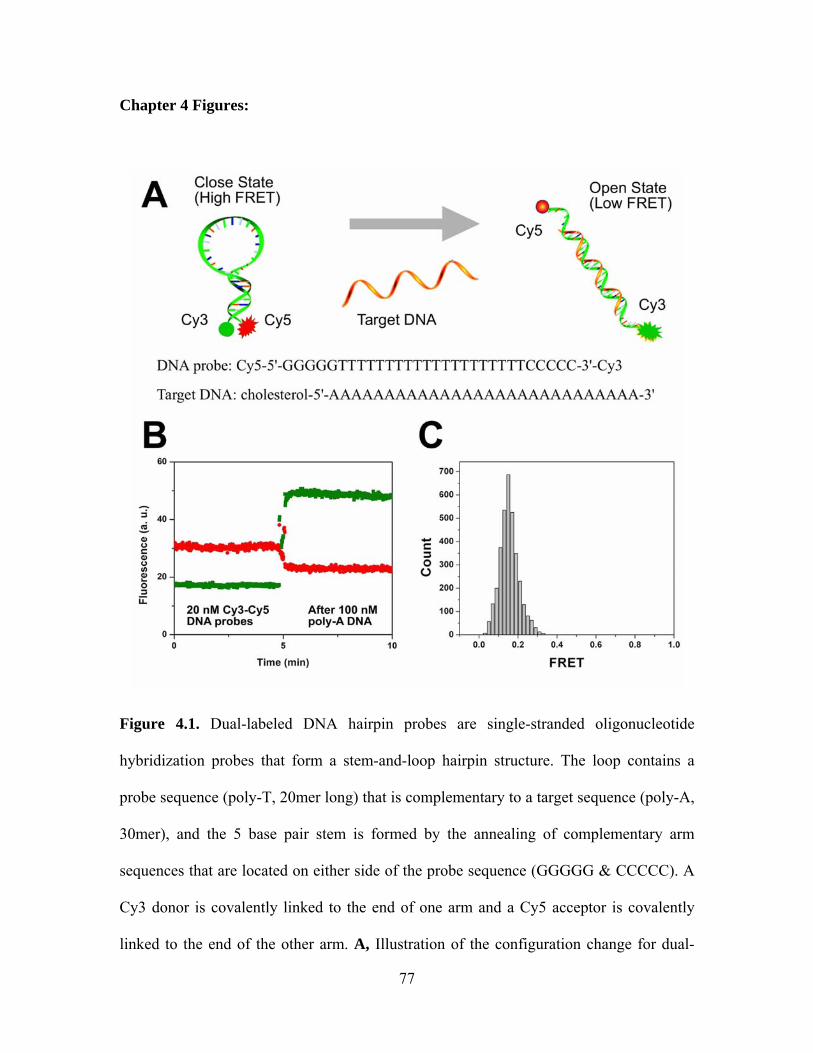
Chapter 4 Figures:
Figure 4.1. Dual-labeled DNA hairpin probes are single-stranded oligonucleotide
hybridization probes that form a stem-and-loop hairpin structure. The loop contains a
probe sequence (poly-T, 20mer long) that is complementary to a target sequence (poly-A,
30mer), and the 5 base pair stem is formed by the annealing of complementary arm
sequences that are located on either side of the probe sequence (GGGGG & CCCCC). A
Cy3 donor is covalently linked to the end of one arm and a Cy5 acceptor is covalently
linked to the end of the other arm. A, Illustration of the configuration change for dual-
77
labeled DNA probes. B, Ensemble fluorescent trace for Cy3 (green) and Cy5 (red)
channels of dual-label DNA probes before and after hybridization obtained in a cuvette
via manual addition of the probe strand at 5th minute. C, The FRET efficiency, E
distribution obtained outside vesicles with poly-A targets inserted into the membrane via
the cholesterol link and externally added dual-labeled DNA hairpin probes. The peak at E
= 0.15 corresponds to the DNA hairpin annealed to the target DNA.
78

Figure 4.2. A, 532 nm laser excited images of experimental channels after 160 pM v-
vesicles with DNA probes or 2 nM free DNA probes. Lower panel only shows dim spots
in the donor and acceptor channels, demonstrating that the nonspecific adhesion of the
free DNA probes to the surface is minimal. B, E distributions of v-vesicles at room
temperature, at 37 oC, and after incubating with 2 μM poly-A DNA at 37 oC for 30
minutes. Vesicle encapsulated DNA probes are not sensitive to either temperature or free
target DNA in solution. Scale bars are for 25 µm.
79

Figure 4.3. Stable encapsulation of DNA probes inside SNARE protein reconstituted
vesicles. A, Histograms of FRET efficiency, E, (left) and average numbers (right) of
molecules per imaging area (25 μm X 50 μm) before and after a DNase treatment of
DNA probes encapsulated inside surface immobilized v-SNARE (protein:lipid = 1:200)
vesicles. For histograms of FRET efficiency, Y-axis is normalized population, where we
divided the distribution by the total number of vesicles measured and X-axis is FRET
efficiency value. B, Average count of molecules per imaging area before and after a
80
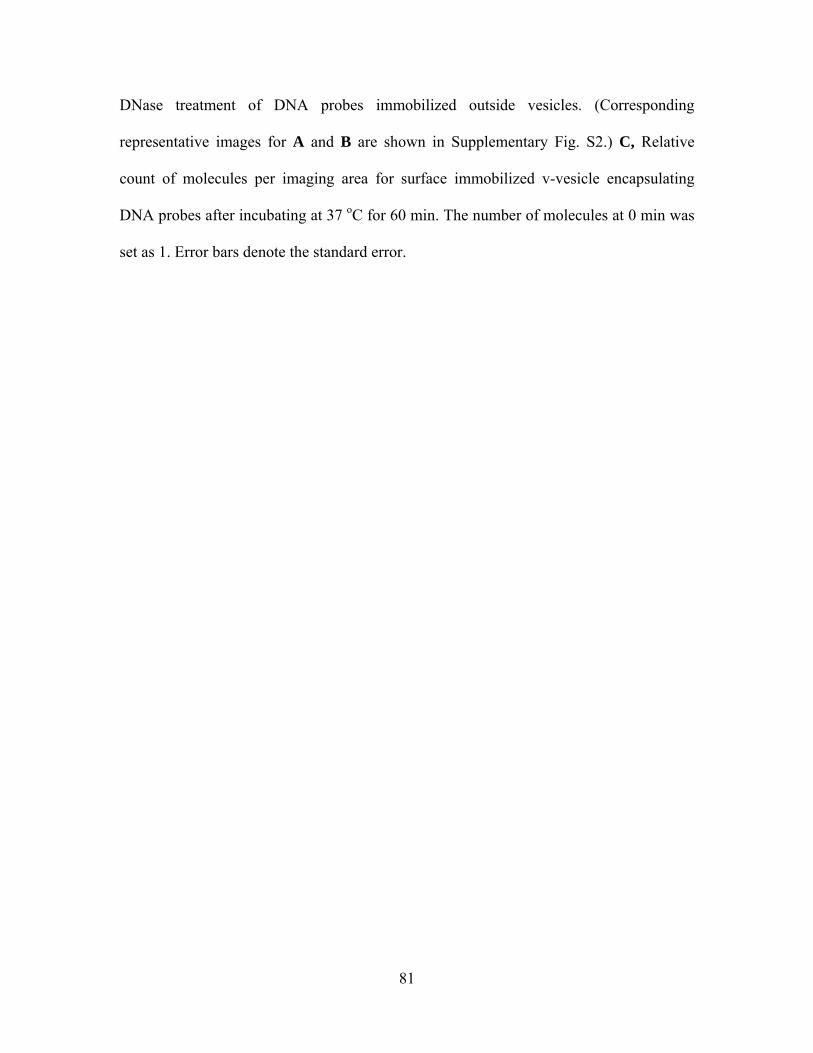
DNase treatment of DNA probes immobilized outside vesicles. (Corresponding
representative images for A and B are shown in Supplementary Fig. S2.) C, Relative
count of molecules per imaging area for surface immobilized v-vesicle encapsulating
DNA probes after incubating at 37 oC for 60 min. The number of molecules at 0 min was
set as 1. Error bars denote the standard error.
81
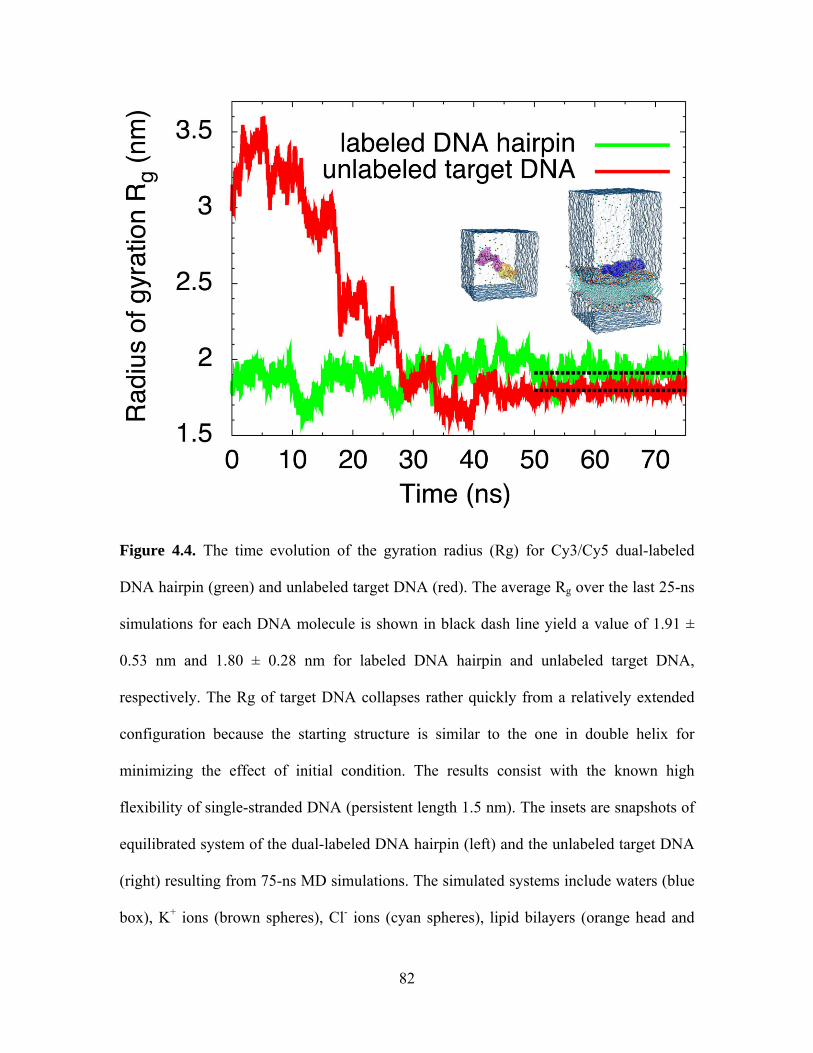
Figure 4.4. The time evolution of the gyration radius (Rg) for Cy3/Cy5 dual-labeled
DNA hairpin (green) and unlabeled target DNA (red). The average Rg over the last 25-ns
simulations for each DNA molecule is shown in black dash line yield a value of 1.91 ±
0.53 nm and 1.80 ± 0.28 nm for labeled DNA hairpin and unlabeled target DNA,
respectively. The Rg of target DNA collapses rather quickly from a relatively extended
configuration because the starting structure is similar to the one in double helix for
minimizing the effect of initial condition. The results consist with the known high
flexibility of single-stranded DNA (persistent length 1.5 nm). The insets are snapshots of
equilibrated system of the dual-labeled DNA hairpin (left) and the unlabeled target DNA
(right) resulting from 75-ns MD simulations. The simulated systems include waters (blue
box), K+ ions (brown spheres), Cl- ions (cyan spheres), lipid bilayers (orange head and
82
cyan tails) and DNA molecules colored by type of nucleotide (yellow: G, orange: C,
purple: T, blue: A). The water boxes have a dimension of 89 Å × 89 Å × 89 Å and 100 Å
× 100 Å × 186 Å for the dual-labeled DNA hairpin and the unlabeled target DNA,
respectively.
83
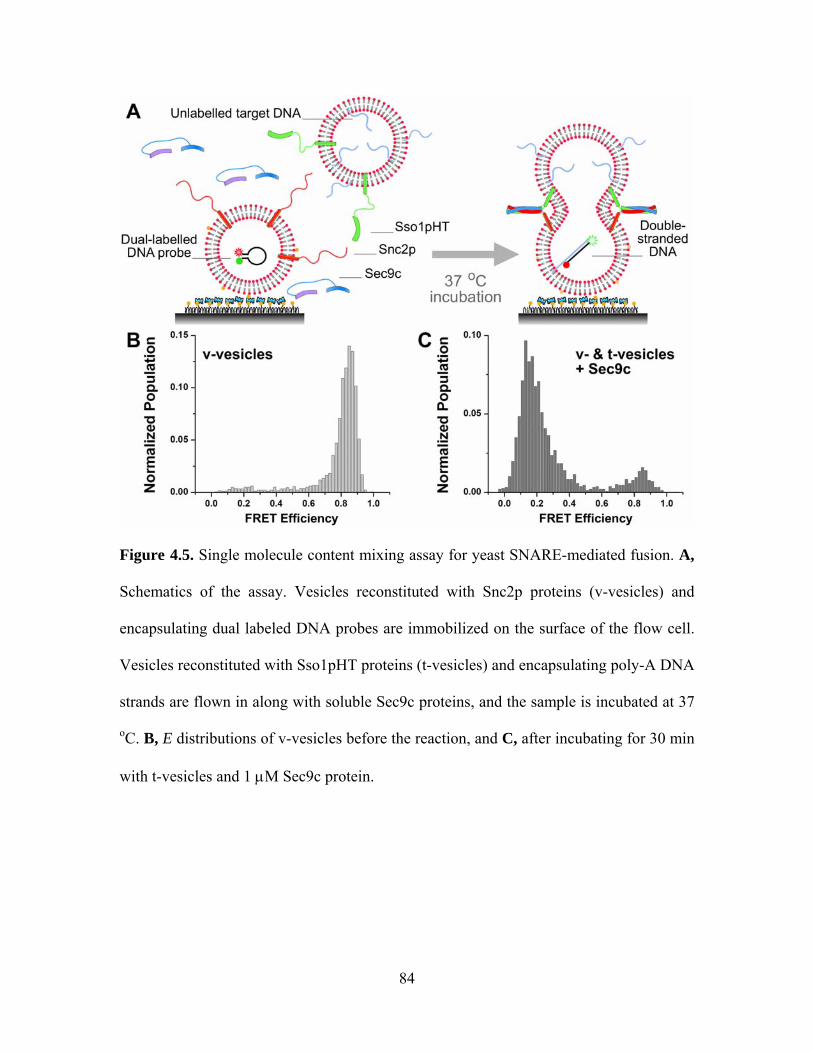
Figure 4.5. Single molecule content mixing assay for yeast SNARE-mediated fusion. A,
Schematics of the assay. Vesicles reconstituted with Snc2p proteins (v-vesicles) and
encapsulating dual labeled DNA probes are immobilized on the surface of the flow cell.
Vesicles reconstituted with Sso1pHT proteins (t-vesicles) and encapsulating poly-A DNA
strands are flown in along with soluble Sec9c proteins, and the sample is incubated at 37
oC. B, E distributions of v-vesicles before the reaction, and C, after incubating for 30 min
with t-vesicles and 1 μM Sec9c protein.
84

Figure. 4.6. Single-molecule analysis of encapsulated DNA after protein reconstitution.
A, The distribution of the number of molecules inside a vesicle. Solid bars are
experimental results. Red dots indicate the Poisson fitting, by which we obtain the bar
represents 0 molecule. Based on that, we estimate that the average number of DNA
probes inside a vesicle is ~0.4. B, Representative time records for two vesicles. The
number of encapsulated DNA molecules can be determined by counting the digital
photobleaching events. In the upper trace, the Cy5 intensity reduces to its background
level in two discrete steps, which implies that there are two molecules entrapped within
this vesicle, whereas in the lower trace photobleaching occurs in a single step, indicating
occupancy by a single DNA molecule.
85

Figure 4.7. Yeast SNARE content mixing: E distributions of yeast SNARE-mediated
fusion products for t-vesicles containing free poly-A DNA and fixed poly-A DNA
through a cholesterol molecule. The distinction of low FRET peak change is due to the
difference on DNA encapsulation rate. Cholesterol linked target DNA dramatically
increases the degree of content mixing.
86
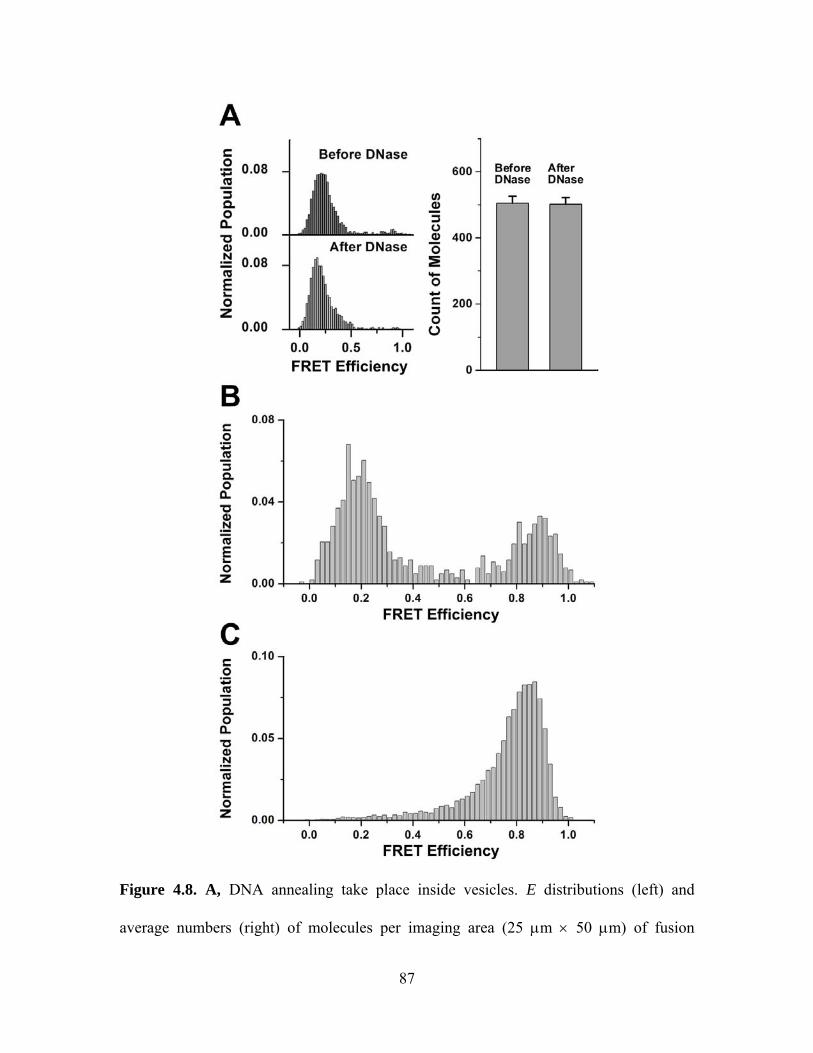
Figure 4.8. A, DNA annealing take place inside vesicles. E distributions (left) and
average numbers (right) of molecules per imaging area (25 μm × 50 μm) of fusion
87
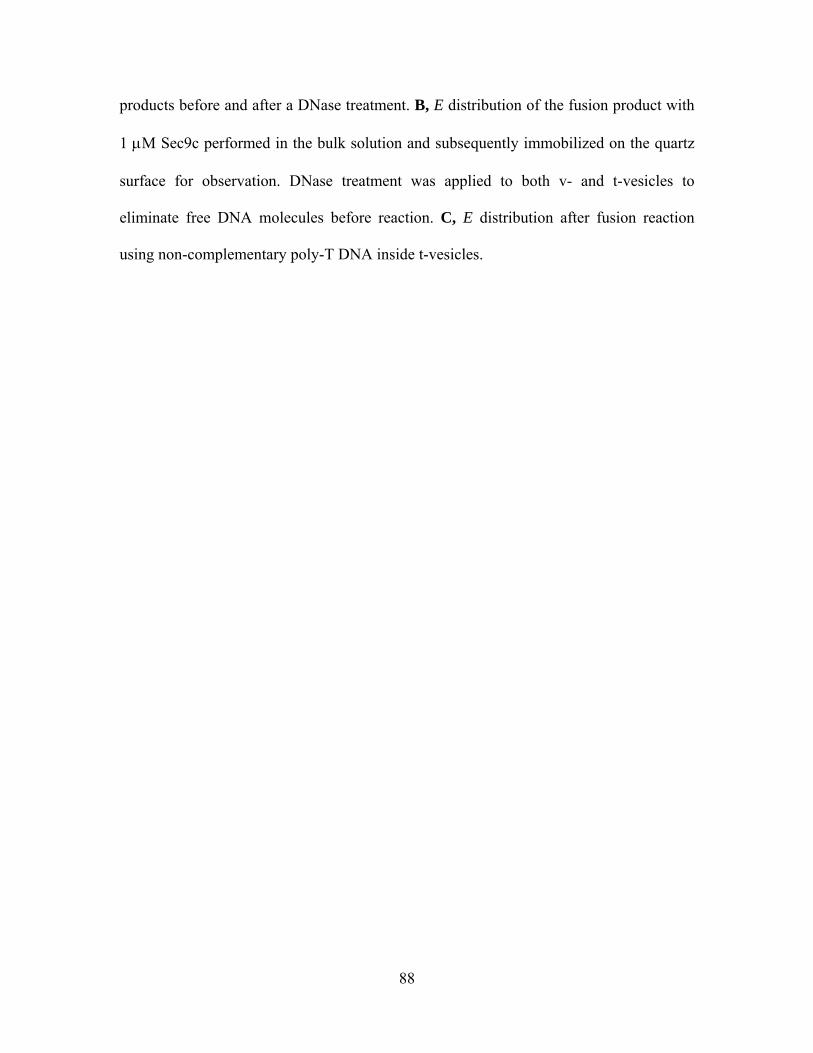
products before and after a DNase treatment. B, E distribution of the fusion product with
1 μM Sec9c performed in the bulk solution and subsequently immobilized on the quartz
surface for observation. DNase treatment was applied to both v- and t-vesicles to
eliminate free DNA molecules before reaction. C, E distribution after fusion reaction
using non-complementary poly-T DNA inside t-vesicles.
88
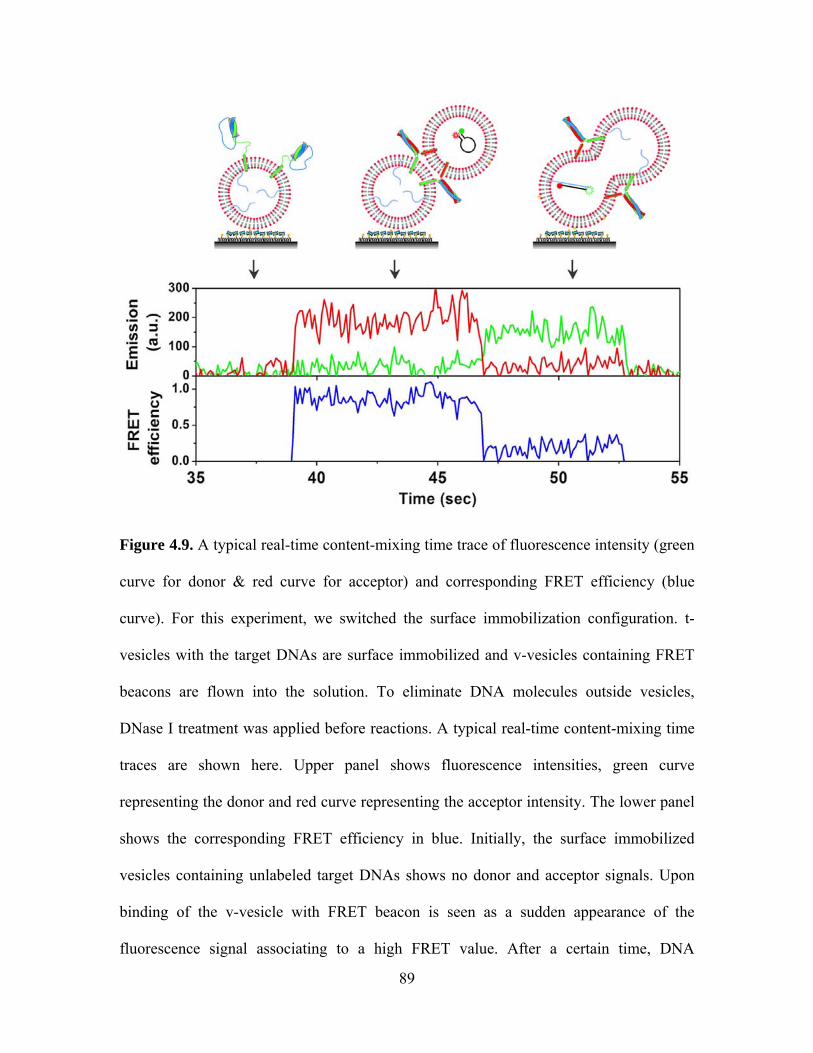
Figure 4.9. A typical real-time content-mixing time trace of fluorescence intensity (green
curve for donor & red curve for acceptor) and corresponding FRET efficiency (blue
curve). For this experiment, we switched the surface immobilization configuration. t-
vesicles with the target DNAs are surface immobilized and v-vesicles containing FRET
beacons are flown into the solution. To eliminate DNA molecules outside vesicles,
DNase I treatment was applied before reactions. A typical real-time content-mixing time
traces are shown here. Upper panel shows fluorescence intensities, green curve
representing the donor and red curve representing the acceptor intensity. The lower panel
shows the corresponding FRET efficiency in blue. Initially, the surface immobilized
vesicles containing unlabeled target DNAs shows no donor and acceptor signals. Upon
binding of the v-vesicle with FRET beacon is seen as a sudden appearance of the
fluorescence signal associating to a high FRET value. After a certain time, DNA
89

hybridization caused by content mixing decreases FRET value to ~0.2. The dwell time in
the high FRET state is designated as the fusion time.
90

Figure 4.10. A, E distributions of fusion products for different Sec9c concentrations. B,
E distributions of yeast SNARE-mediated fusion with different incubation times ranging
from 0 min to 30 min with 1 μM Sec9c. C, Pore expansion efficiency quantified by low
FRET peak (E = 0-0.4) percentage for wild type and mutant Sec9c, L626P and L646P. 1
μM Sec9c and its mutants were used. Error bars denote the standard deviation of three
independent experiments. 30 min incubation at 37 oC was applied for all experiments in A
and C.
91
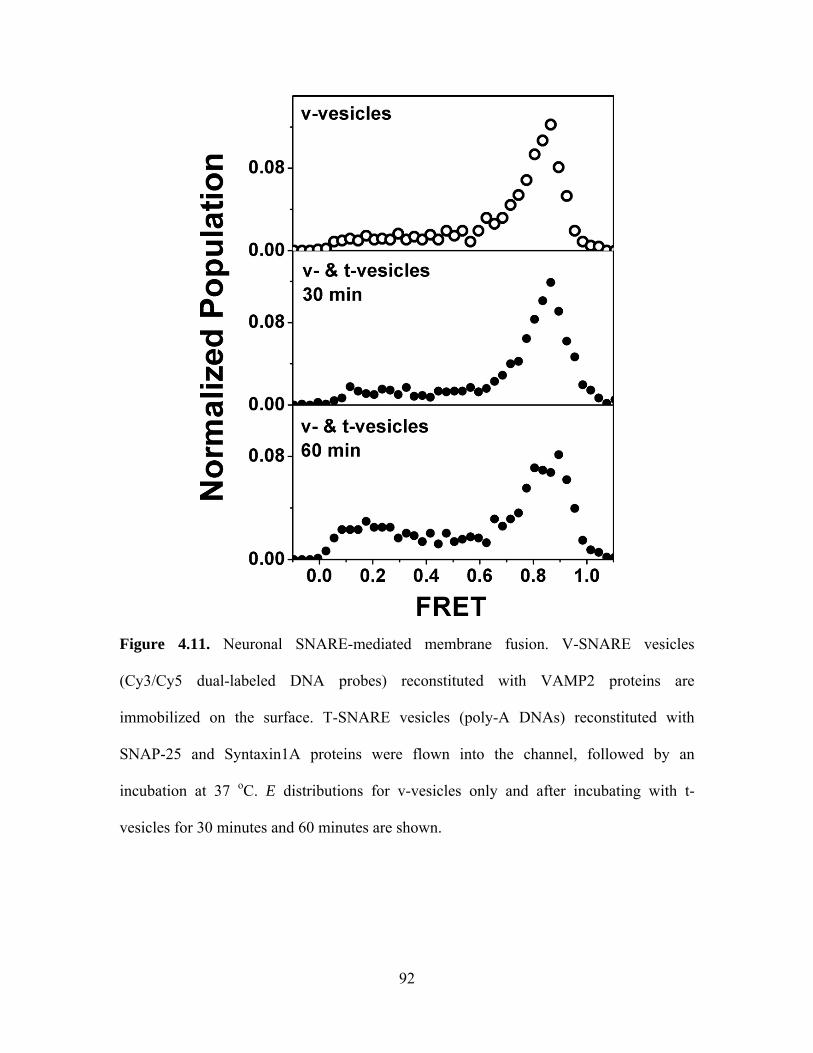
Figure 4.11. Neuronal SNARE-mediated membrane fusion. V-SNARE vesicles
(Cy3/Cy5 dual-labeled DNA probes) reconstituted with VAMP2 proteins are
immobilized on the surface. T-SNARE vesicles (poly-A DNAs) reconstituted with
SNAP-25 and Syntaxin1A proteins were flown into the channel, followed by an
incubation at 37 oC. E distributions for v-vesicles only and after incubating with t-
vesicles for 30 minutes and 60 minutes are shown.
92

Figure 4.12. Synaptotagmin expands fusion pore by helping SNARE complex formation.
A, E distributions of v-vesicles with synaptotagmin before the reaction, after incubating
with t-vesicles, and after incubating with t-vesicles plus 10 μM Ca2+. B, E distributions of
93

v-vesicles incubating with t-vesicles plus 10 μM Ca2+, and v-vesicles with synaptotagmin
incubating with t-vesicles, 10 μM Ca2+, and soluble VAMP2.
94
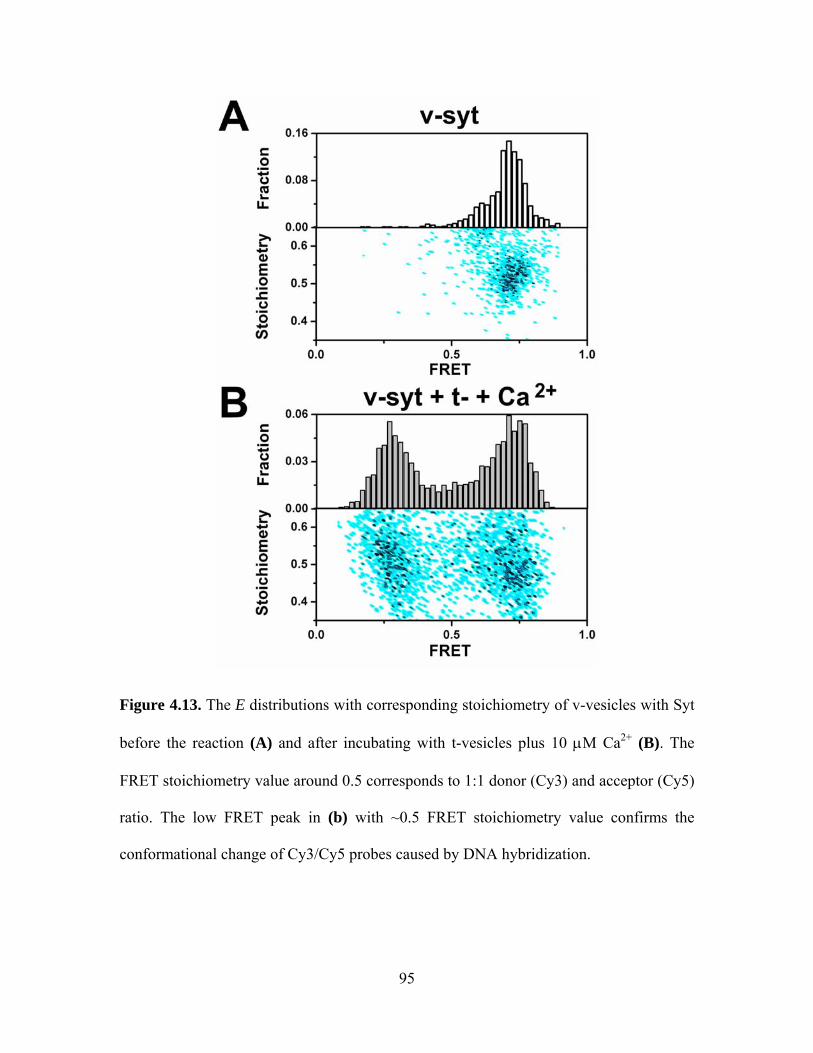
Figure 4.13. The E distributions with corresponding stoichiometry of v-vesicles with Syt
before the reaction (A) and after incubating with t-vesicles plus 10 μM Ca2+ (B). The
FRET stoichiometry value around 0.5 corresponds to 1:1 donor (Cy3) and acceptor (Cy5)
ratio. The low FRET peak in (b) with ~0.5 FRET stoichiometry value confirms the
conformational change of Cy3/Cy5 probes caused by DNA hybridization.
95
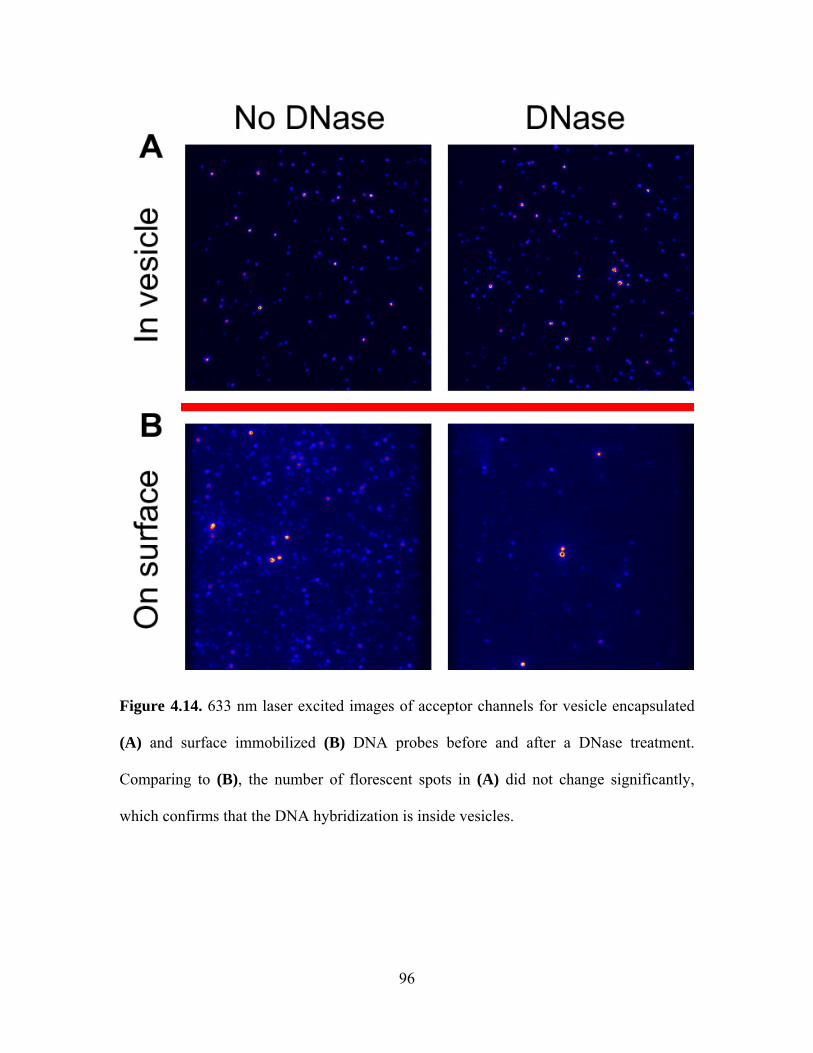
Figure 4.14. 633 nm laser excited images of acceptor channels for vesicle encapsulated
(A) and surface immobilized (B) DNA probes before and after a DNase treatment.
Comparing to (B), the number of florescent spots in (A) did not change significantly,
which confirms that the DNA hybridization is inside vesicles.
96

Figure 4.15. EPR spectra analysis of C2AB (I367C) with membrane (A), and membrane-
associated SNARE complexes in the presence (C) or absence (B) of 1 mM calcium ions.
Black arrows indicate the major change of spectrum due to the protein-protein interaction.
97

CHAPTER 5
OUTLOOK
In order to overcome limitations of conventional methods, we have developed new
techniques based on the single molecular approach using liposomes, which are artificial
vesicles reconstituted with SNARE proteins.
Through our single-vesicle lipid mixing assay, we discovered the vesicle
aggregation induced by C2AB/Ca2+, the dual function of complexin, and the role of
Munc18/SNARE-core binding mode. By using our single-vesicle content mixing assay,
we found the fusion pore expansion role of yeast SNAREs and neuronal SNAREs plus
synaptotagmin 1.
Our data are very encouraging and it is very likely that these studies will provide a
better understanding of the SNARE-mediated membrane fusion process. New
configurations based on the initial studies will be designed. Ultimately, we hope that our
studies will shed light on the molecular mechanism of SNARE-mediated membrane
fusion.
5.1 Remaining issues
Studying membrane fusion based on protein-reconstituted liposomes has achieved
tremendous success. However, due to conflicting results [124], several issues regarding
this technique have been raised, such as lipid composition, protein association rate, and
protein orientation [125,126]. In order to overcome those issues, new approaches are
demanded.
98
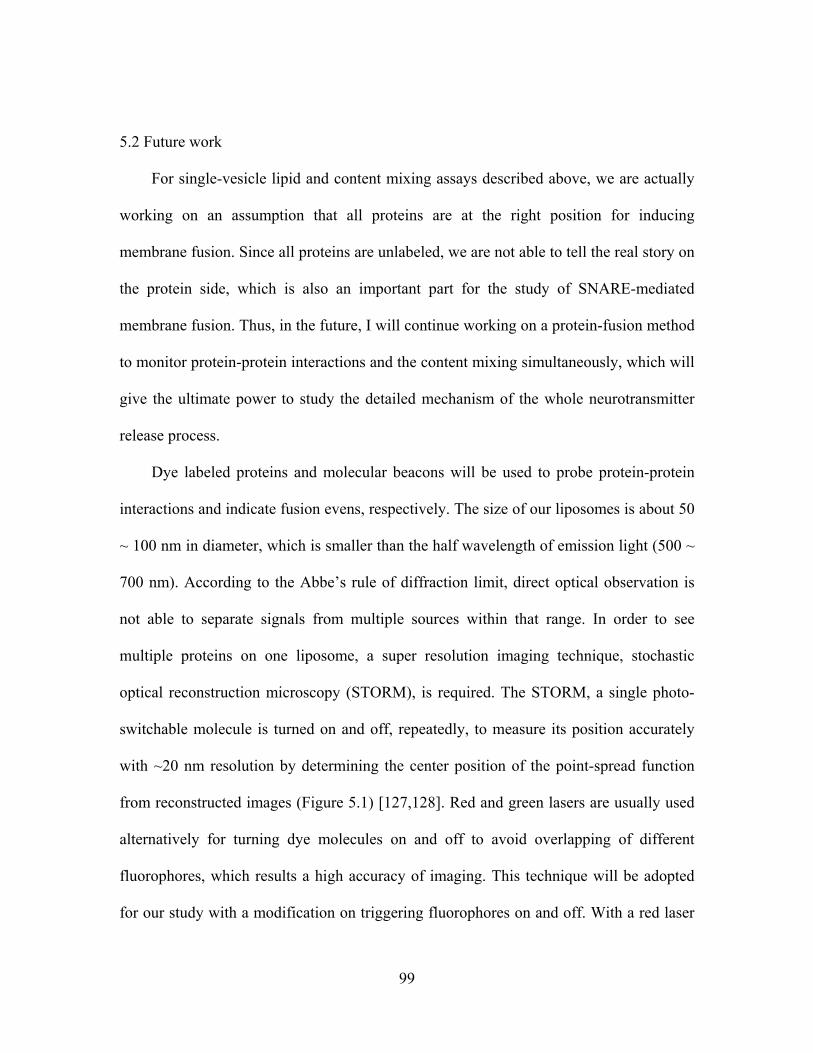
5.2 Future work
For single-vesicle lipid and content mixing assays described above, we are actually
working on an assumption that all proteins are at the right position for inducing
membrane fusion. Since all proteins are unlabeled, we are not able to tell the real story on
the protein side, which is also an important part for the study of SNARE-mediated
membrane fusion. Thus, in the future, I will continue working on a protein-fusion method
to monitor protein-protein interactions and the content mixing simultaneously, which will
give the ultimate power to study the detailed mechanism of the whole neurotransmitter
release process.
Dye labeled proteins and molecular beacons will be used to probe protein-protein
interactions and indicate fusion evens, respectively. The size of our liposomes is about 50
~ 100 nm in diameter, which is smaller than the half wavelength of emission light (500 ~
700 nm). According to the Abbe’s rule of diffraction limit, direct optical observation is
not able to separate signals from multiple sources within that range. In order to see
multiple proteins on one liposome, a super resolution imaging technique, stochastic
optical reconstruction microscopy (STORM), is required. The STORM, a single photo-
switchable molecule is turned on and off, repeatedly, to measure its position accurately
with ~20 nm resolution by determining the center position of the point-spread function
from reconstructed images (Figure 5.1) [127,128]. Red and green lasers are usually used
alternatively for turning dye molecules on and off to avoid overlapping of different
fluorophores, which results a high accuracy of imaging. This technique will be adopted
for our study with a modification on triggering fluorophores on and off. With a red laser
99

excitation in BME buffer, Cy5.5 dye undergoes a spontaneous on and off process like
blinking [128]. Thus, by using a STORM image reconstruction program on images
obtained from Cy5.5 labeled proteins with a red laser excitation, we should be able to
locate the protein position at the sub-hundred-nanometer level.
Since STORM requires single dye illumination on one liposome for each frame,
multi-dye labeled lipid mixing is not suitable for indicating fusion evens. The content
mixing based on molecular beacons will be used for showing fusion events through the
donor detection channel, while the acceptor detection channel is looking at Cy5.5 labeled
proteins. As shown in Figure 5.2, through an image reconstruction program, we can fit
the Cy5.5 labeled protein within ~100 nm range, which is the size of liposomes used in
our study. Right images are reconstructed point-spread functions of three small dots (red)
in left image that is one imaging spot with a red laser illumination.
The STORM technique, together with a three-color TIR setup, would be an ultimate
tool to study protein-protein interactions during the SNARE-mediated membrane fusion
process.
100
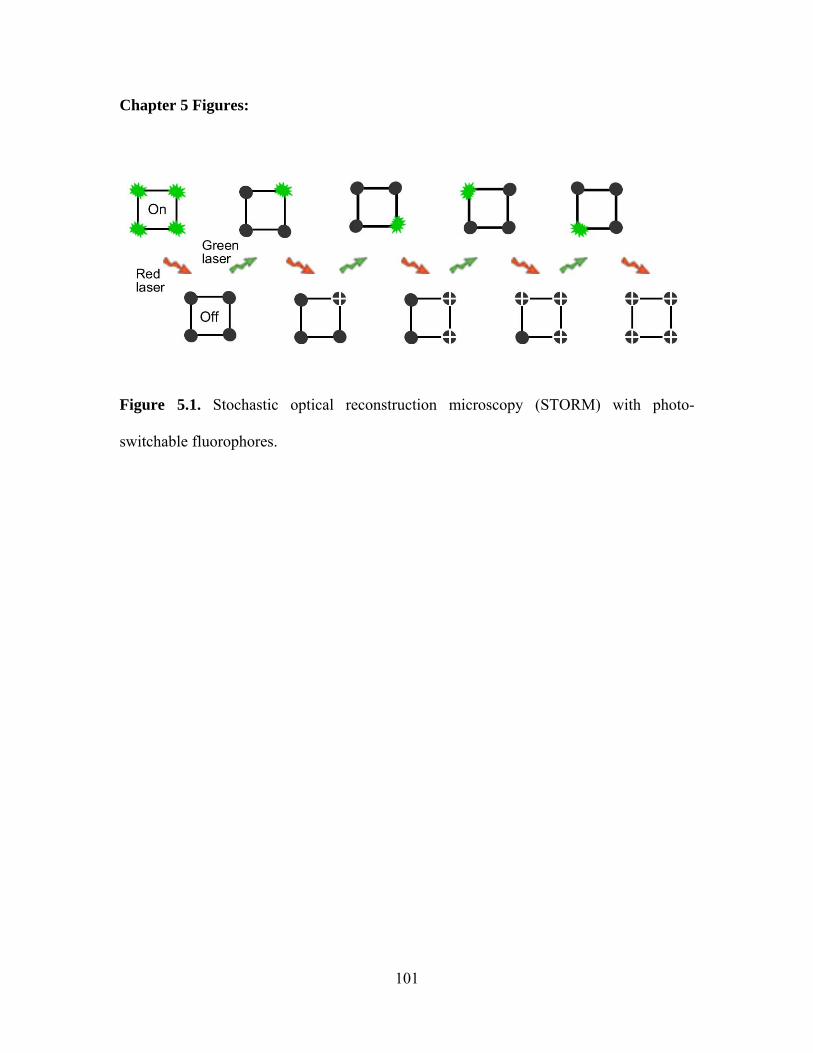
Chapter 5 Figures:
Figure 5.1. Stochastic optical reconstruction microscopy (STORM) with photo-
switchable fluorophores.
101

Figure 5.2. STORM testing on yeast SNARE-mediated fusion by using Cy5.5 labeled
Sec9c proteins.
102

REFERENCES
1. Yeagle, P.L. The Membranes of Cells 2nd Ed., Academic Press, Inc. (1993).
2. White, J.M. Membrane fusion. Science 258, 917-924 (1992).
3. Jahn, R., Lang, T. & Sudhof, T.C. Membrane fusion. Cell 112, 519-533 (2003).
4. Wickner, W. & Schekman, R. Membrane fusion. Nat. Struct. Mol. Biol. 15, 658-664
(2008).
5. Rizo, J. & Rosenmund, C. Synaptic vesicle fusion. Nat. Struct. Mol. Biol. 15, 665-674
(2008).
6. Chernomordik, L.V. & Kozlov, M.M. Mechanics of membrane fusion. Nat. Struct.
Mol. Biol. 15, 675-683 (2008).
7. Weber, T., Zemelman, B.V., McNew, J.A., Westermann, B., Gmachl, M., Parlati, F.,
Sollner, T.H & Rothman, J.E. SNAREpins: minimal machinery for membrane fusion.
Cell 92, 759-772 (1998).
8. McNew, J.A., Parlati, F., Fukuda, R., Johnston, R.J., Paz, K., Paumet, F., Sollner, T.H.
& Rothman, J.E. Compartmental specificity of cellular membrane fusion encoded in
SNARE proteins. Nature 407, 153-159 (2000).
9. Rothman, J.E. Mechanisms of intracellular protein transport. Nature 372, 55-63
(1994).
10. Sollner, T., Whiteheart, S.W., Brunner, M., Erdjument-Bromage, H., Geromanos, S.,
Tempst, P. & Rothman, J.E. SNAP receptors implicated in vesicle targeting and
fusion. Nature 362, 318-324 (1993).
103
11. Poirier, M.A., Xiao, W., Macosko, J. C., Chan, C., Shin, Y. K. & Bennett, M. K. The
synaptic SNARE complex is a parallel four-stranded helical bundle. Nat. Struct. Biol.
5, 765-769 (1998).
12. Sutton, R.B., Fasshauer, D., Jahn, R. & Brunger, A.T. Crystal structure of a SNARE
complex involved in synaptic exocytosis at 2.4 Å resolution. Nature 395, 347-353
(1998).
13. Liu, T., Tucker, W.C., Bhalla, A., Chapman, E.R. & Weisshaar, J.C. SNARE-driven,
25-millisecond vesicle fusion in vitro. Biophys. J. 89, 2458-2472 (2005).
14. Lu, X., Zhang, F., McNew, J.A. & Shin, Y.K. Membrane fusion induced by neuronal
SNAREs transits through hemifusion. J. Biol. Chem. 280, 30538-30541 (2005).
15. Reese, C., Heise, F. & Mayer, A. Trans-SNARE pairing can precede a hemifusion
intermediate in intracellular membrane fusion. Nature 436, 410-414 (2005).
16. Xu, Y., Zhang, F., Su, Z., McNew, J.A. & Shin, Y.K. Hemifusion in SNARE-
mediated membrane fusion. Nat. Struct. Mol. Biol. 12, 417-422 (2005).
17. Lindau, M. & Almers, W. Structure and function of fusion pores in exocytosis and
ectoplasmic membrane fusion. Curr. Opin. Cell Biol. 7, 509-517 (1995).
18. Han, X., Wang, C.T., Bai, J., Chapman, E.R. & Jackson, M.B. Transmembrane
segments of syntaxin line the fusion pore of Ca2+-triggered exocytosis. Science 304,
289-292 (2004).
19. Hua, Y. & Scheller, R.H. Three SNARE complexes cooperate to mediate membrane
fusion. Proc. Natl. Acad. Sci. USA 98, 8065-8070 (2001).
104
20. Kemble, G.W., Danieli, T. & White, J.M. Lipid-anchored influenza hemagglutinin
promotes hemifusion, not complete fusion. Cell 76, 383-391 (1994).
21. Chernomordik, L.V., Frolov, V.A., Leikina, E., Bronk, P. & Zimmerberg, J. The
pathway of membrane fusion catalyzed by influenza hemagglutinin: restriction of
lipids, hemifusion, and lipidic fusion pore formation. J. Cell Biol. 140, 1369-1382
(1998).
22. Armstrong, R.T., Kushnir, A.S. & White, J.M. The transmembrane domain of
influenza hemagglutinin exhibits a stringent length requirement to support the
hemifusion to fusion transition. J. Cell Biol. 151, 425-437 (2000).
23. Zaitseva, E., Mittal, A., Griffin, D.E. & Chernomordik, L.V. Class II fusion protein of
alphaviruses drives membrane fusion through the same pathway as class I proteins. J.
Cell Biol. 169, 167-177 (2005).
24. Yang, L. & Huang, H.W. Observation of a membrane fusion intermediate structure.
Science 297, 1877-1879 (2002).
25. Chernomordik, L. & Kozlov, M. Membrane hemifusion: crossing a chasm in two
leaps. Cell 123, 375-382 (2005).
26. Giraudo, C.G., Hu, C., You, D., Slovic, A.M., Mosharov, E.V., Sulzer, D., Melia, T.J.
& Rothman, J.E. SNAREs can promote complete fusion and hemifusion as
alternative outcomes. J. Cell Biol. 170, 249-260 (2005).
27. Schaub, J.R., Lu, X., Doneske, B., Shin, Y.K. & McNew, J.A. Hemifusion arrest by
complexin is relieved by Ca2+-synaptotagmin I. Nat. Struct. Mol. Biol. 13, 748-750
(2006).
105
28. Chapman, E.R. Synaptotagmin: a Ca2+ sensor that triggers exocytosis. Nat. Rev. Mol.
Cell. Biol. 3, 498-508 (2002).
29. Stein, A., Radhakrishnan, A., Riedel, D., Fasshauer, D. & Jahn, R. Synaptotagmin
activates membrane fusion through a Ca2+-dependent trans interaction with
phospholipids. Nat. Struct. Mol. Biol. 14, 904-911 (2007).
30. Martens, S., Kozlov, M.M. & McMahon, H.T. How synaptotagmin promotes
membrane fusion. Science 316, 1205-1208 (2007).
31. Xue, M., Ma, C., Craig, T.K., Rosenmund, C & Rizo, J. The Janus-faced nature of the
C2B domain is fundamental for synaptotagmin-1 function. Nat. Struct. Mol. Biol. 15,
1160-1168 (2008).
32. Mahal, L.K., Sequeira, S.M., Gureasko, J.M. & Sollner, T.H. Calcium-independent
stimulation of membrane fusion and SNARE pin formation by synaptotagmin I. J.
Cell Biol. 158, 273-282 (2002).
33. Holt, M., Riedel, D., Stein, A., Schuette, C. & Jahn, R. Synaptic vesicles are
constitutively active fusion machines that function independently of Ca2+. Curr. Biol.
18, 715-722 (2008).
34. Diao, J., Yoon, T.-Y., Su, Z., Shin, Y.-K. & Ha, T. C2AB: a molecular glue for lipid
vesicles with negatively charged surface. Langmuir 25, 7177-7180 (2009).
35. Chen, X., Tomchick, D., Kovrigin, E., Arac, D., Machius, M., Sudhof, T.C. & Rizo, J.
Three-dimensional structure of the complexin/SNARE complex. Neuron 33, 397-409
(2002).
106
36. Schaub, J.R., Lu, X., Doneske, B., Shin, Y.K. & McNew, J.A. Hemifusion arrest by
complexin is relieved by Ca2+-synaptotagmin I. Nat. Struct. Mol. Biol. 13, 748-750
(2006).
37. Tang, J., Maximov, A., Shin, O.-H., Dai, H., Rizo, J. & Sudhof, T.C. A
complexin/synaptotagmin 1 switch controls fast synaptic vesicle exocytosis. Cell 126,
1175-1187 (2006).
38. Giraudo, C.G., Eng, W.S., Melia, T.J. & Rothman, J.E. A clamping mechanism
involved in SNARE-dependent exocytosis. Science 313, 676-680 (2006).
39. Yoon, T.-Y., Lu, X., Diao, J., Lee, S.-M., Ha, T. & Shin, Y.-K. Complexin and Ca2+
stimulate SNARE-mediated membrane fusion. Nat. Struct. Mol. Biol. 15, 707-713
(2008).
40. Jahn, R. Sec/Munc18 protein: mediators of membrane fusion moving to center stage.
Neuron 27, 201 (2000).
41. Rizo, J. & Sudhof, T.C. SNAREs and Munc18 in synaptic vesicle fusion. Nat. Rev.
Neurosci. 3, 641-653 (2002).
42. Toonen, R.F.G. & Verhage, M. Vesicle trafficking: pleasure and pain from SM genes.
Trends Cell Biol. 13, 177-186 (2003).
43. Toonen, R.F.G. & Verhage, M. Munc18-1 in secretion: lonely Munc joins SNARE
team and takes control. Trends Neurosci. 30, 564-672 (2007).
44. Khvotchev, M., Dulubova, I., Sun, J., Dai, H., Rizo, J. & Sudhof, T.C. Dual modes of
Munc18-1/SNARE interactions are coupled by functionally critical binding to
syntaxin-1 N terminus. J. Neurosci. 27, 12147-12155 (2007).
107

45. Shen, J., Tareste, D.C., Paumet, F., Rothman, J.E. & Melia, T.J. Selective activation
of cognate SNAREpins by Sec1/Munc18 proteins. Cell 128, 183-195 (2007).
46. Dulubova, I., Khvotchev, M., Liu, S., Huryeva, I., Sudhof, T.C. & Rizo, J. Munc18-1
binds directly to the neuronal SNARE complex. Proc. Natl. Acad. Sci. USA 104,
2697-2702 (2007).
47. Tareste, D., Shen, J., Melia, T.J. & Rothman, J.E. SNAREpin/Munc18 promotes
adhesion and fusion of large vesicles to giant membranes. Proc. Natl. Acad. Sci. USA
105, 2380-2385 (2008).
48. Shen, J., Rathore, S.S., Khandan, L. & Rothman, J.E. SNARE bundle and syntaxin N-
peptide constitute a minimal complement for Munc18-1 activation of membrane
fusion. J. Cell Biol. 190, 55-63 (2010).
49. Diao, J., Su, Z., Lu, X., Yoon, T.-Y., Shin, Y.-K. & Ha, T. Single vesicle fusion assay
reveals Munc18-1 binding to the SNARE core is sufficient for stimulating membrane
fusion. ACS Chem. Neurosci. 1, 168-174 (2010).
50. Chen, Y., Xu, Y., Zhang, F. & Shin, Y.-K. Constitutive versus regulated SNARE
assembly: a structural basis. EMBO J. 23, 681-689 (2004).
51. Forster, T. Zwischenmolekulare energiewanderung und fluoreszenz. Ann. Physik. 437,
55-75 (1948).
52. Weninger, K., Bowen, M.E., Chu, S. & Brunger, A.T. Single molecule studies of
SNARE complex assembly reveal parallel and anti-parallel configurations, Proc. Natl.
Acad. Sci. USA 100, 14800-14805 (2003).
108
53. Bowen, M.E., Weninger, K., Brunger, A.T. & Chu, S. Single molecule observation of
liposome-bilayer fusion thermally induced by SNAREs. Biophys. J. 87, 3569-3584
(2004).
54. Ha, T. Single molecule fluorescence resonance transfer. Methods 25, 78-86 (2001).
55. Joo, C., Balci, H., Ishitsuka, Y., Buranachai, C. & Ha, T. Advances in single-
molecule fluorescence methods for molecular biology. Ann. Rev. Biochem. 77, 51-76
(2008).
56. Roy, R., Hohng, S. & Ha, T. A practical guide to single-molecule FRET. Nat.
Methods 5, 507-516 (2008).
57. Fix, M., Melia, T.J., Jaiswal, J.K., Rappoport, J.Z., You, D., Sollner, T.H., Rothman
J.E. & Simon S.M. Imaging single membrane fusion events mediated by SNARE
proteins. Proc. Natl. Acad. Sci. USA 101, 7311-7316 (2004).
58. Liu, T., Tucker, W.C., Bhalla, A., Chapman, E.R. & Weisshaar, J.C. SNARE-driven,
25-millisecond vesicle fusion in vitro. Biophys. J. 89, 2458-2472 (2005).
59. Domanska, M.K., Kiessling, V., Stein, A., Fasshauer, D. & Tamm, L.K. Single
Vesicle millisecond fusion kinetics reveals number of SNARE complexes optimal for
fast SNARE-mediated membrane fusion. J. Biol. Chem. 284, 32158-32166 (2009).
60. Karatekin, E., Di Giovanni, J., Iborra, C., Coleman, J., O'Shaughnessy, B., Seagar, M.
& Rothman, J.E. A fast, single-vesicle fusion assay mimics physiological SNARE
requirements. Proc. Natl. Acad. Sci. USA 107, 3517-3521 (2010).
109

61. Yoon, T.-Y., Okumus, B., Zhang, F., Shin, Y.-K. & Ha, T. Multiple intermediates in
SNARE-induced membrane fusion. Proc. Natl. Acad. Sci. USA 103, 19731-19736
(2006).
62. Joo, C., McKinney, S.A., Nankura, M., Rasnik, I., Myong, S. & Ha, T. Real time
observation of RecA filament dynamics with single monomer resolution. Cell 126,
515-527 (2006).
63. Rasnik, I., McKinney, S.A. & Ha, T. Nonblinking and long-lasting single molecule
fluorescence imaging. Nat. Methods 3, 891-893 (2006).
64. Hubbell, W.L., Gross, A., Langen, R. & Lietzow, M.A. Recent advances in site-
directed spin labeling of proteins. Curr. Opin. Struct. Biol. 8, 649-656 (1998).
65. Hubbell, W.L., Cafiso, D.S. & Altenbach, C. Identifying conformational changes with
site-directed spin labeling. Nat. Struct. Biol. 7, 735-739 (2000).
66. Shin, Y.-K., Levinthal, C., Levinthal, F. & Hubbell, W.L. Colicin E1 binding to
membranes: time-resolved studies of spin-labeled mutants. Science 259, 960-963
(1993).
67. Kim, C.S., Kweon, D.H. & Shin, Y.-K. Membrane topologies of neuronal SNARE
folding intermediates. Biochem. 41, 10928-10933 (2002).
68. Kweon, D.H., Kim, C.S. & Shin, Y.-K. The membrane-dipped neuronal SNARE
complex: a site-directed spin labeling electron paramagnetic resonance study.
Biochem. 41, 9264-9268 (2002).
69. Kweon, D.H., Kim, C.S. & Shin, Y.-K. Regulation of neuronal SNARE assembly by
the membrane. Nat. Struct. Biol. 10, 440-447 (2003).
110
70. van Dijk, M. & Bonvin, A.M.J.J. 3D-DART: a DNA structure modelling server. Nucl.
Acids Res. 37, W235-W239 (2009).
71. Humphrey, W., Dalke, A. & Schulten, K. VMD - Visual Molecular Dynamics. J.
Molec. Graphics 14, 33-38 (1996).
72. MacKerell, A.D. Jr., Feig, M. & Brooks, C.L. III Extending the treatment of
backbone energetics in protein force fields: limitations of gas-phase quantum
mechanics in reproducing protein conformational distributions in molecular dynamics
simulations. J. Comput. Chem. 25, 1400-1415 (2004).
73. Phillips, J.C., Braun, R., Wang, W., Gumbart, J., Tajkhorshid, E., Villa, E., Chipot, C.,
Skeel, R.D., Kale, L. & Schulten, K. Scalable molecular dynamics with NAMD. J.
Comput. Chem. 26, 1781-1802 (2005).
74. Pabst, S., Margittai, M., Vainius, D., Langen, R., Jahn, R. & Fasshauer, D. Rapid and
selective binding to the synaptic SNARE complex suggests a modulatory role of
complexins in neuroexocytosis. J. Biol. Chem. 277, 7838-7848 (2002).
75. Takamori, S., Holt, M., Lemke, E., Riedel, D., Urlaub, H., Schenck, S., Stenius, K.,
Bruegger, B., Ringler, P., Krzyzaneki, V., Mueller, S., Rammner, B., Groot, B.D.,
Mieskes, G., Moriyama, Y., Klingauf, J., Grubmueller, H., Heuser, J., Wieland, F. &
Jahn, R. Molecular anatomy of a trafficking organelle. Cell 127, 831-846 (2006).
76. Koh, T.W. & Bellen, H.J. Synaptotagmin I, a Ca2+ sensor for neurotransmitter release.
Trends Neurosci. 26, 413-422 (2003).
77. Guan, R., Dai, H. & Rizo, J. Binding of the Munc13-1 MUN domain to membrane-
anchored SNARE complexes. Biochem. 47, 1474-1481 (2008).
111
78. Thorgeirsson, T.E., Russell, C.J., King, D.S. & Shin, Y.-K. Direct determination of
the membrane affinities of individual amino acids. Biochem. 35, 1803-1809 (1996).
79. Archer, D.A., Graham, M.E. & Burgoyne, R.D. Complexin regulates the closure of
the fusion pore during regulated vesicle exocytosis. J. Biol. Chem. 277, 18249-18252
(2002).
80. Itakura, M., Misawa, H., Sekiguchi, M., Takahashi, S. & Takahashi, M. Transfection
analysis of functional roles of complexin I and II in the exocytosis of two different
types of secretory vesicles. Biochem. Biophys. Res. Commun. 265, 691-696 (1999).
81. Xue, M., Reim, K., Chen, X., Chao, H. T., Deng, H., Rizo, J., Brose, N. &
Rosenmund, C. Distinct domains of complexin I differentially regulate
neurotransmitter release. Nat. Struct. Mol. Biol. 14, 949-958 (2007).
82. Hanson, P.I., Roth, R., Morisaki, H., Jahn, R. & Heuser, J.E. Structure and
conformational changes in NSF and its membrane receptor complexes visualized by
quick-freeze/deep-etch electron microscopy. Cell 90, 523-535 (1997).
83. Lin, R.C. & Scheller, R.H. Structural organization of the synaptic exocytosis core
complex. Neuron 19, 1087-1094 (1997).
84. Liu, W., Montana, V., Bai, J., Chapman, E.R., Mohideen, U. & Parpura, V. Single
molecule mechanical probing of the SNARE protein interactions. Biophys. J. 91, 744-
758 (2006).
85. Li, F., Pincet, F., Perez, E., Eng, W.S., Melia, T.J., Rothman, J.E. & Tareste, D.
Energetics and dynamics of SNAREpin folding across lipid bilayers. Nat. Struct. Mol.
Biol. 14, 890-896 (2007).
112

86. Abdulreda, M.H., Bhalla, A., Chapman, E.R. & Moy, V.T. Atomic force microscope
spectroscopy reveals a hemifusion intermediate during soluble N-ethylmaleimide-
sensitive factor-attachment protein receptors-mediated membrane fusion. Biophys. J.
94, 648-655 (2008).
87. Kumaran, V. Instabilities due to charge-density-curvature coupling in charged
membranes. Phys. Rev. Lett. 85, 4996-4999 (2000).
88. Kim, Y.W. & Sung, W. Effects of charge fluctuation on two-membrane instability
and fusion. Phys. Rev. Lett. 91, 118101 (2003).
89. Toonen, R.F.G., de Vries, K.J., Zalm, R., Sudhof, T.C. & Verhage, M. Munc18-1
stabilizes syntaxin 1, but is not essential for syntaxin 1 targeting and SNARE
complex formation. J. Neurochem. 93, 1393-1400 (2005).
90. Lu, X., Zhang, Y. & Shin, Y.-K. Supramolecular SNARE assembly precedes
hemifusion in SNARE-mediated membrane fusion. Nat. Struct. Mol. Biol. 15, 700-
706 (2008).
91. Rizo, J., Chen, X. & Arac, D. Unraveling the mechanisms of synaptotagmin and
SNARE function in neurotransmitter release. Trends Cell Biol. 16, 339-350 (2006).
92. Bai, J. & Chapman, E.R. The C2-domains of synaptotagmin-partners in exocytosis.
Trends Biochem. Sci. 29, 143-151 (2004).
93. Arac, D., Chen, X., Khant, H.A., Ubach, J., Ludtke, S.J., Kikkawa, M., Johnson, A.E.,
Chiu, W., Sudhof, T.C. & Rizo, J. Close membrane-membrane proximity induced by
Ca2+-dependent multivalent binding of synaptotagmin 1 to phospholipids. Nat. Struct.
Mol. Biol. 13, 209-217 (2006).
113
94. Brunger, A.T., Weninger, K., Bowen, M. & Chu, S. Single-molecule studies of the
neuronal SNARE fusion machinery. Annu. Rev. Biochem. 78, 903-928 (2009).
95. Klyachko, V.A. & Jackson, M.B. Capacitance steps and fusion pores of small and
large-dense-core vesicles in nerve terminals. Nature 418, 89-92 (2002).
96. Zhang, Q., Li, Y. & Tsien, R.W. The dynamic control of kiss-and-run and vesicular
reuse probed with single nanoparticles. Science 323, 1448-1453 (2009).
97. Chan, Y.H., van Lengerich, B. & Boxer, S.G. Effects of linker sequences on vesicle
fusion mediated by lipid-anchored DNA oligonucleotides. Proc. Natl. Acad. Sci. USA
106, 979-984 (2009).
98. Dennison, S.M., Bowen, M.E., Brunger, A.T. & Lentz, B. Neuronal SNAREs do not
trigger fusion between synthetic membranes but do promote PEG-mediated
membrane fusion. Biophys. J. 90, 1661-1675 (2006).
99. Nickel, W., Weber, T., McNew, J.A., Parlati, F., Sollner, T.H. & Rothman, J.E.
Content mixing and membrane integrity during membrane fusion driven by pairing of
isolated v-SNAREs and t-SNAREs. Proc. Natl. Acad. Sci. USA 96, 12571-12576
(1999).
100. Ohya, T., Miaczynska, M., Coskun, U., Lommer, B., Runge, A., Drechsel, D.,
Kalaidzidis, Y. & Zerial, M. Reconstitution of Rab- and SNARE-dependent
membrane fusion by synthetic endosomes. Nature 459, 1091-1097 (2009).
101. van den Bogaart, G., Holt, M.G., Bunt, G., Riedel, D., Wouters, F.S. & Jahn R.
One SNARE complex is sufficient for membrane fusion. Nat. Struct. Mol. Biol. 17,
358-364 (2010).
114
102. http://www.molecular-beacons.org/Introduction.html
103. Diao, J., Su, Z., Ishitsuka, Y., Lu, B., Lee, K.S., Lai, Y., Shin, Y.-K. & Ha T. A
single vesicle content mixing assay for SNARE-mediated membrane fusion. Nat.
Commun. 1, 54 (2010).
104. Chanturiya, A. Chernomordik L.V. & Zimmerberg, J. Flickering fusion pores
comparable with initial exocytotic pores occur in protein-free phospholipid bilayers.
Proc. Natl. Acad. Sci. USA 94, 14423-14428 (1997).
105. Jackson, M.B. Minimum membrane bending energies of fusion pores. J.
Membrane Biol. 231, 101-115 (2009).
106. Jackson, M.B. SNARE complex zipping as a driving force in the dilation of
proteinaceous fusion pores. J. Membrane Biol. 235, 89-100 (2010).
107. Bonifacino, J.S. & Glick, B.S. The mechanisms of vesicle budding and fusion.
Cell 116, 153-166 (2004).
108. Su, Z., Ishitsuka, Y., Ha, T. & Shin, Y.-K. The SNARE complex from yeast is
partially unstructured on the membrane. Structure 16, 1138-1146 (2008).
109. Chen, Y., Xu, Y., Zhang, F. & Shin, Y.-K. Constitutive versus regulated SNARE
assembly: a structural basis. EMBO J. 23, 681-689 (2004).
110. Pobbati, A.V., Stein, A. & Fasshauer, D. N- to C-terminal SNARE complex
assembly promotes rapid membrane fusion. Science 313, 673-676 (2006).
111. Weber, J.P, Reim, K. & Sorensen, J.B. Opposing functions of two sub-domains of
the SNARE-complex in neurotransmission. EMBO J. 29, 2477-2490 (2010).
115
112. Liu, W., Montana, V., Parpura, V. & Mohideen, U. Single molecule
measurements of interaction free energies between the proteins within binary and
ternary SNARE complexes. J. Nanoneurosci. 1, 120-129 (2009).
113. Walter, A.M., Wiederhold, K., Bruns, D., Fasshauer, D. & Sorensen, J.B.
Synaptobrevin N-terminally bound to syntaxin-SNAP-25 defines the primed vesicle
state in regulated exocytosis. J. Cell Biol. 188, 401-413 (2010).
114. Lee, H.-K., Yang, Y., Su, Z., Hyeon, C., Lee, T.-S., Lee, H.-W., Kweon, D.-H.,
Shin, Y.-K. & Yoon, T.-Y. Dynamic Ca2+-dependent stimulation of vesicle fusion by
membrane-anchored synaptotagmin 1. Science 328, 760-763 (2010).
115. Wang, C.T., Lu, J.-C., Bai, J., Chang, P.Y., Martin, T.F.J., Chapman, E.R. &
Jackson, M.B. Different domains of synaptotagmin control the choice between kiss-
and-run and full fusion. Nature 424, 943-947 (2003).
116. Bai, J.H., Wang, C.T., Richards, D.A., Jackson, M.B. & Chapman, E.R. Fusion
pore dynamics are regulated by synaptotagmin/t-SNARE interactions. Neuron 41,
929-942 (2004).
117. Weninger, K., Bowen, M.E., Choi, U.B., Chu, S. & Brunger, A.T. Accessory
proteins stabilize the acceptor complex for synaptobrevin, the 1:1 syntaxin/SNAP-25
complex. Structure 16, 308-320 (2008).
118. de Wit, H., Walter, A.M., Milosevic, I., Gulyas-Kovacs, A., Riedel, D., Sorensen,
J.B. & Verhage, M. Synaptotagmin-1 docks secretory vesicles to syntaxin-1/SNAP-
25 acceptor complexes. Cell 138, 935-946 (2009).
116

119. Takahashi, N., Hatakeyama, H., Okado, H., Noguchi, J., Ohno, M. & Kasai, H.
SNARE conformational changes that prepare vesicles for exocytosis. Cell Metab. 12,
19-29 (2010).
120. Vrljic, M., Strop, P., Ernst, J.A., Sutton, R.B., Chu, C. & Brunger, A.T. Molecular
mechanism of the synaptotagmin-SNARE interaction in Ca2+-triggered vesicle fusion.
Nat. Struct. Mol. Biol. 17, 325-331 (2010).
121. Choi, U.B., Strop, P., Vrljic, M., Chu, S., Brunger, A.T. & Weninger, K. Single
molecule FRET-derived model of the synaptogagmin 1-SNARE fusion complex. Nat.
Struct. Mol. Biol. 17, 318-324 (2010).
122. Rickman, C. & Davletov, B. Mechanism of calcium-independent synaptotagmin
binding to target SNAREs. J. Bio. Chem. 278, 5501-5504 (2003).
123. Hui, E., Johnson, C.P., Yao, J., Dunning, F.M. & Chapman, E.R. Synaptotagmin-
mediated bending of the target membrane is a critical step in Ca2+-regulated fusion.
Cell 138, 709-721 (2009).
124. Sorensen, J.B. Conflicting views on the membrane fusion machinery and the
fusion pore. Annu. Rev. Cell Dev. Biol. 25, 513-537 (2009).
125. Chen, X., Arac, D., Wang, T.-M., Gilpin, C.J., Zimmerberg, J. & Rizo, J.
SNARE-mediated lipid mixing depends on the physical state of the vesicles. Biophys.
J. 90, 2062-2074 (2006).
126. Mima, J., Hickey, C., Xu, H., Jun, Y. & Wickner, W. Reconstituted membrane
fusion requires regulatory lipids, SNAREs and synergistic SNARE chaperones.
EMBO J. 27, 2031-2042 (2008).
117

127. Rust, M.J., Bates, M. & Zhuang, X. Sub-diffraction-limit imaging by stochastic
optical reconstruction microscopy (STORM). Nat. Methods 3, 793-796 (2006).
128. Bates, M., Huang, B., Dempsey, G.T. & Zhuang, X.W. Multicolor super-
resolution imaging with photo-switchable fluorescent probes. Science 317, 1749-1753
(2007).
118
AUTHOR’S BIOGRAPHY
Jiajie Diao was born in Chengdu, P.R. China. He attended Xi’an Jiaotong University in
Xi’an, P.R. China and graduated with a B.S. degree in applied physics in 2001. He came
to the USA to begin his graduate study at George Washington University in the summer
of 2002 and joined Prof. Mark E. Reeves’ lab, where he received a M.A. degree in
physics. In the fall of 2005, he transferred to University of Illinois at Urbana-Champaign
and joined the lab of Prof. Taekjip Ha for a Ph.D. degree in physics.
119