© 2008 The Brattle Group Developments and Issues in Utility Energy Efficiency – 2008 Presentation...
19
© 2008 The Brattle Group Developments and Issues in Utility Energy Efficiency – 2008 Presentation to Consumer Affairs Committee National Association of Regulatory Utility Commissioners February 17, 2008 Peter Fox-Penner Co-Chairman and Principal The Brattle Group 1850 M Street, NW Suite 1200 Washington, DC 20036 202.955.5050 www.brattle.com Note: This presentation does not represent the complete views of The Brattle Group or its clients.
-
Upload
edward-parrish -
Category
Documents
-
view
216 -
download
2
Transcript of © 2008 The Brattle Group Developments and Issues in Utility Energy Efficiency – 2008 Presentation...

© 2008 The Brattle Group
Developments and Issues inUtility Energy Efficiency – 2008
Presentation toConsumer Affairs Committee
National Association of Regulatory Utility Commissioners
February 17, 2008
Peter Fox-PennerCo-Chairman and Principal
The Brattle Group1850 M Street, NW
Suite 1200Washington, DC 20036
202.955.5050www.brattle.com
Note: This presentation does not represent the complete views of The Brattle Group or its clients.
2 © 2008
The Brattle Group/Personal Bio
• Independent economic and financial consultancy founded in 1991 in Cambridge, Massachusetts - 175 staff in five offices – U.S. and Europe
• Brattle is a frequent consultant to all segments of energy industry – primarily IOUS. Also consultant to EEI on energy efficiency policy.
• Dr. Fox-Penner is former DOE Senior official in Energy Efficiency and Renewable Energy and former G.O.C.S.
• Dr. Fox-Penner is also a Vice-Chairman of ENpartners/Daylight Technologies (energy efficiency company) and a member of the Board for Enviance, Inc. (GHG tracking software.)
• All opinions expressed and errors are personal – but thanks to ICF and RAP
3 © 2008
Why Greater Energy Efficiency Is Essential
• Reduces large rate increase impacts that are going to arise from
► Fuel price increases► Demand growth ► Enormous construction cost increases► Climate change
• Also reduces riskiness and volatility in future resource plans
• Good economic policy in recessionary times
• Good environmental policy

4 © 2008
What is needed?
Electric Infrastructure Investments (2007 – 2016)
• Generation ~$ 53 Billion
• Transmission ~$ 85 Billion
• Distribution ~$145 Billion
• Environmental ~$30-60 Billion• Excludes potential cost of climate legislation
• Other cost factors• Critical infrastructure protection, RTOs, pension funds, health care,
disaster recovery, end of rate freezes, RPS, fuel
CapEx ~$750 – 900 Billion w/o climate changeWith climate change > $1.2 Trillion
Statistics courtesy of Edison Electric Institute (EEI)

5 © 2008
New Generation Capacity by Fuel Type, 1950 - 2007
Source: Henwood Energy Consulting

6 © 2008
Resurgence of Rate Cases
0
2
4
6
8
10
12
14
16
18
20
Courtesy of Edison Electric Institute (EEI), December 2007
Number of Cases Filed, 1990 - 2007

7 © 2008
Role of Energy Efficiency in Combating Climate Change
Coal
w/CCS
Gas
w/CCS Nuclear
Hydro
Wind
SolarOil
Demand Reduction
Demand with No Policy
Biomass
Full Portfolio
(economic allocation)
8
7
6
5
4
3
2
1
02000 2010 2020 2030 2040 2050
Tri
llio
n k
Wh
per
Ye
ar
8
7
6
5
4
3
2
1
02000 2010 2020 2030 2040 2050
Limited Portfolio
(economic allocation)
Coal
Gas
Nuclear
WindHydro
Biomass
Coal
Coal with CCS
Gas
Nuclear
HydroWind
Courtesy of Electric Power Research
Institute (EPRI)
8 © 2008
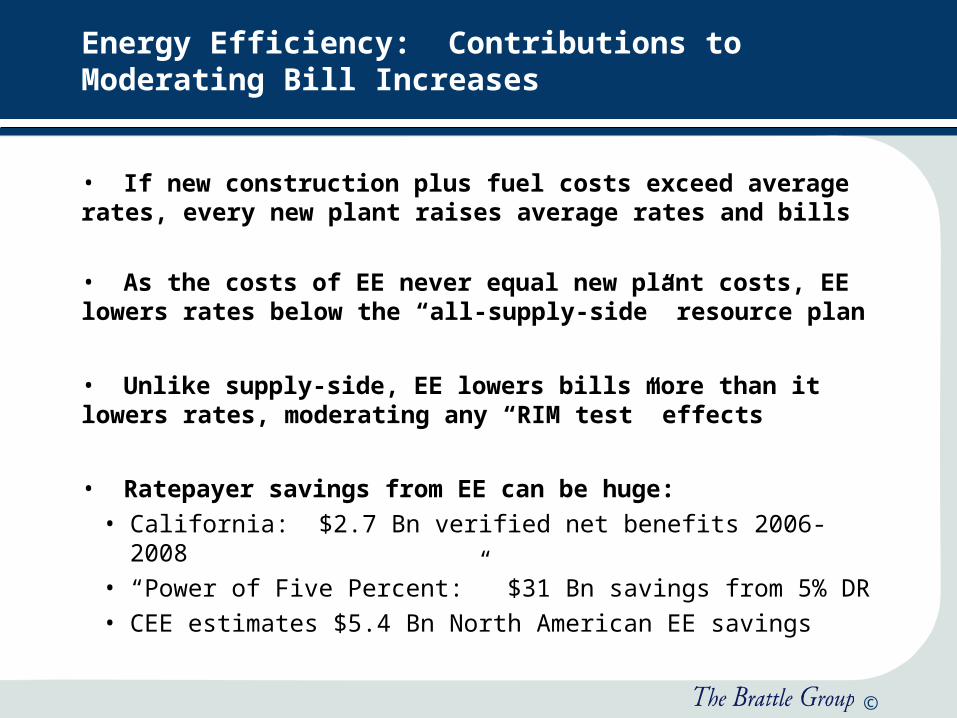
Energy Efficiency: Contributions to Moderating Bill Increases
• If new construction plus fuel costs exceed average rates, every new plant raises average rates and bills
• As the costs of EE never equal new plant costs, EE lowers rates below the “all-supply-side” resource plan
• Unlike supply-side, EE lowers bills more than it lowers rates, moderating any “RIM test” effects
• Ratepayer savings from EE can be huge:• California: $2.7 Bn verified net benefits 2006-2008• “Power of Five Percent:” $31 Bn savings from 5% DR• CEE estimates $5.4 Bn North American EE savings

9 © 2008
Enormous Energy Efficiency Activity Already Underway
• National Action Plan for Energy Efficiency (NAPEE)
• State EERS, GHG cap and trade
• 2007 Federal Energy Bill
• Electric and Gas Utility IRP and DSM► Better resource plans, potential studies, and forecasts► Growing EE programs► Decoupling and energy efficiency incentives► Expanded DR and Smart Grid programs
10 © 2008
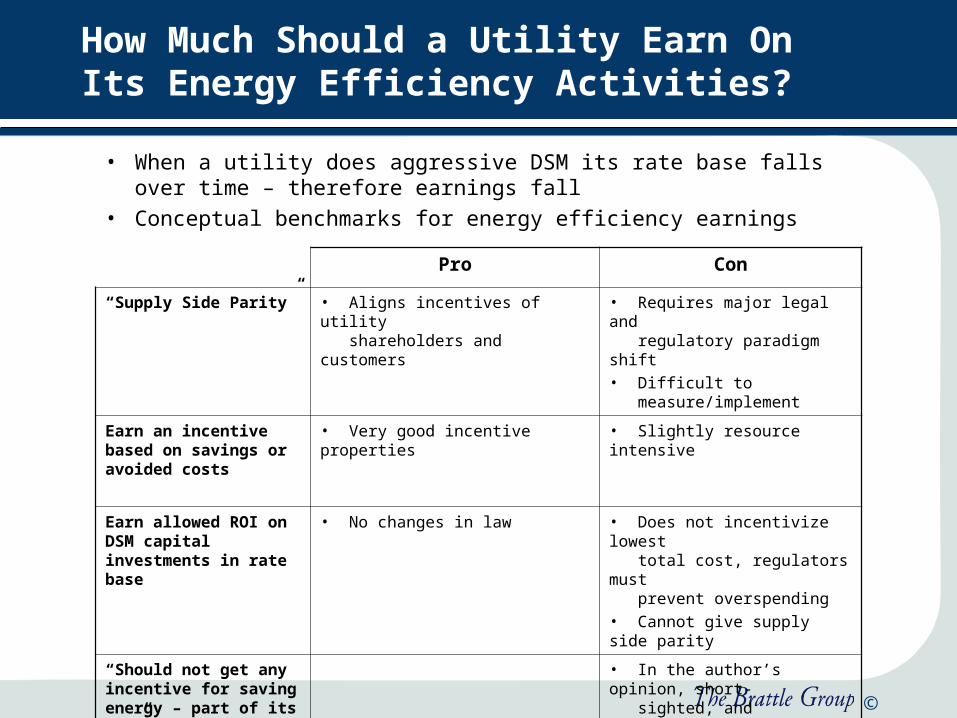
How Much Should a Utility Earn On Its Energy Efficiency Activities?
• When a utility does aggressive DSM its rate base falls over time – therefore earnings fall
• Conceptual benchmarks for energy efficiency earnings
Pro Con
“Supply Side Parity” • Aligns incentives of utility shareholders and customers
• Requires major legal and regulatory paradigm shift• Difficult to measure/implement
Earn an incentive based on savings or avoided costs
• Very good incentive properties • Slightly resource intensive
Earn allowed ROI on DSM capital investments in rate base
• No changes in law • Does not incentivize lowest total cost, regulators must prevent overspending• Cannot give supply side parity
“Should not get any incentive for saving energy – part of its job”
• In the author’s opinion, short- sighted, and counterproductive: “ sticks alone don’t work nearly as well as carrots and sticks”

11 © 2008
Action Items for the Regulatory Community
• Improved information practices – toolkits in IRP, DSM, DR► Integrating utility and other EE efforts► Potential, technology, economic data
• Staffing-Education-Resource management within your organization
• Energy efficiency – incentives and oversight
• Stakeholder education/communication

12 © 2008
• Judy Chang 617.234.5630 [email protected]
• Robert Earle 415.217.1016 [email protected]
• Ahmad Faruqui 415.217.1026 [email protected]
• Phil Hanser 617.234.5671 [email protected]
• Matthew McCaffree 202.419.3314 [email protected]
• Joe Wharton 415.217.1015 [email protected]
Additional Brattle Contacts for Energy Efficiency

13 © 2008
Appendix

14 © 2008
PRISM Analysis Details
0
500
1000
1500
2000
2500
3000
3500
1990 1995 2000 2005 2010 2015 2020 2025 2030
U.S
. Ele
ctri
c S
ecto
rC
O2 E
mis
sio
ns
(mill
ion
met
ric
ton
s)
Technology EIA 2007 Reference Target
Efficiency Load Growth ~ +1.5%/yr Load Growth ~ +1.1%/yr
Renewables 30 GWe by 2030 70 GWe by 2030
Nuclear Generation 12.5 GWe by 2030 64 GWe by 2030
Advanced Coal Generation
No Existing Plant Upgrades
40% New Plant Efficiency by 2020–2030
150 GWe Plant Upgrades
46% New Plant Efficiency by 2020; 49% in 2030
Carbon Capture & Sequestration
None Widely Deployed After 2020
PHEV None10% of New Vehicle Sales by
2017; 2%/yr Thereafter
DER< 0.1% of Base Load in
20305% of Base Load in 2030
Source: EPRI
EIA Base Case 2007
* Achieving all targets is very aggressive, but potentially feasible.

15 © 2008
ACEEE Scenarios
Source: Jeff Schlegal, Energy Efficiency and Global Warming: What Must be Done, ACEEE Energy Efficiency as a Resource Conference

16 © 2008
The Status of Cost Recovery, Decoupling & Performance Incentives
States Direct Cost Recovery
Rate Case Arizona, California, Colorado, District of Columbia, Hawaii, Idaho, Illinois, Indiana, Iowa, Minnesota, Missouri, Montana, Nevada, New Mexico, Pennsylvania, Texas, Utah, Wisconsin
SBC Arizona, California, Connecticut, Maine, Massachusetts, Montana, New Hampshire, New Jersey, New York, Ohio, Oregon, Rhode Island, Vermont, Wisconsin
Tariff Rider/ surcharge Florida, Idaho, Iowa, Kentucky, Ohio, Utah, Washington
Lost Margin Recovery
Decoupling Electric: California, Idaho, New York, Rhode Island, Minnesota, Maryland. Proposed Electric: Delaware, DC, New Jersey. Gas: California, Indiana, Maryland, Missouri, Nevada, New Jersey, New York, North Carolina, Ohio, Oregon, Rhode Island, Utah. Proposed Gas: Arkansas, Arizona, Colorado, Delaware, Illinois, Michigan, Minnesota, Pennsylvania, Tennessee, Virginia, Wisconsin
Lost Margin Recovery Mechanism
Connecticut, Indiana, Kentucky
Performance Incentives
Arizona, California, Connecticut, Hawaii, Idaho, Indiana, Kansas, Kentucky, Massachusetts, Minnesota, Montana, Nevada, New Hampshire, Rhode Island, Vermont.
Courtesy of Val Jensen, ICF
17 © 2008
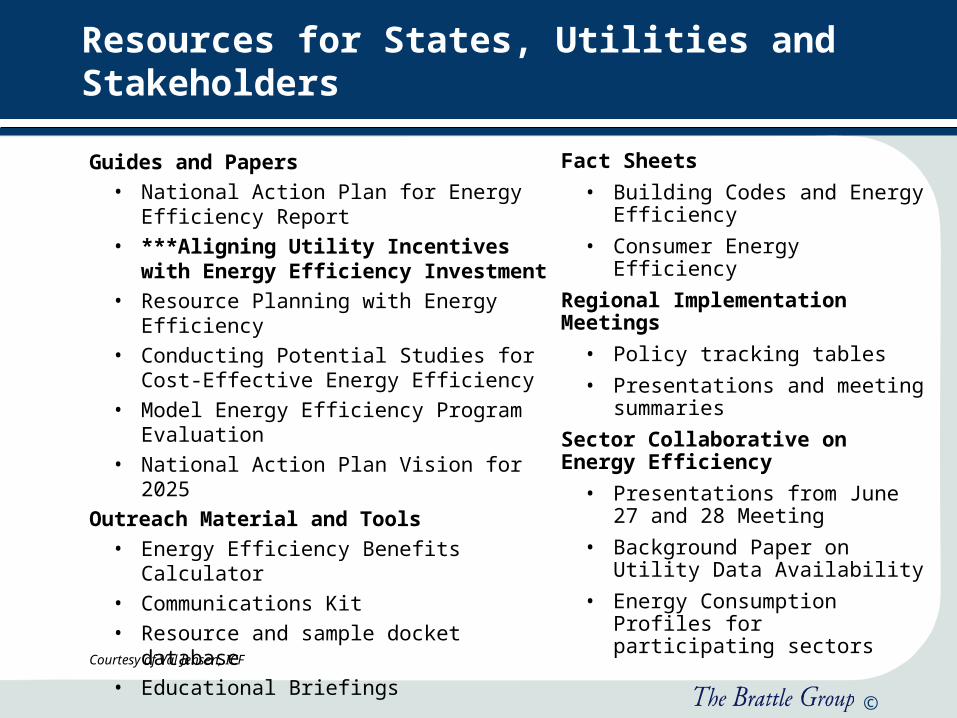
Resources for States, Utilities and Stakeholders
Guides and Papers • National Action Plan for Energy Efficiency
Report • ***Aligning Utility Incentives with
Energy Efficiency Investment• Resource Planning with Energy Efficiency • Conducting Potential Studies for Cost-
Effective Energy Efficiency • Model Energy Efficiency Program
Evaluation • National Action Plan Vision for 2025
Outreach Material and Tools• Energy Efficiency Benefits Calculator • Communications Kit • Resource and sample docket database• Educational Briefings
Fact Sheets
• Building Codes and Energy Efficiency
• Consumer Energy Efficiency
Regional Implementation Meetings
• Policy tracking tables
• Presentations and meeting summaries
Sector Collaborative on Energy Efficiency
• Presentations from June 27 and 28 Meeting
• Background Paper on Utility Data Availability
• Energy Consumption Profiles for participating sectors
Courtesy of Val Jensen, ICF

18 © 2008
National Action Plan for Energy Efficiency Addresses Utility Barriers
Released on July 31, 2006 at the National Association of Regulatory Utility Commissioners meeting
Goal: To create a sustainable, aggressive national commitment to energy efficiency through gas and electric utilities, utility regulators, and partner organizations
Over 50 member public-private Leadership Group developed five recommendations and commits to take action
Additional commitments to energy efficiency – exceeds 90 organizations
National Action Plan for Energy Efficiency
Recommendations
1. Recognize energy efficiency as a high-priority energy resource.
2. Make a strong, long-term commitment to implement cost-effective energy efficiency as a resource.
3. Broadly communicate the benefits of and opportunities for energy efficiency.
4. Provide sufficient, timely and stable program funding to deliver energy efficiency where cost-effective.
5. Modify policies to align utility incentives with the delivery of cost-effective energy efficiency and modify ratemaking practices to promote energy efficiency investments.
Courtesy of Val Jensen, ICF

19 © 2008
For More Information on NAPEE
Stacy [email protected](202) 343-9606
Joe [email protected](202) 343-9631
Larry Mansueti
(202) 586-2588
www.epa.gov/eeactionplan
Courtesy of Val Jensen, ICF