Understanding Perfmon The Performance Testing Tool >>>>>>>>>>>>>>>>>>>>>>
Upload
phillip-stanleyCategory
view
216download
3
© 2008 Quest Software, Inc. ALL RIGHTS RESERVED.
Perfmon and Profiler 101

About Me: Brent Ozar
• SQL Server Expert for Quest Software
• Former SQL DBA
• Managed >80tb SAN, VMware
• Dot-com-crash experience
• Specializes in performance tuning

Today’s Agenda
• The Honda Civic and the Nissan GT-R
• Metrics, Trace, Mitigations
• A New Secret Weapon
• Resources and Q&A

If You Don’t Need to Go Fast…
From http://flickr.com/photos/stevekeys/2755142278/

But The Faster You Want To Go

The More You Have To Measure

Windows “Check Engine” Light

And If You Wanna Go Fast:

Two Approaches to Detection
• Exceptions Monitoring: Check Engine
• Proactive Monitoring: Detailed Gauges

Where Do We Start?

Capture Metrics With Perfmon
• Performance Monitor, aka Perfmon
• Ships with all Windows versions
• Polls any server from your desktop
• Pulls performance metrics
• Writes them to a file
• Requires some OS permissions
• Does not include alerts or analytics
12
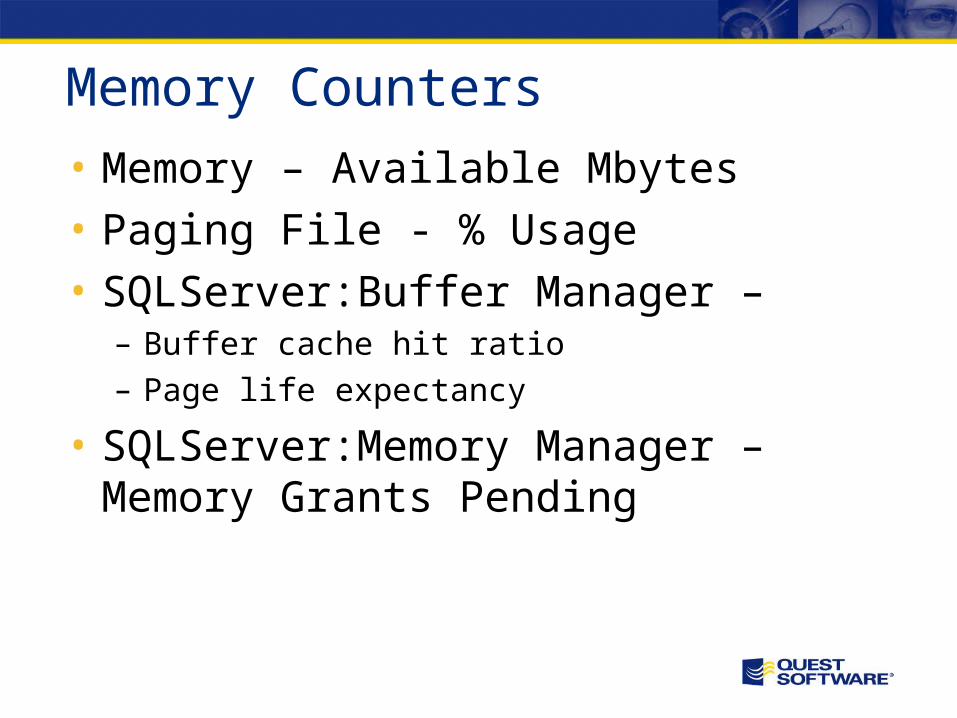
Memory Counters
• Memory – Available Mbytes
• Paging File - % Usage
• SQLServer:Buffer Manager – – Buffer cache hit ratio– Page life expectancy
• SQLServer:Memory Manager – Memory Grants Pending

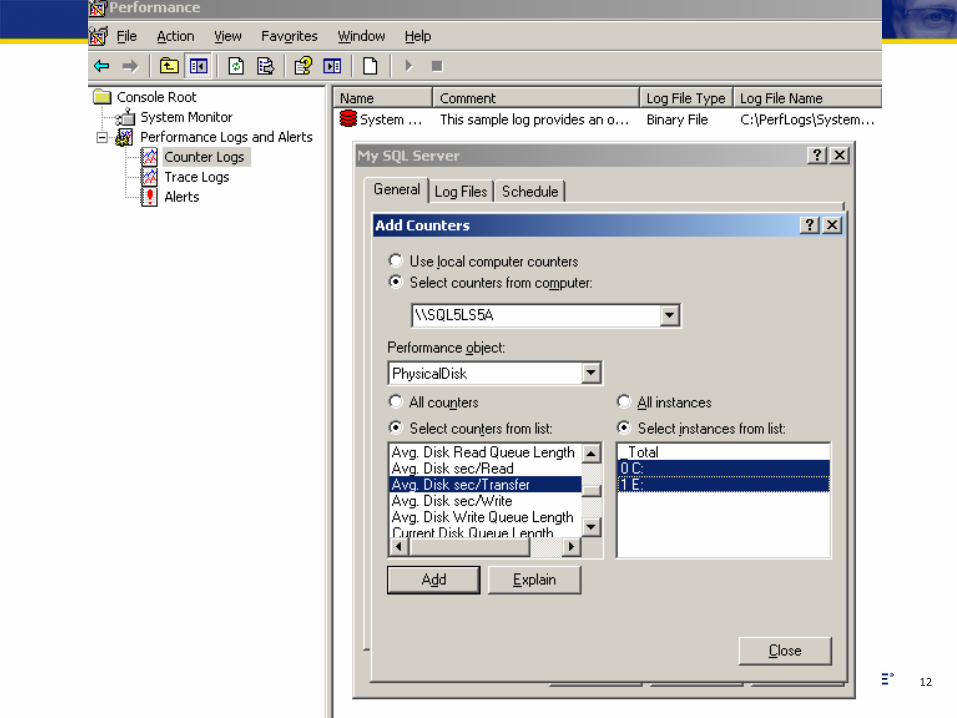
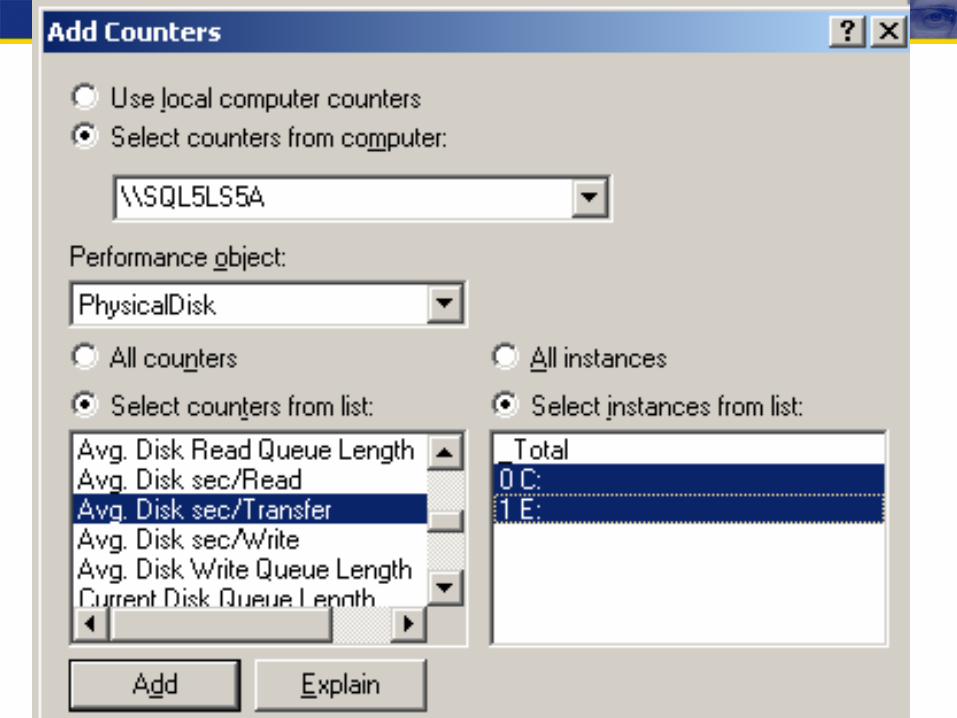
Storage Metrics: Physical Disk
• % Disk Time
• Avg. Disk Queue Length
• Avg. Disk sec/Read
• Avg. Disk sec/Write
• Disk Reads/sec
• Disk Writes/sec

CPU Metrics
• Processor - % Processor Time
• System – Processor Queue Length
• SQLServer:General Statistics – User Connections (not CPU, just “other”)

17
The Raw Output: CSV Files

18
Adding Analytical Formulas

19
That’s a Lot of Zeroes!
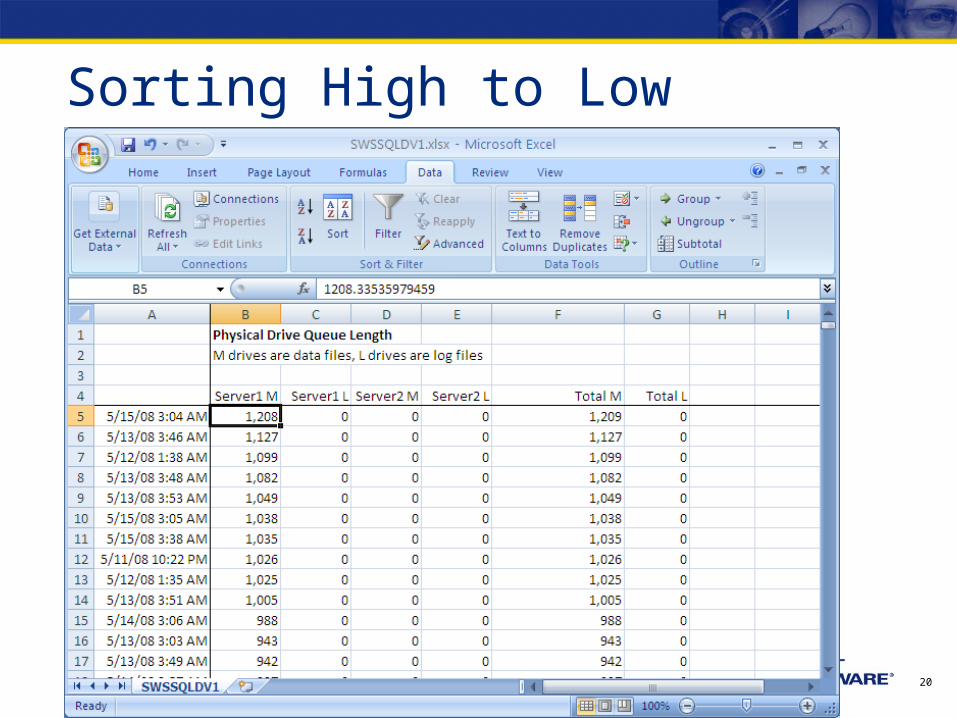
20
Sorting High to Low

What To Look For, In Order
• System – Processor Queue Length
• Memory – Available Mbytes
• Lock pages in memory!
What To Look For Next
• Disk metrics on the page file drive
• Disk metrics on the log file drive
• Disk metrics on the data file drive
• Disk metrics on the TempDB drive
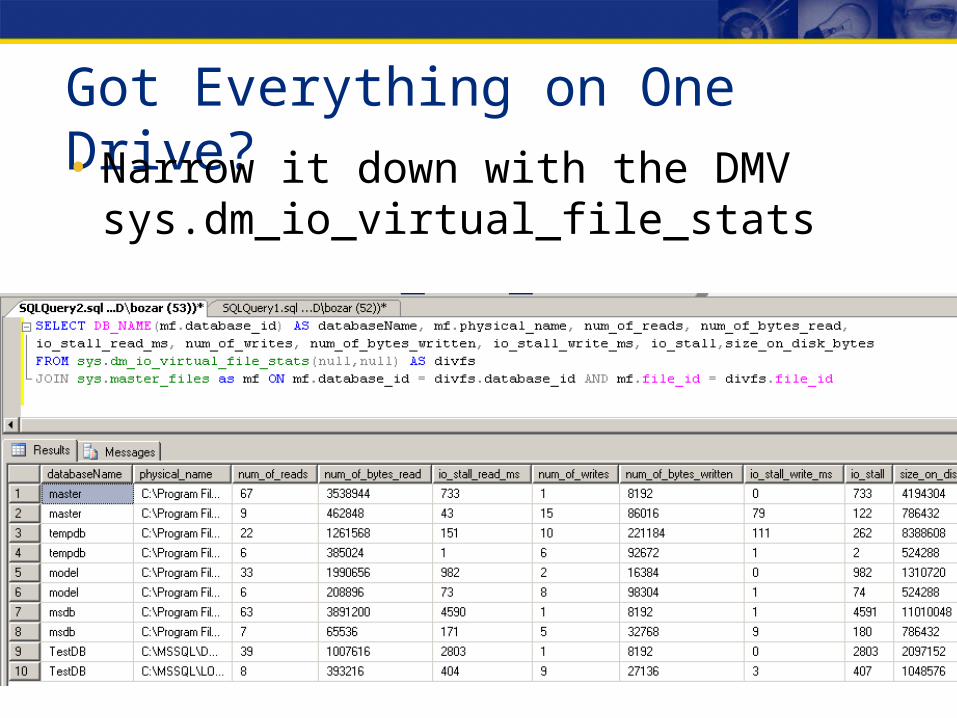
Got Everything on One Drive?
• Narrow it down with the DMV sys.dm_io_virtual_file_stats

What If We Could Data Mine It?

Table Analysis Tools For The Cloud

Detecting Categories of Load
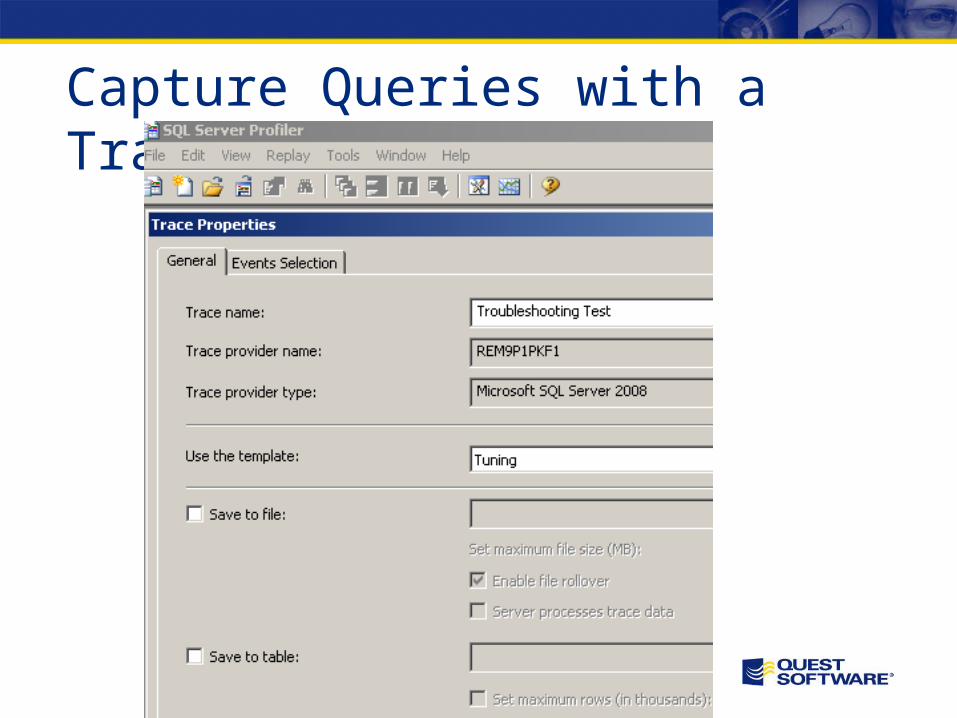
Capture Queries with a Trace

Columns to Capture
What’s Going On
• Text Data• DatabaseID and/or
DatabaseName• Login Name• Host Name• Application Name
What The Impact Was
• CPU• Reads• Writes• Duration• Start Time• End Time

Profiler’s Results: A Trace Table

Order By Duration Descending

Casting and Grouping
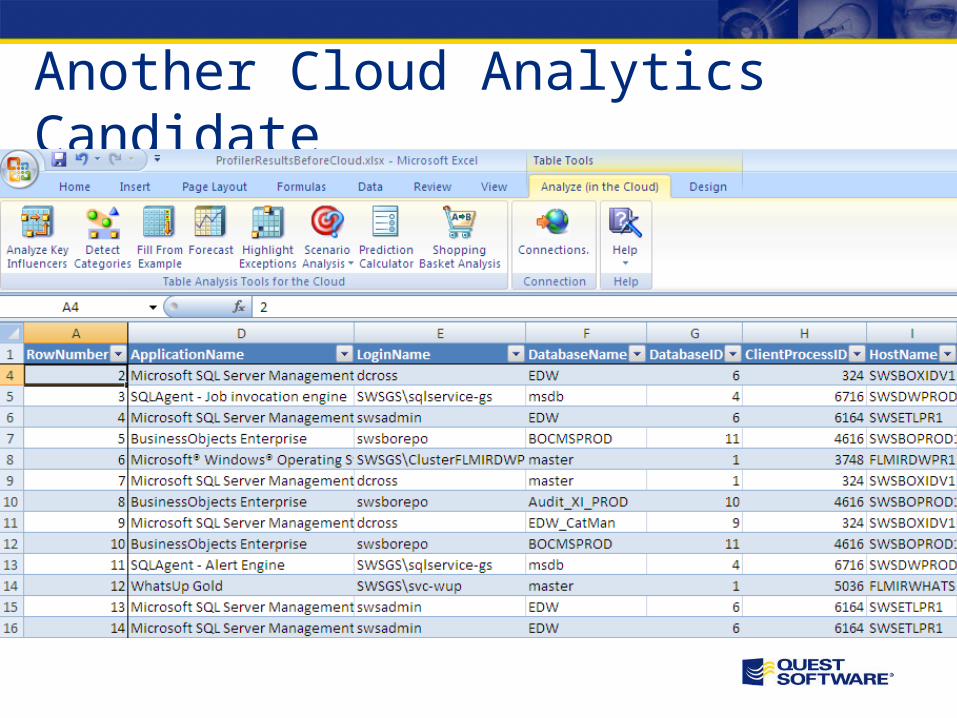
Another Cloud Analytics Candidate

Another Way: Perf Dashboard

Correlate Metrics & Trace
• Show a cause and effect relationship
• Fields to mentally “join” on:– Date/Time ranges– CPU– Reads/Writes– Duration

Sample Problem #1
• Metrics tell us:– Very high disk queue
lengths on data drive
• Trace tells us:– Report queries doing
table scans w/o indexes– Many scheduled reports
run simultaneously
Ways We Can Mitigate It
• Add covering indexes
• Modify existing indexes
• Run reports serially, not all at once
• Add hard drives to the data file array
• Add memory to cache scanned tables

Sample Problem #2
• Metrics tell us:– Page file drive queue lengths
average >20– Page file use averages >1%– Available memory averages
<200mb– Buffer cache hit ratio and
page life expectancy are high
• Trace tells us:– No unusual queries

Memory Configuration
Ways We Can Mitigate It
• Add memory and enable AWE/PAE
• Add memory and upgrade to 64-bit
• Reduce SQL’s min/max memory sizes
• Move the app to its own server

Sample Problem #3
• Metric looks OK, but every 15 minutes:– Long drive queues on the
log file drive– Page life expectancy
drops near zero– Network traffic jumps
• Trace tells us:– Transaction log backups
are running

Ways We Can Mitigate It
• Stop doing log backups
• Put the databases in simple mode
• Add drives to the transaction log array
• Throttle the transaction log backups

Sample Problem #4
• Metrics tell us:– CPU average is high – Disk, memory look OK
• Trace tells us:– Queries are using
cursors– Operating on
individual records, not sets

How We Can Mitigate It
• Change cursor to set-based query
• Buy really fast processors
• Spend a lot on licensing

Wrapping Things Up
• Double-check the event log first
• Don’t get overwhelmed: focus with the Metric – Trace – Mitigation process
• Show a clear cause and effect
• Use cloud-based BI to get an edge
Resources On The Web
• My posts about Perfmon and analytics:www.BrentOzar.com/perfmonwww.BrentOzar.com/perfmoncloud
• Excel Table Analysis Tools for the Cloud:www.SQLServerDataMining.com/cloud
• SQL Server community:SQLServerPedia.com