© 2008 Morningstar, Inc. All rights reserved. 3/1/2008 LCN200803-2013997 Stocks and Bonds.
16
© 2008 Morningstar, Inc. All rights reserved. 3/1/2008 LCN200803-2013997 Stocks and Bonds
-
date post
20-Dec-2015 -
Category
Documents
-
view
217 -
download
2
Transcript of © 2008 Morningstar, Inc. All rights reserved. 3/1/2008 LCN200803-2013997 Stocks and Bonds.
© 2008 Morningstar, Inc. All rights reserved. 3/1/2008LCN200803-2013997
Stocks and Bonds

Investing in Stocks
© 2008 Morningstar, Inc. All rights reserved. 3/1/2008
Ownership in a corporation Voting rights Historically higher returns More risk
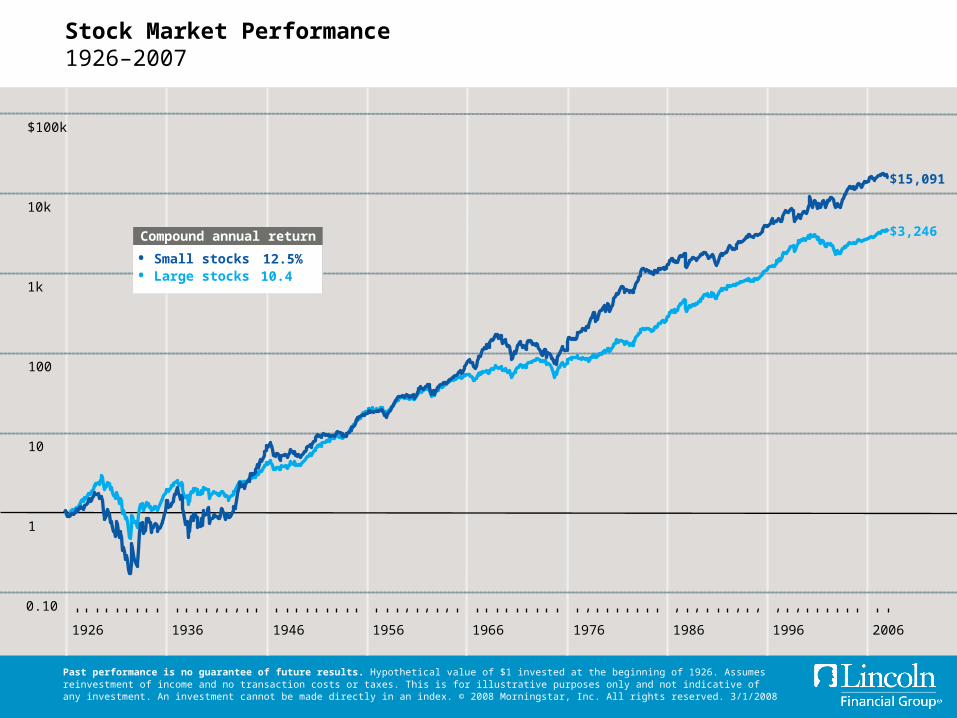
Stock Market Performance1926–2007
Past performance is no guarantee of future results. Hypothetical value of $1 invested at the beginning of 1926. Assumes reinvestment of income and no transaction costs or taxes. This is for illustrative purposes only and not indicative of any investment. An investment cannot be made directly in an index. © 2008 Morningstar, Inc. All rights reserved. 3/1/2008
12.5%10.4
Compound annual return
$100k
10k
1k
100
10
1
0.10
1996 20061986197619661956194619361926
$15,091
$3,246
• Small stocks• Large stocks

Small Stock Annual Returns Relative to Large Stocks1926–2007
Past performance is no guarantee of future results. This is for illustrative purposes only and not indicative of any investment. An investment cannot be made directly in an index. © 2008 Morningstar, Inc. All rights reserved. 3/1/2008
-60
-40
-20
0
20
40
60
80
100% Excess return
1996 20061986197619661956194619361926
• Small stocks outperform large stocks• Large stocks outperform small stocks

–20
–10
0
10
20
30
40
50%
19961998
20032005
19611963
19681970
19751977
19821984
19891991
19261928
19331935
19401942
19471949
19541956
Small and Large Stock Performance Tends to Go in Cycles36-month rolling period returns 1926–2007
Past performance is no guarantee of future results. This is for illustrative purposes only and not indicative of any investment. An investment cannot be made directly in an index. © 2008 Morningstar, Inc. All rights reserved. 3/1/2008
• Small stock excess return
JanDec
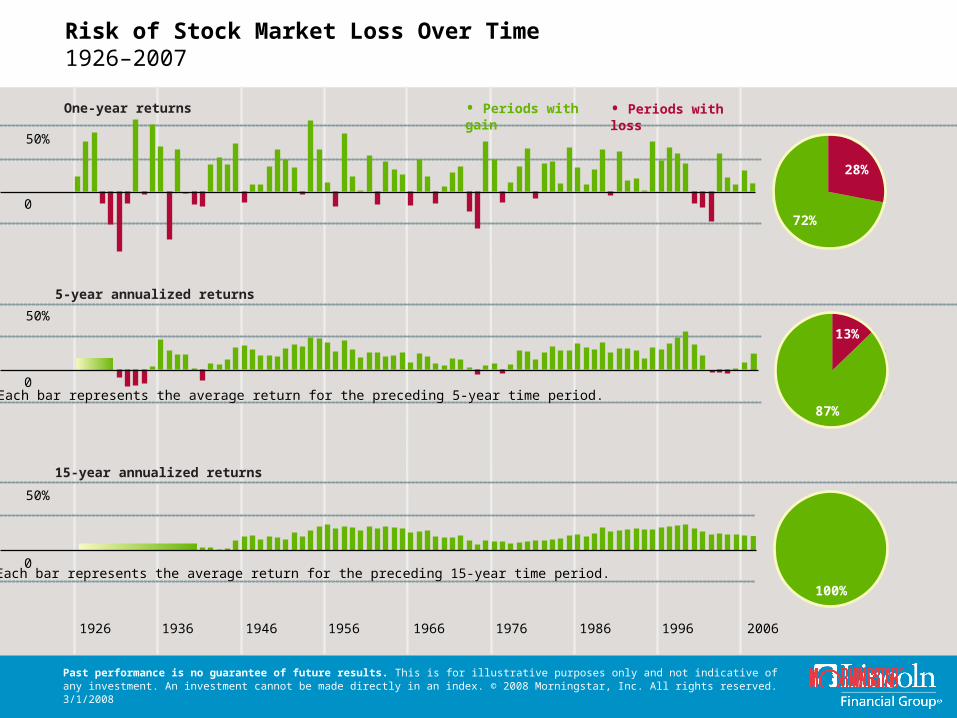
Risk of Stock Market Loss Over Time1926–2007
Past performance is no guarantee of future results. This is for illustrative purposes only and not indicative of any investment. An investment cannot be made directly in an index. © 2008 Morningstar, Inc. All rights reserved. 3/1/2008
One-year returns
5-year annualized returns
15-year annualized returns
Each bar represents the average return for the preceding 5-year time period.
Each bar represents the average return for the preceding 15-year time period.
50%
0
50%
0
50%
0
1926 1936 1946 1956 1966 1976 1986 1996 2006
• Periods with gain • Periods with loss
72%
28%
87%
13%
100%

Do Stock Winners Repeat?Top ten performing stocks 1986–2007
Past performance is no guarantee of future results. Annualized returns of an equally weighted portfolio of top 10 stocks by three-year return and return in subsequent three-year period (excluding the smallest 20% of the market). This is for illustrative purposes only and not indicative of any investment. An investment cannot be made directly in an index. © 2008 Morningstar, Inc. All rights reserved. 3/1/2008
–50
0
50
100
150
200
250
1995 1996 1997 1998 1999 2000 2001 2002 20041990 1991 1992 1993 19941986 1987 1988 1989
150.9%4.7
Average return
• First 3 years• Subsequent 3 years
300% Annualized return
2003
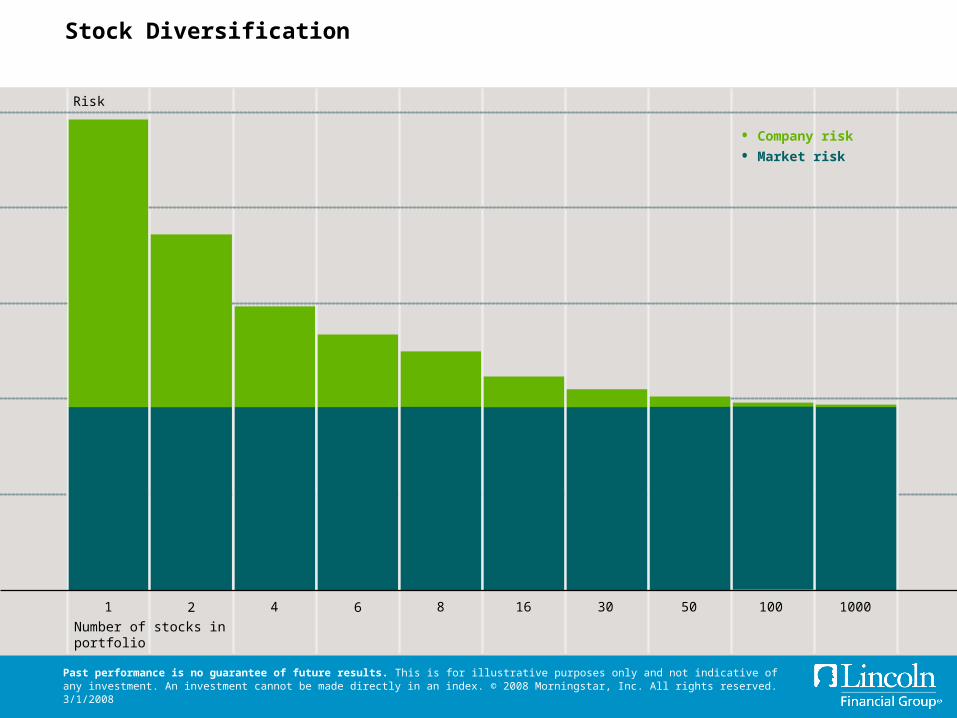
Stock Diversification
Past performance is no guarantee of future results. This is for illustrative purposes only and not indicative of any investment. An investment cannot be made directly in an index. © 2008 Morningstar, Inc. All rights reserved. 3/1/2008
1 2 4 6 8 16 30 50 100 1000
Risk
• Company risk
• Market risk
Number of stocks in portfolio

Benefits of Bonds in a Portfolio
© 2008 Morningstar, Inc. All rights reserved. 3/1/2008
Potential growth Historically lower risk Diversification benefits Income generation Expand efficient opportunities
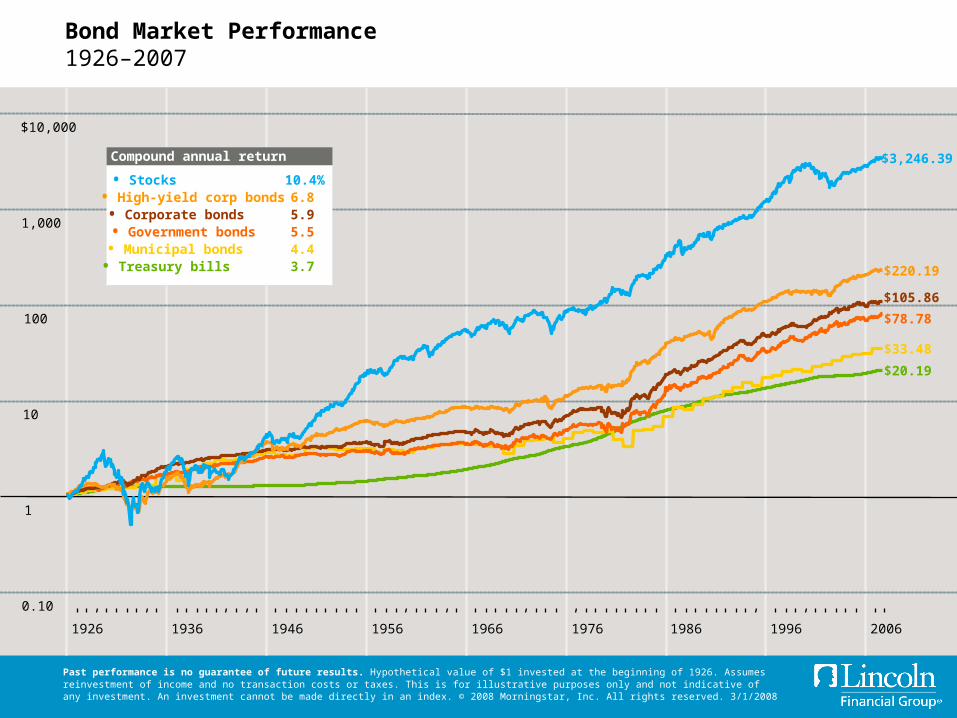
Bond Market Performance1926–2007
Past performance is no guarantee of future results. Hypothetical value of $1 invested at the beginning of 1926. Assumes reinvestment of income and no transaction costs or taxes. This is for illustrative purposes only and not indicative of any investment. An investment cannot be made directly in an index. © 2008 Morningstar, Inc. All rights reserved. 3/1/2008
$20.19
$33.48
$78.78
$105.86
$220.19
$3,246.39
$10,000
1,000
100
10
1
0.10
10.4% 6.85.95.54.43.7
Compound annual return
• Stocks• High-yield corp bonds• Corporate bonds• Government bonds• Municipal bonds• Treasury bills
1926 1936 1946 1956 1966 1976 1986 1996 2006

Relationship Between Bond Prices and YieldsWhen yields increase, bond prices decrease
Past performance is no guarantee of future results. This is for illustrative purposes only and not indicative of any investment. An investment cannot be made directly in an index. © 2008 Morningstar, Inc. All rights reserved. 3/1/2008
2
4
6
8
10
12
14
16%
0
0.20
0.40
0.60
0.80
1.00
1.20
1.40
$1.60
1996 20061986197619661956194619361926
• Bond prices ($)• Bond yields (%)
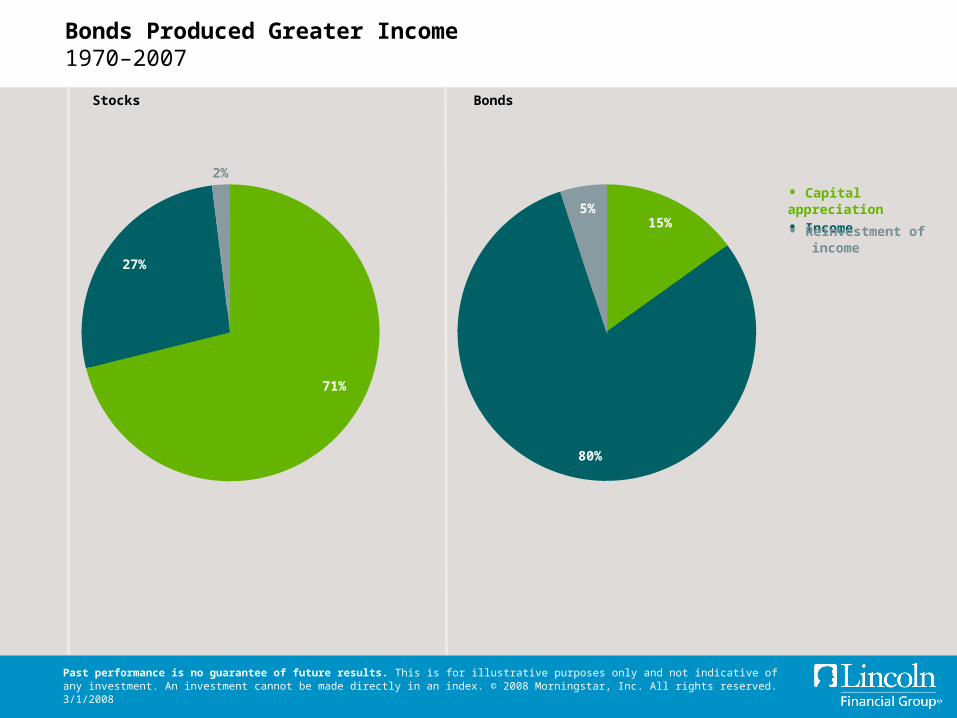
Bonds Produced Greater Income1970–2007
Past performance is no guarantee of future results. This is for illustrative purposes only and not indicative of any investment. An investment cannot be made directly in an index. © 2008 Morningstar, Inc. All rights reserved. 3/1/2008
Stocks Bonds
• Capital appreciation
• Income
27%
71%
2%
80%
15%5%
• Reinvestment of income

Bonds Expand Efficient Opportunities1970–2007
Past performance is no guarantee of future results. Risk is measured by standard deviation. Risk and return are based on annual data over the period 1970–2007. Portfolios presented are based on modern portfolio theory. This is for illustrative purposes only and not indicative of any investment. An investment cannot be made directly in an index. © 2008 Morningstar, Inc. All rights reserved. 3/1/2008
5% Risk 7 9 11 13 15 17 19 21 23 25
17% Return
16
15
14
13
12
11
10
9
8
• Stock portfolios
• Stock and bond portfolios
Small stocks
Large stocks
Bonds
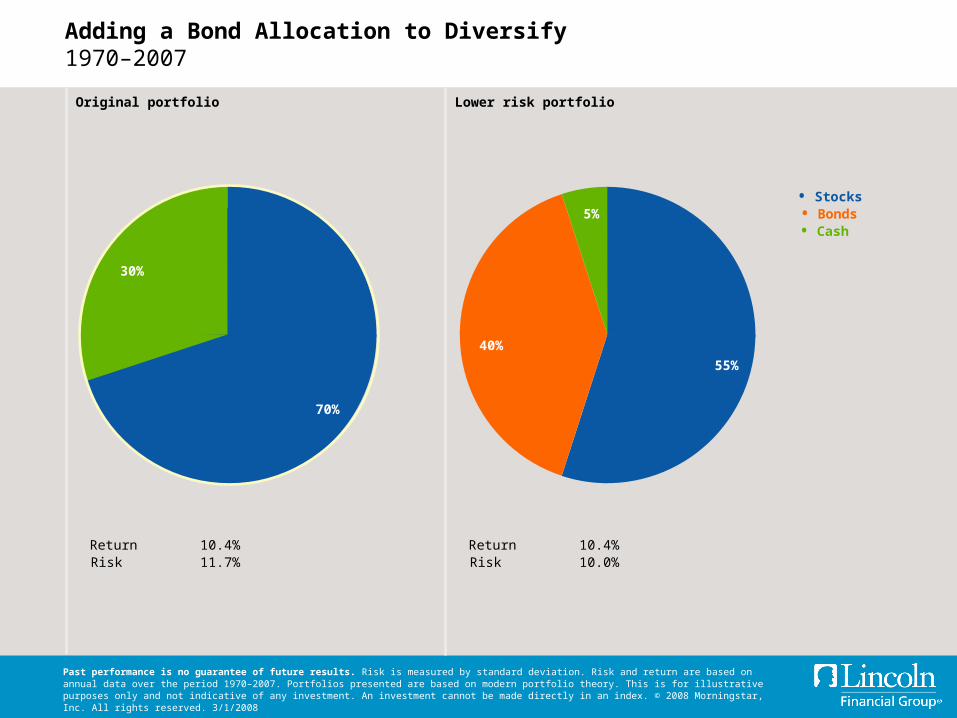
Adding a Bond Allocation to Diversify1970–2007
Past performance is no guarantee of future results. Risk is measured by standard deviation. Risk and return are based on annual data over the period 1970–2007. Portfolios presented are based on modern portfolio theory. This is for illustrative purposes only and not indicative of any investment. An investment cannot be made directly in an index. © 2008 Morningstar, Inc. All rights reserved. 3/1/2008
55%
40%
5%
Return 10.4%Risk 10.0%
Lower risk portfolio
30%
70%
Return 10.4%Risk 11.7%
Original portfolio
• Stocks• Bonds• Cash

Risk Versus ReturnStocks, bonds, and bills 1926–2007
Past performance is no guarantee of future results. Risk and return are measured by standard deviation and compound annual return, respectively. This is for illustrative purposes only and not indicative of any investment. An investment cannot be made directly in an index. © 2008 Morningstar, Inc. All rights reserved. 3/1/2008
14% Return
12
10
8
6
4
2
0
0% Risk 5 10 15 20 25 30 35
Small stocks
Large stocks
Treasury bills
Long-term government bonds
Intermediate-term government bonds

2007
11.6
9.9
5.5
4.7
–5.2
1993 1994 1995 1996 1997 1998 1999 2000 2001 2002 2003 2004 2005 2006
32.9 8.1 37.4 23.1 33.4 28.6 29.8 21.5 22.8 17.8 60.7 20.7 14.0 26.9
21.0 3.9 34.5 17.6 22.8 20.3 27.3 5.9 3.8 1.6 39.2 18.4 7.8 16.2
18.2 3.1 31.7 6.4 15.9 13.1 21.0 –3.6 3.7 –13.3 28.7 10.9 5.7 15.8
10.0 1.3 11.6 5.2 5.3 4.9 4.7 –9.1 –11.9 –15.7 1.4 8.5 4.9 4.8
2.9 –7.8 5.6 –0.9 2.1 –7.3 –9.0 –14.0 –21.2 –22.1 1.0 1.2 3.0 1.2
Asset Class Winners and Losers
Past performance is no guarantee of future results. This is for illustrative purposes only and not indicative of any investment. An investment cannot be made directly in an index. © 2008 Morningstar, Inc. All rights reserved. 3/1/2008
Highestreturn
Lowestreturn
• Small stocks • Large stocks • International stocks • Long-term government bonds • Treasury bills