© 2005, Johns Hopkins University. All rights reserved. Department of Health, Behavior & Society...
32
© 2005, Johns Hopkins University. All rights reserved. Department of Health, Behavior & Society David Holtgrave, PhD, Professor & Chair
-
Upload
august-merritt -
Category
Documents
-
view
216 -
download
3
Transcript of © 2005, Johns Hopkins University. All rights reserved. Department of Health, Behavior & Society...

© 2005, Johns Hopkins University. All rights reserved.
Department of Health, Behavior & Society
David Holtgrave, PhD, Professor & Chair

NHAS Goals for Reducing HIV Incidence

NHAS Goals for Improving Treatment Access
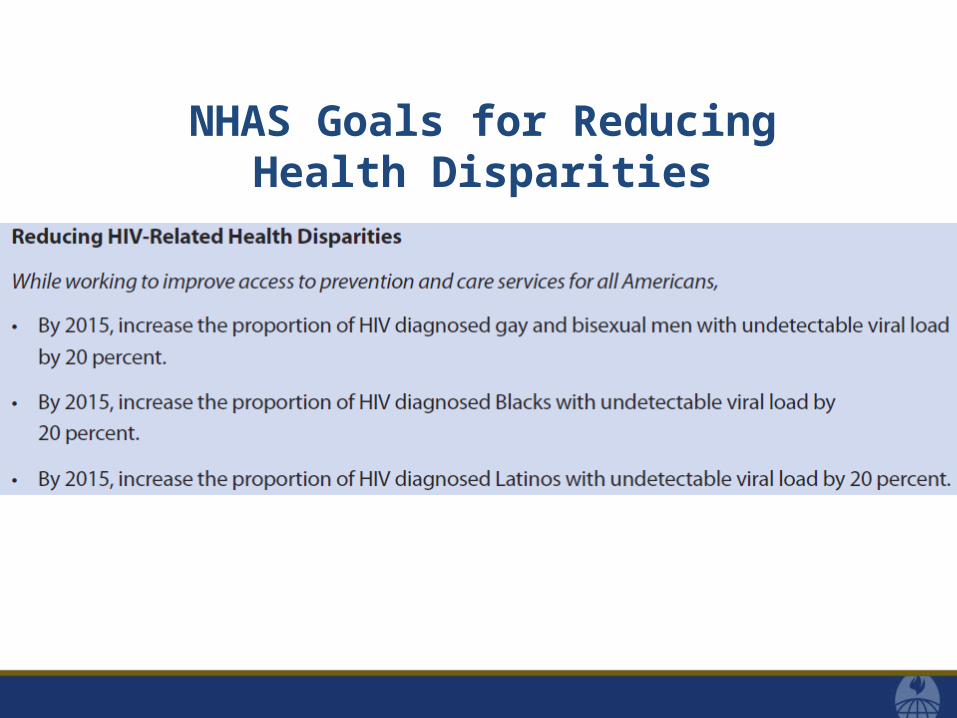
NHAS Goals for Reducing Health Disparities

Key implications of NHAS (from Holtgrave, JAIDS 2010)
• How will epidemic be changed if goals are met?– Prevent roughly 75,800 infections (2010-2015)– Prevent roughly 237,700 infections (2010-2020)– 2015 prevalence without NHAS roughly 1.481M and with
NHAS roughly 1.407M• Approx. 218,900 more people on care and treatment
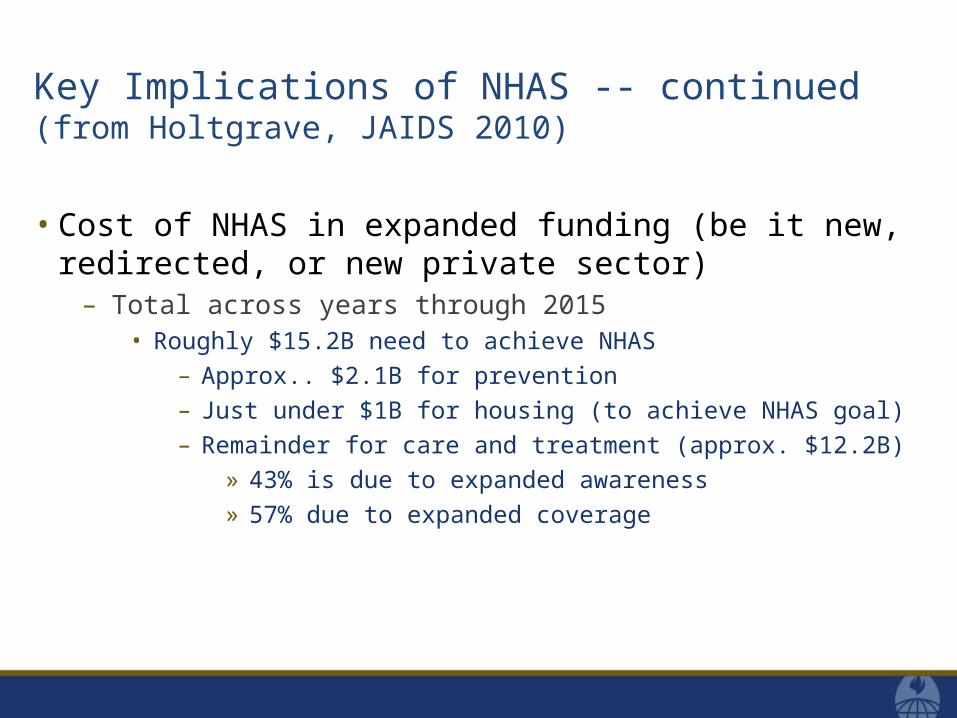
Key Implications of NHAS -- continued(from Holtgrave, JAIDS 2010)
• Cost of NHAS in expanded funding (be it new, redirected, or new private sector)
– Total across years through 2015• Roughly $15.2B need to achieve NHAS
– Approx.. $2.1B for prevention
– Just under $1B for housing (to achieve NHAS goal)
– Remainder for care and treatment (approx. $12.2B)
» 43% is due to expanded awareness
» 57% due to expanded coverage

Key Implications of NHAS - continued(from Holtgrave, JAIDS 2010)
– However, investing in NHAS could save money– Medical costs offset by HIV infections averted through expanded
prevention efforts– Net present value of medical care costs saved due to prevention efforts: $17.981B
– Savings larger than investments needed (cost saving)
– Bend the cost curve by bending the incidence curve– Choosing to not expand prevention efforts is the MORE expensive
policy option

CDC’s Total HIV Prevention Budget (Actual and Inflation-Adjusted)
Inflation-adjusted budget down 17.9% since FY02; buying power now approximates FY91

CDC UPDATE OF “GARDNER CASCADE”
Source: CDC MMWR Early Release Volume 60, November 29, 2011

ADAP Waiting Lists are the Tip of the Iceberg
10
http://coastal.er.usgs.gov/ocean-acidification/arcticcruise2011/journal/index.php/2011/08/20/icebergs/

Housing Opportunities for People With AIDS (HOPWA) Funding
Fiscal Year Funding Amount
2010 $335.0 million
2011 $334.3 million
2012 $332.0 million
President’s Request 2013 $330.0 million
Community Request: $427 million.National AIDS Housing Coalition Estimate: 140,000 PLWH in U.S. in immediate need of housing assistance
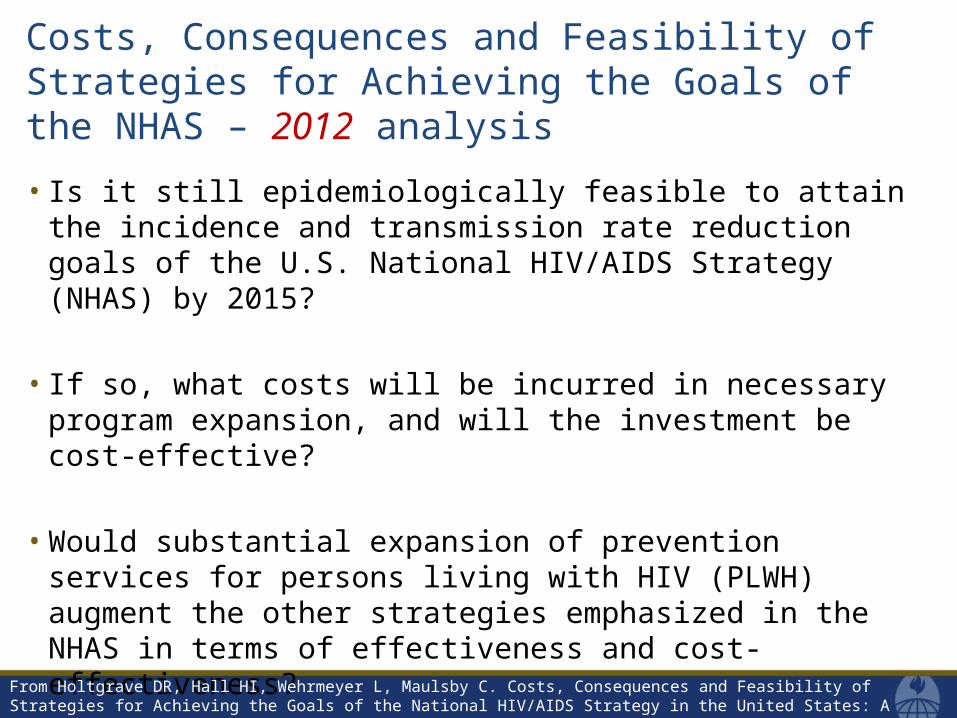
Costs, Consequences and Feasibility of Strategies for Achieving the Goals of the NHAS – 2012 analysis
• Is it still epidemiologically feasible to attain the incidence and transmission rate reduction goals of the U.S. National HIV/AIDS Strategy (NHAS) by 2015?
• If so, what costs will be incurred in necessary program expansion, and will the investment be cost-effective?
• Would substantial expansion of prevention services for persons living with HIV (PLWH) augment the other strategies emphasized in the NHAS in terms of effectiveness and cost-effectiveness?
From Holtgrave DR, Hall HI, Wehrmeyer L, Maulsby C. Costs, Consequences and Feasibility of Strategies for Achieving the Goals of the National HIV/AIDS Strategy in the United States: A Closing Window for Success? AIDS Behav. (2012).

Definition of scenarios for HIV service implementation strategies
Scenario name*
Assumed percentage of clients in care achieving suppressed
viral load, Year 2015 and beyond
Meet NHAS diagnosis goal of
90% by 2015?
Level of coverage of risk behavior change services for
PLWH
S694YMC 69.4% yes Minimal coverage
S694YFSC 69.4% yes Fully scaled-up coverage
S694NMC 69.4% no Minimal coverage
S694NFSC 69.4% no Fully scaled-up coverage
S807YMC 80.7% yes Minimal coverage
S807YFSC 80.7% yes Fully scaled-up coverage
S807NMC 80.7% no Minimal coverage
S807NFSC 80.7% no Fully scaled-up coverage
* All scenarios assume 85% care coverage by 2015 (with half-step toward achievement in 2014); up from baseline of 53.4% care coverage
From Holtgrave DR, Hall HI, Wehrmeyer L, Maulsby C. Costs, Consequences and Feasibility of Strategies for Achieving the Goals of the National HIV/AIDS Strategy in the United States: A Closing Window for Success? AIDS Behav. (2012).

Cost parameters (2011 dollars), costs saved per infection averted (2011 dollars), QALYs saved per infection averted
Cost per new diagnosis $10,085
Cost of prevention services for newly diagnosed PLWH $680
Cost of partner services $1,046
Total cost for new diagnosis $11,810
Annual care costs (includes $680 in prev. services) $28,382
Annual housing costs $12,039
Medical care costs saved in lifetime (public sector) $291,565
QALYs saved per transmission averted 5.33
From Holtgrave DR, Hall HI, Wehrmeyer L, Maulsby C. Costs, Consequences and Feasibility of Strategies for Achieving the Goals of the National HIV/AIDS Strategy in the United States: A Closing Window for Success? AIDS Behav. (2012).

Input parameter values: HIV transmission rates
Scenario name
Transmission rate, unaware
(TRU)
Transmission rate, aware, baseline through
2013 (TR2013)
Transmission rate, aware, 2014
(TR2014)
Transmission rate, aware, 2015 to 2020
(TR2015)
S694YMC .1020 .0276 .0251 .0219
S694YFSC .1020 .0276 .0251 .0138
S694NMC .1020 .0276 .0251 .0219
S694NFSC .1020 .0276 .0251 .0138
S807YMC .1020 .0276 .0251 .0186
S807YFSC .1020 .0276 .0251 .0113
S807NMC .1020 .0276 .0251 .0186
S807NFSC .1020 .0276 .0251 .0113
From Holtgrave DR, Hall HI, Wehrmeyer L, Maulsby C. Costs, Consequences and Feasibility of Strategies for Achieving the Goals of the National HIV/AIDS Strategy in the United States: A Closing Window for Success? AIDS Behav. (2012).

Outcome measures for evaluating eight scenarios vs. flat transmission rate comparator
• Annual incidence• Overall annual transmission rate• Incidence / 2010 incidence• Transmission rate / 2010 transmission rate• Cumulative infections averted• Cumulative QALYs saved• Cumulative gross policy cost• Gross savings of downstream costs• Ratio of savings to costs• Net cost per QALY saved
From Holtgrave DR, Hall HI, Wehrmeyer L, Maulsby C. Costs, Consequences and Feasibility of Strategies for Achieving the Goals of the National HIV/AIDS Strategy in the United States: A Closing Window for Success? AIDS Behav. (2012).

Summary results comparing HIV service implementation scenarios one at a time to a flat transmission rate comparison condition
• The incidence reduction and transmission rate reduction NHAS goals are met in three of the eight scenarios (S694YFSC, S807YMC, and S807YFSC).
• The incidence reduction and transmission rate reduction NHAS goals are narrowly missed in two other scenarios (S694YMC and S807NFSC).
• The best cost-utility ratios are obtained when both diagnostic efforts and prevention services for PLWH are scaled up.
• The least effective scenario is to meet the care goal of the NHAS but fail to achieve the awareness of seropositivity goal or fully scale up risk reduction services for PLWH.
• Care expansion alone averts the least number of infections, and the resultant cost-utility ratio is over the often-used $100,000 cost-effectiveness standard.
• Inclusion of enough expansion of testing services to achieve the seropositivity awareness goal, inclusion of fully scaled-up risk-reduction interventions for PLWH, or both all serve to substantially improve performance on the outcome measures and to move the results into a range easily considered cost-effective.
From Holtgrave DR, Hall HI, Wehrmeyer L, Maulsby C. Costs, Consequences and Feasibility of Strategies for Achieving the Goals of the National HIV/AIDS Strategy in the United States: A Closing Window for Success? AIDS Behav. (2012).
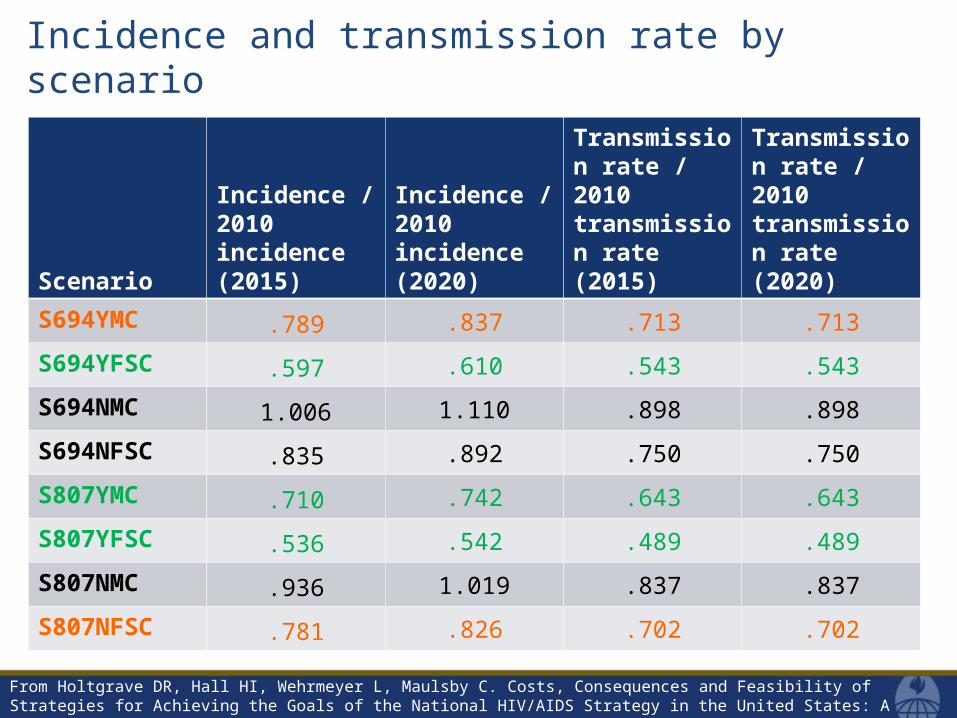
Incidence and transmission rate by scenario
From Holtgrave DR, Hall HI, Wehrmeyer L, Maulsby C. Costs, Consequences and Feasibility of Strategies for Achieving the Goals of the National HIV/AIDS Strategy in the United States: A Closing Window for Success? AIDS Behav. (2012).
Scenario
Incidence / 2010 incidence (2015)
Incidence / 2010 incidence (2020)
Transmission rate / 2010 transmission rate (2015)
Transmission rate / 2010 transmission rate (2020)
S694YMC .789 .837 .713 .713
S694YFSC .597 .610 .543 .543
S694NMC 1.006 1.110 .898 .898
S694NFSC .835 .892 .750 .750
S807YMC .710 .742 .643 .643
S807YFSC .536 .542 .489 .489
S807NMC .936 1.019 .837 .837
S807NFSC .781 .826 .702 .702

Comparison of incidence across all scenarios of HIV program expansion, and including flat transmission rate comparator condition
From Holtgrave DR, Hall HI, Wehrmeyer L, Maulsby C. Costs, Consequences and Feasibility of Strategies for Achieving the Goals of the National HIV/AIDS Strategy in the United States: A Closing Window for Success? AIDS Behav. (2012).
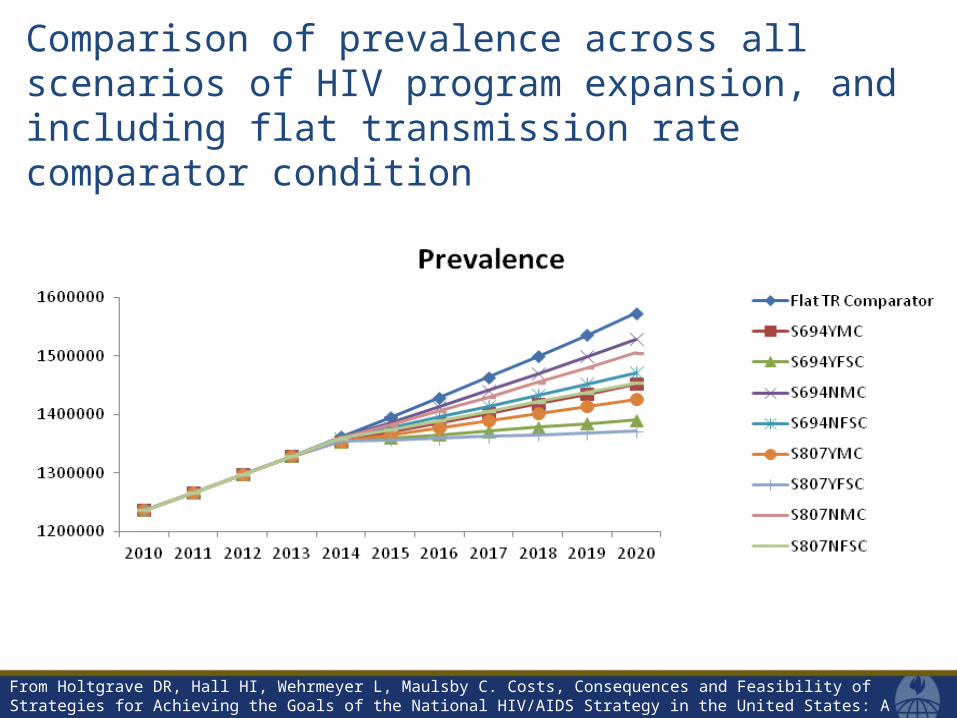
Comparison of prevalence across all scenarios of HIV program expansion, and including flat transmission rate comparator condition
From Holtgrave DR, Hall HI, Wehrmeyer L, Maulsby C. Costs, Consequences and Feasibility of Strategies for Achieving the Goals of the National HIV/AIDS Strategy in the United States: A Closing Window for Success? AIDS Behav. (2012).

Comparison of transmission rate across all scenarios of HIV program expansion, and including flat transmission rate comparator condition
From Holtgrave DR, Hall HI, Wehrmeyer L, Maulsby C. Costs, Consequences and Feasibility of Strategies for Achieving the Goals of the National HIV/AIDS Strategy in the United States: A Closing Window for Success? AIDS Behav. (2012).

Costs by scenario through 2015
Scenario name
Cost of additional
diagnoses*Cost of additional
housingCost of care and
treatment**
Cost of fully scaled-up risk reduction for
PLWH
Cumulative gross policy cost 2015
(discounted at 3%)
S694YMC $1,476,681,741 $363,859,450 $14,770,581,633 N/A $16,611,122,824
S694YFSC $1,476,681,741 $363,859,450 $14,770,581,633 $449,989,958 $17,061,112,782
S694NMC N/A $363,859,450 $13,398,713,227 N/A $13,762,572,676
S694NFSC N/A $363,859,450 $13,398,713,227 $401,015,141 $14,163,587,817
S807YMC $1,476,681,741 $363,859,450 $14,770,581,633 N/A $16,611,122,824
S807YFSC $1,476,681,741 $363,859,450 $14,770,581,633 $449,989,958 $17,061,112,782
S807NMC N/A $363,859,450 $13,398,713,227 N/A $13,762,572,676
S807NFSC N/A $363,859,450 $13,398,713,227 $401,015,141 $14,163,587,817
* Newly diagnosed PLWH also receive risk reduction services (included as approx. $85m in this cost total)
** PLWH receiving care under newly expanded services also receive risk reduction services (included as approx. $354m in “Y” scenarios, and approx. $321m in “N” scenarios)
From Holtgrave DR, Hall HI, Wehrmeyer L, Maulsby C. Costs, Consequences and Feasibility of Strategies for Achieving the Goals of the National HIV/AIDS Strategy in the United States: A Closing Window for Success? AIDS Behav. (2012).
Cost per QALY saved by scenario(one scenario at a time; relative to status quo)
Scenario nameNet cost per QALY saved 2015
(discounted at 3%)Net cost per QALY saved 2020
(discounted at 3%)
S694YMC $67,896 $50,742
S694YFSC $39,540 $20,088
S694NMC $182,036 $162,043
S694NFSC $89,230 $59,745
S807YMC $53,081 $33,884
S807YFSC $32,670 $13,344
S807NMC $129,702 $100,399
S807NFSC $72,877 $44,465
From Holtgrave DR, Hall HI, Wehrmeyer L, Maulsby C. Costs, Consequences and Feasibility of Strategies for Achieving the Goals of the National HIV/AIDS Strategy in the United States: A Closing Window for Success? AIDS Behav. (2012).

Incremental cost-effectiveness ratios comparing combinations of scenarios of HIV program expansion, as of Year 2020*
Scenario Comparison
Additional discounted gross program costs per additional
discounted HIV infection avertedS694YMC
vs.S694NMC
$101,759S694YFSC
vs.S694NFSC
$96,667
S694YFSCvs.
S694YMC$27,961
S694NFSCvs.
S694NMC$29,467
S807YMCvs.
S807NMC$98,198
S807YFSCvs.
S807NFSC$94,285
S807YFSCvs.
S807YMC$33,222
S807NFSCvs.
S807NMC$34,611
S694YFSCvs.
S694NMC$69,025
S807YFSCvs.
S807NMC$71,590
*entries lower than $291,565 indicate public sector costs savings
From Holtgrave DR, Hall HI, Wehrmeyer L, Maulsby C. Costs, Consequences and Feasibility of Strategies for Achieving the Goals of the National HIV/AIDS Strategy in the United States: A Closing Window for Success? AIDS Behav. (2012).
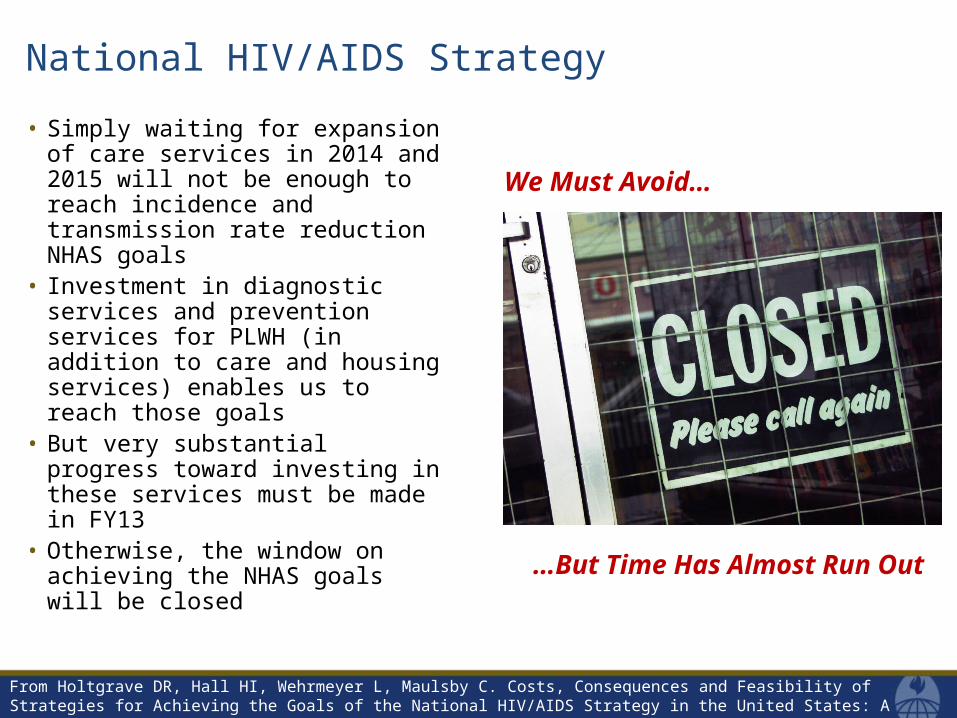
National HIV/AIDS Strategy
• Simply waiting for expansion of care services in 2014 and 2015 will not be enough to reach incidence and transmission rate reduction NHAS goals
• Investment in diagnostic services and prevention services for PLWH (in addition to care and housing services) enables us to reach those goals
• But very substantial progress toward investing in these services must be made in FY13
• Otherwise, the window on achieving the NHAS goals will be closed
We Must Avoid…
…But Time Has Almost Run Out
From Holtgrave DR, Hall HI, Wehrmeyer L, Maulsby C. Costs, Consequences and Feasibility of Strategies for Achieving the Goals of the National HIV/AIDS Strategy in the United States: A Closing Window for Success? AIDS Behav. (2012).
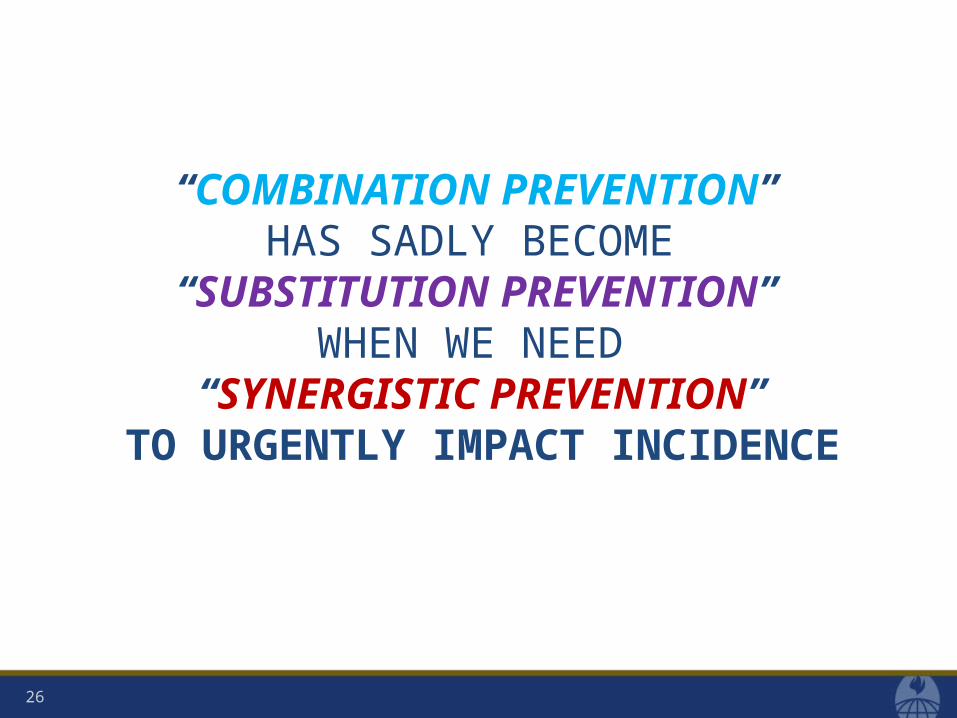
“COMBINATION PREVENTION” HAS SADLY BECOME
“SUBSTITUTION PREVENTION” WHEN WE NEED
“SYNERGISTIC PREVENTION”TO URGENTLY IMPACT INCIDENCE
26

HIV is transmitted during an act of unprotected risk behavior in a serostatus discordant partnership with virus present
In a serostatus discordant partnership…..
Unprotected transmission relevant risk behavior present
No unprotected transmission relevant risk behavior
Unsuppressed Viral Load Concentration of transmission Essentially no transmission
Suppressed Viral Load Essentially no transmission Essentially no transmission
27

Key US populations defined by HIV serostatus and relevance of various treatment-related prevention approaches
From: Holtgrave DR, Maulsby C, Wehrmeyer L, Hall HI. Behavioral Factors in Assessing Impact of HIV Treatment as Prevention. AIDS Behav. 2012
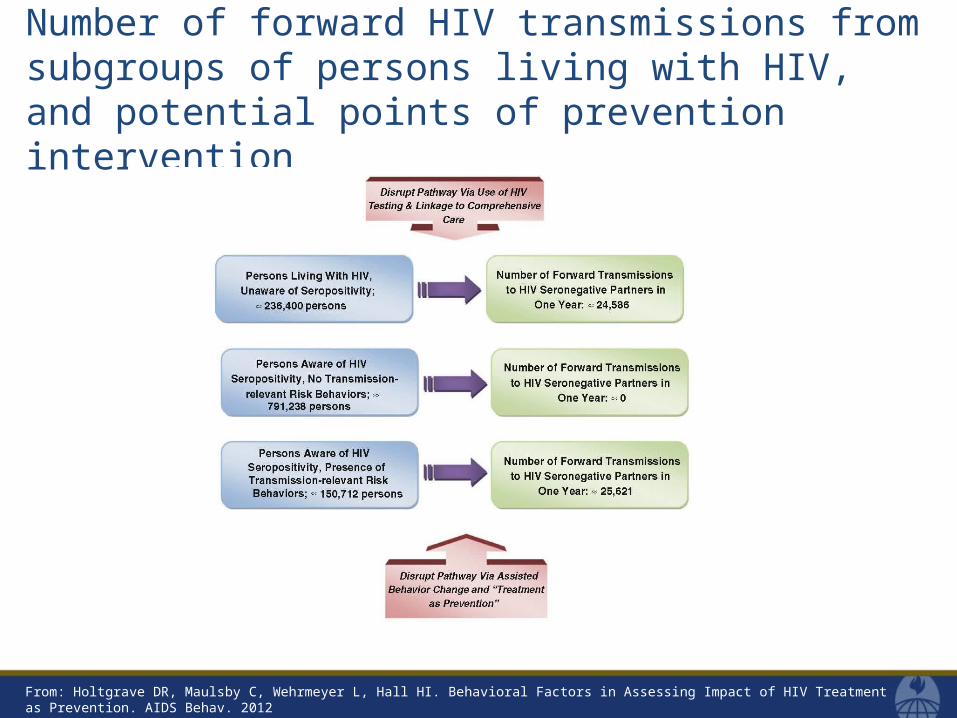
Number of forward HIV transmissions from subgroups of persons living with HIV, and potential points of prevention intervention
From: Holtgrave DR, Maulsby C, Wehrmeyer L, Hall HI. Behavioral Factors in Assessing Impact of HIV Treatment as Prevention. AIDS Behav. 2012

Key services needs of three subpopulations of persons living with HIV
From: Holtgrave DR, Maulsby C, Wehrmeyer L, Hall HI. Behavioral Factors in Assessing Impact of HIV Treatment as Prevention. AIDS Behav. 2012

As President Obama said on July 13, 2010…. “The question is not whether we know what to do, but whether we will do it.”