
© 2004 by David T. Olson Sample - Not for Public Use1 A Sample Presentation of The State of the...
49
© 2004 by David T. Olson Sample - Not for Public Use 1 A Sample Presentation of The State of the Church in Missouri and the Kansas City and St. Louis Metro Areas 1990-2000 Dave Olson www.TheAmericanChurch.org
-
Upload
sidney-hild -
Category
Documents
-
view
216 -
download
2
Transcript of © 2004 by David T. Olson Sample - Not for Public Use1 A Sample Presentation of The State of the...

© 2004 by David T. Olson Sample - Not for Public Use
1
A Sample Presentation of The
State of the Church in Missouri and
the Kansas City and St. Louis Metro
Areas
1990-2000
Dave Olsonwww.TheAmericanChurch.org

© 2004 by David T. Olson Sample - Not for Public Use
2
The first 20 slides are from the
“State of the Church in Missouri”
Powerpoint. The Complete Powerpoint is 43
slides in length, and is available at
http://www.theamericanchurch.org/state/UMO20.ht
m
.
It includes maps of church attendance in every
county, as well as denominational charts, average
size charts, church planting charts, ethnicity charts
and population growth information.

© 2004 by David T. Olson Sample - Not for Public Use
3
In 1996,
polls taken immediately after the Presidential election revealed that 58% of people claimed they had voted, when in reality only 49% actually did. This is called the Halo Effect. People tend to over-inflate their participation in activities that create acceptability within their social group.
For many decades, pollsters such as Gallup and Barna have reported that around 45% of Americans attend church every Sunday. But there is a religious Halo Effect. Actual attendance counts have shown that the percentage of people attending church on any given weekend is much lower than was previously thought.

© 2004 by David T. Olson Sample - Not for Public Use
4
The Intent of this presentation is to answer and then expand
on two key questions:
“How Many People Really Attend Church in Missouri Every Week?”
“Is the Christian Church Going Forwards or Backwards in Influence in Missouri?”
As the data is analyzed county by county assessing a number of factors, a comprehensive picture of the State of the Church in Missouri will begin to take shape.

© 2004 by David T. Olson Sample - Not for Public Use
5
This study
uses weekend church attendance as a more reliable and more immediate snapshot of Christian influence than membership. The following map shows the percentage of the population attending a Christian church on any given weekend in all 50 states in 2000. Missouri has an average church attendance percentage (21.5%) higher than the national average (18.7%).

© 2004 by David T. Olson Sample - Not for Public Use
6
3.1%UT
9.7%NV
11.2%ME
11.4%ID
11.8%NH
13.2%VT
13.4%HI
14.0%WY
14.0%WA
14.3%AZ
14.4%MA
14.5%OR
14.8%CA
15.1%AK
15.1%FL
15.2%CO
15.5%NY
16.0%NJ
16.0%DE
17.4%WV
17.5%MT
17.7%MD
17.8%NM
18.0%VA
17.2%CT
19.1%TX
20.1%RI
20.3%IL
20.3%OH
20.5%PA
20.6%MI
21.5%MO
21.7%IN
22.0%OK
22.1%KY
22.7%KS
22.7%NC
23.2%MN
23.3%SC
23.3%GA
23.5%TN
23.8%NE
24.6%WI
24.7%IA
25.0%AR
26.7%MS
26.9%AL
28.0%SD
28.6%DC
29.4%ND
29.4%LA
0.0% to 14.4%14.4% to 17.5%17.5% to 20.6%20.6% to 23.5%23.5% to 29.4%
Percentage of Population Attending a ChristianChurch on any Given Weekend 2000

© 2004 by David T. Olson Sample - Not for Public Use
7
The Next Map
shows the percentage of the population attending a Christian church on any given weekend in 2000 for each county in Missouri.

© 2004 by David T. Olson Sample - Not for Public Use
8
10.8%
Ralls
12.1%
Douglas
12.5%
Shannon
12.7%
Callaway
12.8%
Andrew
12.9%
Carter
13.2%
McDonald
13.3%
Ozark
13.9%
Butler
14.0%
Crawford
14.1%
Wayne
14.1%
Jefferson
14.8%
Saint Clair
14.9%
Cass
14.9%
Clark
15.0%
Ripley
15.1%
Bollinger
15.2%
Lincoln
15.5%
Christian
15.6%
Howard
16.1%
Newton
16.2%
Stone
16.5%
Pulaski
16.6%
Washington
16.7%
Ray
16.8%
Sullivan
16.9%
Stoddard
16.9%
Clinton
16.9%
Daviess
16.9%
Warren
17.1%
Camden
17.2%
Boone
17.2%
Adair
17.6%
Vernon
17.7%
New Madrid
18.5%
Benton
18.8%
Pike
19.0%
Taney
19.1%
Saint Charles
19.1%
Dallas
19.2%
Dunklin
19.2%
Iron
19.4%
Hickory19.5%
Phelps
19.5%
Lewis
19.7%
Saint Francois
19.8%
Dekalb
19.9%
Johnson
20.2%
Caldwell
20.5%
Saline
20.7%
Mississippi
20.8%
Atchison
20.8%
Miller
20.8%
Carroll
20.9%
Putnam
20.9%
Pemiscot
21.0%
Maries
21.0%
Clay
21.1%
Lawrence
21.2%
Randolph
21.4%
Morgan
21.4%
Sainte Genevieve
21.5%
Pettis
21.6%
Platte
21.7%
Henry
21.8%
Howell
21.8%
Nodaway
22.3%
Saint Louis22.5%
Franklin
22.7%
Webster
22.7%
Lafayette
23.2%
Scott
23.3%
Cooper
23.4%
Laclede 23.4%
Dent
23.5%
Texas
23.6%
Mercer
23.7%
Polk
23.7%
Harrison
23.8%
Linn
23.9%
Monroe
24.3%
Audrain
24.9%
Schuyler
25.0%
Barry
25.0%
Jackson
25.1%
Chariton
25.5%
Grundy
25.5%
Livingston
25.7%
Greene
25.7%
Scotland
25.9%
Moniteau
26.0%
Gasconade
26.0%
Saint Louis City
26.7%
Macon
26.8%
Dade
26.8%
Bates
26.9%
Barton
26.9%
Cedar
26.9%
Marion27.2%
Buchanan
27.4%
Perry
27.5%
Reynolds
28.0%
Gentry 28.3%
Knox
28.9%
Montgomery
28.9%
Cape Girardeau
29.0%
Jasper
29.9%
Wright
30.3%
Madison
30.8%
Osage
32.2%
Oregon
34.8%
Cole
35.7%
Worth
35.9%
Holt
39.3%
Shelby
0.0% to 19.1%19.1% to 23.6%23.6% to 40.3%
Missouri Counties 2000 Percentage of Population at
Worship in Christian
Churches on a Given Weekend
Blue = Lowest Rose = Middle
Beige = Highest

© 2004 by David T. Olson Sample - Not for Public Use
9
The Next 2 Maps
show the population numbers for each county in Missouri. The first map shows the population of each county. The second map shows the growth or decline in population for each county from 1990 – 2000 and highlights the slow population growth in most of the state. Eighteen counties in Missouri have declined in population over the last decade.

© 2004 by David T. Olson Sample - Not for Public Use
10
2,382
Worth 3,757
Mercer
4,170
Schuyler
4,361
Knox
4,983
Scotland
5,223
Putnam
5,351
Holt
5,941
Carter
6,430
Atchison
6,689
Reynolds
6,799
Shelby
6,861
Gentry7,219
Sullivan
7,416
Clark
7,923
Dade
8,016
Daviess
8,324
Shannon
8,438
Chariton
8,850
Harrison
8,903
Marion
8,940
Hickory
8,969
Caldwell
9,311
Monroe
9,542
Ozark
9,626
Ralls
9,652
Saint Clair
10,212
Howard
10,285
Carroll
10,344
Oregon
10,432
Grundy10,494
Lewis
10,697
Iron
11,597
Dekalb
11,800
Maries
12,029
Bollinger
12,136
Montgomery
12,541
Barton
13,062
Osage
13,084
Douglas
13,259
Wayne
13,427
Mississippi
13,509
Ripley
13,733
Cedar
13,754
Linn14,558
Livingston
14,827
Moniteau
14,927
Dent
15,342
Gasconade
15,661
Dallas
15,762
Madison
16,492
Andrew
16,653
Bates
16,670
Cooper
17,180
Benton
17,842
Sainte Genevieve
17,955
Wright
18,132
Perry
18,351
Pike
18,979
Clinton
19,309
Morgan
19,760
New Madrid
20,047
Pemiscot
20,454
Vernon
21,681
Macon
21,912
Nodaway
21,997
Henry
22,804
Crawford
23,003
Texas
23,344
Washington
23,354
Ray
23,564
Miller
23,756
Saline
24,525
Warren
24,663
Randolph
24,977
Adair
25,853
Audrain
26,992
Polk
28,289
McDonald
28,658
Stone
29,705
Stoddard
31,045
Webster
32,513
Laclede
32,960
Lafayette
33,155
Dunklin
34,010
Barry
35,204
Lawrence
37,051
Camden
37,238
Howell
38,944
Lincoln
39,403
Pettis
39,703
Taney
39,825
Phelps
40,422
Scott
40,766
Callaway
40,867
Butler
41,165
Pulaski
48,258
Johnson
52,636
Newton
54,285
Christian
55,641
Saint Francois
68,693
Cape Girardeau
71,397
Cole
73,781
Platte
82,092
Cass
85,998
Buchanan
93,807
Franklin
104,686
Jasper
135,454
Boone
184,006
Clay
198,099
Jefferson
240,391
Greene
283,883
Saint Charles348,189
Saint Louis City
654,880
Jackson
1,016,315
Saint Louis
0 to 20,00020,000 to 100,000100,000 to 1,016,316
Missouri Counties2000 Population

© 2004 by David T. Olson Sample - Not for Public Use
11
-48,496
Saint Louis City
-1,874
Pemiscot
-1,168
New Madrid
-1,027
Atchison
-1,015
Mississippi
-764
Chariton
-683
Holt
-463
Carroll
-143
Shelby
-142
Pulaski
-131
Clark
-131
Linn
-121
Knox-104
Grundy
-66
Schuyler
-58
Worth
-34
Livingston
-29
Iron
13
Gentry
28
Reynolds
34
Mercer
43
Dunklin
144
Putnam
151
Daviess
161
Scotland203
Nodaway
207
Monroe
233
Saline
261
Lewis
293
Randolph
381
Harrison
400
Adair
417
Madison
426
Carter
474
Dade
581
Howard
589
Caldwell
607
McDonald
673
Maries
711
Shannon
781
Montgomery
810
Stoddard
874
Oregon
893
Sullivan
927
Marion
944
Ozark
1,044
Osage
1,046
Scott
1,150
Ralls
1,195
Saint Clair
1,197
Wright
1,206
Ripley
1,208
Douglas
1,225
Dent1,229
Barton
1,336
Gasconade
1,383
Ray
1,410
Bollinger
1,413
Vernon1,484
Perry
1,527
Texas
1,605
Hickory
1,628
Bates
1,630
Dekalb
1,640
Cedar
1,716
Wayne
1,805
Sainte Genevieve
1,835
Cooper
1,853
Lafayette
1,860
Andrew
1,953
Henry
2,102
Butler
2,254
Audrain
2,382
Pike
2,384
Clinton
2,529
Moniteau
2,864
Miller
2,915
Buchanan
2,964
Washington
3,015
Dallas
3,321
Benton
3,631
Crawford
3,735
Morgan
3,966
Pettis
4,577
Phelps
4,743
Macon
4,968
Lawrence
4,991
Warren
5,166
Polk
5,355
Laclede
5,744
Johnson
5,791
Howell6,463
Barry
6,737
Saint Francois
7,060
Cape Girardeau7,292
Webster
7,818
Cole
7,957
Callaway
8,191
Newton
9,556
Camden
9,580
Stone
10,052
Lincoln
13,204
Franklin
14,142
Taney
14,221
Jasper
15,914
Platte
18,284
Cass
21,641
Christian
21,648
Jackson
22,786
Saint Louis
23,075
Boone
26,719
Jefferson
30,595
Clay
32,442
Greene
70,976
Saint Charles
-48,500 to 00 to 10,00010,000 to 70,977
Missouri Counties1990 - 2000 Population
Growth or Decline

© 2004 by David T. Olson Sample - Not for Public Use
12
The Next 2 Slides
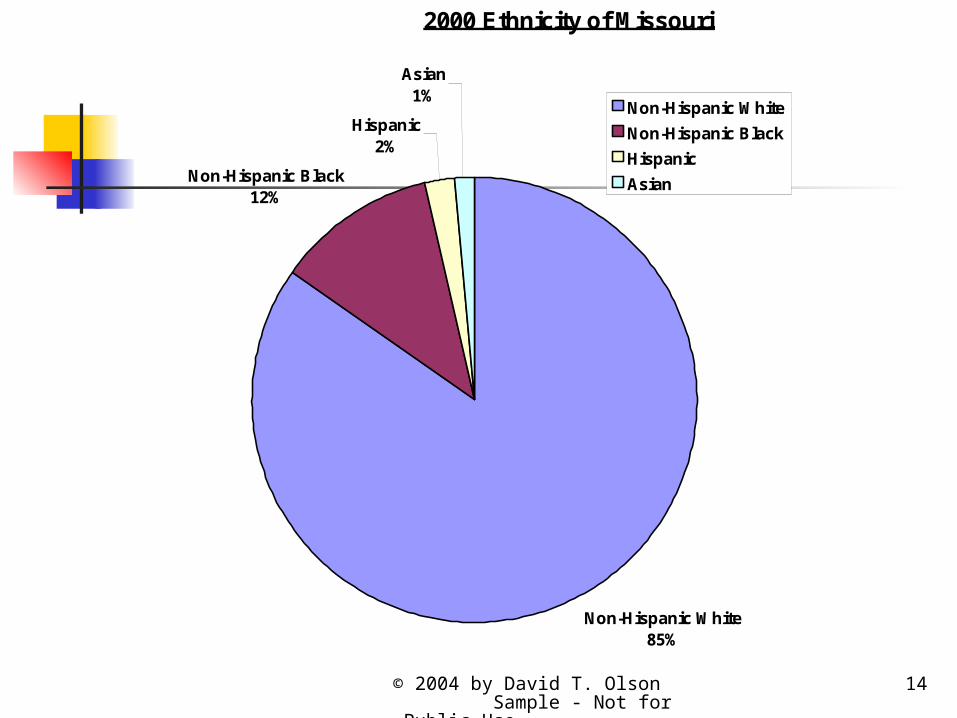
show the ethnicity of Missouri in 1990 and 2000. The third slide shows the growth or decline in the percentage of the population for each ethnic group.

© 2004 by David T. Olson Sample - Not for Public Use
13
1990 Ethnicity of Missouri
Non-Hispanic White87%
Non-Hispanic Black11%
Hispanic1%
Asian1%
Non-Hispanic White
Non-Hispanic Black
Hispanic
Asian
© 2004 by David T. Olson Sample - Not for Public Use
14
2000 Ethnicity of Missouri
Non-Hispanic White85%
Non-Hispanic Black12%
Hispanic2%
Asian1%
Non-Hispanic White
Non-Hispanic Black
Hispanic
Asian

© 2004 by David T. Olson Sample - Not for Public Use
15
-3.7%
8.9%
79.5% 78.6%
-10.0%
0.0%
10.0%
20.0%
30.0%
40.0%
50.0%
60.0%
70.0%
80.0%
Non-Hispanic White Non-Hispanic Black Hispanic Asian
Missouri 1990 - 2000 Growth or Decline in an Ethnic Group's Percentage of the Population

© 2004 by David T. Olson Sample - Not for Public Use
16
The Next Graph
shows the attendance numbers for the churches in Missouri in 1990 and 2000. Evangelical and total attendance have grown slightly, while Mainline and Catholic have declined. As overall worship attendance has declined, the population has changed. A more reliable standard for evaluating increasing or declining influence is the percentage of the population attending church on any given weekend, shown in the second graph. This graph reflects a decrease in the percentage of the population attending church for all groups.

© 2004 by David T. Olson Sample - Not for Public Use
17
649,123 690,980
195,224 189,918
336,439 319,130
1,182,468 1,201,834
-
200,000
400,000
600,000
800,000
1,000,000
1,200,000
1,400,000
1990
Eva
ng
elic
al
2000
Eva
ng
elic
al
1990
Mai
nlin
e
2000
Mai
nlin
e
1990
Cat
ho
lic
2000
Cat
ho
lic
1990
To
tal
2000
To
tal
Missouri Worship Attendance - 1990 & 2000

© 2004 by David T. Olson Sample - Not for Public Use
18
12.7% 12.3%
3.8% 3.4%
6.6%5.7%
23.1%
21.5%
0.0%
5.0%
10.0%
15.0%
20.0%
25.0%
Evangelical Mainline Catholic Total
Missouri Worship Attendance in 1990 & 2000 by Percentage of Population
1990
2000

© 2004 by David T. Olson Sample - Not for Public Use
19
The 3 Next Charts
show the relative strength of the 8 major denominational groups in Missouri. The first chart illustrates the dominance of the Catholic and Baptist churches. The second and third charts show the significant decline of all denominations in Missouri.

© 2004 by David T. Olson Sample - Not for Public Use
20
Missouri 2000 Church Attendance by "Denominational Family"
Baptist24%
Methodist8%
Lutheran6%
Reformed3%
Pentecostal7%Christian
10%
Catholic26%
Other16%
Baptist
Methodist
Lutheran
Reformed
Pentecostal
Christian
Catholic
Other

© 2004 by David T. Olson Sample - Not for Public Use
21
5.2% 5.1%
1.9%1.7%
1.3% 1.2%
0.7% 0.6%
1.7% 1.6%
2.2% 2.1%
6.6%
5.7%
3.6%3.4%
0.0%
1.0%
2.0%
3.0%
4.0%
5.0%
6.0%
7.0%
Baptist Methodist Lutheran Reformed Pentecostal Christian Catholic Other
Missouri 1990-2000 Percentage of the Population Attending Churches by "Denominational Family"
1990
2000

© 2004 by David T. Olson Sample - Not for Public Use
22
-1.8%
-6.4% -6.4%
-8.7%
-4.3%
-2.4%
-13.3%
-7.6%
-14.0%
-12.0%
-10.0%
-8.0%
-6.0%
-4.0%
-2.0%
0.0%
Baptist Methodist Lutheran Reformed Pentecostal Christian Catholic Other
Missouri 1990-2000 Increase or Decline in Percentage of the Population Attending Christian Churches by "Denominational Family"
Baptist
Methodist
Lutheran
Reformed
Pentecostal
Christian
Catholic
Other

© 2004 by David T. Olson Sample - Not for Public Use
23
The Complete Missouri Powerpoint is 43
slides in length, and is available at http://www.theamericanchurch.org/state/MO20.htm.
It includes maps of church attendance in every
county in the metro area, as well as denominational
charts, average size charts, church planting charts,
ethnicity charts and population growth information.

© 2004 by David T. Olson Sample - Not for Public Use
24
The next 11 slides are from the
“State of the Church in Kansas City”
Powerpoint. The Complete Powerpoint is 50
slides in length, and is available at
http://www.theamericanchurch.org/metro/KansasCity.htm.
It includes maps of church attendance in every
county in the metro area, as well as denominational
charts, average size charts, church planting charts,
ethnicity charts and population growth information.

© 2004 by David T. Olson Sample - Not for Public Use
25
The Next Map
shows the attendance numbers for the churches in the Kansas City Metro in 1990 and 2000. Most noteworthy is that Evangelical, Mainline and Catholic churches grew numerically. However, as population has grown, the percentage of the population attending Mainline and Catholic churches has declined. This is a more reliable standard for evaluating increasing or declining influence. The percentage of the population attending church on any given weekend is shown in the second graph.

© 2004 by David T. Olson Sample - Not for Public Use
26
178,444
201,974
71,451 76,213
102,919 107,883
356,265
390,176
-
50,000
100,000
150,000
200,000
250,000
300,000
350,000
400,000
1990Evangelical
2000Evangelical
1990 Mainline 2000 Mainline 1990 Catholic 2000 Catholic 1990 Total 2000 Total
Kansas City MSA Worship Attendance 1990 & 2000

© 2004 by David T. Olson Sample - Not for Public Use
27
11.3% 11.4%
4.5% 4.3%
6.5%6.1%
22.5%22.0%
0.0%
5.0%
10.0%
15.0%
20.0%
25.0%
Evangelical Mainline Catholic Total
Kansas City MSA 1990 & 2000 Percentage of Population at Worship
1990
2000

© 2004 by David T. Olson
0.9%
-4.9%
-6.6%
-2.4%
-7.0%
-6.0%
-5.0%
-4.0%
-3.0%
-2.0%
-1.0%
0.0%
1.0%
Evangelical Mainline Catholic Total
Kansas City MSA Growth or Decline in Worship Percentage 1990 - 2000

© 2004 by David T. Olson Sample - Not for Public Use
29
The Next Chart
shows the 1990 & 2000 average church attendance by group for both this metro area and the nation. The second chart shows the 1990 & 2000 population per church for this state and the nation.
In 2000, Arkansas had the lowest population per church ratio with 411 people per church. Utah had the highest ratio with 4,586 people per church.

© 2004 by David T. Olson Sample - Not for Public Use
30
158 172
124 131 136153
112 115
872
981
794 794
201218
172 175
-
100
200
300
400
500
600
700
800
900
1,000
Evangelical Mainline Catholic Total
1990 & 2000 Kansas City MSA Average Church Attendance
1990 Kansas City MSA
2000 Kansas City MSA
1990 US Average
2000 US Average

© 2004 by David T. Olson Sample - Not for Public Use
31
891
843
993
939
750
800
850
900
950
1,000
1990 2000
1990 & 2000 Kansas City MSA Population per Church
State
National

© 2004 by David T. Olson Sample - Not for Public Use
32
The First Factor
to evaluate is the Percentage of the Population that attends a worship service on any given weekend. The first map shows the 2000 percentage for all orthodox Christian churches.

© 2004 by David T. Olson Sample - Not for Public Use
33
Kansas City Metro - Percentage of Population Attending a ChristianChurch on any Given Weekend
by County in 2000
14.1%
Leavenworth
19.8%
Wyandotte
21.8%
Johnson
21.4% - 25.0%
21.0%
Clay
16.7%
Ray
16.7%
Clinton
25.0%
Jackson
21.6%Platte
14.9%
Cass
22.7%
Lafayette
19.1%
Miami
17.0% - 21.4%
14.0% - 17.0%

© 2004 by David T. Olson Sample - Not for Public Use
34
The Next Map
shows the 2000 growth or decline in the percentage of the population that attends a worship service on any given weekend for all Mainline churches.

© 2004 by David T. Olson Sample - Not for Public Use
35
Kansas City Metro - Growth or Decline in Percentage of Population Attending a Mainline Church
on any Given Weekend by County - 1990-2000
- 23 %
Leavenworth
- 19 %
Wyandotte
4 %
Johnson
Decline
Growth
- 7 %
Clay
- 26 %
Ray
- 4 %
Clinton
- 2 %
Jackson
- 12 %
Platte
- 28 %
Cass
- 20 %
Lafayette
- 10 %
Miami

© 2004 by David T. Olson Sample - Not for Public Use
36
The Complete Kansas City Powerpoint is 49
slides in length, and is available at http://www.theamericanchurch.org/metro/KansasCity.htm.
It includes maps of church attendance in every
county in the metro area, as well as denominational
charts, average size charts, church planting charts,
ethnicity charts and population growth information.

© 2004 by David T. Olson Sample - Not for Public Use
37
The next 9 slides are from the
“State of the Church in St. Louis ”
Powerpoint. The Complete Powerpoint is 46
slides in length, and is available at
http://www.theamericanchurch.org/metro/StLouis.htm.
It includes maps of church attendance in every
county in the metro area, as well as denominational
charts, average size charts, church planting charts,
ethnicity charts and population growth information.

© 2004 by David T. Olson Sample - Not for Public Use
38
The Next Map
shows the percentage of the population attending a Christian church on any given weekend in 2000 for each county in the St. Louis area.
The St. Louis MSA (Metropolitan Statistical Area) consists of Franklin, Jefferson, Lincoln, Saint Charles, Saint Louis, Saint Louis City, and Warren (MO), Clinton, Jersey, Madison, Monroe, and Saint Clair counties (IL).

© 2004 by David T. Olson Sample - Not for Public Use
39
St. Louis Metro Area 2000 Percentage of the Population Attending a Christian Church on Any
Given Weekend26.0%
Saint Louis City
16.9%
Warren
15.2%
Lincoln
22.5%
Franklin
22.3%
Saint Louis
14.1%
Jefferson
19.1%
Saint Charles
22.4%
Saint Clair
23.2%
Jersey
26.9%
Clinton
26.6%
Monroe
21.4%
Madison

© 2004 by David T. Olson Sample - Not for Public Use
40
The Next Graph
shows the attendance numbers for the churches in the St. Louis area in 1990 and 2000. Evangelical churches have grown, while Mainline and Catholic churches have declined in attendance numbers. As population has grown however, a more reliable standard for evaluating increasing or declining influence is the percentage of the population attending church on any given weekend, shown in the second graph.

© 2004 by David T. Olson
251,530264,001
80,683 74,200
256,435
224,909
590,555
564,964
-
100,000
200,000
300,000
400,000
500,000
600,000
1990Evangelical
2000Evangelical
1990 Mainline 2000 Mainline 1990 Catholic 2000 Catholic 1990 Total 2000 Total
St. Louis MSA Worship Attendance 1990 & 2000

© 2004 by David T. Olson
10.1% 10.1%
3.2% 2.8%
10.3%
8.6%
23.7%
21.7%
0.0%
5.0%
10.0%
15.0%
20.0%
25.0%
Evangelical Mainline Catholic Total
St. Louis MSA 1990 & 2000 Percentage of Population at Worship
1990
2000

© 2004 by David T. Olson Sample - Not for Public Use
43
The Next Map
shows the growth or decline in the percentage of the population attending a Christian church on any given weekend from 1990 to 2000 for each county. No counties in the St. Louis area grew in attendance percentage and twelve declined.

© 2004 by David T. Olson Sample - Not for Public Use
44
St. Louis Metro Area 1990 – 2000 Growth or Decline in Christian Church Attendance
-9.5%
Saint Louis City
-9.4%
Warren
-27.5%
Lincoln
-4.2%
Franklin
-3.6%
Saint Louis
-7.5%
Jefferson
-6.6%
Saint Charles
-3.5%
Saint Clair
-24.0%
Jersey
-13.1%
Clinton
-33.2%
Monroe
-13.7%
Madison

© 2004 by David T. Olson Sample - Not for Public Use
45
The Next Chart
shows the net increase in the number of churches in the St. Louis metro area from 1990 - 2000. The net increase equals the number of new churches started minus the number of closed churches. There was a net gain of 38 churches. However, to keep up with the population growth in the St. Louis area, there would have needed to have been a net gain of 79 churches from 1990 - 2000. This chart reveals a net gain smaller than needed to keep with population growth. Since closure rates of churches tend to remain constant, the low numbers reflect a smaller than normal number of new churches started.

© 2004 by David T. Olson
82
-19-22
38
79
-40
-20
0
20
40
60
80
100
Evangelical Mainline Catholic Total Gain Increase Needed toMaintain 1990 Ratio of
Churches toPopulation
St. Louis MSA Net Growth in Number of Churches 1990 - 2000

© 2004 by David T. Olson Sample - Not for Public Use
47
The Complete St. Louis Powerpoint is 46
slides in length, and is available at http://www.theamericanchurch.org/metro/StLouis.htm.
It includes maps of church attendance in every
county in the metro area, as well as denominational
charts, average size charts, church planting charts,
ethnicity charts and population growth information.

© 2004 by David T. Olson Sample - Not for Public Use
48
This Presentation
is based on a nationwide study of American church attendance, as reported by churches and denominations. The database currently has average worship attendances for each of the last 10 years for over 200,000 individual churches.
It also uses supplementary information (actual membership numbers correlated with accurate membership to attendance ratios) to project the attendances of all other denominational and independent churches. All told, accurate information is provided for over 300,000 orthodox Christian churches.1
1 This presentation looks only at people attending orthodox Christian churches. Approximately 3 million people attend non-orthodox Christian churches, and perhaps 3 million attend a religious service of another religion. Those ‘houses of worship’ would add another 35,000 churches in the United States and increase the 2000 percentage to 20.5%.

© 2004 by David T. Olson Sample - Not for Public Use
49
For More Information . . . Please go to www.theamericanchurch.org for additional
information on the American Church. 12 Surprising Facts about the American Church is available at
http://www.theamericanchurch.org/12supm.htm
The complete Missouri Powerpoint presentation is available at http://www.theamericanchurch.org/state/UMO20.htm
The Complete Kansas City Powerpoint presentation is available at http://www.theamericanchurch.org/metro/KansasCity.htm
The Complete St. Louis Powerpoint presentation is available at http://www.theamericanchurch.org/metro/StLouis.htm
A Combo Pack (12 Surprising Facts, Missouri, Kansas City & St. Louis Powerpoints) is available at http://www.theamericanchurch.org/combo/MO0.htm