
For · 1-1-689 and NAVAIR 16-1-540, are a step in the right direction. However, compulsory MIL...
27
COMPONENT PART NOTICE THIS PAPER IS A COMPONENT PART OF THE FOLLOWING COMPILATION REPORT: TITLE: Workshop on Avionics Corrosion Control: Meeting of the Structures and Materials Panel of AGARD (62nd) Held in Hovik (Norway) on 16-17 April 1986. To ORDER THE COMPLETE COMPILATION REPORT, USE AD-A194 868 THE COMPONENT PART IS PROVIDED HERE TO ALLOW USERS ACCESS TO INDIVIDUALLY AUTHORED SECTIONS OF PROCEEDING, ANNALS, SYMPOSIA, ETC. HOWEVER, THE COMIPONENT SHOULD BE CONSIDERED WITHIN THE CONTEXT OF THE OVERALL COMPILATION REPORT AND NOT AS A STAND-ALONE TECHNICAL REPORT, THE FOLLOWING COMPONENT PART NUMBERS COMPRISE THE COMPILATION REPORT: AD-P005 750 thru AD-PO05 754 A)#:_ _ _AD#: AD#: AD#:- _ AD#: AD#:-_ ___ _ Accession For DTIC NTA BPA&Z ELECTE DTIC TAB Unannouced JUL 1 3 1988 Justif icatlion By. E Distributilon/ Availability Codeg A aliad/ew , t Specil, T FORM DTICAR 6 3 • OPI: DTIC-TID i. IAR.,. 85,.M I
-
Upload
truongngoc -
Category
Documents
-
view
217 -
download
2
Transcript of For · 1-1-689 and NAVAIR 16-1-540, are a step in the right direction. However, compulsory MIL...

COMPONENT PART NOTICE
THIS PAPER IS A COMPONENT PART OF THE FOLLOWING COMPILATION REPORT:
TITLE: Workshop on Avionics Corrosion Control: Meeting of the Structures and
Materials Panel of AGARD (62nd) Held in Hovik (Norway) on 16-17 April 1986.
To ORDER THE COMPLETE COMPILATION REPORT, USE AD-A194 868
THE COMPONENT PART IS PROVIDED HERE TO ALLOW USERS ACCESS TO INDIVIDUALLYAUTHORED SECTIONS OF PROCEEDING, ANNALS, SYMPOSIA, ETC. HOWEVER, THE COMIPONENTSHOULD BE CONSIDERED WITHIN THE CONTEXT OF THE OVERALL COMPILATION REPORT ANDNOT AS A STAND-ALONE TECHNICAL REPORT,
THE FOLLOWING COMPONENT PART NUMBERS COMPRISE THE COMPILATION REPORT:
AD-P005 750 thru AD-PO05 754A)#:_ _ _AD#:
AD#: AD#:- _
AD#: AD#:-_ ___ _
Accession For DTICNTA BPA&Z ELECTEDTIC TAB
Unannouced JUL 1 3 1988Justif icatlion
By. EDistributilon/Availability Codeg
A aliad/ew, t Specil,
T FORM
DTICAR 63 • OPI: DTIC-TID
i. IAR.,. 85,.M I

2-1
CORROSION OF ELECTRONIC COMPONENTS
by
Dr Bill Dobbs
Electronic Failure Analysis GroupAir Force Wright Aeronautical Laboratories/Materials Laboratory
Wright-Patterson AFB O 45433-6533USA
SUMMARY ~ AA
The Materials Laboreee Electronic Failure Analysis Group supportsa V,#i - Forc' elec-
tronic systems in the areas of materials and manufacturing processes. It has been establishedS that a large majority of electronic failures are caused by materials and manufacturing process
defects. We have found that corrosion of electronic components is the cause of failure in about20% of the items submitted to us for investigation.
Airframe corrosion prevention uequirements are well specified by MIL-STD-1568, MIL-STD-
1587, T.O. 1-1-2, and MIL-STD-889. ":t would be beneficial to the Air Force if corrosion pre-vention in electronic systems were C4e&.well documented. Existing documents, such as T.O.1-1-689 and NAVAIR 16-1-540, are a step in the right direction. However, compulsory MIL speci-fications should be applied to Air Force electronic corrosion prevention. This is essentialbecause corrosion in Air Force electionU systems contributes significantly to system failure.
Failure analysis investigations lAhwhich we have been concerned inclm4 aircraft circuitbreakers, an antenna, printed wiring boards, a fuse, a linear steering position transducer, astepper motor, an accelerometer, a disk recorder head, and electrical connectors wi-l-lbo pre-sented. The cause of failure,,6+ -bo identified and possible means of preventing similarfailures,will b& presented.
I. INTRODUCTION
The Electronic Failure Analysis Group of the Air Force Wright Aeronautical Laboratories'Materials Laboratory has investigated a large number of electronic and electrical failures. Ithas been established that about eighty-three percent of these failures are caused by materialsand manufacturing process defects. Also, it has been verified that about twenty percent of thefailures are caused by corrosion problems.
II. ANALYSIS TECHNIQUES
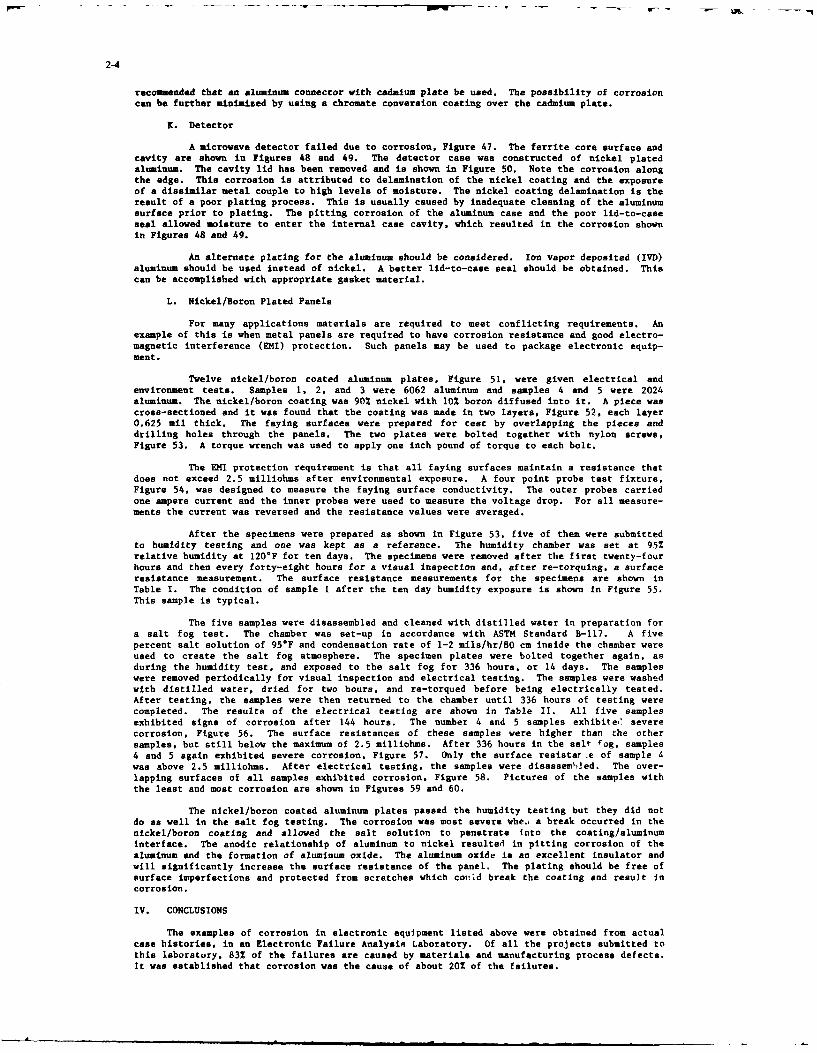
Moisture and contamination penetration into electronic systems has many detrimentaleffects, corrosion being one of these. In most electronic systems the geometries have beenminimized for faster signal processing and higher density. This means that most metallizationsare thin, or small in cross-sectional area, and that the individual metallizations are closetogether. In systems such as this, trace amounts of moisture and contamination may cause systemfailure. If the aluminum metallized surface of an integrated circuit is contaminated and ifmoisture is present, a slight amount of corrosion may result in an open integrated circuitconductor. This extreme sensitivity requires special caution when dealing with corrosion inelectronic systems. Failure modes in electronic components and systems may be identified andrelated to field failures with environmental testing techniques. Figure 1 shows a typicaltwenty-four hour temperature and humidity cycle.
111. EXAMPLES OF ELECTRONIC AND ELECTRICAL CORROSION
The following are a few representative examples of corrosion induced failures.
A. Circuit Breakers
Numerous aircraft circuit breakers, Figure 2, have been identified as failed becausetheir contact resistance when closed was considered too high. A number of circuit breakers fromseveral different manufacturers were tested in the laboratory to determine the cause of the highresistance. The circuit break contacts were identified as either tungsten/silver or cadmium/-silver mixtures. Nine circuit breakers were exposed to a ten day humidity test (40*C and 95%RH). A destructive physical analysis of the parts found a small amount of corrosion on thetungsten/silver contacts. Because of this, a twenty day humidity test (49*C and 95% RH) wasconducted on two contacts which had been cross-sectioned. After the twenty day test, thetungsten silver contacts were severely corroded while the cadmium/silver contacts exhibited verylittle corrosion, Figures 3 and 4.
A forty-eight hour salt fog test (35°C, 5% NaCl, pH 6.5 to 7.2, 1 to 2 cc/hr/80 cm'condensation rate) was conducted on seven of the circuit breakers. Two of the circuit breakersfailed. This was caused by salt condensation on the contacts, Figure 5.
The results of our analysis indicate that the tungsten/silver contacts corrode muchworse than the cadmium/silver contacts, Braze fluxes used to Joint the contacts to the copper
arm may contribute to corrosion.. The contacts in all circuit breakers are improved by themechanical wiping action of opening end closing the contacts several times. This should be doneat periodic intervals. If the conduction of large currents is not required the cadmium/silvercontacts show superior resistance to corrosion.

2-2
B. Antenna Marker Beacon
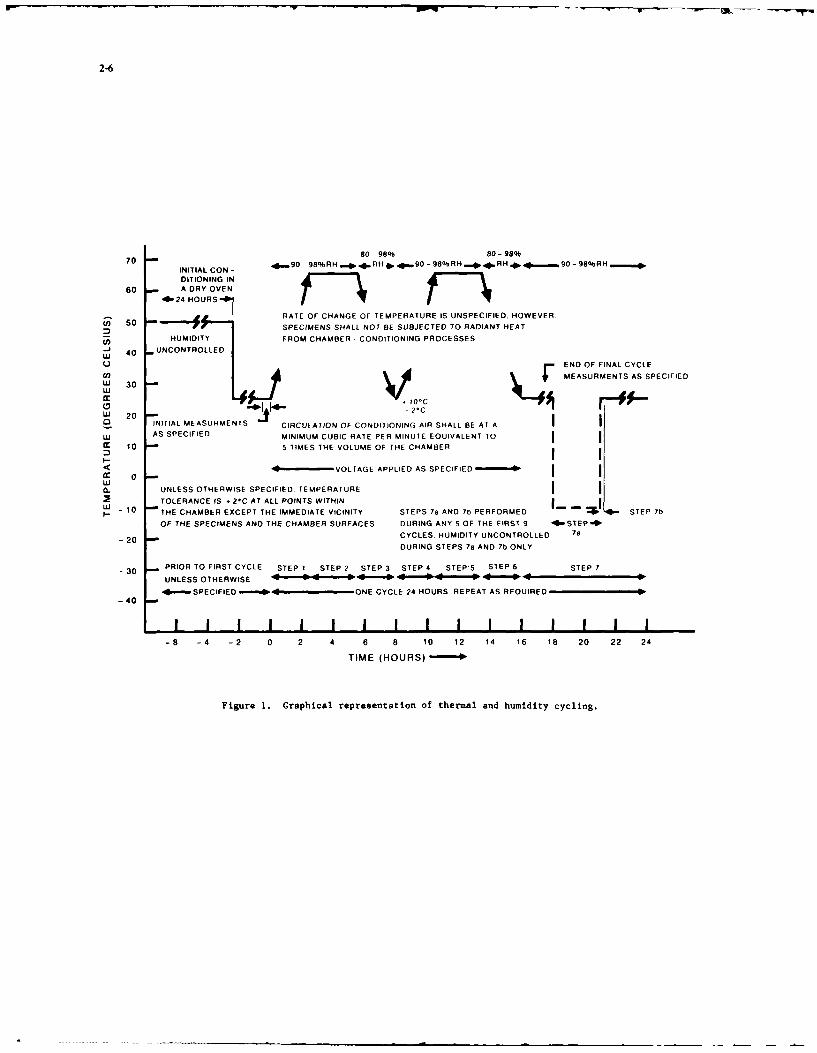
A corroded antenna marker beacon, Figure 6, was removed from an aircraft so that thesource of corrosion could be determined. The beacon was x-rayed, Figure 7, and corrosion siteswere visible in the radiograph. The antenna was opened and found to contain a polyamide foam,Figure 8. The antenna blade was removed from the foam, Figure 9, and found to be corroded too.Both the housing and blade were found to be aluminum. The housing was found to be plated withelectroless nickel, Figure 10, and the blade was plated with a copper strike followed with a tinplate, Figure 11. It is believed that both the nickel plate and the copper/tin plate wereporous. This permitted the penetration of moisture to the plating and aluminum interface. Thepresence of moisture and the anodic relationship of aluminum to nickel, or tin, resulted in agalvanic cell which caused pitting corrosion in the aluminum, Figures 12 and 13. These platingsystems were used to maintain a high electrical surface conductance on the aluminum components.The corrosion has resulted in non-conductive surfaces which affect the electrical performance ofthe antenna. It was recommended that instead of plating the aluminum a chromate conversioncoating be used.
C. Printed Wiring Boards
1. Flux Contamination
a. Dual In-line Packages
A printed wiring board was removed from an aircraft because of short circuitson the board, Figure 14. Blue-green corrosion products appeared around and under Dual In-linePackages (DIPs) on the board, Figure 15. A scanning electron microscope was used to analyze thecorrosion products with characteristic x-ray analysis. Copper chloride was detected in thecorrosion residue. Chlorides are a common contamination resulting from active solder fluxes andpoor cleaning processes. It was recommended that a rosin type solder flux be used and that aboard cleanliness test be performed after cleaning.
b. Conductor Traces
A ground base radar system was removed from nine months of storage to betested. All electrical systems failed due to short circuits in many of the multilayer printedwiring boards. Upon examination the printed wiring boards appeared to have corroded conductortraces. Contamination and corrosion products had migrated to regions between conductor tracesso that they were shorted out. See Figures 16 and 17. With characteristic x-ray analysis itwas established that the contamination resulted from solder flux. A different cleaning pro-cedure was recommended.
2. Flux on Board Components
Components from a printed wiring board have also been found to be contaminatedwith solder fluxes. Figure 18 shows a diode taken from a board. Figure 19, shows the corrodedleads on this diode. Inadequate removal of flux residues causes many corrosion problems.
3. Water Soluble Flux
The use of a highly reactive solder flux may sometimes have unexpected con-sequences. Of course, the reactive flux mAkes the soldering procedure easier. Components orboards which have poor solderability may sometimes be used, or, some other device defects may beovercome but usually the reactive flux contaminates some parts of the electronic system so thatit eventually causes more problems than it fixed.
A reactive water soluble flux was used on a number of printed wiring boardsbecause some of the component leads exhibited poor solderability. The flux had a high chlorinecontent. During the soldering operation some of these chlorides were absorbed in the epoxy/-fiber glass board surface. After soldering, the boards are cleaned and conformally coated.This traps the flux near the surface of the board. The board cross-section is shown in Figure20. The x-ray map for this area is shown in Figure 21. This chlorine may eventually affect thecopper conductors in the board because the conformal coating will absorb moisture which couldresult in hydrochloric acid. Without the reactive water soluble flux this chloride stirfacecontamination does not occur. If the components to be soldered are handled properly thesoldering operation may be accomplished with less reactive fluxes. This is the best procedure.
D. Vacuum Tubes
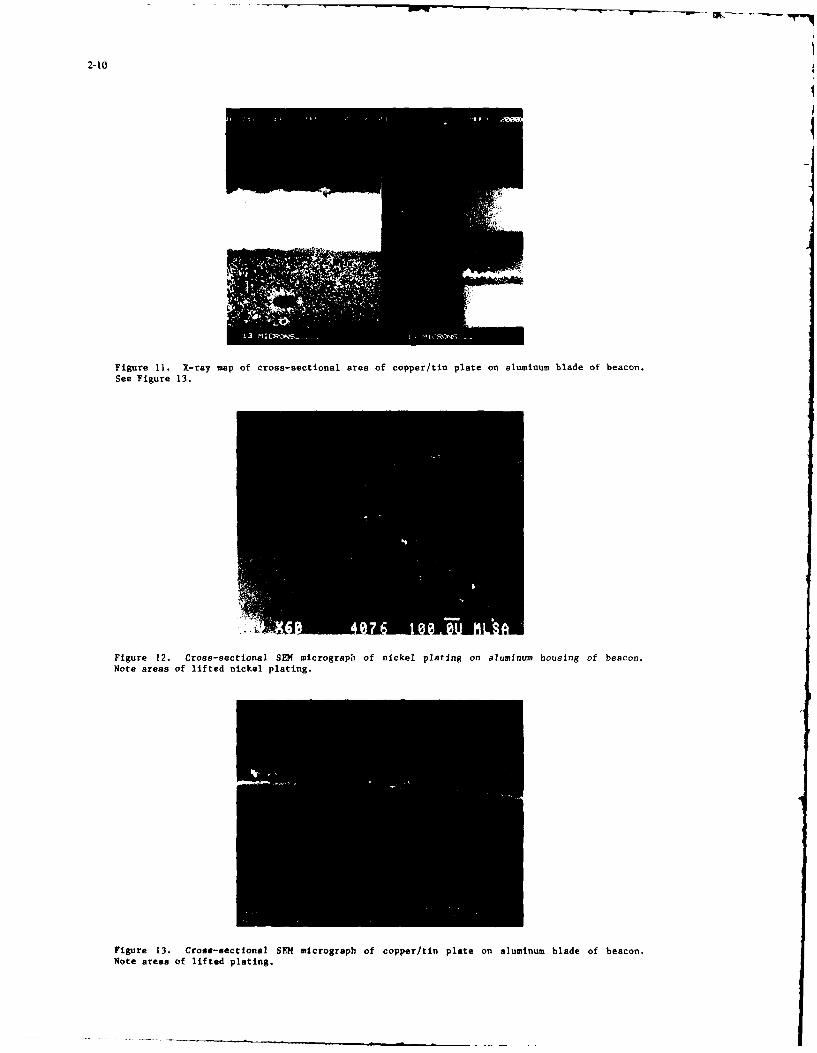
Triode amplifier tubes were failing due to severe corrosion exterior and interior tothe tubes, Figure 22. It was determined that the contaminant was a chloride and its source wasmost likely a highly corrosive chloride flux. Figure 23 shows localized corrosion on theoutside of the tube and Figures 24 and 25 show the corrosion on the inside of the tube. Figure26 shows a tube cross-section with the entrapped green corrodent clearly visible. It wasrecommended that all fluxes be thoroughly cleaned from the tube before sealing.
E. Fuse
After storage for several years some fuses were tested. The fuse failure rate wasexceedingly high. The cause of this high failure rate required identification. Figure 27 showsthe electronics when removed from the package. Note the white vibration dampening foam betweenthe circular printed wiring boards. Upon analysis the foam was identified as polyvinyl

2-3
chloride. The circular boards were examined and it was found that they were heavily con-taminated with chlorides. One of the boards was placed in a huuidity cabinet for twenty-fourhours with the results shown in Figures 28 and 29. Several failed plastic encapsulated tran-sistors were opened, Figures 30 and 31. The arrow in Figure 30 marks the region in which thealuminum metallization was completely melted. The transistor surface was heavily contaminatedwith chlorides. It was found that these chloride contaminates were originating from the vibra-tion dampening foam. The chloride penetrated the transistor by wicking up the metal leadsextending through the plastic package. The polyvinyl chloride foam was replaced with a poly-acrylic elastomer foam. The new foam material does not emit chloride contamination.
F. Steering Potentiometer
A linear feedback potentiometer is often used in the steering system for an aircraftnose wheel. A potentiometer of this type is shown in Figure 32. Several failures of thisdevice have been observed. The cause of these failures was investigated. It was found that theends of the potentiometer were exposed to the environment. Sufficient moisture and contami-nation were collected on the potentiometer in this area to cause corrosion. Figures 33 and 34show corrosion products collecting on the glass header insulation around the incoming electricalwires. These corrosion products were shorting out the electrical leads on the potentiometer.The problem was corrected by providing this area of the potentiometer with sufficient protectionto prevent the entrance of the moisture and the contamination.
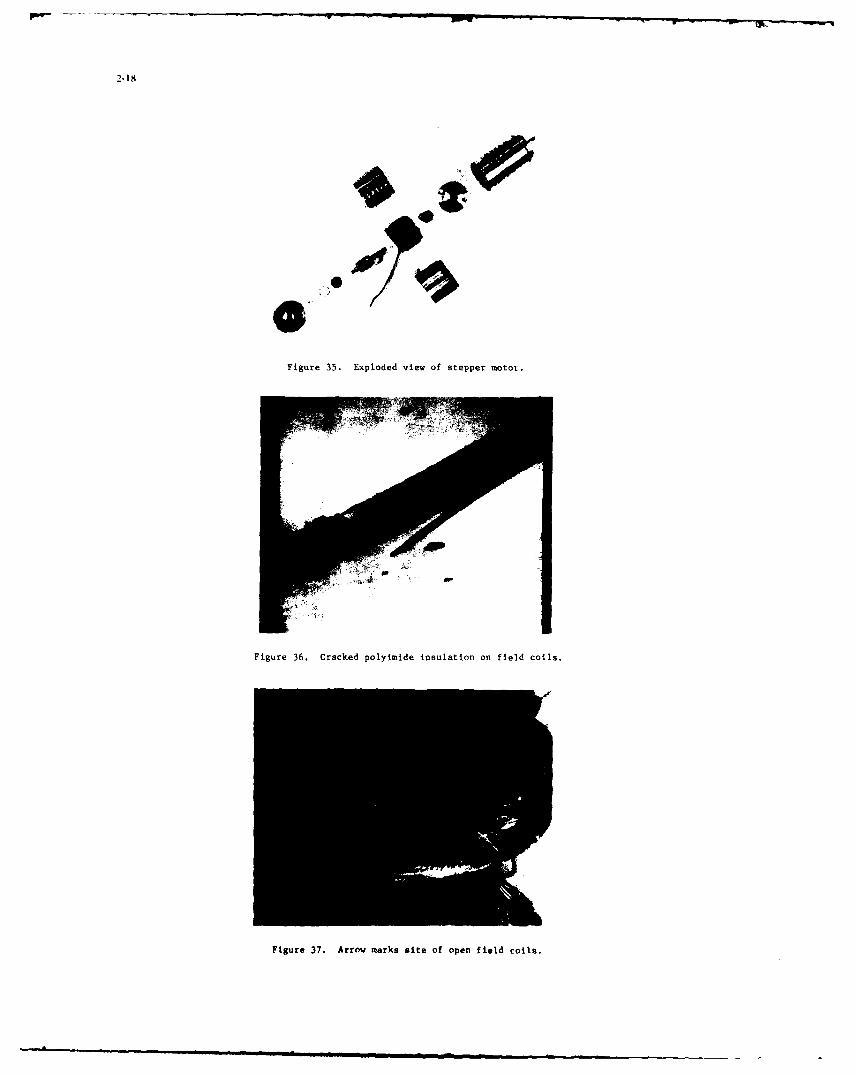
G. Stepper Motor
Stepper motors are often submerged inside a fuel tank for cooling purposes. Ofcourse, this means that the motor components, Figure 35, are then exposed to the fuel environ-ment. In all cases, there is some small amount of water in the fuel. With sufficient time wehave found that this water will hydrolyze polyimide wire insulation. These stepper motors hadpolyimide insulation on the field coils. After sufficient exposure to the water in the fuelsome of the coils appeared as in Figure 36. This defect exposes the copper to the fuel. Ifsome contamination in the fuel is available the copper ions will migrate into the fuel. Thisproduces open circuits in the field coils as shown in Figure 37. This type failure may beavoided by hermetically sealing the field coils from the fuel, or by using a polysulfide in-sulation.
H. Accelerometer
An aircraft accelerometer was environmentally sealed instead of hermetically sealed.After extended use the accelerometer failed. Several accelerometers were tested in the CombinedEnvironmental Reliability Test (CERT) chamber to establish the failure mode. The stresses usedin the CERT chamber were selected to approximate the actual aircraft environment. The stressesincluded temperature cycling, humidity cycling, and altitude cycling, Figure 38. The accelero-meter was electrically operational during a certain part of the cycle. After the accelerometerwent through one hundred fifty cycles, it failed. The package was opened, Figures 39 and 40,and it was easily seen that corrosion residues were shorting out various parts of the circuits.This failure may be eliminated by hermetically sealing the accelerometer package.
I. Record Head
Disk recorder heads, Figure 41, were failing at a very high rate. This was happeningin an area where the recorder operator was smoking cigarettes. Some of the particulate matterin the smoke was being trapped between the disk end the head. This contamination with themoisture available from the air was causing pitting corrosion in the head, Figure 42. It wasrecommended that the operator not smoke in the recording area and that the heads not be cleanedwith a halogenated cleaning solvent. Use an alcohol.
J. Connector
1. Radar Modulator
The cause of failure of a radar modulator was identified as a corroded connector,Figure 43. Two connectors, one corroded and the other not, were joined by a wire insulated witha silicone rubber which had a chloride content less than 0.16%. The surfaces of both connectorswere silver plated. The connectors were cross-sectioned, Figures 44 and 45, and the basematerial was identified as leaded brass. As shown in Figure 44, the silver plating on theuncorroded connector was 6.7.Am thick. The silver plate on the corroded connector, Figure 45,was 5#m thick. Both plating thicknesses are too thin for adequate protection. The platingprocess should meet Federal Specification QQ-S-365C "General Requirements for ElectrodepositedSilver Plating". This specification requires a nickel strike and a silver plating thickness of13fla. The corrosion wes associated with a thin silver plating and it is believed a silverplating of specified thickness will eliminate the corrosion problem.
2. Low Voltage Connector
The corrosion of electrical connectors causes a large nnnmber of electricalfailures. Figure 46 shows the corrosion on some aircraft connectors. These problems may beminimized when the connectors are installed in a horizontal position; when a loop is placed inthe wire so water will not flow down the wire into the connector; when inhibitors are used onthe connector pins and receptacle interior mating areas (MIL-C-81309, Type III); and wheninhibitors are used on the external connector surfaces (AMLGUARD MIL-C-85054). It is
2-4
recommended that an aluminum connector with cadmium plate be used. The possibility of corrosion
can be further minimized by using a chromate conversion coating over the cadmium plate.
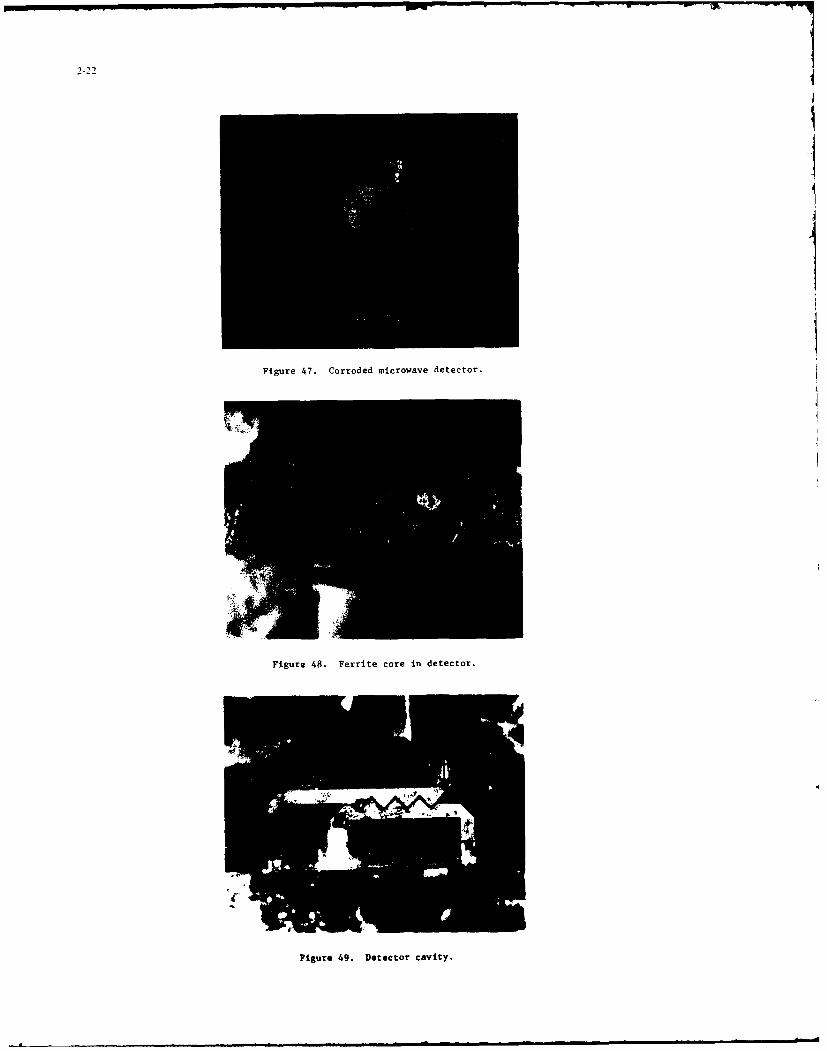
K. Detector
A microwave detector failed due to corrosion, Figure 47. The ferrite core surface andcavity are shown in Figures 48 and 49. The detector case was constructed of nickel platedaluminum. The cavity lid has been removed and is shown in Figure 50. Note the corrosion alongthe edge. This corrosion is attributed to delamination of the nickel coating and the exposureof a dissimilar metal couple to high levels of moisture. The nickel coating delamination is theresult of a poor plating process. This is usually caused by inadequate cleaning of the aluminumsurface prior to plating. The pitting corrosion of the aluminum case and the poor lid-to-caseseal allowed moisture to enter the internal case cavity, which resulted in the corrosion shownin Figures 48 and 49.
An alternate plating for the aluminum should be considered. Ion vapor deposited (IVD)aluminum should be used instead of nickel. A better lid-to-case seal should be obtained. Thiscan be accomplished with appropriate gasket material.
L. Nickel/Boron Plated Panels
For many applications materials are required to meet conflicting requirements. Anexample of this is when metal panels are required to have corrosion resistance and good electro-magnetic interference (EMI) protection. Such panels may be used to package electronic equip-ment.
Twelve nickel/boron coated aluminum plates, Figure 51, were given electrical andenvironment tests. Samples 1, 2, and 3 were 6062 aluminum and samples 4 and 5 were 2024aluminum. The nickel/boron coating was 901 nickel with 10% boron diffused into it. A piece wascross-sectioned and it was found that the coating was made in two layers, Figure 52, each layer0.625 mil thick. The faying surfaces were prepared for test by overlapping the pieces anddrilling holes through the panels. The two plates were bolted together with nylon screws,Figure 53. A torque wrench was used to apply one inch pound of torque to each bolt.
The EMI protection requirement is that all faying surfaces maintain a resistance thatdoes not exceed 2.5 milliohms after environmental exposure. A four point probe test fixture,Figure 54, was designed to measure the faying surface conductivity. The outer probes carriedone ampere current and the inner probes were used to measure the voltage drop. For all measure-ments the current was reversed and the resistance values were averaged.
After the specimens were prepared as shown in Figure 53, five of them were submittedto humidity testing and one was kept as a reference. The humidity chamber was set at 95%relative humidity at 120*F for ten days. The specimens were removed after the first twenty-fourhours and then every forty-eight hours for a visual inspection and, after re-torquing, a surfaceresistance measurement. The surface resistance measurements for the specimens are shown inTable 1. The condition of sample I after the ten day humidity exposure is shown in Figure 55.This sample is typical.
The five samples were disassembled and cleaned with distilled water in preparation fora salt fog test. The chamber was set-up in accordance with ASTM Standard B-117. A fivepercent salt solution of 95*F and condensation rate of 1-2 mils/hr/80 cm inside the chamber wereused to create the salt fog atmosphere. The specimen plates were bolted together again, asduring the humidity test, and exposed to the salt fog for 336 hours, or 14 days. The sampleswere removed periodically for visual inspection and electrical testing. The samples were washedwith distilled water, dried for two hours, and re-torqued before being electrically tested.After testing, the samples were then returned to the chamber until 336 hours of testing werecompleted. The results of the electrical testing are shown in Table II. All five samplesexhibited signs of corrosion after 144 hours. The number 4 and 5 samples exhibite, severecorrosion, Figure 56. The surface resistances of these samples were higher than the othersamples, but still below the maximum of 2.5 milliohms. After 336 hours in the salt tog, samples4 and 5 again exhibited severe corrosion, Figure 57. Only the surface resistar e of sample 4was above 2.5 milliohms. After electrical testing, the samples were disasseWJed. The over-lapping surfaces of all samples exhibited corrosion, Figure 58. Pictures of the samples withthe least and most corrosion are shown in Figures 59 and 60.
The nickel/boron coated aluminum plates passed the humidity testing but they did notdo as well in the salt fog testing. The corrosion was most severe whe., a break occurred in thenickel/boron coating and allowed the salt solution to penetrate into the coating/aluminuminterface. The anodic relationship of aluminum to nickel resulted in pitting corrosion of thealuminum and the formation of aluminum oxide. The aluminum oxide is an excellent insulator andwill significantly increase the surface resistance of the panel. The plating should be free ofsurface imperfections and protected from scratches which coeld break the coating and result incorrosion.
IV. CONCLUSIONS
The examples of corrosion in electronic equipment listed above were obtained from actualcase histories, in an Electronic Failure Analysis Laboratory. Of all the projects submitted tothis laboratory, 83% of the failures are caused by materials and manufacturing process defects.It was established that corrosion was the cause of about 20% of the failures.

2-5
The recommended fixes always interrupt the electrochemical circuit required for corrosion;anode, cathode and electrolyte (so that electrical conduction may take place between the anodeand cathode). The fixes either remove the electrolyte, or insulate the anode, or remove thecathode. Once these fixes are accomplished, there is usually a very large cost savings for thecustomer and a significant improvement in the electronic equipment reliability.
TABLE I. Faying Surface Resistance of Plates Exposedto High Humidity
Average Surface Resistance (microhms) @ I ampereSample After After After After FinalNumber Initial 24 hrs 48 hrs 96 hrs 192 hrs 240 hrs
1 140 245 256 201 226 183
2 130 282 263 220 208 214
3 134 207 230 219 230 243
4 146 322 205 202 198 202
5 144 374 333 346 356 326
TABLE II. Faying Surface Resistance of Plates Exposed to Salt Fog
Average Surface Resistance (microhms) @ 1 ampereSample After After fter After FinalNumber Initial 24 hrs 48 hrs 9. hrs 192 hrs 240 hrs
1 198 155 143 203 274 277
2 212 136 134 211 255 260
3 273 162 152 158 155 161
4 220 176 200 799 15369* 20727
5 198 285 298 332 400 632
* Exceeded 2.5 milliohma
2-6
0- 98% 80-98%70 - INITIAL CON - 4-90 98%RH=..*.RH .490 - 98%RH .. 4..RH ,4*...90 - 98%RH = =ilb.
DITIONING IN60 - A DRY OVEN
40- 24 HOURS
RATE OF CHANGE OF TEMPERATURE IS UNSPECIFIED, HOWEVER.50 r SPECIMENS SHALL NOT BE SUBJECTED TO RADIANT HEAT
HUMIDITY FROM CHAMBER - CONDITIONING PROCESSESj 40 UNCONTROLLEDJ . END OF FINAL CYCLE
w MEASURMENTS AS SPECIFIEDw 3
w 20 J2INITIAL MEASURMENTS CIRCULATION OF CONDITIONING AIR SHALL BE AT A
LU AS SPECIFIED MINIMUM CUBIC RATE PER MINUTE EQUIVALENT TOcc 10 5 TIMES THE VOLUME OF THE CHAMBER
C- O VOLTAGE APPLIED AS SPECIFIED -Ii" 0(L UNLESS OTHERWISE SPECIFIED TEMPERATURE I- TOLERANCE IS . 21C AT ALL POINTS WITHIN ..UJ - 10 -THE CHAMBER EXCEPT THE IMMEDIATE VICINITY STEPS 7a AND 7t PERFORMED - STEP 7b
OF THE SPECIMENS AND THE CHAMBER SURFACES DURING ANY 5 OF THE FIRST 9 STEP 411
- 20 - CYCLES HUMIDITY UNCONTROLLED 7a
DURING STEPS 7a AND 7b ONLY
- 30 - PRIOR TO FIRST CYCLE STEP I STEP 2 STEP 3 STEP 4 STEP5 STEP 6 STEP 7UNLESS OTHERWISE 9 - -40 4- 41
SPECIFIED . ONE CYCLE 24 HOURS REPEAT AS REQUIRED- 40 -
I I I I I I I I I p I I I I I I
-8 -4 -2 0 2 4 6 8 10 12 14 16 18 20 22 24
TIME (HOURS)
Figure 1. Graphical representation of thermal and humidity cycling.

2-7
Figure 2. Exploded view of aircraft circuit breaker.
Figure 3. Cross-sectional view of tungsten/silver contact after twenty day humidity teat.
Figure 4. Cross-sectional view of cadmium/silver contact after twenty day humidity tcu,.

_ _ _ _ _ _ _ _ _ _ _ _ _ _ _ _ _ _ _ _ _ -P- -q-
2-8
Figure 5. Failed contact after forty-eight hour salt fog test.
Figure 6. Failed antenna marker beacon caused by corrosion.
OFI
Figure 7. X-ray radiograph ahows areas of corrosion.

2-9
Figure 8. Polyamide foam inside beacon.
Figure 9. Antenna blade removed from housing.
Figure 10. X-ray map of cross-sectional area of nickel plate on aluminum housing of beacon.See Figure 12.
2-10
Figure 11. X-ray map of crose-sectional area of copper/tin plate on aluminum blade of beacon.See Figure 13.
Figure 12. Cross-sectional SEN micrograpn of nickel platIng on aluminum housing of beacon.Nota areas of lifted nickel plating.
Figure 13. Cross-sectional SEM micrograpb of copper/tin plate on aluminum blade of beacon.Note areas of lifted plating.

2-11
Figure 14. Component side of failed PWB. Note flux contamination on board.
Figure 15. One of the DIPs shown in Figure 14 at higher magnification. Leads are shorted out
by flux contaminatlon.
Figure 16. Component side of failed PJ.

2-12
Figure 17. Backside of board shown in Figure 16. Note corrosion on conductors and white areasof mealing on board.
Figure 18. Diode removed from failed PNB.
Figure 19. Lead on diode shown In Figure 18. Note corrosion on lead.

2-13
4i
Figure 20. SEN micrograph of cross-sectional area of PWB. Constitute parts from the left are:void, conformal coating, solder, copper, and epoxy/fiberglass board matrix. See Figure 21.
Figure 21. X-ray map of area shown in Figure 20. Gray area is copper. Blue region on copperis solder. Green lower central region is chlorine in surface of epoxy/fiberglass board matrix.See Figure N0.
Figure 22. Failed triode amplifier tubes with corrosion interior and exterior to the tubes.
2-14
Figure 23. Exterior corrosion on the triode.
Figure 24. Interior corrosion in the triode. Glass envelope has not been removed.
Figure 25. Interior corrosion in the triode. Glass envelope has been removed.

2-15
Figure 26. Cross-section of triode shows entrapped corrodent.
Figure 27. Electronic device with white vibration dampening foam between PIWBs.
Figure 28. Corrosion on board resulted from chloride contamination. See Figure 29.

2-16
Figure 29. Enlargement of area shown in Figure 28.
'k
Figure 30. Failed transistor with high surface chloride contamination. See Figure 31. Arrowmarks site of open aluminum conductors.
Figure 31. SEM micrograph enlargement of region marked by arrow in Figure 30.

2-17
Figure 32. Linear feedback potentiometer.
Figure 33. Arrow marks corrosion residue on potentiometer exterior which shorts out electricalleads.
Figure 34. Enlargement of site marked by arrow in Figure 33.
2-18
AP40
Figure 35. Exploded view of stepper motor.
Figure 36. Cracked polyimide insulation on field coils.
Figure 37. Arrow marks site of open field coils.

-- -w Ore
2-19
TEMPERATURE
C LTITUE(OUS
Figre3). etrmoCETteseapietoaclreer
Fiur 3 aiedaceermee oend o ispcio. rrw mrkrginsofcrrsin
Figr gurSectu 40. Enl ret o rees opplin toiguere met9.

2-20
Figure 41. Disk recorder head. Arrow marks metallic head.
Figure 42. Enlargement of head marked by arrow in Figure 41.
Figure /.3. Corroded connector on radar modulator.

2-21
Figure 44. Cross-sectional area of good connector.
Figure 45. Cross-sectional area of failed connector.
Figure 46. Corroded electrical connector on avionic equipment.
2-22 ' 1
Figure 47. Corroded microwave detector.
Figure 48. Ferrite core in detector.
Figure 49. Detector cavity.

2-23
Figure 50. Corrosion on the nickel plated aluminum lid.
Figure 51. Twelve nickel/boron plated aluminum panels to be tested.
Figure 52. Crosa-sectional view of nickel/boron plating on the aluminum panel.

2-24
Figure 53. Two panels bolted together with nylon bolts.
Figure 54. Test fixture used to measure electrical resistance between two panels.
Figure 55. Sample I after humidity testing.

2-25
Figure 56. Sample 4 after 144 hours of salt fog testing.
Figure 57. Sample 4 after 336 hours of salt fog testing.
Figure 58. Surfaces of all samples after 336 hours of salt fog testing
F~~~gure~~ 58 ufcso-l ape fer36huso atfgtsig

2-26
Figure 59. Sample surface with least corrosion after 336 hour salt fog test.
Figure 60. Sample surface with most corrosion after 336 hour salt fog test.
L


