0288.htm Preventing Chronic ...
13
PREVENTING CHRONIC DISEASE PUBLIC HEALTH RESEARCH, PRACTICE, AND POLICY Volume 15, E57 MAY 2018 IMPLEMENTATION EVALUATION Relationships Between Theoretically Derived Short-Term Outcomes and Support for Policy Among the Public and Decision- Makers Carol L. Schmitt, PhD 1 ; Laurel Curry, MPH 1 ; Vanessa Boudewyns, PhD 1 ; Pamela A. Williams, PhD 1 ; LaShawn Glasgow, DrPH 1 ; Deanna Van Hersh, MS 2 ; Jeffrey Willett, PhD 3 ; Todd Rogers, PhD 1 Accessible Version: www.cdc.gov/pcd/issues/2018/17_0288.htm Suggested citation for this article: Schmitt CL, Curry L, Boudewyns V, Williams PA, Glasgow L, Van Hersh D, et al. Relationships Between Theoretically Derived Short-Term Outcomes and Support for Policy Among the Public and Decision- Makers. Prev Chronic Dis 2018;15:170288. DOI: https://doi.org/ 10.5888/pcd15.170288. PEER REVIEWED Abstract Purpose and Objectives Policy change is a lengthy and complex process. Thus, it is im- portant to articulate hypothesized causal pathways between ad- vocacy activities and policy change outcomes and to identify and monitor early indicators of progress toward policy change. Intervention Approach The Kansas Health Foundation supports grantee efforts to address the public health effects of obesity through evidence-based policy, systems, and environmental change interventions. To build sup- port for policy, systems, and environmental changes in schools, workplaces, and health care and retail settings, grantees mobilize communities, educate government policy makers, and advocate with organizational decision makers. Evaluation Methods To understand whether early outcomes from obesity-prevention advocacy efforts predict interim outcomes related to eventual policy change, we conducted surveys of the general public and of opinion leaders in Kansas, which were designed to measure com- ponents of Kansas Health Foundation’s theory of change. We then used structural equation modeling to test the theory of change’s underlying relationships by using support for obesity prevention policies as the outcome. Results Our findings supported the hypothesized model: perceptions of obesity as a serious community problem influence beliefs about causes of the problem. Beliefs about causes predict beliefs about who is responsible for the solution to the problem, which in turn predicts support for obesity prevention policies. Implications for Public Health Evaluators of advocacy for policy change interventions can use this approach to monitor proximal changes in public and opinion leader beliefs related to eventual policy change and to determine whether efforts are likely to be successful or need to be adapted or abandoned. Purpose and Objectives More than one third of Americans have obesity (1), and imple- menting policies that change the environment in ways that pro- mote healthy eating and physical activity are an important com- ponent of addressing obesity (2). However, public health pro- grams cannot directly change policies; rather, they make a long- term investment in educating policy makers about the need for and value of policies and they work to build demand for policy change among community members (3). The opinions expressed by authors contributing to this journal do not necessarily reflect the opinions of the U.S. Department of Health and Human Services, the Public Health Service, the Centers for Disease Control and Prevention, or the authors’ affiliated institutions. www.cdc.gov/pcd/issues/2018/17_0288.htm • Centers for Disease Control and Prevention 1
Transcript of 0288.htm Preventing Chronic ...

PREVENTING CHRONIC DISEASEP U B L I C H E A L T H R E S E A R C H , P R A C T I C E , A N D P O L I C Y Volume 15, E57 MAY 2018
IMPLEMENTATION EVALUATION
Relationships Between TheoreticallyDerived Short-Term Outcomes and Supportfor Policy Among the Public and Decision-
Makers
Carol L. Schmitt, PhD1; Laurel Curry, MPH1; Vanessa Boudewyns, PhD1;Pamela A. Williams, PhD1; LaShawn Glasgow, DrPH1; Deanna Van Hersh, MS2;
Jeffrey Willett, PhD3; Todd Rogers, PhD1
Accessible Version: www.cdc.gov/pcd/issues/2018/17_0288.htm
Suggested citation for this article: Schmitt CL, Curry L,Boudewyns V, Williams PA, Glasgow L, Van Hersh D, et al.Relationships Between Theoretically Derived Short-TermOutcomes and Support for Policy Among the Public and Decision-Makers. Prev Chronic Dis 2018;15:170288. DOI: https://doi.org/10.5888/pcd15.170288.
PEER REVIEWED
Abstract
Purpose and ObjectivesPolicy change is a lengthy and complex process. Thus, it is im-portant to articulate hypothesized causal pathways between ad-vocacy activities and policy change outcomes and to identify andmonitor early indicators of progress toward policy change.
Intervention ApproachThe Kansas Health Foundation supports grantee efforts to addressthe public health effects of obesity through evidence-based policy,systems, and environmental change interventions. To build sup-port for policy, systems, and environmental changes in schools,workplaces, and health care and retail settings, grantees mobilizecommunities, educate government policy makers, and advocatewith organizational decision makers.
Evaluation MethodsTo understand whether early outcomes from obesity-preventionadvocacy efforts predict interim outcomes related to eventualpolicy change, we conducted surveys of the general public and of
opinion leaders in Kansas, which were designed to measure com-ponents of Kansas Health Foundation’s theory of change. We thenused structural equation modeling to test the theory of change’sunderlying relationships by using support for obesity preventionpolicies as the outcome.
ResultsOur findings supported the hypothesized model: perceptions ofobesity as a serious community problem influence beliefs aboutcauses of the problem. Beliefs about causes predict beliefs aboutwho is responsible for the solution to the problem, which in turnpredicts support for obesity prevention policies.
Implications for Public HealthEvaluators of advocacy for policy change interventions can usethis approach to monitor proximal changes in public and opinionleader beliefs related to eventual policy change and to determinewhether efforts are likely to be successful or need to be adapted orabandoned.
Purpose and ObjectivesMore than one third of Americans have obesity (1), and imple-menting policies that change the environment in ways that pro-mote healthy eating and physical activity are an important com-ponent of addressing obesity (2). However, public health pro-grams cannot directly change policies; rather, they make a long-term investment in educating policy makers about the need for andvalue of policies and they work to build demand for policy changeamong community members (3).
The opinions expressed by authors contributing to this journal do not necessarily reflect the opinions of the U.S. Department of Health
and Human Services, the Public Health Service, the Centers for Disease Control and Prevention, or the authors’ affiliated institutions.
www.cdc.gov/pcd/issues/2018/17_0288.htm • Centers for Disease Control and Prevention 1

Reaching an obesity policy goal may require many years of sus-tained effort, and developing interim measures of progress towardthat goal provides funders with early indicators of success and anopportunity to refine and improve activities if expected mile-stones are not reached (4). Developing a theory of change is partof this process; the theory illustrates the hypothesized relation-ships between a program’s inputs, activities, outputs, and out-comes (5,6) and it serves as the basis for interim indicators of pro-gress. Our study illustrates how testing a theory of change usingstructural equation modeling (SEM) methods — an analytic meth-od for studying theory-based associations consistent with other ex-amples in the literature (7) — can increase confidence in the hypo-thesized relationships between short-term policy advocacy out-comes and intermediate-term outcomes in the context of obesityprevention. Specifically, we test whether the short-term outcomesin our theory of change predict support for obesity-relatedpolicies, with the assumption that increasing support for obesitypolicies will lead to policy change, given sufficiently supportivecontextual factors.
Intervention ApproachIn 2009, the Behavioral Risk Factor Surveillance System (BRFSS)indicated that 28.8% of Kansas adults had obesity. In response tothis and other health trends such as low fruit and vegetable con-sumption and high rates of diabetes and physical inactivity, theKansas Health Foundation established a Healthy Living FocusArea. The foundation supported Healthy Living Focus Areagrantee efforts in Kansas to address obesity and related chronicdiseases through traditional health behavior change programs andpolicy, systems, and environmental change interventions. Policy,systems, and environmental change interventions are population-based public health approaches designed to make healthy choices— in this case, active living and healthy eating — the easy choices(8). The approaches include adoption of policies that create an en-vironment favorable to regular exercise and access to healthyfoods.
Healthy Living Focus Area policy, systems, and environmentalchange efforts were based on Institute of Medicine recommenda-tions for reducing obesity (9) and input of leading experts in thearea. As a result, Kansas Health Foundation funded grantee ef-forts to develop, build support for, and in some cases implementsystems change and policies in diverse settings. For example,some grantees promoted and supported policies and curriculumchanges focused on physical activity and nutrition in schools andchild care facilities. Other grantees focused on local policies to im-
prove the built environment and make healthy foods more afford-able and accessible. To build support for these changes, granteeseducated and mobilized community members, educated govern-ment policy makers, and advocated with organizational decisionmakers.
Evaluation MethodsTheory of change development
As part of a comprehensive Healthy Living Focus Area evalu-ation, Kansas Health Foundation staff and external evaluators col-laboratively developed a theory of change (10). The theory ofchange was developed through a combination of deductive (draw-ing on scholarly theory) and user-focused (guiding intended usersin the articulation of their program theory) approaches (11). Theresulting theory of change consisted of 2 pathways that reflect thebroad types of Healthy Living Focus Area grant initiatives: a tradi-tional public health pathway, in which healthy eating and activeliving outcomes are achieved through evidence-based initiatives tochange health behavior, and a policy, systems, and environmentalchange pathway, in which such outcomes are achieved throughpolicy advocacy and systems change approaches. The latter path-way was adapted from the Advocacy and Policy Change Compos-ite Logic Model and the Visual Framework of Public PolicyStrategies (12,13). In this article, we focus on our use of SEMmethods to test the presumed links between the short-term out-comes expected to occur as a result of planned grantee activities— changes in perceptions about obesity and its policy solutions —and the longer-term-outcomes associated with eventual policychange in the policy, systems, and environmental change pathway— support for obesity policies. Data were collected to assess theseoutcomes at the state level and not specifically linked to grantees’activities, which were primarily at the local level.
Theory of change testing
We tested the hypothesized interrelationships in the theory ofchange between perceived seriousness of the obesity problem, be-liefs surrounding the problem, and support for policies related toobesity using SEM. By testing the model fit — the extent to whichthe data collected support the hypothesized relationships in thetheory of change — we can determine the extent to which earlyoutcome indicators are useful measures of progress toward eventu-al support for obesity policies. If these relationships are supported,program implementers and evaluators working on building sup-port for obesity policies can use this theory of change model tomonitor proximal changes in public and opinion leader beliefs thatare related to policy support and eventual policy change.
PREVENTING CHRONIC DISEASE VOLUME 15, E57
PUBLIC HEALTH RESEARCH, PRACTICE, AND POLICY MAY 2018
The opinions expressed by authors contributing to this journal do not necessarily reflect the opinions of the U.S. Department of Health and Human Services,
the Public Health Service, the Centers for Disease Control and Prevention, or the authors’ affiliated institutions.
2 Centers for Disease Control and Prevention • www.cdc.gov/pcd/issues/2018/17_0288.htm

Operationalizing key constructs for SEM
We hypothesized that, when implemented, grantee educational andadvocacy activities would lead to increased perceived seriousnessof obesity in communities and eventually to increased support forpolicy changes to address it. Figure 1 describes how we operation-ally defined the constructs of the theory of change, the relation-ships between these constructs, and hypothesized relationships ofthe constructs to support for obesity policies. These relationshipsare based, in part, on the Health Belief model (14), which positsthat beliefs about the seriousness of a problem can be used to pre-dict behaviors. It is also based on the theory of perceived respons-ibility and social motivation, which postulates that there is an as-sociation between causal attributions and support for governmentaction to reduce a social problem (15,16). This theory proposesthat causal attributions of a social problem influence solution attri-butions, which shape personal behaviors and support for solutionsto address the problem.
Figure 1. Predicted theory of change model used to operationally define theconstructs of the Healthy Living Focus Area theory of change, the relationshipsbetween these constructs, and the hypothesized relationships of theconstructs to support for obesity policies, Kansas Health Foundation, 2014.Dashed lines represent exploratory paths not predicted in the theory ofchange. Solid lines are paths predicted in the theory of change.
Data collection
We conducted 2 cross-sectional telephone surveys during the sum-mer of 2014: 1 among the Kansas public (the General Public Sur-vey) and the other among opinion leaders in Kansas (the OpinionLeader Survey). RTI International’s institutional review board ap-proved all study procedures. The surveys took approximately 15minutes to complete. Respondents were not provided material in-centives.
The General Public Survey was a representative household surveyof 2,203 Kansas residents aged 18 years or older conducted fromMay 12 to August 4, 2014. Because the prevalence of cellular tele-phone–only households has increased (17), and to maximize re-sponse rates, we used a dual-frame telephone survey with an over-
lap design. The sampling frame consisted of all landline and cellu-lar telephone numbers in Kansas. On the landline frame, 1 adultwas randomly selected in each household reached; on the cellulartelephone frame, the person who answered the phone was selected.Sample weights were created to map the sample to the Kansaspopulation. The overall response rate by using the American Asso-ciation for Public Opinion Research 3 formula (18) was 15.2%,which is consistent with the rates achieved in similar populationsurveys (19).
The Opinion Leader Survey was a 2-stage probability telephonesurvey conducted from May 12 to September 12, 2014. In the firstsampling stage, we selected 73 of 105 Kansas counties proportion-al to the eligible population with probability minimum replace-ment (20). To identify participants in the 73 counties, we created asampling frame representing opinion leaders in 9 sectors (busi-ness; education; city, county, state, and federal officials; ethnicand health organizations; and media), based in part on previousstudies of opinion leaders (19,21) and consultation with KansasHealth Foundation. We found contact information (names, tele-phone numbers, and email, where possible) using publicly avail-able information gathered through web searches, such as searchesof Kansas state and county websites.
In the second sampling stage, we stratified by urban/rural designa-tion to obtain estimates as close to representative of the popula-tion distribution of urban and rural counties as possible. Urbancounties were defined as large fringe metropolitan, medium metro-politan, and small metropolitan areas, whereas rural counties weredefined as micropolitan and noncore (22). We also stratified by of-fice type within sectors (eg, the education sector had 2 officetypes: superintendents and school board presidents). For officetypes with small sampling frame sizes (n < 67) we selected the en-tire frame. For office types with larger frame sizes, we selected asimple random sample (n = 67) with near equal numbers of lead-ers from rural and urban counties to yield the number of re-sponses necessary for an adequately powered study, aiming for1,650 as our sample size. On the basis of surveys of opinion lead-ers in other states, where we have had response rates ranging from55% to 65%, we calculated that we would need a total sample of1,650 for a yield of at least 900 completes (needed to keep themargin of error at a reasonable level). Our total sample size was1,654, and of those, 912 completed the survey. Before callingopinion leaders, we sent them lead letters explaining the study pur-pose, study sponsor, and survey duration and informing them thatthey would receive a telephone call within the next few days froman interviewer.
PREVENTING CHRONIC DISEASE VOLUME 15, E57
PUBLIC HEALTH RESEARCH, PRACTICE, AND POLICY MAY 2018
The opinions expressed by authors contributing to this journal do not necessarily reflect the opinions of the U.S. Department of Health and Human Services,
the Public Health Service, the Centers for Disease Control and Prevention, or the authors’ affiliated institutions.
www.cdc.gov/pcd/issues/2018/17_0288.htm • Centers for Disease Control and Prevention 3

The overall response rate was 55%. Response rates varied by posi-tion type, with the highest rate among health organizations(90.6%) and the lowest rate among state senate members (30.8%)and members of Congress (0).
Sample
General Public Survey and Opinion Leader Survey participantcharacteristics are detailed in Table 1, along with demographicsfrom the 2013 Kansas census of the population aged 18 or older.The opinion leader sample contained a higher proportion of men,adults aged 45 or older, participants representing rural areas,whites, and people identifying as conservative. The difference ingeographic distribution between General Public Survey and Opin-ion Leader Survey respondents is a result of the difference in studydesign; the General Public Survey is an adult population study(and the largest proportion of Kansans live in urban areas), where-as the Opinion Leader Survey is based on leaders in counties (andour sample was designed to ensure equal representation of urbanand rural counties). Demographic characteristics of the GeneralPublic Survey and census populations were very similar.
Measures
We developed items to measure the constructs in the theory ofchange. The items in the General Public Survey and OpinionLeader Survey were designed to be directly comparable to one an-other. To develop the survey items, we used a literature review ofsimilar studies, the theory of change, investigator consensus, andsurvey methodologist feedback. We also conducted cognitive test-ing by using think-aloud methods with a small conveniencesample of 5 Kansas opinion leaders nominated by Kansas HealthFoundation and 5 members of the Kansas general public. We cre-ated variables representing components of the theory of change bycombining participants’ responses to various closed-ended items.For all scales, coefficient H was used as a measure of an item’sconstruct reliability using the weighted data (23).
Four items were used to assess participants’ perceptions of the ser-iousness of the obesity problem and its antecedents in their com-munity (ie, obesity and overweight among children, obesity andoverweight among adults, lack of regular exercise, and unhealthyeating). Responses were rated on a 3-point scale (1 = not at all aproblem, 2 = somewhat serious problem, 3 = a very serious prob-lem). Items were averaged to form a scale (General Public Survey:coefficient H = 0.79, mean [standard error (SE)], 2.38 [0.02];Opinion Leader Survey: coefficient H = 0.81, mean [SE], 2.14,[0.06]). Higher scores indicate greater perceptions that obesity andrelated factors, namely exercise and unhealthy eating, are a seri-ous problem in the community.
By environmental causes of obesity, we mean the structural, sys-temic, and informational factors that influence individuals’ de-cisions to consume certain foods over others and to engage insome activities over others (eg, more or less physically activechoices). To measure the extent of participants’ beliefs that onecan attribute the causes of obesity to environmental factors, parti-cipants responded to various items asking the extent to which eachitem was a reason behind the obesity issue (“healthy foods are ex-pensive,” “unhealthy food is inexpensive and easy to find,” “thereare too many unhealthy foods, snacks, and drinks available inschools,” “there are not enough safe places for people to be phys-ically active indoors,” and “people don’t have enough informationabout the nutrition and calories in their food”). Items were adap-ted from a published national survey (24). Responses were meas-ured on a 3-point scale (0 = not a reason at all, 1 = minor reason, 2= major reason). The 5 items were summed to form an index ofcausal beliefs; higher values represent stronger beliefs in environ-mental causes of obesity (range, 0–10) (General Public Surveymean [SE], 5.75 [0.07]; Opinion Leader Survey mean [SE], 5.75[0.07]).
Participants rated 5 groups on their level of responsibility for solv-ing the obesity problem in Kansas: “the food industry,” “the U.S.federal government,” “state and local governments,” “employers,”and “schools.” Participants were asked to rate the level of respons-ibility for solving the obesity problem in Kansas for each group: 1= little of the responsibility, 2 = some of the responsibility, or 3 =most of the responsibility. Items were averaged to form a scale(General Public Survey: coefficient H = 0.81, mean [SE], 1.79[0.01]; Opinion Leader Survey: coefficient H = 0.84, mean [SE],1.66 [0.04]). Higher scores corresponded with beliefs that more re-sponsibility should be placed on societal entities.
We measured participants’ support for obesity-related policychange by using a 7-item measure on which participants wereasked, “What is your opinion about a policy that would . . . 1) re-quire more physical activity in schools; 2) place a tax on the saleof sugar-sweetened beverages; 3) eliminate sales tax on freshfruits and vegetables; 4) provide state funding for low-incomeschools to purchase fresh, local food; 5) limit the availability ofunhealthy foods and beverages in schools; 6) fund bike paths,trails, sidewalks, and other projects to promote biking and walk-ing; and 7) provide rewards to retailers that sell fresh, local foods.”Responses were based on a 5-point scale ranging from 1 =strongly against to 5 = strongly in favor. Items were averaged toform a scale, where higher scores represent greater support forobesity-related policies (General Public Survey: coefficient H =0.75, mean [SE], 4.10 [0.02]; Opinion Leader Survey: coefficientH = 0.86, mean [SE] 3.83 [0.10]).
PREVENTING CHRONIC DISEASE VOLUME 15, E57
PUBLIC HEALTH RESEARCH, PRACTICE, AND POLICY MAY 2018
The opinions expressed by authors contributing to this journal do not necessarily reflect the opinions of the U.S. Department of Health and Human Services,
the Public Health Service, the Centers for Disease Control and Prevention, or the authors’ affiliated institutions.
4 Centers for Disease Control and Prevention • www.cdc.gov/pcd/issues/2018/17_0288.htm

Analysis
We used a structural model with observed variables to test the fitof our hypothesized model to the data using maximum likelihoodestimation in the LISREL software version 9.2 (Scientific Soft-ware International, Inc). All variables were included as observed(manifest) variables in the model. We evaluated model fit first interms of how well the overall model fit the observed data, as indic-ated by 2 fit indices: the χ2 test and a root mean square error of ap-proximation [RMSEA] of less than .06 (25). A nonsignificant χ2
statistic is preferable because it reflects “exact fit” between the hy-pothesized model and the data; however, we rely primarily on theRMSEA because the χ2 is highly affected by sample size: largersamples produce larger χ2 results that are more likely to be signi-ficant (type I error). Once model fit was confirmed, we also ex-amined the significance and strength of estimated parameters andthe variance accounted for by variables. The same model was runfor both the General Public Survey and Opinion Leader Survey byusing weighted data. The models were then compared to seewhether a similar pattern of effects was found.
ResultsTable 2 lists the results of the confirmatory factor analysis for eachof the constructs. Most of the items were strongly associated withthe factor, and all factor loadings were above the recommendedcut off of 0.30 (26,27).
General Public Survey results
For the General Public Survey data, the hypothesized model metthe criteria for good model fit (RMSEA = .02, χ2 = 2.15, df = 1, P= .14). All theory-predicted parameters (ie, the thick lines in Fig-ure 2) were significant and with the expected sign (ie, the expec-ted direction). In addition, 2 of the exploratory paths were also sig-nificant. Overall, the 3 constructs accounted for 21% of the vari-ance in policy support. Greater perceived seriousness of obesitypredicts greater environmental causal beliefs for why more peopleare becoming overweight and obese (β = 0.18, P < .001), andgreater obesity-related policy support (β = 0.08, P < .01). Strongerenvironmental causal beliefs predicted greater beliefs that societalfactors (eg, business and government) are responsible for solvingthe obesity problem (β = 0.43, P < .001). Stronger environmentalcausal beliefs were also associated with increased support forobesity-related policy change (β = 0.26, P < .001). Finally,stronger societal responsibility beliefs predicted greater obesity-re-lated policy support (β = 0.27, P < .001).
Figure 2. Mediational model for the General Public Survey sample, 2014.Abbreviations: df, degrees of freedom; RMSEA, root mean square error ofapproximation. *P < .01; **P < .001.
We found a complex set of relationships between the variables inthe model. Although perceived seriousness of obesity did not havea direct effect on societal responsibility beliefs, it did have a signi-ficant total effect (βtotal = 0.08) (Table 3). The results suggest thatbeliefs about the causes of obesity explain the relationshipbetween perceptions of the seriousness of obesity and beliefsabout responsibility for addressing obesity. That is, perceivingobesity as a severe community problem was not directly related tobeliefs that institutions (eg, government) should play a role insolving that problem; rather, perceiving obesity as a serious com-munity problem was associated with attributing obesity to envir-onmental causes, and these attributions were associated with as-signing responsibility for its solution to societal institutions. Themodel suggests that beliefs about the causes of obesity have thestrongest total effect on policy support (βtotal = 0.37) (Table 3).
Opinion Leader Survey results
For the Opinion Leader Survey data, the hypothesized model alsomet the criteria for good fit (RMSEA = 0.00, χ2 = 1.99, df = 2, P =.37). As with the General Public Survey data, all theory-predictedparameters were significant, with the expected sign and show thatthe predicted relationships in the theory of change model hold forthe public and opinion leaders (Figure 3). One difference in thepattern of results from the General Public Survey data was that,for the opinion leaders, perceived seriousness of obesity did nothave a direct effect on policy support (this path was not predictedby the theory of change; instead, it was exploratory). Perceivedseriousness of obesity had a significant indirect effect on policysupport, with a combined total effect (βtotal = 0.23) similar to thetotal effect of responsibility beliefs on policy support (βtotal =0.22). Overall, perceived seriousness of obesity, environmentalcausal beliefs, and societal responsibility beliefs accounted for44% of the variance in policy support. Increases in perceived seri-ousness of obesity, environmental causal beliefs, and societal re-sponsibility beliefs were associated with greater support for
PREVENTING CHRONIC DISEASE VOLUME 15, E57
PUBLIC HEALTH RESEARCH, PRACTICE, AND POLICY MAY 2018
The opinions expressed by authors contributing to this journal do not necessarily reflect the opinions of the U.S. Department of Health and Human Services,
the Public Health Service, the Centers for Disease Control and Prevention, or the authors’ affiliated institutions.
www.cdc.gov/pcd/issues/2018/17_0288.htm • Centers for Disease Control and Prevention 5

obesity prevention policies. Similar to the findings in the GeneralPublic Survey sample, findings in the Opinion Leader Surveyshowed that causal beliefs had the strongest total effect on policysupport (βtotal = 0.64) (Table 4). The effect of causal beliefs wasnot fully mediated by responsibility beliefs; instead, causal beliefshad direct and indirect effects on policy support.
Figure 3. Mediational model for the Opinion Leader Survey sample, 2014.Abbreviations: df, degrees of freedom; RMSEA, root mean square error ofapproximation. *P < .001.
Implications for Public HealthHealthy Living Focus Area grantees conducted education andcommunity mobilization activities to promote evidence-basedpolicies with the potential to decrease obesity. Grantees conduc-ted these activities across the state and in diverse settings over ashort period of time (3 years), although the foundation has com-mitted to a longer-term investment in decreasing obesity in Kan-sas. The specific activities were as varied as the settings. In somecases, grantees advocated with school districts and individualschools for new policies or systems; in other cases, they workedwith individual communities to plan and advocate for changes inthe built environment that would better support physical activity.We developed our theory of change and associated indicators forthe Healthy Living Focus Area evaluation but also as part of alonger-term plan to ensure that the foundation can document pro-gress toward support for obesity policy change. This progress mayoccur because of activities conducted by former Healthy LivingFocus Area grantees or because of future initiatives supported bythe foundation or other funders.
In this study, we used SEM methods to test the logic underlyingthe policy, systems, and environmental change pathway in theHealthy Living Focus Area theory of change to document the ex-tent to which our indicators of progress toward obesity policychanges predict support for obesity policies. We found thatobesity-related beliefs held by the general public and opinion lead-ers in Kansas (short-term outcomes) predicted support for obesitypolicy change (longer-term outcomes) in the manner hypothes-
ized by the theory of change. Under favorable circumstances, wewould expect that organizations and local governments would ad-opt these policies if a large enough proportion of decision makers(including policy makers) and the public supported them.
Finding support for the pathways in the theory of change is an im-portant contribution to the challenge of evaluating interventionsfocused on policy change. Tobacco control, considered the modelfor successful policy approaches to public health issues includingobesity (28), overwhelmingly focuses on the impact of policies onbehavior with little focus on how education and advocacy activit-ies lead to those policy changes (29). A focus on how activitieslead to support for policy is particularly important for the long-term investment needed to build support for obesity policies (3)and to ensure that intervention messages are relevant to the audi-ences targeted (30).
These findings have several implications for funders, program im-plementers, evaluators, and other stakeholders. We found thatwhen both opinion leaders and the general public believe thatobesity is a serious problem in their community, they are morelikely to believe that the causes of obesity are at least in part envir-onmental. In turn, consistent with theory, when opinion leadersand the general public perceive various environmental factors ascontributing to obesity, they are more likely to hold organizationssuch as schools, government, and the food industry responsible foraddressing it (16). Finally, opinion leaders and the public who be-lieve that organizational bodies have a role in addressing obesityare more likely to support obesity policy change. Each of these be-lief sets represents progress toward policy support needed for eval-uation of policy change interventions. Beliefs can be changedthrough interventions, including media campaigns. Policy changeefforts, then, can include interventions that change opinion leaderand public beliefs about the seriousness and causes of obesity andbeliefs about who has the responsibility to address obesity.
However, the value of this approach (and the likelihood of findingsignificant results) is highly contingent on the care with which thebeliefs measured are selected. This contingency applies to anyanalytic approach used to examine predictors of support for policychange. There is an extensive literature defining beliefs, attitudes,intentions, and behaviors, along with recommended approaches toidentifying relevant constructs (31,32), on which one might drawand construct indicators and measures. Using theory to inform anevaluation theory of change provides the basis for generalizingand applying findings, while including a participatory componentensures that findings are relevant to the intervention you are evalu-ating. For example, consistent with the theory of reasoned action(32), our findings suggest public and opinion leader support forobesity policy change could be increased through interventionsthat strengthen beliefs about the seriousness and causes of obesity.
PREVENTING CHRONIC DISEASE VOLUME 15, E57
PUBLIC HEALTH RESEARCH, PRACTICE, AND POLICY MAY 2018
The opinions expressed by authors contributing to this journal do not necessarily reflect the opinions of the U.S. Department of Health and Human Services,
the Public Health Service, the Centers for Disease Control and Prevention, or the authors’ affiliated institutions.
6 Centers for Disease Control and Prevention • www.cdc.gov/pcd/issues/2018/17_0288.htm

They also suggest a role for changing normative beliefs about howmuch responsibility social institutions (eg, government, business)have for addressing obesity and could be further expanded to ex-plore organizational beliefs. Conversely, a more participatory ap-proach such as concept mapping (31) yields a theory of changevery specific to the intervention being evaluated. In our study, thebeliefs examined were specific to the Healthy Living Focus Area,and without that specificity, we would not have findings to informthe intervention we were evaluating.
Finally, careful consideration of the audience targeted for policychange is important, because, for example, conservatives may bepersuaded by different arguments than liberals (33). The beliefsassociated with support for the obesity policies we examined inthis study were derived from a combination of theory, previousqualitative work we have conducted on beliefs and policy change(34), and interviews conducted with foundation staff responsiblefor the initiative. It was subsequently modified after we mappedthe objectives of all Healthy Living Focus Area grantees to thepreliminary theory of change (10).
Although our findings are promising and consistent with theory,we acknowledge several limitations. First, these data focus only onobesity-related beliefs and policy support, although we believethey have wider application to other public health policy changegoals. Second, these data were generally representative at the statelevel, while most Healthy Living Focus Area grantee activitieswere conducted in local communities. As a result, we were unableto examine relationships between localized activities and out-comes measured at the state level. Third, respondents were thepublic and opinion leaders in Kansas, a state that ranks among themost politically conservative, with a strong commitment to small-government principles, and is in the Midwest, a region of theUnited States where obesity levels are among the highest. Thus,our findings may not be generalizable to the public and opinionleaders in other states. Fourth, our opinion leader sample con-sisted of multiple sectors believed to influence the policy process,including the media, business leaders, and local and state electedofficials. Although all of these sectors can influence policychange, only a subset of them (ie, local and state elected officials)can propose and vote for a policy. Fifth, even with the additions ofcausal responsibility and environmental influence factors, the pro-posed theory of change linking advocacy activities to policy sup-port is a simplistic representation of the complex policy develop-ment and implementation processes that typically involve variousactivities to manifest outcomes; this may challenge the utility ofthe theory of change in measuring early progress on multiple path-ways to policy change. Finally, although the relationships depic-ted in the theory of change are presumed to be longitudinal, ourdata are cross-sectional. Follow-up longitudinal studies examin-
ing change over time may help solidify our understanding of thedirection of the association and whether proximal variables (eg,causal beliefs) predict changes in distal outcomes (eg, policy sup-port).
Limitations notwithstanding, our findings provide some evidencethat the Healthy Living Focus Area theory of change is a usefulframework for monitoring progress, informing course corrections,and increasing the chance that funder investments in the efforts ofprogram implementers will lead to desired outcomes. As the evid-ence base grows for policy, systems, and environmental changeapproaches to chronic disease prevention and control, this workmay serve as a model for funders and evaluators seeking to monit-or and measure progress toward policy, systems, and environment-al change goals.
AcknowledgmentsSupport for the research and authorship of this article wasprovided by the Kansas Health Foundation (grant # 201304006 —01: Evaluation of the Kansas Health Foundation’s Healthy LivingFocus Area).
Author InformationCorresponding Author: Laurel Curry, MPH, RTI International,701 13th St, NW, Ste 750, Washington, DC 20005. Telephone:202-728-2046. Email: [email protected].
Author Affiliations: 1RTI International, Research Triangle Park,North Carolina. 2Kansas Health Foundation, Wichita, Kansas.3Schroeder Institute at Truth Initiative, Washington, District ofColumbia.
ReferencesOgden CL, Carroll MD, Fryar CD, Flegal KM. Prevalence ofobesity among adults and youth: United States, 2011–2014.NCHS Data Brief 2015;(219):1–8.
1.
Gortmaker SL, Swinburn BA, Levy D, Carter R, Mabry PL,Finegood DT, et al. Changing the future of obesity: science,policy, and action. Lancet 2011;378(9793):838–47.
2.
Huang TTK, Cawley JH, Ashe M, Costa SA, Frerichs LM,Zwicker L, et al. Mobilisation of public support for policyactions to prevent obesity. Lancet 2015;385(9985):2422–31.
3.
Louie J, Guthrie K. Strategies for assessing policy changeefforts: a prospective approach. The Evaluation Exchange2007;13(1):5.
4.
Anderson A. An introduction to theory of change. TheEvaluation Exchange 2005;11(2):12,19.
5.
PREVENTING CHRONIC DISEASE VOLUME 15, E57
PUBLIC HEALTH RESEARCH, PRACTICE, AND POLICY MAY 2018
The opinions expressed by authors contributing to this journal do not necessarily reflect the opinions of the U.S. Department of Health and Human Services,
the Public Health Service, the Centers for Disease Control and Prevention, or the authors’ affiliated institutions.
www.cdc.gov/pcd/issues/2018/17_0288.htm • Centers for Disease Control and Prevention 7
McLaughlin JA, Jordan GB. Using logic models. In: WholeyJS, Hatry HP, Newcomber KE, editors. Handbook of practicalprogram evaluation, San Francisco (CA): Jossey-Bass; 2010. p.55–80.
6.
Adedokun OA, Childress AL, Burgess WD. Testingconceptual frameworks of nonexperimental programevaluation designs using structural equation modeling. Am JEval 2011;32(4):480–93.
7.
Frieden TR, Dietz W, Collins J. Reducing childhood obesitythrough policy change: acting now to prevent obesity. HealthAff (Millwood) 2010;29(3):357–63.
8.
Institute of Medicine. Accelerating progress in obesityprevention: solving the weight of the nation. Washington (DC):The National Academies Press; 2012.
9.
Glasgow L, Adams E, Joshi S, Curry L, Schmitt CL, Rogers T,et al. Using a theory of change to guide grant monitoring andgrantmaking. J Public Health Manag Pract 2017;23(2):126–30.
10.
Patton MQ. Utilization-focused evaluation. 4th edition.Thousand Oaks (CA): Sage; 2008.
11.
Campbell M, Coffman J. Tools to support public policygrantmaking. The Foundation Review 2009;1(3):123–31.
12.
Coffman J. A user’s guide to advocacy evaluation planning.Cambridge (MA): Harvard Family Research Project; 2009.
13.
Glantz K, Rimer BK, Lewis FM, editors. Health behavior andhealth education: theory, research and practice. 3rd edition.San Francisco (CA): Jossey-Bass; 2002.
14.
Niederdeppe J, Porticella N, Shapiro MA. Using theory toidentify beliefs associated with support for policies to raise theprice of high-fat and high-sugar foods. J Health Commun2012;17(1):90–104.
15.
Weiner B. On sin versus sickness. A theory of perceivedresponsibility and social motivation. Am Psychol 1993;48(9):957–65.
16.
Blumberg SJ, Luke JV. Wireless substitution: early release ofestimates from the National Health Interview Survey,July–December 2014. Atlanta (GA): US Department of Healthand Human Services, Centers for Disease Control andPrevention, National Center for Health Statistics; 2015.
17.
American Association for Public Opinion Research. Standarddefinitions. Final dispositions of case codes and outcome ratesfor surveys. Oakbrook Terrace, (IL): American Association forPublic Opinion Research; 2015.
18.
Schmitt CL, Juster HR, Dench D, Willett J, Curry LE. Publicand policy maker support for point-of-sale tobacco policies inNew York. Am J Health Promot 2014;28(3):175–80.
19.
Chromy JR. Sequential sample selection methods. In:Proceedings of the American Statistical Association, Sectionon Survey Research Methods. Alexandria (VA): AmericanStatistical Association; 1979. p. 401–6.
20.
Howard KA, Rogers T, Howard-Pitney B, Flora JA, NormanGJ, Ribisl KM. Opinion leaders’ support for tobacco controlpolicies and participation in tobacco control activities. Am JPublic Health 2000;90(8):1283–7.
21.
Ingram DD, Franco SJ. NCHS urban–rural classificationscheme for counties. Vital Health Stat 2 2012;2(154):1–65.
22.
Hancock GR, Mueller RO. Rethinking construct reliabilitywithin latent variable systems. In: Cudeck R, du Toit S,Sörbom D, editors. Structural equation modeling: present andfuture — a festschrift in honor of Karl Jöreskog. Lincolnwood(IL): Scientific Software International, Inc; 2001. p. 195–216.
23.
Thompson T, Benz J, Agiesta J, Brewer KH, Bye L, Reimer R,Junius D. Obesity in the United States: public perceptions. TheAssociated Press and NORC. 2013. http://www.apnorc.org/pdfs/obesity/ap-norc-obesity-research-highlights.pdf. AccessedApril 10, 2018.
24.
Steiger JH. Understanding the limitations of global fitassessment in structural equation modeling. Pers Individ Dif2007;42(5):893–8.
25.
Tabachnick BG, Fidell LS. Using multivariate statistics. 5thedition. Boston (MA): Pearson; 2006.
26.
Comrey AL, Lee HB. A first course in factor analysis. 2ndedition. New York (NY): Psychology Press, 1992.
27.
Daynard RA. Lessons from tobacco control for the obesitycontrol movement . J Publ ic Heal th Pol icy 2003;24(3–4):291–5.
28.
Sparks CH. Advocacy as a tobacco control strategy. In:Institute of Medicine. Ending the tobacco problem: a blueprintfor the nation. Washington (DC): The National AcademiesPress; 2007. p. 690–703.
29.
Heinrich KM, Stephen MO, Vaughan KB, Kellogg M. Kansaslegislators prioritize obesity but overlook nutrition andphysical activity issues. J Public Health Manag Pract 2013;19(2):139–45.
30.
Trochim WM. An introduction to concept mapping forplanning and evaluation. Eval Program Plann 1989;12(1):1–16.
31.
Fishbein M, Ajzen I. Predicting and changing behavior: thereasoned action approach. New York (NY): Taylor and FrancisGroup; 2010.
32.
Gollust SE, Niederdeppe J, Barry CL. Framing theconsequences of childhood obesity to increase public supportfor obesity prevention policy. Am J Public Health 2013;103(11):e96–102.
33.
Schmitt CL, Allen JA, Kosa KM, Curry LE. Support for a banon tobacco powerwalls and other point-of-sale displays:findings from focus groups. Health Educ Res 2015;30(1):98–106.
34.
PREVENTING CHRONIC DISEASE VOLUME 15, E57
PUBLIC HEALTH RESEARCH, PRACTICE, AND POLICY MAY 2018
The opinions expressed by authors contributing to this journal do not necessarily reflect the opinions of the U.S. Department of Health and Human Services,
the Public Health Service, the Centers for Disease Control and Prevention, or the authors’ affiliated institutions.
8 Centers for Disease Control and Prevention • www.cdc.gov/pcd/issues/2018/17_0288.htm

Tables
Table 1. Demographic Characteristics of the Kansas General Public Survey and Opinion Leader Survey Samples, 2014
Characteristic General Public Survey, Weighted % Opinion Leader Survey, Weighted % Census, Kansas %a
Sex
Male 50.7 57.0 50.7
Female 49.3 43.0 49.3
Age, y
18–24 13.6 8.1 14.1
25–44 34.0 12.3 33.8
45–64 33.7 55.3 33.6
≥65 18.7 24.3 18.5
Geographic distributionb
Urban 65.0 28.7NA
Rural 35.0 71.3
Race/ethnicity
White (non-Hispanic) 80.4 93.7 80.2
Black (non-Hispanic) 5.7 0.8 6.0
Hispanic 9.2 1.0 9.1
Other (non-Hispanic)c 4.8 4.4 4.6
Education attainment
None or less than high school diploma 11.6
NA
11.8
High school diploma or general equivalencydiploma
30.2 30.2
Some college 28.6 28.5
College graduate 29.6 29.5
Annual household income, $
<25,000 26.2
NA NA25,000–49,900 32.7
50,000–74,900 23.2
≥75,000 18.0
Political philosophyd
Conservative 42.1 51.3
NAModerate 35.4 39.0
Liberal 22.5 9.7
Abbreviation: NA, not available.a Using data from 2013 US Census: http://www.census.gov/popest/data/state/asrh/2013/SC-EST2013-ALLDATA5.html.b The difference in geographic distribution between General Public Survey and Opinion Leader Survey respondents is a result of the difference in study design; theGeneral Public Survey is an adult population study (and the largest proportion of Kansans live in urban areas), whereas the Opinion Leader Survey is based on lead-ers in counties (and our sample was designed to ensure equal representation of urban and rural counties).c Asian, Native Hawaiian or other Pacific Islander, American Indian or Alaska Native, and multiracial.d Conservative = answered “very conservative” or “somewhat conservative,” moderate = answered “moderate — neither conservative nor liberal,” and liberal =answered “somewhat liberal” or “very liberal” in response to “How would you describe your overall political philosophy?”e Answered yes to “Has a health care professional ever told you or someone in your household that you are overweight or at risk for being overweight?”
(continued on next page)
PREVENTING CHRONIC DISEASE VOLUME 15, E57
PUBLIC HEALTH RESEARCH, PRACTICE, AND POLICY MAY 2018
The opinions expressed by authors contributing to this journal do not necessarily reflect the opinions of the U.S. Department of Health and Human Services,
the Public Health Service, the Centers for Disease Control and Prevention, or the authors’ affiliated institutions.
www.cdc.gov/pcd/issues/2018/17_0288.htm • Centers for Disease Control and Prevention 9

(continued)
Table 1. Demographic Characteristics of the Kansas General Public Survey and Opinion Leader Survey Samples, 2014
Characteristic General Public Survey, Weighted % Opinion Leader Survey, Weighted % Census, Kansas %a
Overweight or at risk for being overweighte
No 61.7 66.3NA
Yes 38.3 33.7
Abbreviation: NA, not available.a Using data from 2013 US Census: http://www.census.gov/popest/data/state/asrh/2013/SC-EST2013-ALLDATA5.html.b The difference in geographic distribution between General Public Survey and Opinion Leader Survey respondents is a result of the difference in study design; theGeneral Public Survey is an adult population study (and the largest proportion of Kansans live in urban areas), whereas the Opinion Leader Survey is based on lead-ers in counties (and our sample was designed to ensure equal representation of urban and rural counties).c Asian, Native Hawaiian or other Pacific Islander, American Indian or Alaska Native, and multiracial.d Conservative = answered “very conservative” or “somewhat conservative,” moderate = answered “moderate — neither conservative nor liberal,” and liberal =answered “somewhat liberal” or “very liberal” in response to “How would you describe your overall political philosophy?”e Answered yes to “Has a health care professional ever told you or someone in your household that you are overweight or at risk for being overweight?”
PREVENTING CHRONIC DISEASE VOLUME 15, E57
PUBLIC HEALTH RESEARCH, PRACTICE, AND POLICY MAY 2018
The opinions expressed by authors contributing to this journal do not necessarily reflect the opinions of the U.S. Department of Health and Human Services,
the Public Health Service, the Centers for Disease Control and Prevention, or the authors’ affiliated institutions.
10 Centers for Disease Control and Prevention • www.cdc.gov/pcd/issues/2018/17_0288.htm
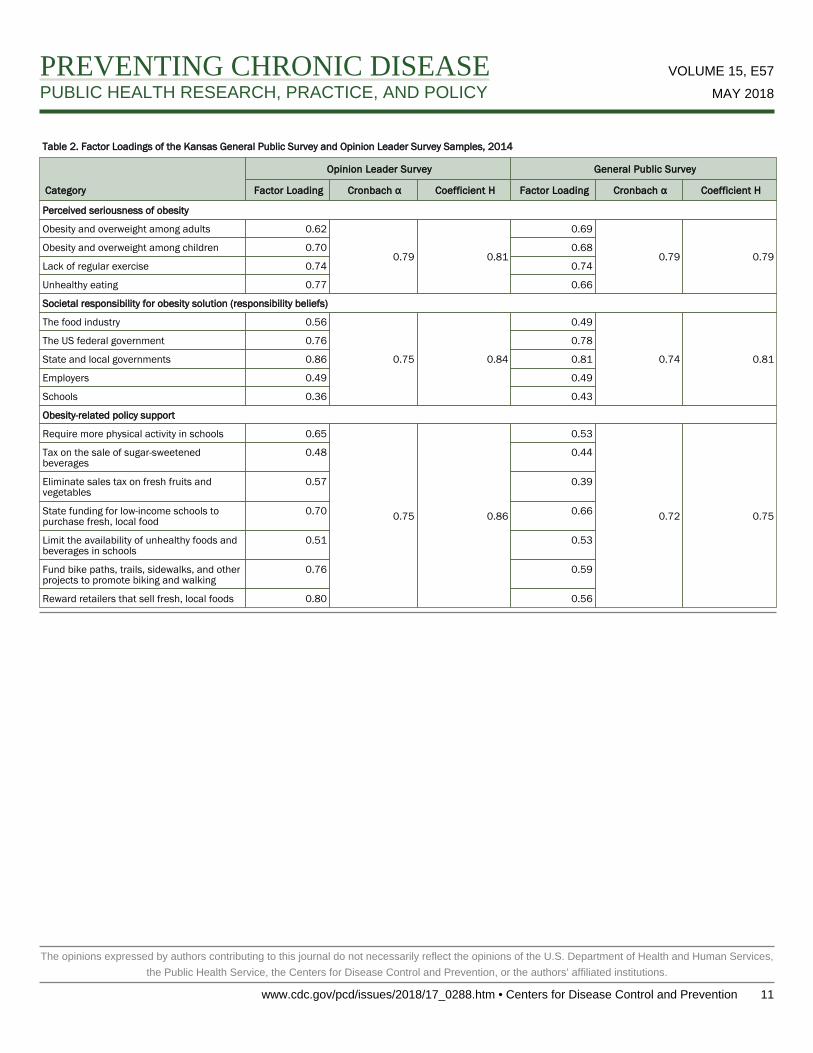
Table 2. Factor Loadings of the Kansas General Public Survey and Opinion Leader Survey Samples, 2014
Category
Opinion Leader Survey General Public Survey
Factor Loading Cronbach α Coefficient H Factor Loading Cronbach α Coefficient H
Perceived seriousness of obesity
Obesity and overweight among adults 0.62
0.79 0.81
0.69
0.79 0.79Obesity and overweight among children 0.70 0.68
Lack of regular exercise 0.74 0.74
Unhealthy eating 0.77 0.66
Societal responsibility for obesity solution (responsibility beliefs)
The food industry 0.56
0.75 0.84
0.49
0.74 0.81
The US federal government 0.76 0.78
State and local governments 0.86 0.81
Employers 0.49 0.49
Schools 0.36 0.43
Obesity-related policy support
Require more physical activity in schools 0.65
0.75 0.86
0.53
0.72 0.75
Tax on the sale of sugar-sweetenedbeverages
0.48 0.44
Eliminate sales tax on fresh fruits andvegetables
0.57 0.39
State funding for low-income schools topurchase fresh, local food
0.70 0.66
Limit the availability of unhealthy foods andbeverages in schools
0.51 0.53
Fund bike paths, trails, sidewalks, and otherprojects to promote biking and walking
0.76 0.59
Reward retailers that sell fresh, local foods 0.80 0.56
PREVENTING CHRONIC DISEASE VOLUME 15, E57
PUBLIC HEALTH RESEARCH, PRACTICE, AND POLICY MAY 2018
The opinions expressed by authors contributing to this journal do not necessarily reflect the opinions of the U.S. Department of Health and Human Services,
the Public Health Service, the Centers for Disease Control and Prevention, or the authors’ affiliated institutions.
www.cdc.gov/pcd/issues/2018/17_0288.htm • Centers for Disease Control and Prevention 11

Table 3. Standardized Direct, Indirect, and Total Effects of Variables in the Theory of Change, Kansas General Public Survey, 2014 (n = 2,203), 2014
Variable Perceived Seriousness of Obesity Causal Beliefs Responsibility Beliefs
Causal beliefs
Direct 0.18b
Indirect —
Total 0.18b
Responsibility beliefs
Direct — 0.43b
Indirect 0.08a —
Total 0.08a 0.43b
Policy support
Direct 0.08a 0.26b 0.27b
Indirect 0.07b 0.12b —
Total 0.14b 0.37b 0.27b
—, No significant path between the variables.a P < .01.b P < .001.
PREVENTING CHRONIC DISEASE VOLUME 15, E57
PUBLIC HEALTH RESEARCH, PRACTICE, AND POLICY MAY 2018
The opinions expressed by authors contributing to this journal do not necessarily reflect the opinions of the U.S. Department of Health and Human Services,
the Public Health Service, the Centers for Disease Control and Prevention, or the authors’ affiliated institutions.
12 Centers for Disease Control and Prevention • www.cdc.gov/pcd/issues/2018/17_0288.htm

Table 4. Standardized Direct, Indirect, and Total Effects of Variables in the Theory of Change, Kansas Opinion Leader Survey, 2014 (n = 912), 2014
Variable Perceived Seriousness of Obesity Causal Beliefs Responsibility Beliefs
Causal beliefs
Direct 0.35b
Indirect —
Total 0.35b
Responsibility beliefs
Direct — 0.47c
Indirect 0.18b —
Total 0.16b 0.47c
Policy support
Direct — 0.54c 0.22b
Indirect 0.27a 0.10a —
Total 0.23a 0.64c 0.22b
—, No significant path between the variables.a P < .05.b P < .001.c P < .01.
PREVENTING CHRONIC DISEASE VOLUME 15, E57
PUBLIC HEALTH RESEARCH, PRACTICE, AND POLICY MAY 2018
The opinions expressed by authors contributing to this journal do not necessarily reflect the opinions of the U.S. Department of Health and Human Services,
the Public Health Service, the Centers for Disease Control and Prevention, or the authors’ affiliated institutions.
www.cdc.gov/pcd/issues/2018/17_0288.htm • Centers for Disease Control and Prevention 13